Statistical Review of Quality Parameters of Blue-Green Infrastructure Elements Important in Mitigating the Effect of the Urban Heat Island in the Temperate Climate (C) Zone


Abstract
:1. Introduction
1.1. Urban Heat Island (UHI) Effect
1.2. Blue-Green Infrastructure (BGI)
2. Materials and Methods
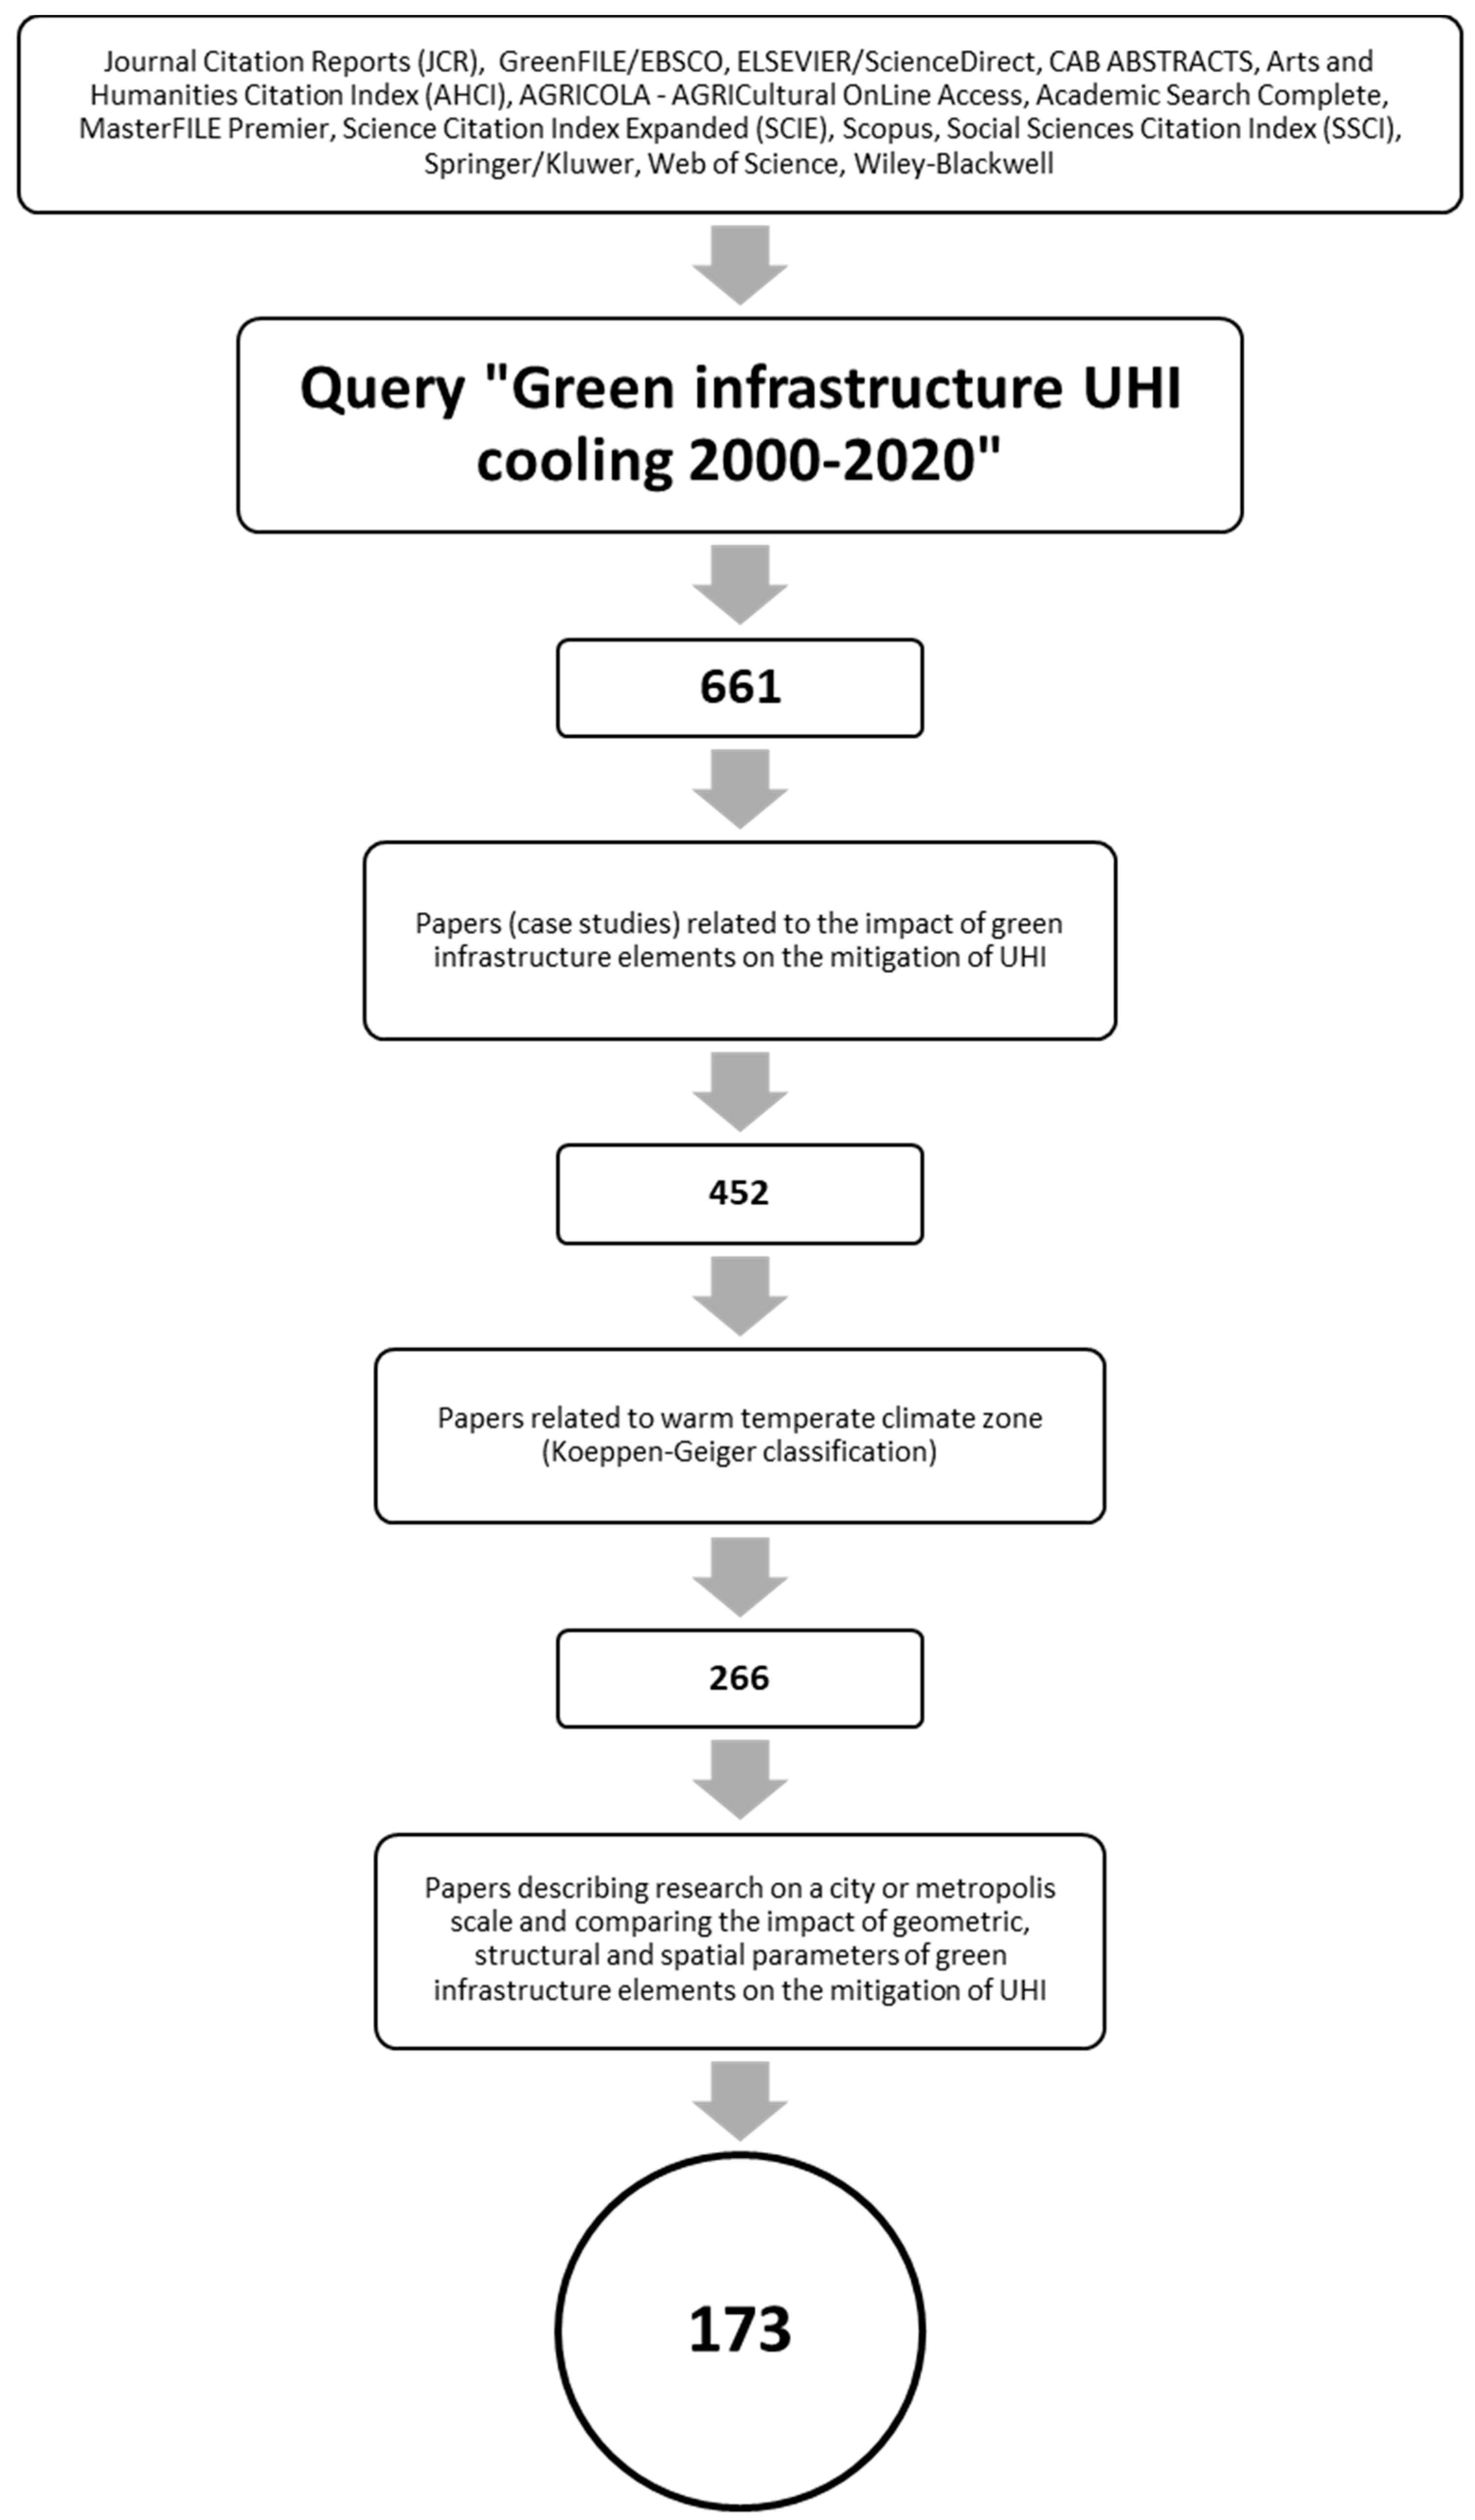
2.1. Selection Criteria for Papers
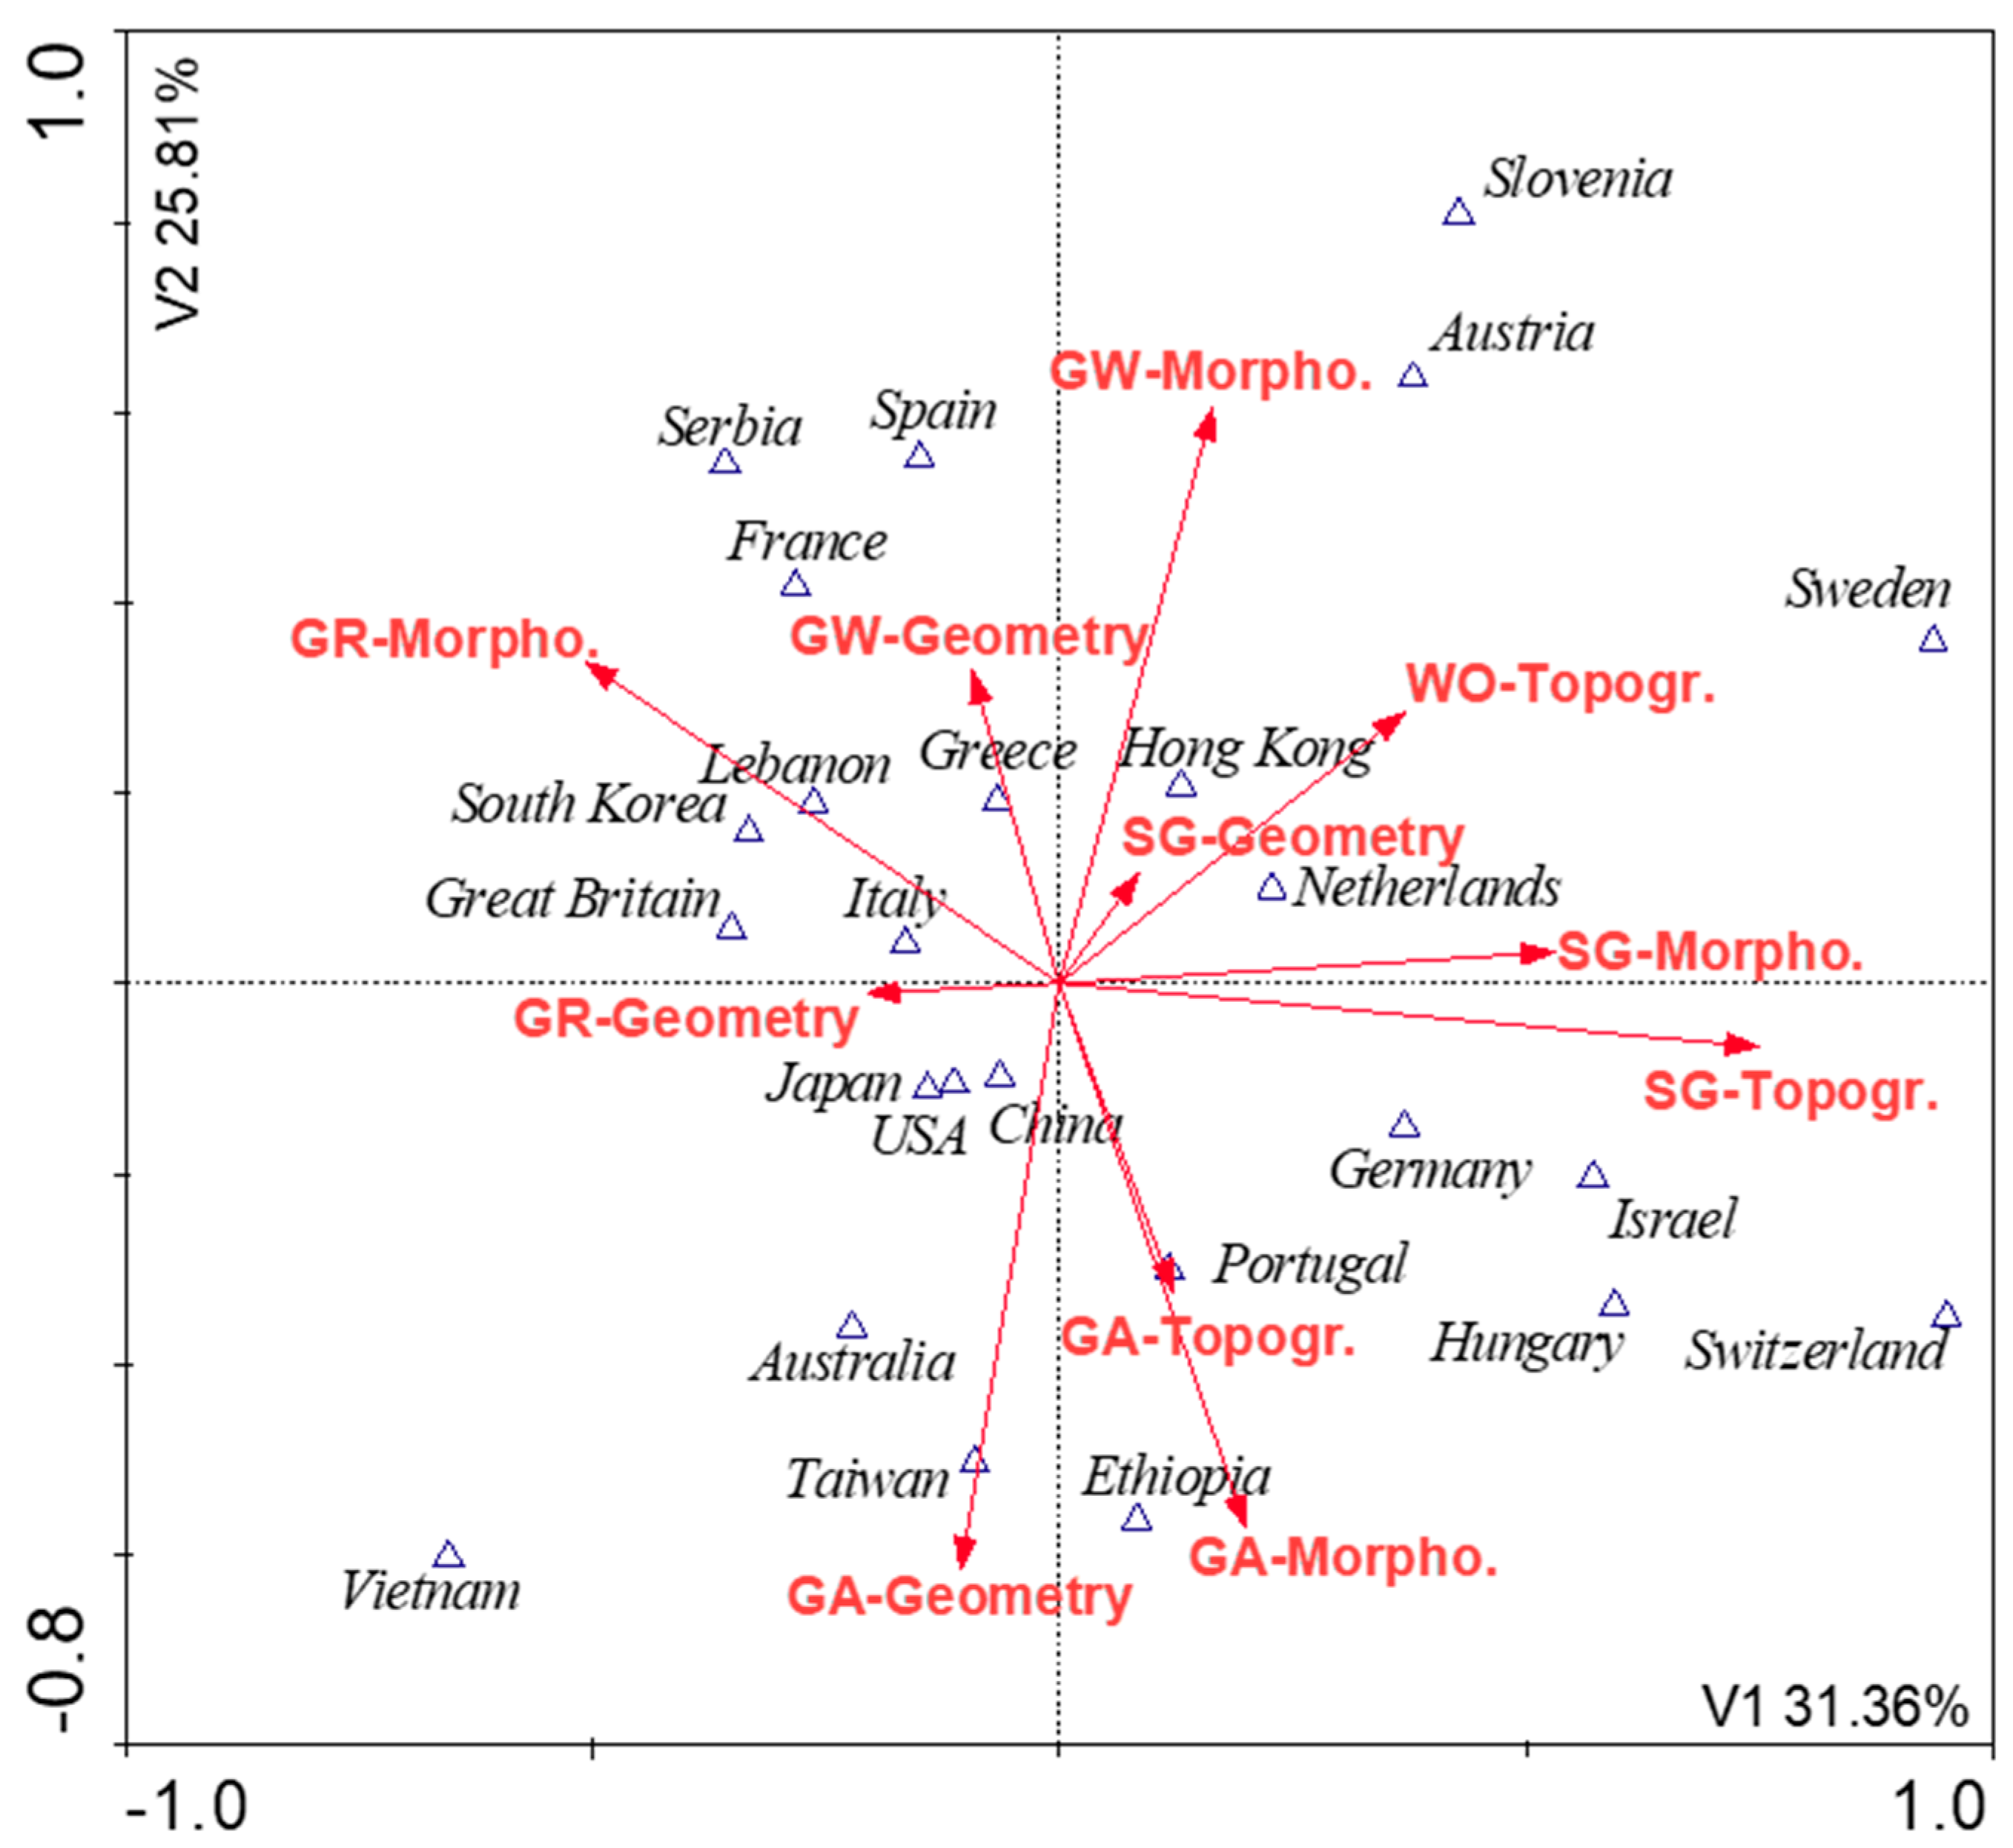
2.2. Statistical Analysis of the Results
- blue-green infrastructure elements: water structures, green areas, greenery along the streets, green roofs, and green walls;
- parameter family: geometrical and morphological parameters;
- country of origin of the publication.
3. Results and Discussion
3.1. Discussion and Recommendations for Urban Design Strategies
3.2. Water Structures
3.3. Green Areas
3.4. Greenery along the Streets
3.5. Green Roofs
3.6. Green Walls and Facades
4. Conclusions and Recommendations for Further Research
Author Contributions
Funding
Conflicts of Interest
Appendix A

| Element | Parameter Family | Parameter | Authors |
|---|---|---|---|
| Water structures | Geometrical parameters | Area | [77,129,131,134,135,139,161,222,223] |
| Shape | [77,135,138,139,143] | ||
| Depth | [135] | ||
| Morphological parameters | Degree of vegetation along the banks | [143,144] | |
| Degree of engineering shore protection (concrete) | [144] | ||
| Water mixing intensity | [135] | ||
| Topographic parameters | Distance from the element | [48,135,144,230] | |
| Total building environment (investment) | [144,165] | ||
| Sky visibility coefficient (SVF) | [144] | ||
| Building geometry in the neighborhood | [136,229] | ||
| The level of shading by objects in the vicinity | [144] | ||
| An albedo of materials in the neighborhood | [144,229] | ||
| Permeability of surrounding soil | [143] | ||
| Location relative to street layout | [48] | ||
| Wind exhibition (transfer direction of cold) | [135,136,165,228,229,230] | ||
| Connection to the main ventilation corridor | [228] | ||
| Wind speed over an element | [136] | ||
| Link with another BGI element (synergy)) | [77] | ||
| Distance from the nearest neighbor BGI element (synergy) | [227] | ||
| Distance from the neighboring water structure (synergy) | [133,135] | ||
| Presence of a forest in the immediate vicinity (synergy) | [227] | ||
| Trees foliage density near the object (synergy) | [227] | ||
| Urban green areas | Geometrical parameters | Area | [22,56,76,86,87,93,135,143,143,144,147,149,150,153,157,164,167,174,222,225,226,227,228,229,230,231,232,233,234,235,236,237] |
| Shape | [86,93,136,145,146,229,231,233,236,237,239] | ||
| Circuit | [147,234] | ||
| Diameter | [238] | ||
| Edge density | [56,241] | ||
| Height of dominant vegetation | [245] | ||
| Degree of area fragmentation | [171,233] | ||
| Morphological parameters | Vegetation coverage percentage | [76,90,145,147,154,155,156,226,230,239,240] | |
| Leeward vegetation coverage percentage | [168] | ||
| Type of dominant vegetation (trees, shrubs, lawn) | [90,147,150,152,155,156,157,158,228,231,247] | ||
| Vegetation structure/number of vegetation floors (1,2,3) | [150,160] | ||
| Dominant species | [148,232] | ||
| Plant/green area health status | [171,246] | ||
| Planting density/compactness of tree and bush crown cover | [159,160,242,248] | ||
| Trees coverage percentage | [76,87,93,139,147,154,168,234,241,243,245,249,250] | ||
| Trees planting scheme layout | [244] | ||
| Morphological characteristics of trees | [244] | ||
| Degree of shading by trees, foliage density/SVF | [154,178,244,251] | ||
| Leaf size/LAI | [160,178,242,248] | ||
| Type of trees (coniferous or deciduous) | [157,252] | ||
| Tree crown height | [158,178] | ||
| Tree crown width | [158,245,253] | ||
| Tree species | [178] | ||
| Tree leaf color | [178] | ||
| Leaf thickness | [178] | ||
| Leaf texture | [178] | ||
| Tree height | [160,193,245] | ||
| Location of trees inside the facility | [244] | ||
| Shrubs coverage percentage | [93,144,151,229,240,247] | ||
| Lawn coverage percentage | [87,139,147,234,241,242,243,245,250,252] | ||
| Soil coverage percentage | [234] | ||
| Water structures occurrence | [154,228,230,244,254] | ||
| Percentage of water structures coverage | [93,148,229,231,237,241] | ||
| Percentage of impervious surfaces coverage | [236] | ||
| Infrastructure coverage percentage | [76,147,152,242,243] | ||
| Path type/path albedo | [242] | ||
| Percentage of building coverage | [147,234] | ||
| Occurrence of an irrigation system | [158,161,223,225,227,239] | ||
| Size of irrigated area | [246] | ||
| Soil hydration/irrigation quality | [164,228,230,244,253] | ||
| Watering time | [164] | ||
| Surface albedo | [245] | ||
| Low albedo area | [234] | ||
| High albedo area | [234] | ||
| Topographic parameters | Distance to element | [165,241,249] | |
| Element location relative to city center | [232,243] | ||
| Distance to a city center | [93,232] | ||
| Degree of building environment | [245,251] | ||
| Surrounding density/building type | [90,93,154,243,255] | ||
| Geometry of elements in the immediate vicinity | [244,251] | ||
| Dimensions of an urban canyon in the immediate vicinity; building height to street width ratio/SVF | [87,152,245,256] | ||
| Height of buildings in the immediate vicinity | [90,245] | ||
| Streets orientation relative to directions of the world near an element | [157,251] | ||
| Element location relative to directions of the world | [251] | ||
| Exposure to solar radiation/degree of area shading by surrounding objects | [57,149,154,229,239,246] | ||
| Vegetation percentage near an element | [236] | ||
| Trees percentage in the immediate vicinity | [93] | ||
| Shrubs percentage in the immediate vicinity | [93] | ||
| Water structures percentage in the immediate vicinity | [236] | ||
| Impervious surfaces percentage in the immediate vicinity | [236] | ||
| Location relative to wind direction | [167,228,251] | ||
| Amount of wind reaching an object | [148,158,169] | ||
| Wind speed over an object | [233] | ||
| Leeward type of land cover in front of an object | [168] | ||
| Linking an object with a ventilation corridor | [228] | ||
| City coverage with similar facilities percentage (synergy) | [86,239] | ||
| Diversity of green areas in the area (synergy) | [239,241] | ||
| Density of green patches in a city (synergy) | [153] | ||
| Distance to nearest BGI neighbor (synergy) | [56,227] | ||
| Connection with another BGI element/isolation (synergy) | [171,251] | ||
| Area of the largest BGI element in the area (synergy) | [239] | ||
| Greenery along streets (point and line) | Geometrical parameters | Size (greenery patch, reservoir) | [188,244,257] |
| Crown shape | [258] | ||
| Tree height | [185,190,259,260,261,262] | ||
| Tree crown height/tree crown thickness | [183,244,263] | ||
| Tree crown width/tree crown diameter | [183,185,190,259,260,261,263,264] | ||
| Trunk height/trunk length | [183,185,260,261,262] | ||
| Morphological parameters | Type of vegetation (lawn, trees, bushes) | [265] | |
| Plant species | [180,262] | ||
| Tree species | [177,180,263,265,266] | ||
| Degree of tree maturity | [180] | ||
| Tree crown architecture | [177,244] | ||
| Tree planting scheme | [183] | ||
| Number of trees planted together/density of tree group | [257,265,267,268] | ||
| Presence of irrigation | [259] | ||
| Soil hydration level | [244,263,269] | ||
| Percentage of lawn coverage | [270] | ||
| Stomatal conductance | [177] | ||
| Leaf size/LAI | [174,177,179,180,187,243,255,256,257,260,266] | ||
| Degree of shading/SVF | [244,272] | ||
| Foliage density/crown density/LAD | [181,185,248,261] | ||
| Topographic parameters | Percent of urban canyon green cover | [190,269] | |
| Percent of urban canyon trees cover | [175,265,270,273] | ||
| Location of a tree in urban canyon | [177,180,244] | ||
| Building density | [190] | ||
| Urban canyon geometry | [175,244,262,265,274] | ||
| Urban canyon height/buildings height | [184,185,190,260,265] | ||
| Urban canyon width/street width | [175,183,185,244,260] | ||
| Urban canyon depth | [267] | ||
| Percentage of impervious surfaces in neighborhood | [180,263] | ||
| Street orientation | [187,260] | ||
| Shading of urban canyon | [183,185,268] | ||
| Positioning of objects relative to wind direction/wind exposure (trees, reservoirs) | [188,189,244] | ||
| Wind speed over an object | [262,265] | ||
| Surroundings albedo (walls, street, and roofs) | [260,265] | ||
| Distance between trees | [183] | ||
| Distance from the nearest BGI element of another type (synergy) | [227,244] | ||
| Distance from city center | [273] | ||
| Traffic | [265,269] | ||
| Green roofs | Geometrical parameters | Area | [206,275] |
| Substrate layer thickness | [199,203,276,277,278,279,280,281,282,283] | ||
| Water depth (hydroponics and swamp roof) | [284,285] | ||
| Plant height | [15,197,271,275,281,282] | ||
| Morphological parameters | Roof type (intensive/extensive) | [15,205,275,288] | |
| Presence of plants (hydroponics) | [284] | ||
| Percentage of vegetation coverage | [283,289,290] | ||
| Vegetation type (grass, covering, sedum, shrubs, marsh) | [195,275,276,277,278,285,289,290,291,292,293,294] | ||
| Species | [198,199,295,296,297] | ||
| Leaf size, leaf density/LAI | [15,123,195,196,197,200,201,272,274,275,281,285] | ||
| Plant density | [276,295] | ||
| Plant health status | [276] | ||
| Leaf type | [198] | ||
| Leaf smoothness | [200] | ||
| Degree of plant transpiration/stomatal resistance | [170,280] | ||
| Plant color/absorption of sunlight by plants | [123,200,293,298] | ||
| Percentage of tree coverage | [87] | ||
| Crown architecture (shrub, tree) | [198] | ||
| Percentage of grass coverage | [87] | ||
| Presence of an irrigation system | [199,299,300] | ||
| Type of irrigation system | [301] | ||
| Water quality (gray, rainy) | [195] | ||
| Degree of hydration/moisture of the substrate | [15,123,170,194,195,196,198,199,200,277,280,281,286,287,288,289,295,297,301,302,303,304,305,306] | ||
| Type of substrate | [278,294,304] | ||
| Substrate density | [280] | ||
| Substrate heat transfer coefficient | [123] | ||
| Substrate heat capacity | [123,280] | ||
| Ceiling thickness | [277] | ||
| Insulation thickness | [277] | ||
| Albedo (substrate, plant) | [123,296,298] | ||
| Topographic parameters | Height of an object above the ground | [198,307] | |
| Geometry of objects in the neighborhood | [308] | ||
| Sun exposure, shading by nearest objects | [123] | ||
| Wind speed over an object | [123] | ||
| Percentage of green roofs in the immediate vicinity | [309] | ||
| Distance from the nearest BGI element (synergy) | [227,305] | ||
| Green walls | Geometrical parameters | Vegetation coverage of a building/extent of a green wall | [211,212,217,218,221,254,305,306] |
| Substrate layer thickness | [214,312] | ||
| Vegetation layer thickness | [220,225] | ||
| Plant mass volume | [225,259] | ||
| Plant height | [218] | ||
| Morphological parameters | Vegetation type | [220] | |
| Plant species | [213] | ||
| Leaf width, leaf area, foliage density/LAI | [213,215,217,218,219,220,313] | ||
| Vegetation density, percentage of ground shading/SVF | [214,225] | ||
| Plant health status | [222] | ||
| Plant layer breathability | [312] | ||
| Presence of a ventilation gap | [213,223,224,311,312] | ||
| Size of a ventilation gap | [212] | ||
| Type of substrate | [312] | ||
| Substrate thermal conductivity | [217] | ||
| Wall insulation | [216] | ||
| Wall insulation thickness | [312] | ||
| Fertilization | [222] | ||
| Irrigation | [222,259,311] | ||
| Hydration rate | [214] | ||
| Watering uniformity | [222] | ||
| Topographic parameters | Orientation relative to parts of the world | [208,210,211,212,215,216,290,306,311] | |
| Distance to an object | [259] | ||
| Distance from the nearest BGI element (synergy) | [227] |
References
- Santamouris, M. Analyzing the heat island magnitude and characteristics in one hundred Asian and Australian cities and regions. Sci. Total Environ. 2015, 512–513, 582–598. [Google Scholar] [CrossRef] [PubMed]
- Santamouris, M. Innovating to zero the building sector in Europe: Minimising the energy consumption, eradication of the energy poverty and mitigating the local climate change. Sol. Energy 2016, 128, 61–94. [Google Scholar] [CrossRef]
- Taleb, D.; Abu-Hijleh, B. Urban heat islands: Potential effect of organic and structured urban configurations on temperature variations in Dubai, UAE. Renew. Energy 2013, 50, 747–762. [Google Scholar] [CrossRef]
- Shahrestani, M.; Yao, R.; Luo, Z.; Turkbeyler, E.; Davies, H. A field study of urban microclimates in London. Renew. Energy 2015, 73, 3–9. [Google Scholar] [CrossRef] [Green Version]
- Lontorfos, V.; Efthymiou, C.; Santamouris, M. On the time varying mitigation performance of reflective geoengineering technologies in cities. Renew. Energy 2018, 115, 926–930. [Google Scholar] [CrossRef]
- Aflaki, A.; Mirnezhad, M.; Ghaffarianhoseini, A.; Ghaffarianhoseini, A.; Omrany, H.; Wang, Z.-H.; Akbari, H. Urban heat island mitigation strategies: A state-of-the-art review on Kuala Lumpur, Singapore and Hong Kong. Cities 2017, 62, 131–145. [Google Scholar] [CrossRef] [Green Version]
- Akbari, H.; Cartalis, C.; Kolokotsa, D.; Muscio, A.; Pisello, A.L.; Rossi, F.; Santamouris, M.; Synnefa, A.; Wong, N.H.; Zinzi, M. Local climate change and urban heat island mitigation techniques—The state of the art. J. Civ. Eng. Manag. 2016, 22, 1–16. [Google Scholar] [CrossRef] [Green Version]
- Alchapar, N.L.; Correa, E.N. The use of reflective materials as a strategy for urban cooling in an arid “OASIS” city. Sustain. Cities Soc. 2016, 27, 1–14. [Google Scholar] [CrossRef]
- Barakat, A.; Ayad, H.; El-Sayed, Z. Urban design in favor of human thermal comfort for hot arid climate using advanced simulation methods. Alex. Eng. J. 2017, 56, 533–543. [Google Scholar] [CrossRef]
- Huang, Q.; Meng, X.; Yang, X.; Jin, L.; Liu, X.; Hu, W. The Ecological City: Considering Outdoor Thermal Environment. Energy Procedia 2016, 104, 177–182. [Google Scholar] [CrossRef]
- Jamei, E.; Rajagopalan, P.; Seyedmahmoudian, M.; Jamei, Y. Review on the impact of urban geometry and pedestrian level greening on outdoor thermal comfort. Renew. Sustain. Energy Rev. 2016, 54, 1002–1017. [Google Scholar] [CrossRef]
- Stone, B., Jr.; Vargo, J.; Liu, P.; Habeeb, D.; DeLucia, A.; Trail, M.; Hu, Y.; Russell, A. Avoided Heat-Related Mortality through Climate Adaptation Strategies in Three US Cities. PLoS ONE 2014, 9, e100852. [Google Scholar] [CrossRef] [PubMed] [Green Version]
- Leal Filho, W.; Echevarria Icaza, L.; Emanche, V.O.; Quasem Al-Amin, A. An Evidence-Based Review of Impacts, Strategies and Tools to Mitigate Urban Heat Islands. Int. J. Environ. Res. Public. Health 2017, 14, 1600. [Google Scholar] [CrossRef] [PubMed] [Green Version]
- Mirzaei, P.; Haghighat, F. Approaches to study Urban Heat Island—Abilities and limitations. Build. Environ. 2010, 45, 2192–2201. [Google Scholar] [CrossRef]
- Morakinyo, T.E.; Dahanayake, K.W.D.K.C.; Ng, E.; Chow, C.L. Temperature and cooling demand reduction by green-roof types in different climates and urban densities: A co-simulation parametric study. Energy Build. 2017, 145, 226–237. [Google Scholar] [CrossRef]
- Paramita, B.; Fukuda, H. Study on the Affect of Aspect Building Form and Layout Case Study: Honjo Nishi Danchi, Yahatanishi, Kitakyushu-Fukuoka. Procedia Environ. Sci. 2013, 17, 767–774. [Google Scholar] [CrossRef] [Green Version]
- Phelan, P.E.; Kaloush, K.; Miner, M.; Golden, J.; Phelan, B.; Silva, H.; Taylor, R.A. Urban Heat Island: Mechanisms, Implications, and Possible Remedies. Annu. Rev. Environ. Resour. 2015, 40, 285–307. [Google Scholar] [CrossRef]
- Salata, F.; Golasi, I.; de Lieto Vollaro, R.; de Lieto Vollaro, A. Urban microclimate and outdoor thermal comfort. A proper procedure to fit ENVI-met simulation outputs to experimental data. Sustain. Cities Soc. 2016, 26, 318–343. [Google Scholar] [CrossRef]
- Taleghani, M.; Sailor, D.J.; Tenpierik, M.; van den Dobbelsteen, A. Thermal assessment of heat mitigation strategies: The case of Portland State University, Oregon, USA. Build. Environ. 2014, 73, 138–150. [Google Scholar] [CrossRef] [Green Version]
- Tsilini, V.; Papantoniou, S.; Kolokotsa, D.-D.; Maria, E.-A. Urban gardens as a solution to energy poverty and urban heat island. Sustain. Cities Soc. 2015, 14, 323–333. [Google Scholar] [CrossRef]
- Yin, S.; Xiao, Y. Scale Study of Traditional Shophouse Street in South of China Based on Outdoor Thermal Comfort. Procedia Eng. 2016, 169, 232–239. [Google Scholar] [CrossRef]
- Lehmann, S. Low carbon districts: Mitigating the urban heat island with green roof infrastructure. City Cult. Soc. 2014, 5, 1–8. [Google Scholar] [CrossRef]
- Lin, B.B.; Meyers, J.; Beaty, M.R.; Barnett, B.G. Urban Green Infrastructure Impacts on Climate Regulation Services in Sydney, Australia. Sustainability 2016, 8, 788. [Google Scholar] [CrossRef] [Green Version]
- Livesley, S.J.; McPherson, E.G.; Calfapietra, C. The Urban Forest and Ecosystem Services: Impacts on Urban Water, Heat, and Pollution Cycles at the Tree, Street, and City Scale. J. Environ. Qual. 2016, 45, 119–124. [Google Scholar] [CrossRef] [PubMed]
- Norton, B.A.; Coutts, A.M.; Livesley, S.J.; Harris, R.J.; Hunter, A.M.; Williams, N.S.G. Planning for cooler cities: A framework to prioritise green infrastructure to mitigate high temperatures in urban landscapes. Landsc. Urban Plan. 2015, 134, 127–138. [Google Scholar] [CrossRef]
- Argüesoa, D.; Evansa, J.; Fitaa, L.; Bormannab, K. Simulated impact of urban expansion on future temperature heatwaves in Sydney. In Proceedings of the 20th International Congress on Modelling and Simulation (MODSIM2013), Adelaide, Australia, 1–6 December 2013. [Google Scholar]
- Oke, T.R. The energetic basis of the urban heat island. Q. J. R. Meteorol. Soc. 1982, 108, 1–24. [Google Scholar] [CrossRef]
- Oke, T.R.; Maxwell, G.B. Urban heat island dynamics in Montreal and Vancouver. Atmos. Environ. 1967 1975, 9, 191–200. [Google Scholar] [CrossRef]
- Oke, T.R.; Johnson, G.T.; Steyn, D.G.; Watson, I.D. Simulation of surface urban heat islands under “ideal” conditions at night part 2: Diagnosis of causation. Bound. Layer Meteorol. 1991, 56, 339–358. [Google Scholar] [CrossRef]
- Parsaee, M.; Joybari, M.M.; Mirzaei, P.A.; Haghighat, F. Urban heat island, urban climate maps and urban development policies and action plans. Environ. Technol. Innov. 2019, 14, 100341. [Google Scholar] [CrossRef]
- Sachindra, D.A.; Ng, A.W.M.; Muthukumaran, S.; Perera, B.J.C. Impact of climate change on urban heat island effect and extreme temperatures: A case-study. Q. J. R. Meteorol. Soc. 2016, 142, 172–186. [Google Scholar] [CrossRef]
- Sharifi, E.; Sivam, A.; Boland, J. Resilience to heat in public space: A case study of Adelaide, South Australia. J. Environ. Plan. Manag. 2016, 59, 1833–1854. [Google Scholar] [CrossRef]
- Zhao, L.; Lee, X.; Smith, R.B.; Oleson, K. Strong contributions of local background climate to urban heat islands. Nature 2014, 511, 216–219. [Google Scholar] [CrossRef]
- Levermore, G.; Parkinson, J.; Lee, K.; Laycock, P.; Lindley, S. The increasing trend of the urban heat island intensity. Urban Clim. 2018, 24, 360–368. [Google Scholar] [CrossRef]
- World Development Indicators (WDI)|Data Catalog. Available online: https://datacatalog.worldbank.org/dataset/world-development-indicators (accessed on 17 March 2020).
- Wong, K.V.; Paddon, A.; Jimenez, A. Review of World Urban Heat Islands: Many Linked to Increased Mortality. J. Energy Resour. Technol. 2013, 135, 022101. [Google Scholar] [CrossRef]
- Rizwan, A.M.; Dennis, L.Y.C.; Liu, C. A review on the generation, determination and mitigation of Urban Heat Island. J. Environ. Sci. 2008, 20, 120–128. [Google Scholar] [CrossRef]
- Santamouris, M. Cooling the cities—A review of reflective and green roof mitigation technologies to fight heat island and improve comfort in urban environments. Sol. Energy 2014, 103, 682–703. [Google Scholar] [CrossRef]
- Rajagopalan, P.; Lim, K.C.; Jamei, E. Urban heat island and wind flow characteristics of a tropical city. Sol. Energy 2014, 107, 159–170. [Google Scholar] [CrossRef]
- Lauwaet, D.; De Ridder, K.; Saeed, S.; Brisson, E.; Chatterjee, F.; van Lipzig, N.P.M.; Maiheu, B.; Hooyberghs, H. Assessing the current and future urban heat island of Brussels. Urban Clim. 2016, 15, 1–15. [Google Scholar] [CrossRef] [Green Version]
- Argüeso, D.; Evans, J.P.; Fita, L.; Bormann, K.J. Temperature response to future urbanization and climate change. Clim. Dyn. 2014, 42, 2183–2199. [Google Scholar] [CrossRef]
- Bonamente, E.; Rossi, F.; Coccia, V.; Pisello, A.L.; Nicolini, A.; Castellani, B.; Cotana, F.; Filipponi, M.; Morini, E.; Santamouris, M. An energy-balanced analytic model for urban heat canyons: Comparison with experimental data. Adv. Build. Energy Res. 2013, 7, 222–234. [Google Scholar] [CrossRef]
- Deilami, K.; Kamruzzaman, M.; Liu, Y. Urban heat island effect: A systematic review of spatio-temporal factors, data, methods, and mitigation measures. Int. J. Appl. Earth Obs. Geoinf. 2018, 67, 30–42. [Google Scholar] [CrossRef]
- Gago, E.J.; Roldan, J.; Pacheco-Torres, R.; Ordóñez, J. The city and urban heat islands: A review of strategies to mitigate adverse effects. Renew. Sustain. Energy Rev. 2013, 25, 749–758. [Google Scholar] [CrossRef]
- Harlan, S.L.; Ruddell, D.M. Climate change and health in cities: Impacts of heat and air pollution and potential co-benefits from mitigation and adaptation. Curr. Opin. Environ. Sustain. 2011, 3, 126–134. [Google Scholar] [CrossRef]
- Hsieh, C.-M.; Huang, H.-C. Mitigating urban heat islands: A method to identify potential wind corridor for cooling and ventilation. Comput. Environ. Urban Syst. 2016, 57, 130–143. [Google Scholar] [CrossRef]
- Iping, A.; Kidston-Lattari, J.; Simpson-Young, A.; Duncan, E.; McManus, P. (Re)presenting urban heat islands in Australian cities: A study of media reporting and implications for urban heat and climate change debates. Urban Clim. 2019, 27, 420–429. [Google Scholar] [CrossRef]
- Kleerekoper, L.; van Esch, M.; Salcedo, T.B. How to make a city climate-proof, addressing the urban heat island effect. Resour. Conserv. Recycl. 2012, 64, 30–38. [Google Scholar] [CrossRef]
- Lee, S.-H.; Baik, J.-J. Statistical and dynamical characteristics of the urban heat island intensity in Seoul. Theor. Appl. Climatol. 2010, 100, 227–237. [Google Scholar] [CrossRef]
- Li, X.; Zhou, W.; Ouyang, Z. Relationship between land surface temperature and spatial pattern of greenspace: What are the effects of spatial resolution? Landsc. Urban Plan. 2013, 114, 1–8. [Google Scholar] [CrossRef]
- Luo, Z.; Asproudi, C. Subsurface urban heat island and its effects on horizontal ground-source heat pump potential under climate change. Appl. Therm. Eng. 2015, 90, 530–537. [Google Scholar] [CrossRef]
- Magli, S.; Lodi, C.; Contini, F.M.; Muscio, A.; Tartarini, P. Dynamic analysis of the heat released by tertiary buildings and the effects of urban heat island mitigation strategies. Energy Build. 2016, 114, 164–172. [Google Scholar] [CrossRef]
- Razzaghmanesh, M.; Beecham, S.; Salemi, T. The role of green roofs in mitigating Urban Heat Island effects in the metropolitan area of Adelaide, South Australia. Urban For. Urban Green. 2016, 15, 89–102. [Google Scholar] [CrossRef]
- Santamouris, M.; Synnefa, A.; Karlessi, T. Using advanced cool materials in the urban built environment to mitigate heat islands and improve thermal comfort conditions. Sol. Energy 2011, 85, 3085–3102. [Google Scholar] [CrossRef]
- Wang, Y.; Akbari, H. Analysis of urban heat island phenomenon and mitigation solutions evaluation for Montreal. Sustain. Cities Soc. 2016, 26, 438–446. [Google Scholar] [CrossRef]
- Zhou, W.; Huang, G.; Cadenasso, M.L. Does spatial configuration matter? Understanding the effects of land cover pattern on land surface temperature in urban landscapes. Landsc. Urban Plan. 2011, 102, 54–63. [Google Scholar] [CrossRef]
- O’Malley, C.; Piroozfar, P.; Farr, E.R.P.; Pomponi, F. Urban Heat Island (UHI) mitigating strategies: A case-based comparative analysis. Sustain. Cities Soc. 2015, 19, 222–235. [Google Scholar] [CrossRef] [Green Version]
- Lee, D.O. Urban—Rural humidity differences in London. Int. J. Climatol. 1991, 11, 577–582. [Google Scholar] [CrossRef]
- Mikami, T. The heat island phenomenon and rain storms in urban areas. Gesuido Kyokai Shi 2005, 42, 512–519. [Google Scholar]
- Sailor, D.J.; Fan, H. Modeling the diurnal variability of effective albedo for cities. Atmos. Environ. 2002, 36, 713–725. [Google Scholar] [CrossRef]
- Santamouris, M. Regulating the damaged thermostat of the cities—Status, impacts and mitigation challenges. Energy Build. 2015, 91, 43–56. [Google Scholar] [CrossRef]
- Sarrat, C.; Lemonsu, A.; Masson, V.; Guedalia, D. Impact of urban heat island on regional atmospheric pollution. Atmos. Environ. 2006, 40, 1743–1758. [Google Scholar] [CrossRef]
- Gabriel, K.M.A.; Endlicher, W.R. Urban and rural mortality rates during heat waves in Berlin and Brandenburg, Germany. Environ. Pollut. 2011, 159, 2044–2050. [Google Scholar] [CrossRef] [PubMed]
- Rydin, Y.; Bleahu, A.; Davies, M.; Dávila, J.D.; Friel, S.; De Grandis, G.; Groce, N.; Hallal, P.C.; Hamilton, I.; Howden-Chapman, P.; et al. Shaping cities for health: Complexity and the planning of urban environments in the 21st century. Lancet 2012, 379, 2079–2108. [Google Scholar] [CrossRef] [Green Version]
- Kolokotroni, M.; Ren, X.; Davies, M.; Mavrogianni, A. London’s urban heat island: Impact on current and future energy consumption in office buildings. Energy Build. 2012, 47, 302–311. [Google Scholar] [CrossRef] [Green Version]
- Santamouris, M. Cooling the buildings–past, present and future. Energy Build. 2016, 128, 617–638. [Google Scholar] [CrossRef]
- Ghofrani, F.Z.; Sposito, R.; Victor, A. Infrastructure for development: Blue-green infrastructure. Plan. News 2016, 42, 14–15. [Google Scholar]
- Benedict, M.; McMahon, E.; Fund, T.; Bergen, L. Green Infrastructure: Linking Landscapes and Communities. Bibliovault OAI Repos. Univ. Chic. Press 2006, 22, 797–798. [Google Scholar]
- Santamouris, M.; Sfakianaki, A.; Pavlou, K. On the efficiency of night ventilation techniques applied to residential buildings. Energy Build. 2010, 42, 1309–1313. [Google Scholar] [CrossRef]
- Menon, S.; Akbari, H.; Mahanama, S.; Sednev, I.; Levinson, R. Radiative forcing and temperature response to changes in urban albedos and associated CO2offsets. Environ. Res. Lett. 2010, 5, 014005. [Google Scholar] [CrossRef]
- Shou, Y.; Zhang, D.-L. Recent advances in understanding urban heat island effects with some future prospects. Acta Meteorol. Sin. 2012, 70, 338–353. [Google Scholar]
- Xiao, J.Y.; Ji, N.; Li, X.; Yu, L.X.; Ji, F. Cooling effect of city parks—A case of Shijiazhuang. J. Arid. Landsc. Res. Environ. 2015, 29, 75–79. [Google Scholar] [CrossRef]
- Lee, A.C.K.; Maheswaran, R. The health benefits of urban green spaces: A review of the evidence. J. Public Health 2011, 33, 212–222. [Google Scholar] [CrossRef] [PubMed]
- Azmy, M.M.; Hosaka, T.; Numata, S. Responses of four hornet species to levels of urban greenness in Nagoya city, Japan: Implications for ecosystem disservices of urban green spaces. Urban For. Urban Green. 2016, 18, 117–125. [Google Scholar] [CrossRef]
- Chang, C.-R.; Li, M.-H.; Chang, S.-D. A preliminary study on the local cool-island intensity of Taipei city parks. Landsc. Urban Plan. 2007, 80, 386–395. [Google Scholar] [CrossRef]
- Xiaoyun, C.; Bensheng, W.; Guojian, C.; Junxiang, L.; Conghe, S. Influence of Park Size and Its Surrounding Urban Landscape Patterns on the Park Cooling Effect. J. Urban Plan. Dev. 2015, 141, A4014002. [Google Scholar] [CrossRef]
- Erell, E.; Pearlmutter, D.; Williamson, T. Urban Microclimate: Designing the Spaces between Buildings; Routledge: Abingdon, UK, 2012; ISBN 1-84977-539-7. [Google Scholar]
- Gao, J.X.; Song, T.; Zhang, B.; Han, Y.W.; Gao, X.T.; Feng, C.Y. The relationship between urban green space community structure and air temperature reduction and humidity increase in Beijing. Resour. Sci. 2016, 38, 1028–1038. [Google Scholar]
- Jia, B.Q.; Qiu, K.B. The cooling effect of plain afforestation in the Beijing project and its remote sensing-based valuation. Shengtai Xuebao Acta Ecol. Sin. 2017, 37, 726–735. [Google Scholar] [CrossRef] [Green Version]
- Völker, S.; Baumeister, H.; Claßen, T.; Hornberg, C.; Kistemann, T. Evidence for the temperature-mitigating capacity of urban blue space—A health geographic perspective. Erdkunde 2013, 67, 355–371. [Google Scholar] [CrossRef]
- Bowler, D.E.; Buyung-Ali, L.; Knight, T.M.; Pullin, A.S. Urban greening to cool towns and cities: A systematic review of the empirical evidence. Landsc. Urban Plan. 2010, 97, 147–155. [Google Scholar] [CrossRef]
- Chen, X.; Li, L.; Wang, J. Heat island effect mitigation by urban green space system: A case study of Taizhou city. Ecol. Environ. Sci. 2015, 24, 643–649. [Google Scholar]
- Yan, H.-Y.; Vorontsov, V.A.; Dye, D. Alloying effects in polycrystalline γ′ strengthened Co–Al–W base alloys. Intermetallics 2014, 48, 44–53. [Google Scholar] [CrossRef] [Green Version]
- Dreiseit, H. Blue-green social place-making: Infrastructures for sustainable cities. J. Urban Regen. Renew. 2015, 8, 161–170. [Google Scholar]
- Kong, F.; Yin, H.; Wang, C.; Cavan, G.; James, P. A satellite image-based analysis of factors contributing to the green-space cool island intensity on a city scale. Urban For. Urban Green. 2014, 13, 846–853. [Google Scholar] [CrossRef] [Green Version]
- Ng, E.; Chen, L.; Wang, Y.; Yuan, C. A study on the cooling effects of greening in a high-density city: An experience from Hong Kong. Build. Environ. 2012, 47, 256–271. [Google Scholar] [CrossRef]
- Bonan, G.B. Effects of land use on the climate of the United States. Clim. Chang. 1997, 37, 449–486. [Google Scholar] [CrossRef]
- Santamouris, M. Using cool pavements as a mitigation strategy to fight urban heat island—A review of the actual developments. Renew. Sustain. Energy Rev. 2013, 26, 224–240. [Google Scholar] [CrossRef]
- Perini, K.; Magliocco, A. Effects of vegetation, urban density, building height, and atmospheric conditions on local temperatures and thermal comfort. Urban For. Urban Green. 2014, 13, 495–506. [Google Scholar] [CrossRef]
- Liang, B.P.; Ma, Y.F.; Li, H. Study on cooling effect of typical garden green space and water body in guilin city. Ecol Env. Sci 2015, 24, 278–285. [Google Scholar]
- Zhou, L.; Shi, W.; Xue, W.; Wang, T.; Ge, Z.; Zhou, H.; Zhong, Y. Relationship between vegetation structure and the temperature and moisture in urban green spaces of Shanghai. Chin. J. Ecol. 2005, 24, 1102–1105. [Google Scholar]
- Jaganmohan, M.; Knapp, S.; Buchmann, C.M.; Schwarz, N. The Bigger, the Better? The Influence of Urban Green Space Design on Cooling Effects for Residential Areas. J. Environ. Qual. 2016, 45, 134–145. [Google Scholar] [CrossRef]
- Feng, X.; Shi, H. Research on the cooling effect of Xi’an parks in summer based on remote sensing. Shengtai Xuebao Acta Ecol. Sin. 2012, 32, 7355–7363. [Google Scholar] [CrossRef] [Green Version]
- Choi, H.-A.; Lee, W.-K.; Byun, W.-H. Determining the effect of green spaces on Urban heat distribution using satellite imagery. Asian J. Atmos. Environ. 2012, 6, 127–135. [Google Scholar] [CrossRef]
- Liu, F.-F.; Yan, W.-J.; Kong, F.-H.; Yin, H.-W.; Ban, Y.-L.; Xu, W.-B. A review on the urban green space cooling effect based on field measurement of air temperature. Chin. J. Appl. Ecol. 2017, 28, 1387–1396. [Google Scholar] [CrossRef]
- Zhang, B.; Gao, J.; Xie, G.; Wang, Y. Preliminary evaluation of air temperature reduction of urban green spaces in beijing. Shengtai Xuebao Acta Ecol. Sin. 2012, 32, 7698–7705. [Google Scholar] [CrossRef] [Green Version]
- Yu, Z.; Yang, G.; Zuo, S.; Jørgensen, G.; Koga, M.; Vejre, H. Critical review on the cooling effect of urban blue-green space: A threshold-size perspective. Urban For. Urban Green. 2020, 49, 126630. [Google Scholar] [CrossRef]
- Susca, T. Green roofs to reduce building energy use? A review on key structural factors of green roofs and their effects on urban climate. Build. Environ. 2019, 162, 106273. [Google Scholar] [CrossRef]
- Lai, D.; Liu, W.; Gan, T.; Liu, K.; Chen, Q. A review of mitigating strategies to improve the thermal environment and thermal comfort in urban outdoor spaces. Sci. Total Environ. 2019, 661, 337–353. [Google Scholar] [CrossRef]
- Aram, F.; Higueras García, E.; Solgi, E.; Mansournia, S. Urban green space cooling effect in cities. Heliyon 2019, 5, e01339. [Google Scholar] [CrossRef] [Green Version]
- Cascone, S.; Coma, J.; Gagliano, A.; Pérez, G. The evapotranspiration process in green roofs: A review. Build. Environ. 2019, 147, 337–355. [Google Scholar] [CrossRef]
- Jamei, E.; Tapper, N. WSUD and Urban Heat Island Effect Mitigation. In Approaches to Water Sensitive Urban Design; Elsevier: Amsterdam, The Netherland, 2019; pp. 381–407. ISBN 978-0-12-812843-5. [Google Scholar]
- Taleghani, M. Outdoor thermal comfort by different heat mitigation strategies—A review. Renew. Sustain. Energy Rev. 2018, 81, 2011–2018. [Google Scholar] [CrossRef]
- Besir, A.B.; Cuce, E. Green roofs and facades: A comprehensive review. Renew. Sustain. Energy Rev. 2018, 82, 915–939. [Google Scholar] [CrossRef]
- Giridharan, R.; Emmanuel, R. The impact of urban compactness, comfort strategies and energy consumption on tropical urban heat island intensity: A review. Sustain. Cities Soc. 2018, 40, 677–687. [Google Scholar] [CrossRef] [Green Version]
- Bustami, R.A.; Belusko, M.; Ward, J.; Beecham, S. Vertical greenery systems: A systematic review of research trends. Build. Environ. 2018, 146, 226–237. [Google Scholar] [CrossRef]
- Bartesaghi Koc, C.; Osmond, P.; Peters, A. Evaluating the cooling effects of green infrastructure: A systematic review of methods, indicators and data sources. Sol. Energy 2018, 166, 486–508. [Google Scholar] [CrossRef]
- Santamouris, M.; Ban-Weiss, G.; Osmond, P.; Paolini, R.; Synnefa, A.; Cartalis, C.; Muscio, A.; Zinzi, M.; Morakinyo, T.E.; Ng, E.; et al. Progress in urban greenery mitigation science—Assessment methodologies advanced technologies and impact on cities. J. Civ. Eng. Manag. 2018, 24, 638–671. [Google Scholar] [CrossRef] [Green Version]
- Santos Nouri, A.; Costa, J.P.; Santamouris, M.; Matzarakis, A. Approaches to Outdoor Thermal Comfort Thresholds through Public Space Design: A Review. Atmosphere 2018, 9, 108. [Google Scholar] [CrossRef] [Green Version]
- Bernard, J.; Rodler, A.; Morille, B.; Zhang, X. How to Design a Park and Its Surrounding Urban Morphology to Optimize the Spreading of Cool Air? Climate 2018, 6, 10. [Google Scholar] [CrossRef] [Green Version]
- Medl, A.; Stangl, R.; Florineth, F. Vertical greening systems—A review on recent technologies and research advancement. Build. Environ. 2017, 125, 227–239. [Google Scholar] [CrossRef]
- Aleksandrowicz, O.; Vuckovic, M.; Kiesel, K.; Mahdavi, A. Current trends in urban heat island mitigation research: Observations based on a comprehensive research repository. Urban Clim. 2017, 21, 1–26. [Google Scholar] [CrossRef]
- Ascione, F. Energy conservation and renewable technologies for buildings to face the impact of the climate change and minimize the use of cooling. Sol. Energy 2017, 154, 34–100. [Google Scholar] [CrossRef]
- Venhari, A.A.; Tenpierik, M.; Hakak, A.M. Heat mitigation by greening the cities, a review study. Environ. Earth Ecol. 2017, 1, 5–32. [Google Scholar] [CrossRef]
- Pitman, S.D.; Daniels, C.B.; Ely, M.E. Green infrastructure as life support: Urban nature and climate change. Trans. R. Soc. S. Aust. 2015, 139, 97–112. [Google Scholar] [CrossRef]
- Teskey, R.; Wertin, T.; Bauweraerts, I.; Ameye, M.; Mcguire, M.A.; Steppe, K. Responses of tree species to heat waves and extreme heat events. Plant Cell Environ. 2015, 38, 1699–1712. [Google Scholar] [CrossRef]
- Pérez, G.; Coma, J.; Martorell, I.; Cabeza, L.F. Vertical Greenery Systems (VGS) for energy saving in buildings: A review. Renew. Sustain. Energy Rev. 2014, 39, 139–165. [Google Scholar] [CrossRef] [Green Version]
- Hunter, A.M.; Williams, N.S.G.; Rayner, J.P.; Aye, L.; Hes, D.; Livesley, S.J. Quantifying the thermal performance of green façades: A critical review. Ecol. Eng. 2014, 63, 102–113. [Google Scholar] [CrossRef]
- Qiu, G.; Li, H.; Zhang, Q.; Chen, W.; Liang, X.; Li, X. Effects of Evapotranspiration on Mitigation of Urban Temperature by Vegetation and Urban Agriculture. J. Integr. Agric. 2013, 12, 1307–1315. [Google Scholar] [CrossRef]
- Chen, C.-F. Performance evaluation and development strategies for green roofs in Taiwan: A review. Ecol. Eng. 2013, 52, 51–58. [Google Scholar] [CrossRef]
- Grimmond, C.S.B.; Blackett, M.; Best, M.J.; Barlow, J.; Baik, J.-J.; Belcher, S.E.; Bohnenstengel, S.I.; Calmet, I.; Chen, F.; Dandou, A.; et al. The International Urban Energy Balance Models Comparison Project: First Results from Phase 1. J. Appl. Meteorol. Climatol. 2010, 49, 1268–1292. [Google Scholar] [CrossRef]
- Kolokotsa, D.; Santamouris, M.; Zerefos, S.C. Green and cool roofs’ urban heat island mitigation potential in European climates for office buildings under free floating conditions. Sol. Energy 2013, 95, 118–130. [Google Scholar] [CrossRef]
- VISAT (Urban TEP). Available online: https://urban-tep.eu/puma/tool/?id=567873922 (accessed on 16 July 2020).
- Manoli, G.; Fatichi, S.; Schläpfer, M.; Yu, K.; Crowther, T.W.; Meili, N.; Burlando, P.; Katul, G.G.; Bou-Zeid, E. Magnitude of urban heat islands largely explained by climate and population. Nature 2019, 573, 55–60. [Google Scholar] [CrossRef]
- Pullin, A.S.; Stewart, G.B. Guidelines for Systematic Review in Conservation and Environmental Management. Conserv. Biol. 2006, 20, 1647–1656. [Google Scholar] [CrossRef]
- Stewart, I.D. A systematic review and scientific critique of methodology in modern urban heat island literature. Int. J. Climatol. 2011, 31, 200–217. [Google Scholar] [CrossRef]
- Liberalesso, T.; Oliveira Cruz, C.; Matos Silva, C.; Manso, M. Green infrastructure and public policies: An international review of green roofs and green walls incentives. Land Use Policy 2020, 96, 104693. [Google Scholar] [CrossRef]
- Davies, C.; Lafortezza, R. Corrigendum to “Urban green infrastructure in europe: Is greenspace planning and policy compliant?” [Land Use Policy 69 (December) (2017) 93–101]. Land Use Policy 2018, 71, 612. [Google Scholar] [CrossRef]
- Greening Master Plan. Available online: https://www.cedd.gov.hk/eng/topics-in-focus/greening/index.html (accessed on 13 September 2020).
- Han, H.-L.; Jing, Y.-X.; Yang, D.-J.; Xiao, L.; Li, G.-L.; Zhan, C.-G.; Wang, A.-L.; Sun, R.-Y. Microclimate regulation and airborne bacteria purification services of reservoir ecosystem: A case study of Meilin Reservoir and Xili Reservoir in Shenzhen. Shengtai Xuebao Acta Ecol. Sin. 2008, 28, 3553–3562. [Google Scholar]
- Jin, H.; Cheng, H.; Zhai, H. Calculating method of minimum load-shedding cost in transmission network planning. Proc. Electr. Power Syst. Autom. 2005, 17, 5–9. [Google Scholar]
- Gunawardena, K.R.; Wells, M.J.; Kershaw, T. Utilising green and bluespace to mitigate urban heat island intensity. Sci. Total Environ. 2017, 584–585, 1040–1055. [Google Scholar] [CrossRef]
- Steeneveld, G.J.; Koopmans, S.; Heusinkveld, B.G.; Theeuwes, N.E. Refreshing the role of open water surfaces on mitigating the maximum urban heat island effect. Landsc. Urban Plan. 2014, 121, 92–96. [Google Scholar] [CrossRef]
- Theeuwes, N.E.; Solcerová, A.; Steeneveld, G.J. Modeling the influence of open water surfaces on the summertime temperature and thermal comfort in the city. J. Geophys. Res. Atmospheres 2013, 118, 8881–8896. [Google Scholar] [CrossRef] [Green Version]
- Tominaga, Y.; Sato, Y.; Sadohara, S. CFD simulations of the effect of evaporative cooling from water bodies in a micro-scale urban environment: Validation and application studies. Sustain. Cities Soc. 2015, 19, 259–270. [Google Scholar] [CrossRef]
- Suomi, J.; Käyhkö, J. The impact of environmental factors on urban temperature variability in the coastal city of Turku, SW Finland. Int. J. Climatol. 2012, 32, 451–463. [Google Scholar] [CrossRef]
- Wu, C.; Li, J.; Wang, C.; Song, C.; Chen, Y.; Finka, M.; La Rosa, D. Understanding the relationship between urban blue infrastructure and land surface temperature. Sci. Total Environ. 2019, 694, 133742. [Google Scholar] [CrossRef] [PubMed]
- Yang, G.; Yu, Z.; Jørgensen, G.; Vejre, H. How can urban blue-green space be planned for climate adaption in high-latitude cities? A seasonal perspective. Sustain. Cities Soc. 2020, 53, 101932. [Google Scholar] [CrossRef]
- Zhu, C.; Li, S.; Ji, P.; Ren, B.; Li, X. Effects of the different width of urban green belts on the temperature and humidity. Shengtai Xuebao Acta Ecol. Sin. 2011, 31, 383–394. [Google Scholar]
- Abis, K.L.; Mara, D. Temperature measurement and stratification in facultative waste stabilisation ponds in the UK climate. Environ. Monit. Assess. 2006, 114, 35–47. [Google Scholar] [CrossRef]
- Newman, L.; Herbert, Y. The use of deep water cooling systems: Two Canadian examples. Renew. Energy 2009, 34, 727–730. [Google Scholar] [CrossRef]
- Du, H.; Song, X.; Jiang, H.; Kan, Z.; Wang, Z.; Cai, Y. Research on the cooling island effects of water body: A case study of Shanghai, China. Ecol. Indic. 2016, 67, 31–38. [Google Scholar] [CrossRef]
- Hathway, E.A.; Sharples, S. The interaction of rivers and urban form in mitigating the Urban Heat Island effect: A UK case study. Build. Environ. 2012, 58, 14–22. [Google Scholar] [CrossRef] [Green Version]
- Duarte, D.H.S.; Shinzato, P.; Gusson, C.d.S.; Alves, C.A. The impact of vegetation on urban microclimate to counterbalance built density in a subtropical changing climate. Urban Clim. 2015, 14, 224–239. [Google Scholar] [CrossRef]
- Giles-Corti, B.; Broomhall, M.H.; Knuiman, M.; Collins, C.; Douglas, K.; Ng, K.; Lange, A.; Donovan, R.J. Increasing walking: How important is distance to, attractiveness, and size of public open space? Am. J. Prev. Med. 2005, 28, 169–176. [Google Scholar] [CrossRef]
- Vaz Monteiro, M.; Doick, K.J.; Handley, P.; Peace, A. The impact of greenspace size on the extent of local nocturnal air temperature cooling in London. Urban For. Urban Green. 2016, 16, 160–169. [Google Scholar] [CrossRef]
- Feyisa, G.L.; Dons, K.; Meilby, H. Efficiency of parks in mitigating urban heat island effect: An example from Addis Ababa. Landsc. Urban Plan. 2014, 123, 87–95. [Google Scholar] [CrossRef]
- Lu, J.; Li, C.; Yang, Y.; Zhang, X.; Jin, M. Quantitative evaluation of urban park cool island factors in mountain city. J. Cent. South Univ. 2012, 19, 1657–1662. [Google Scholar] [CrossRef]
- Lehmann, I.; Mathey, J.; Rößler, S.; Bräuer, A.; Goldberg, V. Urban vegetation structure types as a methodological approach for identifying ecosystem services—Application to the analysis of micro-climatic effects. Ecol. Indic. 2014, 42, 58–72. [Google Scholar] [CrossRef]
- Chen, X.; Su, Y.; Li, D.; Huang, G.; Chen, W.; Chen, S. Study on the cooling effects of urban parks on surrounding environments using Landsat TM data: A case study in Guangzhou, southern China. Int. J. Remote Sens. 2012, 33, 5889–5914. [Google Scholar] [CrossRef]
- Chang, C.-R.; Li, M.-H. Effects of urban parks on the local urban thermal environment. Urban For. Urban Green. 2014, 13, 672–681. [Google Scholar] [CrossRef]
- Zhou, W.; Cao, F. Effects of changing spatial extent on the relationship between urban forest patterns and land surface temperature. Ecol. Indic. 2020, 109, 105778. [Google Scholar] [CrossRef]
- Cheung, P.K.; Jim, C.Y. Differential cooling effects of landscape parameters in humid-subtropical urban parks. Landsc. Urban Plan. 2019, 192, 103651. [Google Scholar] [CrossRef]
- Lee, H.; Mayer, H.; Chen, L. Contribution of trees and grasslands to the mitigation of human heat stress in a residential district of Freiburg, Southwest Germany. Landsc. Urban Plan. 2016, 148, 37–50. [Google Scholar] [CrossRef]
- Duncan, J.M.A.; Boruff, B.; Saunders, A.; Sun, Q.; Hurley, J.; Amati, M. Turning down the heat: An enhanced understanding of the relationship between urban vegetation and surface temperature at the city scale. Sci. Total Environ. 2019, 656, 118–128. [Google Scholar] [CrossRef]
- Cohen, P.; Potchter, O.; Matzarakis, A. Daily and seasonal climatic conditions of green urban open spaces in the Mediterranean climate and their impact on human comfort. Build. Environ. 2012, 51, 285–295. [Google Scholar] [CrossRef]
- Potchter, O.; Cohen, P.; Bitan, A. Climatic behavior of various urban parks during hot and humid summer in the mediterranean city of Tel Aviv, Israel. Int. J. Climatol. 2006, 26, 1695–1711. [Google Scholar] [CrossRef]
- Wang, Y.; Bakker, F.; de Groot, R.; Wörtche, H.; Leemans, R. Effects of urban green infrastructure (UGI) on local outdoor microclimate during the growing season. Environ. Monit. Assess. 2015, 187, 732. [Google Scholar] [CrossRef] [Green Version]
- Zhang, Z.; Lv, Y.; Pan, H. Cooling and humidifying effect of plant communities in subtropical urban parks. Urban For. Urban Green. 2013, 12, 323–329. [Google Scholar] [CrossRef]
- Coutts, A.M.; Beringer, J.; Tapper, N.J. Impact of increasing urban density on local climate: Spatial and temporal variations in the surface energy balance in Melbourne, Australia. J. Appl. Meteorol. Climatol. 2007, 46, 477–493. [Google Scholar] [CrossRef]
- Spronken-Smith, R.A.; Oke, T.R. The thermal regime of urban parks in two cities with different summer climates. Int. J. Remote Sens. 1998, 19, 2085–2104. [Google Scholar] [CrossRef]
- Spronken-Smith, R.A.; Oke, T.R. Scale modelling of nocturnal cooling in urban parks. Bound. Layer Meteorol. 1999, 93, 287–312. [Google Scholar] [CrossRef]
- Broadbent, A.M.; Coutts, A.M.; Tapper, N.J.; Demuzere, M. The cooling effect of irrigation on urban microclimate during heatwave conditions. Urban Clim. 2018, 23, 309–329. [Google Scholar] [CrossRef]
- Žuvela-Aloise, M.; Koch, R.; Buchholz, S.; Früh, B. Modelling the potential of green and blue infrastructure to reduce urban heat load in the city of Vienna. Clim. Chang. 2016, 135, 425–438. [Google Scholar] [CrossRef] [Green Version]
- Dimoudi, A.; Nikolopoulou, M. Vegetation in the urban environment: Microclimatic analysis and benefits. Energy Build. 2003, 35, 69–76. [Google Scholar] [CrossRef] [Green Version]
- Heusinkveld, B.G.; Steeneveld, G.V.; Van Hove, L.W.; Jacobs, C.M.; Holtslag, A.A. Spatial variability of the Rotterdam urban heat island as influenced by urban land use. J. Geophys. Res. Atmospheres 2014, 119, 677–692. [Google Scholar] [CrossRef]
- Klemm, W.; Heusinkveld, B.G.; Lenzholzer, S.; Jacobs, M.H.; Van Hove, B. Psychological and physical impact of urban green spaces on outdoor thermal comfort during summertime in The Netherlands. Build. Environ. 2015, 83, 120–128. [Google Scholar] [CrossRef]
- Takebayashi, H. Influence of Urban Green Area on Air Temperature of Surrounding Built-Up Area. Climate 2017, 5, 60. [Google Scholar] [CrossRef] [Green Version]
- Coutts, A.M.; Daly, E.; Beringer, J.; Tapper, N.J. Assessing practical measures to reduce urban heat: Green and cool roofs. Build. Environ. 2013, 70, 266–276. [Google Scholar] [CrossRef]
- Kim, J.-H.; Gu, D.; Sohn, W.; Kil, S.-H.; Kim, H.; Lee, D.-K. Neighborhood Landscape Spatial Patterns and Land Surface Temperature: An Empirical Study on Single-Family Residential Areas in Austin, Texas. Int. J. Environ. Res. Public Health 2016, 13, 880. [Google Scholar] [CrossRef] [Green Version]
- Edmondson, J.L.; Davies, Z.G.; McHugh, N.; Gaston, K.J.; Leake, J.R. Organic carbon hidden in urban ecosystems. Sci. Rep. 2012, 2, 963. [Google Scholar] [CrossRef]
- Mayer, H.; Holst, J.; Dostal, P.; Imbery, F.; Schindler, D. Human thermal comfort in summer within an urban street canyon in Central Europe. Meteorol. Z. 2008, 17, 241–250. [Google Scholar] [CrossRef]
- Pataki, D.E.; Carreiro, M.M.; Cherrier, J.; Grulke, N.E.; Jennings, V.; Pincetl, S.; Pouyat, R.V.; Whitlow, T.H.; Zipperer, W.C. Coupling biogeochemical cycles in urban environments: Ecosystem services, green solutions, and misconceptions. Front. Ecol. Environ. 2011, 9, 27–36. [Google Scholar] [CrossRef]
- Shashua-Bar, L.; Potchter, O.; Bitan, A.; Boltansky, D.; Yaakov, Y. Microclimate modelling of street tree species effects within the varied urban morphology in the Mediterranean city of Tel Aviv, Israel. Int. J. Climatol. 2010, 30, 44–57. [Google Scholar] [CrossRef]
- Dixon, P.G.; Mote, T. Patterns and Causes of Atlanta’s Urban Heat Island Initiated Precipitation. J. Appl. Meteorol. 2003, 42, 1273–1284. [Google Scholar] [CrossRef]
- Leuzinger, S.; Vogt, R.; Körner, C. Tree surface temperature in an urban environment. Agric. For. Meteorol. 2010, 150, 56–62. [Google Scholar] [CrossRef]
- Lin, B.-S.; Lin, Y.-J. Cooling Effect of Shade Trees with Different Characteristics in a Subtropical Urban Park. HortScience 2010, 45, 83–86. [Google Scholar] [CrossRef] [Green Version]
- Shashua-Bar, L.; Pearlmutter, D.; Erell, E. The cooling efficiency of urban landscape strategies in a hot dry climate. Landsc. Urban Plan. 2009, 92, 179–186. [Google Scholar] [CrossRef]
- Meier, F.; Scherer, D. Spatial and temporal variability of urban tree canopy temperature during summer 2010 in Berlin, Germany. Theor. Appl. Climatol. 2012, 110, 373–384. [Google Scholar] [CrossRef]
- Gillner, S.; Vogt, J.; Tharang, A.; Dettmann, S.; Roloff, A. Role of street trees in mitigating effects of heat and drought at highly sealed urban sites. Landsc. Urban Plan. 2015, 143, 33–42. [Google Scholar] [CrossRef]
- Kong, F.; Yan, W.; Zheng, G.; Yin, H.; Cavan, G.; Zhan, W.; Zhang, N.; Cheng, L. Retrieval of three-dimensional tree canopy and shade using terrestrial laser scanning (TLS) data to analyze the cooling effect of vegetation. Agric. For. Meteorol. 2016, 217, 22–34. [Google Scholar] [CrossRef]
- Kong, L.; Lau, K.K.-L.; Yuan, C.; Chen, Y.; Xu, Y.; Ren, C.; Ng, E. Regulation of outdoor thermal comfort by trees in Hong Kong. Sustain. Cities Soc. 2017, 31, 12–25. [Google Scholar] [CrossRef]
- Coutts, A.M.; White, E.C.; Tapper, N.J.; Beringer, J.; Livesley, S.J. Temperature and human thermal comfort effects of street trees across three contrasting street canyon environments. Theor. Appl. Climatol. 2016, 124, 55–68. [Google Scholar] [CrossRef]
- Morakinyo, T.E.; Ouyang, W.; Lau, K.K.-L.; Ren, C.; Ng, E. Right tree, right place (urban canyon): Tree species selection approach for optimum urban heat mitigation—Development and evaluation. Sci. Total Environ. 2020, 719, 137461. [Google Scholar] [CrossRef]
- Pauleit, S. Urban street tree plantings: Identifying the key requirements. Proc. Inst. Civ. Eng. Munic. Eng. 2003, 156, 43–50. [Google Scholar] [CrossRef]
- Park, M.; Hagishima, A.; Tanimoto, J.; Narita, K. Effect of urban vegetation on outdoor thermal environment: Field measurement at a scale model site. Build. Environ. 2012, 56, 38–46. [Google Scholar] [CrossRef]
- Imam Syafii, N.; Ichinose, M.; Kumakura, E.; Jusuf, S.K.; Chigusa, K.; Wong, N.H. Thermal environment assessment around bodies of water in urban canyons: A scale model study. Sustain. Cities Soc. 2017, 34, 79–89. [Google Scholar] [CrossRef]
- Tan, Z.; Lau, K.K.-L.; Ng, E. Urban tree design approaches for mitigating daytime urban heat island effects in a high-density urban environment. Energy Build. 2016, 114, 265–274. [Google Scholar] [CrossRef]
- Ouyang, W.; Morakinyo, T.E.; Ren, C.; Ng, E. The cooling efficiency of variable greenery coverage ratios in different urban densities: A study in a subtropical climate. Build. Environ. 2020, 174, 106772. [Google Scholar] [CrossRef]
- Sailor, D.J.; Elley, T.B.; Gibson, M. Exploring the building energy impacts of green roof design decisions—A modeling study of buildings in four distinct climates. J. Build. Phys. 2012, 35, 372–391. [Google Scholar] [CrossRef]
- Oberndorfer, E.; Lundholm, J.; Bass, B.; Coffman, R.R.; Doshi, H.; Dunnett, N.; Gaffin, S.; Köhler, M.; Liu, K.K.Y.; Rowe, B. Green roofs as urban ecosystems: Ecological structures, functions, and services. BioScience 2007, 57, 823–833. [Google Scholar] [CrossRef]
- Chudnovsky, A.; Ben-Dor, E.; Saaroni, H. Diurnal thermal behavior of selected urban objects using remote sensing measurements. Energy Build. 2004, 36, 1063–1074. [Google Scholar] [CrossRef]
- Tian, Y.; Bai, X.; Qi, B.; Sun, L. Study on heat fluxes of green roofs based on an improved heat and mass transfer model. Energy Build. 2017, 152, 175–184. [Google Scholar] [CrossRef]
- Ouldboukhitine, S.-E.; Spolek, G.; Belarbi, R. Impact of plants transpiration, grey and clean water irrigation on the thermal resistance of green roofs. Ecol. Eng. 2014, 67, 60–66. [Google Scholar] [CrossRef]
- Tsang, S.W.; Jim, C.Y. Theoretical evaluation of thermal and energy performance of tropical green roofs. Energy 2011, 36, 3590–3598. [Google Scholar] [CrossRef]
- Williams, N.S.G.; Rayner, J.P.; Raynor, K.J. Green roofs for a wide brown land: Opportunities and barriers for rooftop greening in Australia. Urban For. Urban Green. 2010, 9, 245–251. [Google Scholar] [CrossRef]
- Azeñas, V.; Cuxart, J.; Picos, R.; Medrano, H.; Simó, G.; López-Grifol, A.; Gulías, J. Thermal regulation capacity of a green roof system in the mediterranean region: The effects of vegetation and irrigation level. Energy Build. 2018, 164, 226–238. [Google Scholar] [CrossRef]
- Blanusa, T.; Vaz Monteiro, M.M.; Fantozzi, F.; Vysini, E.; Li, Y.; Cameron, R.W.F. Alternatives to Sedum on green roofs: Can broad leaf perennial plants offer better ‘cooling service’? Build. Environ. 2013, 59, 99–106. [Google Scholar] [CrossRef] [Green Version]
- Vaz Monteiro, M.; Blanuša, T.; Verhoef, A.; Richardson, M.; Hadley, P.; Cameron, R.W.F. Functional green roofs: Importance of plant choice in maximising summertime environmental cooling and substrate insulation potential. Energy Build. 2017, 141, 56–68. [Google Scholar] [CrossRef]
- Lundholm, J.; MacIvor, J.S.; MacDougall, Z.; Ranalli, M. Plant Species and Functional Group Combinations Affect Green Roof Ecosystem Functions. PLoS ONE 2010, 5, e9677. [Google Scholar] [CrossRef] [PubMed] [Green Version]
- D’Orazio, M.; Di Perna, C.; Di Giuseppe, E. Green roof yearly performance: A case study in a highly insulated building under temperate climate. Energy Build. 2012, 55, 439–451. [Google Scholar] [CrossRef]
- He, Y.; Yu, H.; Ozaki, A.; Dong, N.; Zheng, S. Influence of plant and soil layer on energy balance and thermal performance of green roof system. Energy 2017, 141, 1285–1299. [Google Scholar] [CrossRef]
- Ouldboukhitine, S.-E.; Belarbi, R.; Jaffal, I.; Trabelsi, A. Assessment of green roof thermal behavior: A coupled heat and mass transfer model. Build. Environ. 2011, 46, 2624–2631. [Google Scholar] [CrossRef]
- Peng, L.L.H.; Yang, X.; He, Y.; Hu, Z.; Xu, T.; Jiang, Z.; Yao, L. Thermal and energy performance of two distinct green roofs: Temporal pattern and underlying factors in a subtropical climate. Energy Build. 2019, 185, 247–258. [Google Scholar] [CrossRef]
- Dong, J.; Lin, M.; Zuo, J.; Lin, T.; Liu, J.; Sun, C.; Luo, J. Quantitative study on the cooling effect of green roofs in a high-density urban Area—A case study of Xiamen, China. J. Clean. Prod. 2020, 255, 120152. [Google Scholar] [CrossRef]
- Gill, S.E.; Handley, J.F.; Ennos, A.R.; Pauleit, S. Adapting cities for climate change: The role of the green infrastructure. Built Environ. 2007, 33, 115–133. [Google Scholar] [CrossRef] [Green Version]
- Akbari, H.; Taha, H. The impact of trees and white surfaces on residential heating and cooling energy use in four Canadian cities. Energy 1992, 17, 141–149. [Google Scholar] [CrossRef]
- Köhler, M. Green facades-a view back and some visions. Urban Ecosyst. 2008, 11, 423–436. [Google Scholar] [CrossRef]
- Ottelé, M.; Perini, K.; Fraaij, A.L.A.; Haas, E.M.; Raiteri, R. Comparative life cycle analysis for green façades and living wall systems. Energy Build. 2011, 43, 3419–3429. [Google Scholar] [CrossRef]
- Pérez-Urrestarazu, L.; Fernández-Cañero, R.; Franco, A.; Egea, G. Influence of an active living wall on indoor temperature and humidity conditions. Ecol. Eng. 2016, 90, 120–124. [Google Scholar] [CrossRef]
- Lee, L.S.H.; Jim, C.Y. Subtropical summer thermal effects of wirerope climber green walls with different air-gap depths. Build. Environ. 2017, 126, 1–12. [Google Scholar] [CrossRef]
- Jim, C.Y. Cold-season solar input and ambivalent thermal behavior brought by climber greenwalls. Energy 2015, 90, 926–938. [Google Scholar] [CrossRef]
- Djedjig, R.; Bozonnet, E.; Belarbi, R. Analysis of thermal effects of vegetated envelopes: Integration of a validated model in a building energy simulation program. Energy Build. 2015, 86, 93–103. [Google Scholar] [CrossRef]
- Morakinyo, T.E.; Lai, A.; Lau, K.K.-L.; Ng, E. Thermal benefits of vertical greening in a high-density city: Case study of Hong Kong. Urban For. Urban Green. 2019, 37, 42–55. [Google Scholar] [CrossRef]
- Kontoleon, K.J.; Eumorfopoulou, E.A. The effect of the orientation and proportion of a plant-covered wall layer on the thermal performance of a building zone. Build. Environ. 2010, 45, 1287–1303. [Google Scholar] [CrossRef]
- He, Y.; Yu, H.; Ozaki, A.; Dong, N.; Zheng, S. An investigation on the thermal and energy performance of living wall system in Shanghai area. Energy Build. 2017, 140, 324–335. [Google Scholar] [CrossRef]
- Dahanayake, K.C.; Chow, C.L.; Long Hou, G. Selection of suitable plant species for energy efficient Vertical Greenery Systems (VGS). Energy Procedia 2017, 142, 2473–2478. [Google Scholar] [CrossRef]
- Pérez, G.; Coma, J.; Sol, S.; Cabeza, L.F. Green facade for energy savings in buildings: The influence of leaf area index and facade orientation on the shadow effect. Appl. Energy 2017, 187, 424–437. [Google Scholar] [CrossRef] [Green Version]
- Cuce, E. Thermal regulation impact of green walls: An experimental and numerical investigation. Appl. Energy 2017, 194, 247–254. [Google Scholar] [CrossRef]
- Koyama, T.; Yoshinaga, M.; Hayashi, H.; Maeda, K.; Yamauchi, A. Identification of key plant traits contributing to the cooling effects of green façades using freestanding walls. Build. Environ. 2013, 66, 96–103. [Google Scholar] [CrossRef]
- Cheng, C.Y.; Cheung, K.K.S.; Chu, L.M. Thermal performance of a vegetated cladding system on facade walls. Build. Environ. 2010, 45, 1779–1787. [Google Scholar] [CrossRef]
- Hoelscher, M.-T.; Nehls, T.; Jänicke, B.; Wessolek, G. Quantifying cooling effects of facade greening: Shading, transpiration and insulation. Energy Build. 2016, 114, 283–290. [Google Scholar] [CrossRef]
- Tudiwer, D.; Korjenic, A. The effect of living wall systems on the thermal resistance of the façade. Energy Build. 2017, 135, 10–19. [Google Scholar] [CrossRef]
- Yin, H.; Kong, F.; Middel, A.; Dronova, I.; Xu, H.; James, P. Cooling effect of direct green façades during hot summer days: An observational study in Nanjing, China using TIR and 3DPC data. Build. Environ. 2017, 116, 195–206. [Google Scholar] [CrossRef] [Green Version]
- Fu, F. Chapter Six-Design and Analysis of Complex Structures. In Design and Analysis of Tall and Complex Structures; Fu, F., Ed.; Butterworth-Heinemann: Oxford, UK, 2018; pp. 177–211. ISBN 978-0-08-101018-1. [Google Scholar]
- Shi, D.; Song, J.; Huang, J.; Zhuang, C.; Guo, R.; Gao, Y. Synergistic cooling effects (SCEs) of urban green-blue spaces on local thermal environment: A case study in Chongqing, China. Sustain. Cities Soc. 2020, 55, 102065. [Google Scholar] [CrossRef]
- Müller, N.; Kuttler, W.; Barlag, A.-B. Counteracting urban climate change: Adaptation measures and their effect on thermal comfort. Theor. Appl. Climatol. 2014, 115, 243–257. [Google Scholar] [CrossRef] [Green Version]
- Robitu, M.; Inard, C.; Groleau, D.; Musy, M. Energy balance study of water ponds and its influence on building energy consumption. Build. Serv. Eng. Res. Technol. 2004, 25, 171–182. [Google Scholar] [CrossRef] [Green Version]
- Saaroni, H.; Ziv, B. The impact of a small lake on heat stress in a Mediterranean urban park: The case of Tel Aviv, Israel. Int. J. Biometeorol. 2003, 47, 156–165. [Google Scholar] [CrossRef] [PubMed]
- Adams, M.P.; Smith, P.L. A systematic approach to model the influence of the type and density of vegetation cover on urban heat using remote sensing. Landsc. Urban Plan. 2014, 132, 47–54. [Google Scholar] [CrossRef]
- Algretawee, H.; Rayburg, S.; Neave, M. Estimating the effect of park proximity to the central of Melbourne city on Urban Heat Island (UHI) relative to Land Surface Temperature (LST). Ecol. Eng. 2019, 138, 374–390. [Google Scholar] [CrossRef]
- Bartesaghi-Koc, C.; Osmond, P.; Peters, A. Mapping and classifying green infrastructure typologies for climate-related studies based on remote sensing data. Urban For. Urban Green. 2019, 37, 154–167. [Google Scholar] [CrossRef]
- Cao, X.; Onishi, A.; Chen, J.; Imura, H. Quantifying the cool island intensity of urban parks using ASTER and IKONOS data. Landsc. Urban Plan. 2010, 96, 224–231. [Google Scholar] [CrossRef]
- Doick, K.J.; Peace, A.; Hutchings, T.R. The role of one large greenspace in mitigating London’s nocturnal urban heat island. Sci. Total Environ. 2014, 493, 662–671. [Google Scholar] [CrossRef]
- Du, H.; Cai, W.; Xu, Y.; Wang, Z.; Wang, Y.; Cai, Y. Quantifying the cool island effects of urban green spaces using remote sensing Data. Urban For. Urban Green. 2017, 27, 24–31. [Google Scholar] [CrossRef]
- Imran, H.M.; Kala, J.; Ng, A.W.M.; Muthukumaran, S. Effectiveness of vegetated patches as Green Infrastructure in mitigating Urban Heat Island effects during a heatwave event in the city of Melbourne. Weather Clim. Extrem. 2019, 25, 100217. [Google Scholar] [CrossRef]
- Le, M.T.; Cao, T.A.T.; Tran, N.A.Q. The role of green space in the urbanization of Hanoi city. E3S Web Conf. 2019, 97, 01013. [Google Scholar] [CrossRef] [Green Version]
- Lin, B.-S.; Lin, C.-T. Preliminary study of the influence of the spatial arrangement of urban parks on local temperature reduction. Urban For. Urban Green. 2016, 20, 348–357. [Google Scholar] [CrossRef]
- Onishi, A.; Cao, X.; Ito, T.; Shi, F.; Imura, H. Evaluating the potential for urban heat-island mitigation by greening parking lots. Urban For. Urban Green. 2010, 9, 323–332. [Google Scholar] [CrossRef]
- Peng, J.; Jia, J.; Liu, Y.; Li, H.; Wu, J. Seasonal contrast of the dominant factors for spatial distribution of land surface temperature in urban areas. Remote Sens. Environ. 2018, 215, 255–267. [Google Scholar] [CrossRef]
- Xiao, X.D.; Dong, L.; Yan, H.; Yang, N.; Xiong, Y. The influence of the spatial characteristics of urban green space on the urban heat island effect in Suzhou Industrial Park. Sustain. Cities Soc. 2018, 40, 428–439. [Google Scholar] [CrossRef]
- Yu, Z.; Guo, X.; Jørgensen, G.; Vejre, H. How can urban green spaces be planned for climate adaptation in subtropical cities? Ecol. Indic. 2017, 82, 152–162. [Google Scholar] [CrossRef]
- Shashua-Bar, L.; Hoffman, M.E. Vegetation as a climatic component in the design of an urban street: An empirical model for predicting the cooling effect of urban green areas with trees. Energy Build. 2000, 31, 221–235. [Google Scholar] [CrossRef]
- Giridharan, R.; Lau, S.S.Y.; Ganesan, S.; Givoni, B. Lowering the outdoor temperature in high-rise high-density residential developments of coastal Hong Kong: The vegetation influence. Build. Environ. 2008, 43, 1583–1595. [Google Scholar] [CrossRef]
- Zoulia, I.; Santamouris, M.; Dimoudi, A. Monitoring the effect of urban green areas on the heat island in Athens. Environ. Monit. Assess. 2008, 156, 275. [Google Scholar] [CrossRef]
- Kong, F.; Yin, H.; James, P.; Hutyra, L.R.; He, H.S. Effects of spatial pattern of greenspace on urban cooling in a large metropolitan area of eastern China. Landsc. Urban Plan. 2014, 128, 35–47. [Google Scholar] [CrossRef]
- Hardin, P.J.; Jensen, R.R. The effect of urban leaf area on summertime urban surface kinetic temperatures: A Terre Haute case study. Urban For. Urban Green. 2007, 6, 63–72. [Google Scholar] [CrossRef]
- Hamada, S.; Ohta, T. Seasonal variations in the cooling effect of urban green areas on surrounding urban areas. Urban For. Urban Green. 2010, 9, 15–24. [Google Scholar] [CrossRef]
- Yu, Z.; Xu, S.; Zhang, Y.; Jørgensen, G.; Vejre, H. Strong contributions of local background climate to the cooling effect of urban green vegetation. Sci. Rep. 2018, 8, 1–9. [Google Scholar] [CrossRef] [PubMed]
- Oliveira, S.; Andrade, H.; Vaz, T. The cooling effect of green spaces as a contribution to the mitigation of urban heat: A case study in Lisbon. Build. Environ. 2011, 46, 2186–2194. [Google Scholar] [CrossRef]
- Qiu, G.Y.; Zou, Z.; Li, X.; Li, H.; Guo, Q.; Yan, C.; Tan, S. Experimental studies on the effects of green space and evapotranspiration on urban heat island in a subtropical megacity in China. Habitat Int. 2017, 68, 30–42. [Google Scholar] [CrossRef]
- Mariani, L.; Parisi, S.G.; Cola, G.; Lafortezza, R.; Colangelo, G.; Sanesi, G. Climatological analysis of the mitigating effect of vegetation on the urban heat island of Milan, Italy. Sci. Total Environ. 2016, 569–570, 762–773. [Google Scholar] [CrossRef]
- Fung, C.K.W.; Jim, C.Y. Influence of blue infrastructure on lawn thermal microclimate in a subtropical green space. Sustain. Cities Soc. 2020, 52, 101858. [Google Scholar] [CrossRef]
- Hamada, S.; Tanaka, T.; Ohta, T. Impacts of land use and topography on the cooling effect of green areas on surrounding urban areas. Urban For. Urban Green. 2013, 12, 426–434. [Google Scholar] [CrossRef]
- Kaloustian, N.; Aouad, D.; Battista, G.; Zinzi, M. Leftover Spaces for the Mitigation of Urban Overheating in Municipal Beirut. Climate 2018, 6, 68. [Google Scholar] [CrossRef] [Green Version]
- Shashua-Bar, L.; Hoffman, M.E. Quantitative evaluation of passive cooling of the UCL microclimate in hot regions in summer, case study: Urban streets and courtyards with trees. Build. Environ. 2004, 39, 1087–1099. [Google Scholar] [CrossRef]
- Milošević, D.D.; Bajšanski, I.V.; Savić, S.M. Influence of changing trees locations on thermal comfort on street parking lot and footways. Urban For. Urban Green. 2017, 23, 113–124. [Google Scholar] [CrossRef]
- Gromke, C.; Blocken, B.; Janssen, W.; Merema, B.; van Hooff, T.; Timmermans, H. CFD analysis of transpirational cooling by vegetation: Case study for specific meteorological conditions during a heat wave in Arnhem, Netherlands. Build. Environ. 2015, 83, 11–26. [Google Scholar] [CrossRef]
- Morakinyo, T.E.; Kong, L.; Lau, K.K.-L.; Yuan, C.; Ng, E. A study on the impact of shadow-cast and tree species on in-canyon and neighborhood’s thermal comfort. Build. Environ. 2017, 115, 1–17. [Google Scholar] [CrossRef]
- Morakinyo, T.E.; Lau, K.K.-L.; Ren, C.; Ng, E. Performance of Hong Kong’s common trees species for outdoor temperature regulation, thermal comfort and energy saving. Build. Environ. 2018, 137, 157–170. [Google Scholar] [CrossRef]
- Morakinyo, T.E.; Lam, Y.F. Simulation study on the impact of tree-configuration, planting pattern and wind condition on street-canyon’s micro-climate and thermal comfort. Build. Environ. 2016, 103, 262–275. [Google Scholar] [CrossRef]
- Konarska, J.; Uddling, J.; Holmer, B.; Lutz, M.; Lindberg, F.; Pleijel, H.; Thorsson, S. Transpiration of urban trees and its cooling effect in a high latitude city. Int. J. Biometeorol. 2016, 60, 159–172. [Google Scholar] [CrossRef]
- Ryu, Y.-H.; Bou-Zeid, E.; Wang, Z.-H.; Smith, J.A. Realistic Representation of Trees in an Urban Canopy Model. Bound. Layer Meteorol. 2016, 159, 193–220. [Google Scholar] [CrossRef]
- Shashua-Bar, L.; Tsiros, I.X.; Hoffman, M.E. A modeling study for evaluating passive cooling scenarios in urban streets with trees. Case study: Athens, Greece. Build. Environ. 2010, 45, 2798–2807. [Google Scholar] [CrossRef]
- Takács, Á.; Kiss, M.; Hof, A.; Tanács, E.; Gulyás, Á.; Kántor, N. Microclimate Modification by Urban Shade Trees—An Integrated Approach to Aid Ecosystem Service Based Decision-making. Procedia Environ. Sci. 2016, 32, 97–109. [Google Scholar] [CrossRef] [Green Version]
- Shashua-Bar, L.; Tsiros, I.X.; Hoffman, M. Passive cooling design options to ameliorate thermal comfort in urban streets of a Mediterranean climate (Athens) under hot summer conditions. Build. Environ. 2012, 57, 110–119. [Google Scholar] [CrossRef]
- Streiling, S.; Matzarakis, A. Influence of single and small clusters of trees on the bioclimate of a city: A case study. J. Arboric. 2003, 29, 309–316. [Google Scholar]
- Tsiros, I.X. Assessment and energy implications of street air temperature cooling by shade tress in Athens (Greece) under extremely hot weather conditions. Renew. Energy 2010, 35, 1866–1869. [Google Scholar] [CrossRef]
- Chen, L.; Ng, E. Simulation of the effect of downtown greenery on thermal comfort in subtropical climate using PET index: A case study in Hong Kong. Archit. Sci. Rev. 2013, 56, 297–305. [Google Scholar] [CrossRef]
- Yoshida, A.; Hisabayashi, T.; Kashihara, K.; Kinoshita, S.; Hashida, S. Evaluation of effect of tree canopy on thermal environment, thermal sensation, and mental state. Urban Clim. 2015, 14, 240–250. [Google Scholar] [CrossRef]
- Lee, H.; Mayer, H. Maximum extent of human heat stress reduction on building areas due to urban greening. Urban For. Urban Green. 2018, 32, 154–167. [Google Scholar] [CrossRef]
- Howe, D.A.; Hathaway, J.M.; Ellis, K.N.; Mason, L.R. Spatial and temporal variability of air temperature across urban neighborhoods with varying amounts of tree canopy. Urban For. Urban Green. 2017, 27, 109–116. [Google Scholar] [CrossRef]
- Tan, Z.; Lau, K.K.-L.; Ng, E. Planning strategies for roadside tree planting and outdoor comfort enhancement in subtropical high-density urban areas. Build. Environ. 2017, 120, 93–109. [Google Scholar] [CrossRef]
- Boafo, F.E.; Kim, J.-T.; Kim, J.-H. Evaluating the impact of green roof evapotranspiration on annual building energy performance. Int. J. Green Energy 2017, 14, 479–489. [Google Scholar] [CrossRef]
- Jim, C.Y. Effect of vegetation biomass structure on thermal performance of tropical green roof. Landsc. Ecol. Eng. 2012, 8, 173–187. [Google Scholar] [CrossRef] [Green Version]
- Jim, C.Y. Building thermal-insulation effect on ambient and indoor thermal performance of green roofs. Ecol. Eng. 2014, 69, 265–275. [Google Scholar] [CrossRef]
- Jim, C.Y. Air-conditioning energy consumption due to green roofs with different building thermal insulation. Appl. Energy 2014, 128, 49–59. [Google Scholar] [CrossRef]
- La Roche, P.; Berardi, U. Comfort and energy savings with active green roofs. Energy Build. 2014, 82, 492–504. [Google Scholar] [CrossRef]
- Liu, M. (Max) Probabilistic prediction of green roof energy performance under parameter uncertainty. Energy 2014, 77, 667–674. [Google Scholar] [CrossRef]
- Pianella, A.; Aye, L.; Chen, Z.; Williams, N.S.G. Substrate Depth, Vegetation and Irrigation Affect Green Roof Thermal Performance in a Mediterranean Type Climate. Sustainability 2017, 9, 1451. [Google Scholar] [CrossRef] [Green Version]
- Silva, C.M.; Gomes, M.G.; Silva, M. Green roofs energy performance in Mediterranean climate. Energy Build. 2016, 116, 318–325. [Google Scholar] [CrossRef]
- Susca, T.; Gaffin, S.R.; Dell’Osso, G.R. Positive effects of vegetation: Urban heat island and green roofs. Environ. Pollut. 2011, 159, 2119–2126. [Google Scholar] [CrossRef]
- Huang, Y.-Y.; Chen, C.-T.; Tsai, Y.-C. Reduction of temperatures and temperature fluctuations by hydroponic green roofs in a subtropical urban climate. Energy Build. 2016, 129, 174–185. [Google Scholar] [CrossRef]
- Song, U.; Kim, E.; Bang, J.H.; Son, D.J.; Waldman, B.; Lee, E.J. Wetlands are an effective green roof system. Build. Environ. 2013, 66, 141–147. [Google Scholar] [CrossRef]
- Olivieri, F.; Di Perna, C.; D’Orazio, M.; Olivieri, L.; Neila, J. Experimental measurements and numerical model for the summer performance assessment of extensive green roofs in a Mediterranean coastal climate. Energy Build. 2013, 63, 1–14. [Google Scholar] [CrossRef]
- Onmura, S.; Matsumoto, M.; Hokoi, S. Study on evaporative cooling effect of roof lawn gardens. Energy Build. 2001, 33, 653–666. [Google Scholar] [CrossRef]
- Bevilacqua, P.; Mazzeo, D.; Bruno, R.; Arcuri, N. Experimental investigation of the thermal performances of an extensive green roof in the Mediterranean area. Energy Build. 2016, 122, 63–79. [Google Scholar] [CrossRef]
- Dvorak, B.; Volder, A. Rooftop temperature reduction from unirrigated modular green roofs in south-central Texas. Urban For. Urban Green. 2013, 12, 28–35. [Google Scholar] [CrossRef]
- Ferrante, P.; La Gennusa, M.; Peri, G.; Rizzo, G.; Scaccianoce, G. Vegetation growth parameters and leaf temperature: Experimental results from a six plots green roofs’ system. Energy 2016, 115, 1723–1732. [Google Scholar] [CrossRef]
- Cao, J.; Hu, S.; Dong, Q.; Liu, L.; Wang, Z. Green roof cooling contributed by plant species with different photosynthetic strategies. Energy Build. 2019, 195, 45–50. [Google Scholar] [CrossRef]
- Karachaliou, P.; Santamouris, M.; Pangalou, H. Experimental and numerical analysis of the energy performance of a large scale intensive green roof system installed on an office building in Athens. Energy Build. 2016, 114, 256–264. [Google Scholar] [CrossRef]
- Niachou, A.; Papakonstantinou, K.; Santamouris, M.; Tsangrassoulis, A.; Mihalakakou, G. Analysis of the green roof thermal properties and investigation of its energy performance. Energy Build. 2001, 33, 719–729. [Google Scholar] [CrossRef]
- Sisco, L.; Monzer, S.; Farajalla, N.; Bashour, I.; Saoud, I.P. Roof top gardens as a means to use recycled waste and A/C condensate and reduce temperature variation in buildings. Build. Environ. 2017, 117, 127–134. [Google Scholar] [CrossRef]
- Jim, C.Y. Assessing climate-adaptation effect of extensive tropical green roofs in cities. Landsc. Urban Plan. 2015, 138, 54–70. [Google Scholar] [CrossRef]
- Klein, P.M.; Coffman, R. Establishment and performance of an experimental green roof under extreme climatic conditions. Sci. Total Environ. 2015, 512–513, 82–93. [Google Scholar] [CrossRef]
- Lee, S.; Ryu, Y.; Jiang, C. Urban heat mitigation by roof surface materials during the East Asian summer monsoon. Environ. Res. Lett. 2015, 10, 124012. [Google Scholar] [CrossRef]
- Pisello, A.L.; Piselli, C.; Cotana, F. Thermal-physics and energy performance of an innovative green roof system: The Cool-Green Roof. Sol. Energy 2015, 116, 337–356. [Google Scholar] [CrossRef]
- Feng, C.; Meng, Q.; Zhang, Y. Theoretical and experimental analysis of the energy balance of extensive green roofs. Energy Build. 2010, 42, 959–965. [Google Scholar] [CrossRef]
- Virk, G.; Jansz, A.; Mavrogianni, A.; Mylona, A.; Stocker, J.; Davies, M. Microclimatic effects of green and cool roofs in London and their impacts on energy use for a typical office building. Energy Build. 2015, 88, 214–228. [Google Scholar] [CrossRef]
- Suter, I.; Maksimović, Č.; van Reeuwijk, M. A neighbourhood-scale estimate for the cooling potential of green roofs. Urban Clim. 2017, 20, 33–45. [Google Scholar] [CrossRef] [Green Version]
- Djedjig, R.; Ouldboukhitine, S.-E.; Belarbi, R.; Bozonnet, E. Development and validation of a coupled heat and mass transfer model for green roofs. Int. Commun. Heat Mass Transf. 2012, 39, 752–761. [Google Scholar] [CrossRef]
- Heidarinejad, G.; Esmaili, A. Numerical simulation of the dual effect of green roof thermal performance. Energy Convers. Manag. 2015, 106, 1418–1425. [Google Scholar] [CrossRef]
- Pérez, G.; Vila, A.; Solé, C.; Coma, J.; Castell, A.; Cabeza, L.F. The thermal behaviour of extensive green roofs under low plant coverage conditions. Energy Effic. 2015, 8, 881–894. [Google Scholar] [CrossRef] [Green Version]
- Virk, G.; Jansz, A.; Mavrogianni, A.; Mylona, A.; Stocker, J.; Davies, M. The effectiveness of retrofitted green and cool roofs at reducing overheating in a naturally ventilated office in London: Direct and indirect effects in current and future climates. Indoor Built Environ. 2014, 23, 504–520. [Google Scholar] [CrossRef]
- Yin, H.; Kong, F.; Dronova, I.; Middel, A.; James, P. Investigation of extensive green roof outdoor spatio-temporal thermal performance during summer in a subtropical monsoon climate. Sci. Total Environ. 2019, 696, 133976. [Google Scholar] [CrossRef] [PubMed]
- Kuttler, W. Climate change in urban areas. Part 2, Measures. Environ. Sci. Eur. 2011, 23, 21. [Google Scholar] [CrossRef] [Green Version]
- Ambrosini, D.; Galli, G.; Mancini, B.; Nardi, I.; Sfarra, S. Evaluating Mitigation Effects of Urban Heat Islands in a Historical Small Center with the ENVI-Met® Climate Model. Sustainability 2014, 6, 7013–7029. [Google Scholar] [CrossRef] [Green Version]
- Li, D.; Bou-Zeid, E.; Oppenheimer, M. The effectiveness of cool and green roofs as urban heat island mitigation strategies. Environ. Res. Lett. 2014, 9, 055002. [Google Scholar] [CrossRef]
- Jim, C.Y. Thermal performance of climber greenwalls: Effects of solar irradiance and orientation. Appl. Energy 2015, 154, 631–643. [Google Scholar] [CrossRef]
- Olivieri, F.; Grifoni, R.C.; Redondas, D.; Sánchez-Reséndiz, J.A.; Tascini, S. An experimental method to quantitatively analyse the effect of thermal insulation thickness on the summer performance of a vertical green wall. Energy Build. 2017, 150, 132–148. [Google Scholar] [CrossRef]
- Lee, L.S.H.; Jim, C.Y. Energy benefits of green-wall shading based on novel-accurate apportionment of short-wave radiation components. Appl. Energy 2019, 238, 1506–1518. [Google Scholar] [CrossRef]
- Šuklje, T.; Medved, S.; Arkar, C. On detailed thermal response modeling of vertical greenery systems as cooling measure for buildings and cities in summer conditions. Energy 2016, 115, 1055–1068. [Google Scholar] [CrossRef]
- Perini, K.; Ottelé, M.; Fraaij, A.L.A.; Haas, E.M.; Raiteri, R. Vertical greening systems and the effect on air flow and temperature on the building envelope. Build. Environ. 2011, 46, 2287–2294. [Google Scholar] [CrossRef]


| Parameter Group | Parameter |
|---|---|
| Related to surface properties | Heat capacity Short-wave radiation and long-wave radiation absorption Degree of evaporative cooling Degree of transpiration |
| Related to the type of building materials | Albedo of building materials Radiation from building surfaces and infrastructure Heat loss in buildings Surface permeability in the city |
| Related to geometry and topography | Sky visibility factor Canyons proportions Length of rough surfaces Building geometry Building density Geometry of the city’s spatial arrangement Characteristics of the spatial arrangement |
| Related to the type of land cover | The number of biologically active areas and green areas The presence of water reservoirs and rivers Extent of sealed surfaces Increased wind flow and speed |
| Related to living and managing | Use of buildings Anthropogenic heat release Water management Change in use land |
| Author | Title | Usefulness for Creating Design Guidelines |
|---|---|---|
| [98] | Critical review on the cooling effect of urban blue-green space: A threshold-size perspective | Lists many parameters for water elements and green areas. Discusses the synergy between a water element and a green area |
| [99] | Green roofs to reduce building energy use? A review on key structural factors of green roofs and their effects on urban climate | Lists green roofs parameters |
| [100] | A review of mitigating strategies to improve the thermal environment and thermal comfort in urban outdoor spaces | Lists green areas and water elements parameters. |
| [101] | Urban green space cooling effect in cities | Detailed analysis of the impact of the size of green areas on UHI. Description of possible synergies between green areas |
| [102] | The evapotranspiration process in green roofs: A review | Lists green roofs parameters |
| [103] | Chapter 19-WSUD and Urban Heat Island Effect Mitigation | Comprehensive description of water elements, street greenery, green areas, green roofs, and green walls parameters |
| [104] | Outdoor thermal comfort by different heat mitigation strategies-A review | Lists green areas, street greenery, green roofs, and green walls parameters |
| [105] | Green roofs and facades: A comprehensive review | Detailed description of green roofs, green walls, and green facades parameters |
| [106] | The impact of urban compactness, comfort strategies and energy consumption on tropical urban heat island intensity: A review | Lists green roofs, green walls, and green areas parameters |
| [107] | Vertical greenery systems: A systematic review of research trends | Extensive description for green walls and green facades parameters |
| [108] | Evaluating the cooling effects of green infrastructure: A systematic review of methods, indicators, and data sources | Very general but contains many case studies descriptions |
| [109] | Progress in urban greenery mitigation science–assessment Methodologies advanced technologies and impact on Cities | Thoroughly described green areas parameters. Discussion on the green areas synergy effect |
| [110] | Approaches to Outdoor Thermal Comfort Thresholds through Public Space Design: A Review | Lists street greenery parameters |
| [111] | How to Design a Park and Its Surrounding Urban Morphology to Optimize the Spreading of Cool Air? | Comprehensive description of green areas parameters |
| [112] | Vertical greening systems–A review on recent technologies and research advancement | Detailed description of green walls and facades parameters |
| [113] | Current trends in urban heat island mitigation research: Observations based on a comprehensive research repository | Lists many water elements, street greenery, and green areas parameters |
| [114] | Energy conservation and renewable technologies for buildings to face the impact of the climate change and minimize the use of cooling | Lists green roofs and green walls parameters. Describes water roofs. |
| [115] | Heat mitigation by greening the cities, a review study | In-depth analysis of green areas parameters |
| [11] | Review on the impact of urban geometry and pedestrian level greening on outdoor thermal comfort | The impact of Sky View Factor as well as street greenery and city parks parameters is widely described |
| [61] | Regulating the damaged thermostat of the cities–Status, impacts and mitigation challenges | Lists green areas and green roofs parameters |
| [116] | Green infrastructure as life support: urban nature and climate change | Lists green areas parameters |
| [25] | Planning for cooler cities: A framework to prioritize green infrastructure to mitigate high temperatures in urban landscapes | Lists parameters for street greenery, city parks, green facades, and green roofs |
| [117] | Responses of tree species to heat waves and extreme heat events | Detailed description of parameters for trees |
| [118] | Vertical Greenery Systems (VGS) for energy saving in buildings: A review | Extensive parameter description for green walls and green facades |
| [71] | Cooling the cities–A review of reflective and green roof mitigation technologies to fight heat island and improve comfort in urban environments | Detailed comparison of the green roofs parameters |
| [119] | Quantifying the thermal performance of green façades: A critical review | Detailed description of green facades |
| [120] | REVIEW Effects of Evapotranspiration on Mitigation of Urban Temperature by Vegetation and Urban Agriculture | Parameters for green areas, green roofs, and water facilities |
| [81] | Evidence for the temperature-mitigating capacity of urban blue space–a health geographic perspective | Widely described water elements parameters |
| [121] | Performance evaluation and development strategies for green roofs in Taiwan: A review | Lists parameters for green areas, street greenery, and green roofs |
| [82] | Urban greening to cool towns and cities: A systematic review of the empirical evidence | Lists green roofs parameters |
| [122] | The International Urban Energy Balance Models Comparison Project: First Results from Phase 1 | Lists green areas parameters |
| BGI Structure | Parameter Family | Dominant Parameter | Number of Papers | Percentage |
|---|---|---|---|---|
| Water structures | 47 | 100 | ||
| Geometrical parameters | 15 | 31.92 | ||
| Area | 9 | - | ||
| Morphological parameters | 4 | 8.51 | ||
| The degree of vegetation along the banks | 2 | - | ||
| Topographic parameters | 28 | 59.57 | ||
| Wind exposure (trend of cold transfer) | 6 | - | ||
| Green areas | 231 | 100 | ||
| Geometrical parameters | 51 | 22.08 | ||
| Area | 32 | - | ||
| Morphological parameters | 125 | 54.11 | ||
| Percentage of an area covered by trees | 14 | - | ||
| Topographic parameters | 55 | 23.81 | ||
| Exposure to solar radiation/degree of shading of the area by surrounding structures | 6 | - | ||
| Greenery along the streets | 110 | 100 | ||
| Geometrical parameters | 26 | 23.48 | ||
| Tree crown width/tree crown diameter | 8 | - | ||
| Morphological parameters | 39 | 35.65 | ||
| Leaf size/LAI | 11 | - | ||
| Topographic parameters | 45 | 40.87 | ||
| Canyon geometry | 5 | - | ||
| Canyon Height | 5 | - | ||
| Canyon Width | 5 | - | ||
| Green roofs | 121 | 100 | ||
| Geometrical parameters | 20 | 16.80 | ||
| Substrate layer thickness | 10 | - | ||
| Morphological parameters | 92 | 76.80 | ||
| Degree of hydration/moisture of the substrate | 24 | - | ||
| Topographic parameters | 8 | 6.40 | ||
| The height of the structure above the ground | 2 | - | ||
| Distance from the nearest neighboring BGI (synergy) | 2 | - | ||
| Green walls | 59 | 100 | ||
| Geometrical parameters | 15 | 25.42 | ||
| Degree of vegetation coverage of a building/the extent of the green wall | 8 | - | ||
| Morphological parameters | 33 | 55.93 | ||
| Leaf width, leaf area, foliage density/LAI | 8 | - | ||
| Topographic parameters | 11 | 18.65 | ||
| Location relative to the directions of the world | 9 | - |
| Number of variables | 15 | ||
| Number of rejected variables | 4 | ||
| Number of permutations | 9999 | ||
| Parameter family | p-Value | F-Value | % Expl. |
| GW-Morpho. | 0.001 | 16.265 | 14.25 |
| SG-Topogr. | 0.001 | 14.632 | 11.14 |
| GA-Morpho. | 0.001 | 14.023 | 10.53 |
| GA-Geometry | 0.001 | 13.269 | 9.21 |
| GR-Morpho. | 0.001 | 10.961 | 8.36 |
| WO-Topogr. | 0.001 | 9.863 | 7.77 |
| SG-Morpho. | 0.002 | 9.569 | 7.54 |
| GA-Topogr. | 0.003 | 6.991 | 6.87 |
| GW-Geometry | 0.007 | 6.657 | 6.42 |
| GR-Geometry | 0.018 | 4.269 | 5.26 |
| SG-Geometry | 0.036 | 2.539 | 4.98 |
© 2020 by the authors. Licensee MDPI, Basel, Switzerland. This article is an open access article distributed under the terms and conditions of the Creative Commons Attribution (CC BY) license (http://creativecommons.org/licenses/by/4.0/).
Share and Cite
Antoszewski, P.; Świerk, D.; Krzyżaniak, M. Statistical Review of Quality Parameters of Blue-Green Infrastructure Elements Important in Mitigating the Effect of the Urban Heat Island in the Temperate Climate (C) Zone. Int. J. Environ. Res. Public Health 2020, 17, 7093. https://0-doi-org.brum.beds.ac.uk/10.3390/ijerph17197093
Antoszewski P, Świerk D, Krzyżaniak M. Statistical Review of Quality Parameters of Blue-Green Infrastructure Elements Important in Mitigating the Effect of the Urban Heat Island in the Temperate Climate (C) Zone. International Journal of Environmental Research and Public Health. 2020; 17(19):7093. https://0-doi-org.brum.beds.ac.uk/10.3390/ijerph17197093
Chicago/Turabian StyleAntoszewski, Patryk, Dariusz Świerk, and Michał Krzyżaniak. 2020. "Statistical Review of Quality Parameters of Blue-Green Infrastructure Elements Important in Mitigating the Effect of the Urban Heat Island in the Temperate Climate (C) Zone" International Journal of Environmental Research and Public Health 17, no. 19: 7093. https://0-doi-org.brum.beds.ac.uk/10.3390/ijerph17197093