Validity and Reliability of International Physical Activity Questionnaires for Adults across EU Countries: Systematic Review and Meta Analysis

 ,
, 
Abstract
:1. Introduction
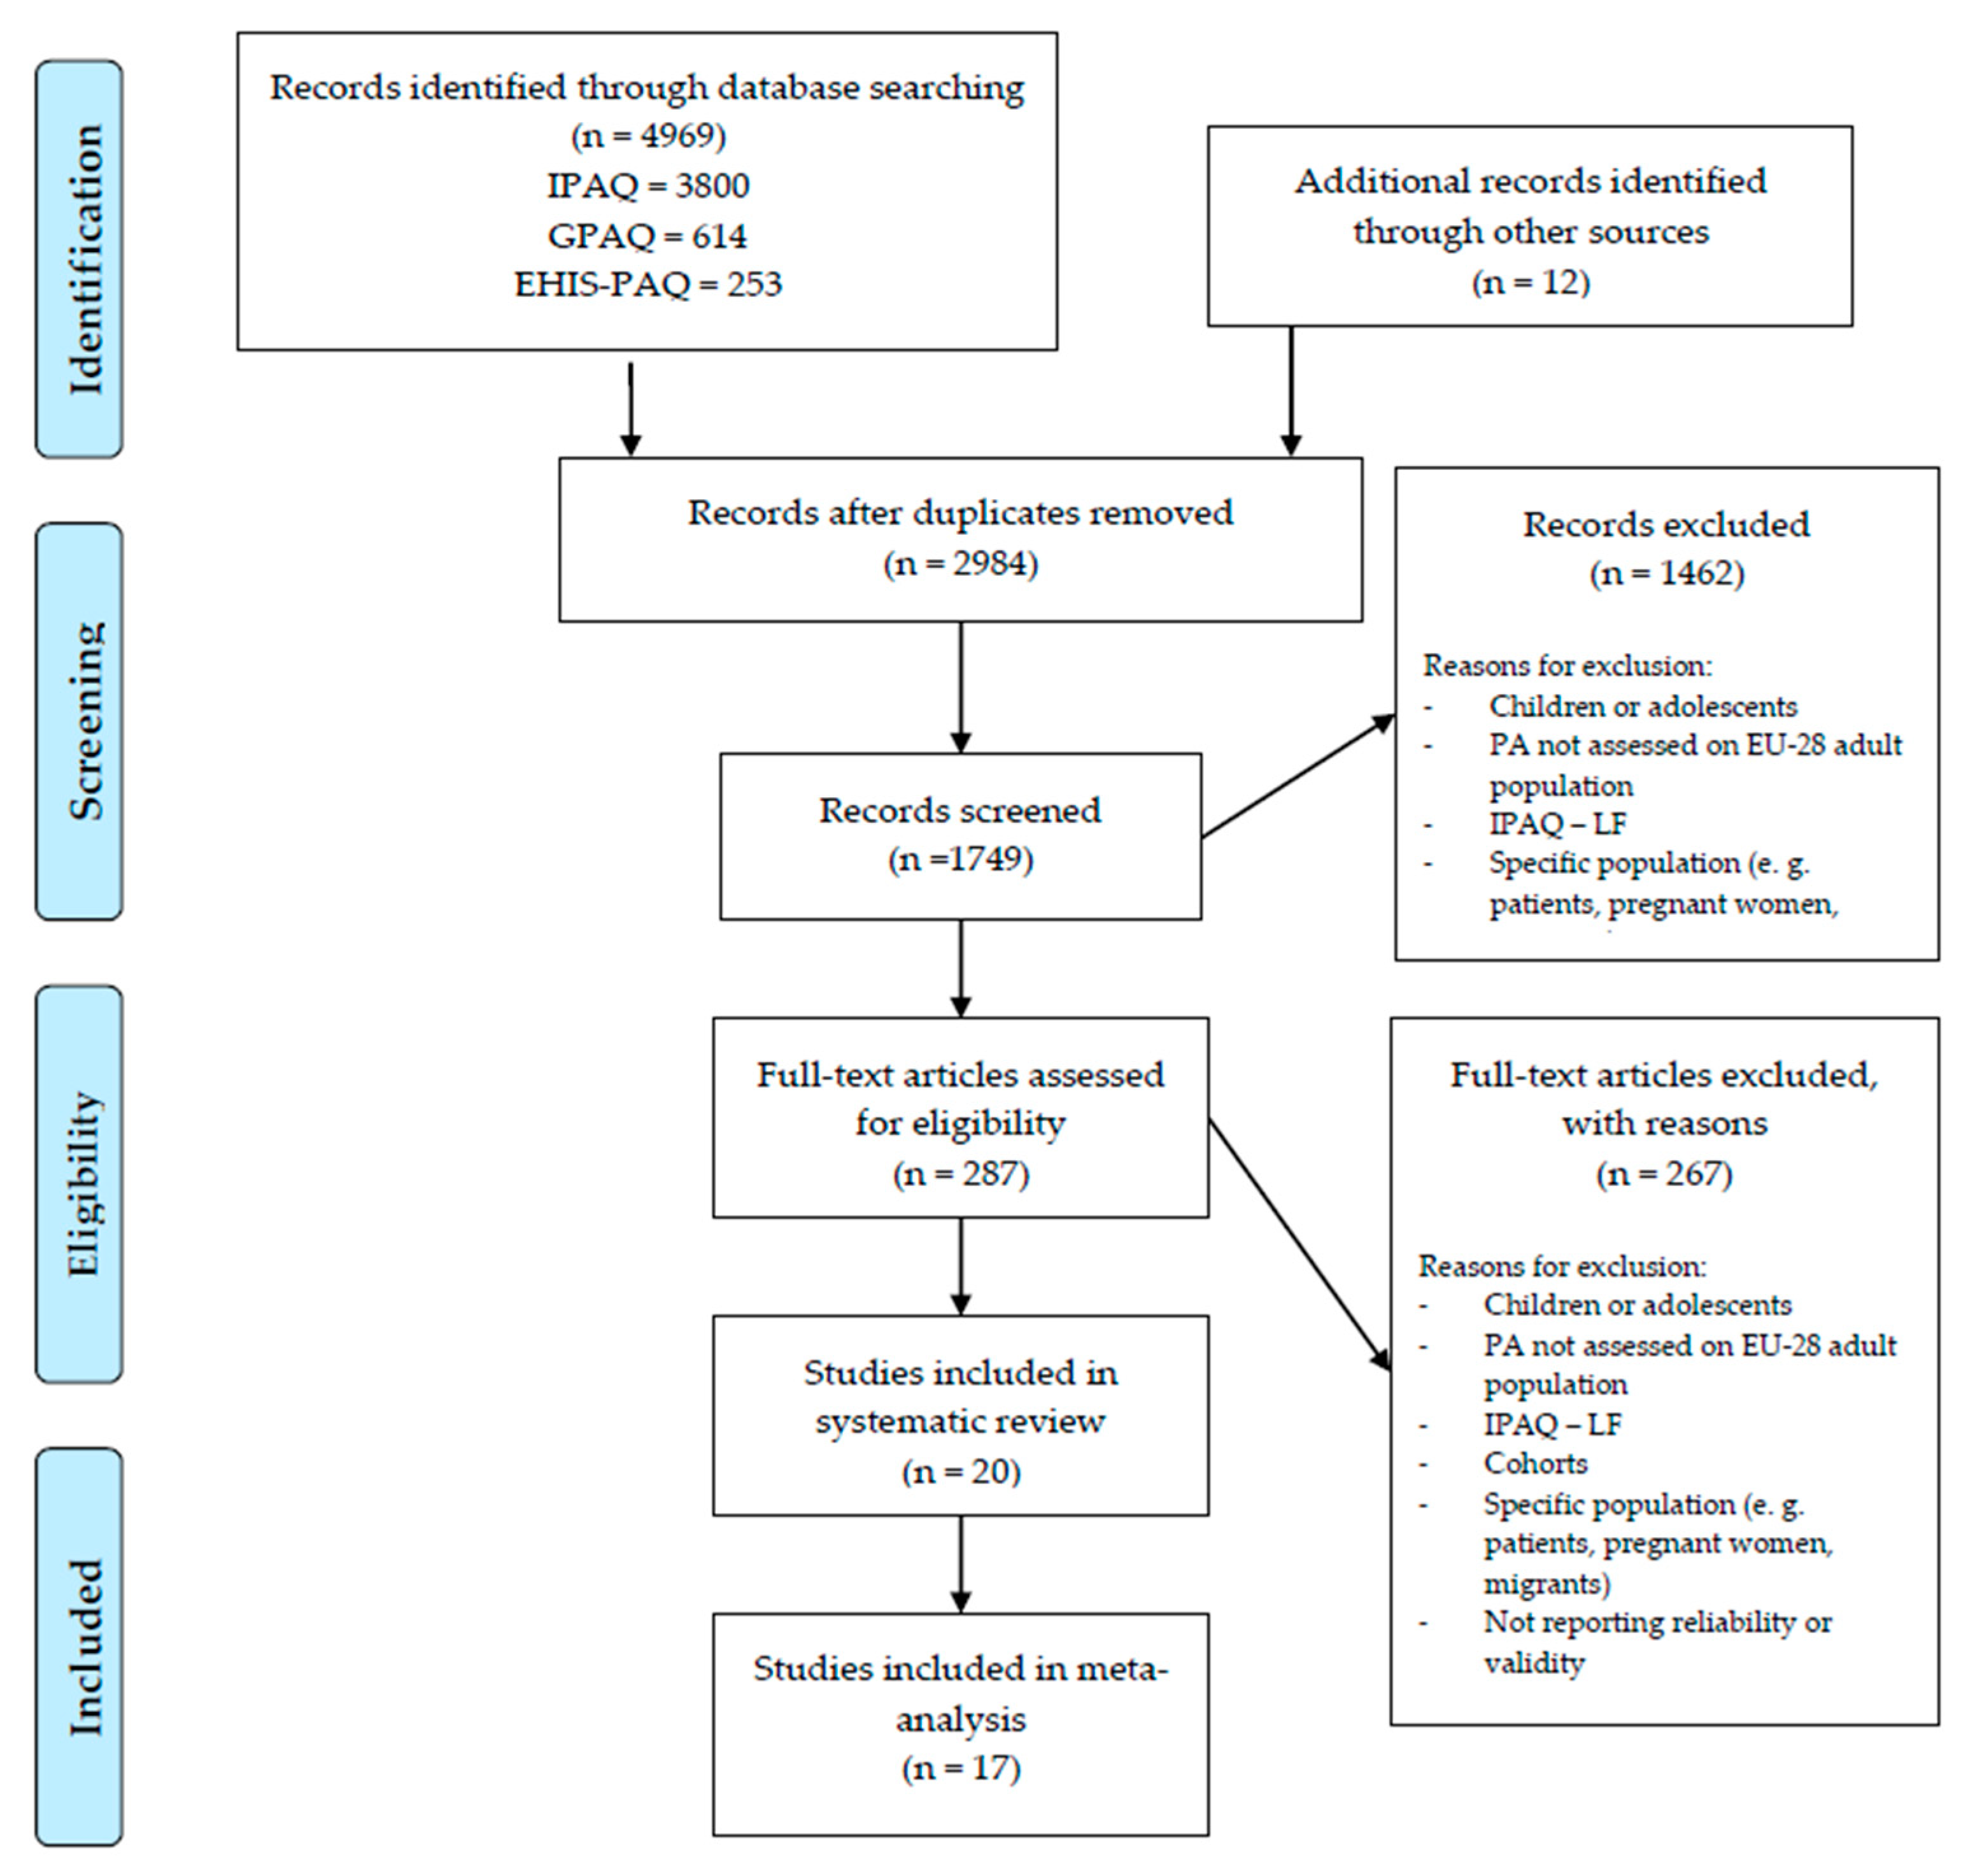
2. Materials and Methods
2.1. Search Strategy
2.2. Eligibility Criteria
2.3. Quality and Risk of Bias Assessment
2.4. Data Extraction and Statistical Analysis
2.5. Data Synthesis
2.6. Grading the Level of Evidence
3. Results
4. Discussion
Limitations
5. Conclusions
Author Contributions
Funding
Acknowledgments
Conflicts of Interest
References
- Hallal, P.C.; Andersen, L.B.; Bull, F.C.; Guthold, R.; Haskell, W.; Ekelund, U. Global Physical Activity Levels: Surveillance Progress, Pitfalls, and Prospects. Lancet 2012, 380, 247–257. [Google Scholar] [CrossRef]
- De Meester, F.; van Lenthe, F.J.; Spittaels, H.; Lien, N.; De Bourdeaudhuij, I. Interventions for Promoting Physical Activity among European Teenagers: A Systematic Review. Int. J. Behav. Nutr. Phys. Act. 2009, 6, 82. [Google Scholar] [CrossRef] [Green Version]
- Baranowski, T. Increasing Physical Activity among Children and Adolescents: Innovative Ideas Needed. J. Sport Health Sci. 2019, 8, 1–5. [Google Scholar] [CrossRef]
- Lewis, B.A.; Napolitano, M.A.; Buman, M.P.; Williams, D.M.; Nigg, C.R. Future Directions in Physical Activity Intervention Research: Expanding our Focus to Sedentary Behaviors, Technology, and Dissemination. J. Behav. Med. 2017, 40, 112–126. [Google Scholar] [CrossRef] [Green Version]
- Coughlin, S.S.; Stewart, J. Use of Consumer Wearable Devices to Promote Physical Activity: A Review of Health Intervention Studies. J. Environ. Health Sci. 2016, 2. [Google Scholar] [CrossRef]
- Andersen, L.B.; Andersen, S.A.; Bachl, N.; Banzer, W.; Brage, S.; Brettschneider, W.-D.; Ekelund, U.; Fogelholm, M.; Froberg, K.; Gil-Antunano, N.P. EU Physical Activity Guidelines: Recommended policy Actions in Support of Health-Enhacging Physical Activity Fourth Consolidated Draft, Approved by the EU-working Group. Available online: https://eacea.ec.europa.eu/sites/eacea-site/files/eu-physical-activity-guidelines-2008.pdf (accessed on 1 August 2020).
- WHO. Physical Activity Strategy for the WHO European Region 2016–2025; WHO: Geneva, Switzerland, 2015; ISBN 978-92-890-5147-7. [Google Scholar]
- European Commission. EU Action Plan on Childhood Obesity 2014–2020. A Growing Health Challenge for the EU; European Commission: Brusselss, Belgium, 2014; pp. 1–68. [Google Scholar]
- Warren, J.M.; Ekelund, U.; Besson, H.; Mezzani, A.; Geladas, N.; Vanhees, L. Assessment of Physical Activity–A Review of Methodologies with Reference to Epidemiological Research: A Report of the Exercise Physiology Section of the European Association of Cardiovascular Prevention and Rehabilitation. Eur. J. Cardiovasc. Prev. Rehabil. 2010, 17, 127–139. [Google Scholar] [CrossRef]
- Silfee, V.J.; Haughton, C.F.; Jake-Schoffman, D.E.; Lopez-Cepero, A.; May, C.N.; Sreedhara, M.; Rosal, M.C.; Lemon, S.C. Objective Measurement of Physical Activity Outcomes in Lifestyle Interventions among Adults: A Systematic Review. Prev. Med. Rep. 2018, 11, 74–80. [Google Scholar] [CrossRef]
- Dowd, K.P.; Szeklicki, R.; Minetto, M.A.; Murphy, M.H.; Polito, A.; Ghigo, E.; van der Ploeg, H.; Ekelund, U.; Maciaszek, J.; Stemplewski, R. A Systematic Literature Review of Reviews on Techniques for Physical Activity Measurement in Adults: A DEDIPAC Study. Int. J. Behav. Nutr. Phys. Act. 2018, 15, 15. [Google Scholar] [CrossRef]
- Bel-Serrat, S.; Huybrechts, I.; Thumann, B.F.; Hebestreit, A.; Abuja, P.M.; De Henauw, S.; Dubuisson, C.; Heuer, T.; Murrin, C.M.; Lazzeri, G. Inventory of Surveillance Systems Assessing Dietary, Physical Activity and Sedentary Behaviours in Europe: A DEDIPAC Study. Eur. J. Public Health 2017, 27, 747–755. [Google Scholar] [CrossRef] [Green Version]
- Helmerhorst, H.H.J.F.; Brage, S.; Warren, J.; Besson, H.; Ekelund, U. A Systematic Review of Reliability and Objective Criterion-Related Validity of Physical Activity Questionnaires. Int. J. Behav. Nutr. Phys. Act. 2012, 9, 103. [Google Scholar] [CrossRef] [Green Version]
- Pedišić, Ž.; Bauman, A. Accelerometer-Based Measures in Physical Activity Surveillance: Current Practices and Issues. Br. J. Sports Med. 2015, 49, 219–223. [Google Scholar] [CrossRef]
- Ferguson, T.; Rowlands, A.V.; Olds, T.; Maher, C. The Validity of Consumer-Level, Activity Monitors in Healthy Adults Worn in Free-Living Conditions: A Cross-Sectional Study. Int. J. Behav. Nutr. Phys. Act. 2015, 12, 42. [Google Scholar] [CrossRef] [Green Version]
- Corder, K.; Ekelund, U.; Steele, R.M.; Wareham, N.J.; Brage, S. Assessment of Physical Activity in Youth. J. Appl. Physiol. 2008, 105, 977–987. [Google Scholar] [CrossRef]
- Gastin, P.B.; Cayzer, C.; Dwyer, D.; Robertson, S. Validity of the ActiGraph GT3X+ and BodyMedia SenseWear Armband to Estimate Energy Expenditure during Physical Activity and Sport. J. Sci. Med. Sport 2018, 21, 291–295. [Google Scholar] [CrossRef]
- Kohl, H.W.; Cook, H.D.; Van Dusen, D.P.; Kelder, S.H.; Kohl, H.W.; Ranjit, N.; Perry, C.L. Educating the Study Body: Taking Physical Activity and Physical Education to School. Chapter 4: Physical Activity, Fitness, and Physical Education: Effects on Academic Performance; The National Academies Press: Washington, DC, USA, 2013. [Google Scholar]
- Skender, S.; Ose, J.; Chang-Claude, J.; Paskow, M.; Brühmann, B.; Siegel, E.M.; Steindorf, K.; Ulrich, C.M. Accelerometry and Physical Activity Questionnaires-A Systematic Review. BMC Public Health 2016, 16, 515. [Google Scholar] [CrossRef] [Green Version]
- Westerterp, K.R. Assessment of Physical Activity: A Critical Appraisal. Eur. J. Appl. Physiol. 2009, 105, 823–828. [Google Scholar] [CrossRef] [Green Version]
- Sirard, J.R.; Pate, R.R. Physical Activity Assessment in Children and Adolescents. Sports Med. 2001, 31, 439–454. [Google Scholar] [CrossRef]
- Prince, S.A.; Adamo, K.B.; Hamel, M.E.; Hardt, J.; Gorber, S.C.; Tremblay, M. A Comparison of Direct Versus Self-Report Measures for Assessing Physical Activity in Adults: A Systematic Review. Int. J. Behav. Nutr. Phys. Act. 2008, 5, 56. [Google Scholar] [CrossRef] [Green Version]
- Lee, I.-M.; Shiroma, E.J. Using Accelerometers to Measure Physical Activity in Large-Scale Epidemiological Studies: Issues And Challenges. Br. J. Sports Med. 2014, 48, 197–201. [Google Scholar] [CrossRef] [Green Version]
- An, H.-S.; Jones, G.C.; Kang, S.-K.; Welk, G.J.; Lee, J.-M. How Valid are Wearable Physical Activity Trackers for Measuring Steps? Eur. J. Sport Sci. 2017, 17, 360–368. [Google Scholar] [CrossRef]
- Bai, Y.; Welk, G.J.; Nam, Y.H.; Lee, J.A.; Lee, J.-M.; Kim, Y.; Meier, N.F.; Dixon, P.M. Comparison of Consumer and Research Monitors under Semistructured Settings. Med. Sci. Sports Exerc. 2016, 48, 151–158. [Google Scholar] [CrossRef]
- Lee, J.-M.; Kim, Y.-W.; Welk, G.J. TRACK IT: Validity and Utility of Consumer-Based Physical Activity Monitors. ACSMs Health Fit. J. 2014, 18, 16–21. [Google Scholar] [CrossRef]
- Nelson, M.B.; Kaminsky, L.A.; Dickin, D.C.; Montoye, A.H.K. Validity of Consumer-Based Physical Activity Monitors for Specific Activity Types. Med. Sci. Sports Exerc. 2016, 48, 1619–1628. [Google Scholar] [CrossRef] [Green Version]
- Sasaki, J.E.; Hickey, A.; Mavilia, M.; Tedesco, J.; John, D.; Keadle, S.K.; Freedson, P.S. Validation of the Fitbit Wireless Activity Tracker for Prediction of Energy Expenditure. J. Phys. Act. Health 2015, 12, 149–154. [Google Scholar] [CrossRef]
- Gomersall, S.R.; Ng, N.; Burton, N.W.; Pavey, T.G.; Gilson, N.D.; Brown, W.J. Estimating Physical Activity and Sedentary Behavior in A Free-Living Context: A Pragmatic Comparison of Consumer-Based Activity Trackers and ActiGraph Accelerometry. J. Med. Internet Res. 2016, 18, e239. [Google Scholar] [CrossRef]
- Price, K.; Bird, S.R.; Lythgo, N.; Raj, I.S.; Wong, J.Y.L.; Lynch, C. Validation of the Fitbit One, Garmin Vivofit and Jawbone UP Activity Tracker in Estimation of Energy Expenditure during Treadmill Walking and Running. J. Med. Eng. Technol. 2017, 41, 208–215. [Google Scholar] [CrossRef]
- Loyen, A.; Van Hecke, L.; Verloigne, M.; Hendriksen, I.; Lakerveld, J.; Steene-Johannessen, J.; Vuillemin, A.; Koster, A.; Donnelly, A.; Ekelund, U. Variation in Population Levels of Physical Activity in European Adults According to Cross-European Studies: A Systematic Literature Review within DEDIPAC. Int. J. Behav. Nutr. Phys. Act. 2016, 13, 72. [Google Scholar] [CrossRef] [Green Version]
- Falck, R.S.; McDonald, S.M.; Beets, M.W.; Brazendale, K.; Liu-Ambrose, T. Measurement of Physical Activity in Older Adult Interventions: A Systematic Review. Br. J. Sports Med. 2016, 50, 464–470. [Google Scholar] [CrossRef]
- Craig, C.L.; Marshall, A.L.; Sjöström, M.; Bauman, A.E.; Booth, M.L.; Ainsworth, B.E.; Pratt, M.; Ekelund, U.L.F.; Yngve, A.; Sallis, J.F. International Physical Activity Questionnaire: 12-Country Reliability and Validity. Med. Sci. Sports Exerc. 2003, 35, 1381–1395. [Google Scholar] [CrossRef] [Green Version]
- Finger, J.D.; Gisle, L.; Mimilidis, H.; Santos-Hoevener, C.; Kruusmaa, E.K.; Matsi, A.; Oja, L.; Balarajan, M.; Gray, M.; Kratz, A.L. How Well Do Physical Activity Questions Perform? A European Cognitive Testing Study. Arch. Public Health 2015, 73, 57. [Google Scholar] [CrossRef] [Green Version]
- Bull, F.C.; Maslin, T.S.; Armstrong, T. Global Physical Activity Questionnaire (GPAQ): Nine Country Reliability and Validity Study. J. Phys. Act. Health 2009, 6, 790–804. [Google Scholar] [CrossRef] [Green Version]
- Bauman, A.; Ainsworth, B.E.; Bull, F.; Craig, C.L.; Hagströmer, M.; Sallis, J.F.; Pratt, M.; Sjöström, M. Progress and Pitfalls in the Use of the International Physical Activity Questionnaire (IPAQ) for Adult Physical Activity Surveillance. J. Phys. Act. Health 2009, 6, S5–S8. [Google Scholar] [CrossRef] [Green Version]
- Van Poppel, M.N.M.; Chinapaw, M.J.M.; Mokkink, L.B.; Van Mechelen, W.; Terwee, C.B. Physical Activity Questionnaires for Adults. Sports Med. 2010, 40, 565–600. [Google Scholar] [CrossRef]
- Lee, P.H.; Macfarlane, D.J.; Lam, T.H.; Stewart, S.M. Validity of the International Physical Activity Questionnaire Short form (IPAQ-SF): A Systematic Review. Int. J. Behav. Nutr. Phys. Act. 2011, 8, 115. [Google Scholar] [CrossRef] [Green Version]
- European Commission. Special Eurobarometer 472; European Commission: Brusselss, Belgium, 2018; pp. 1–32. [Google Scholar]
- World Health Organization. Review of Physical Activity Surveillance Data Sources in European Union Member States; WHO Regional Office for Europe: Copenhagen, Denmark, 2011; pp. 1–68. [Google Scholar]
- Riley, L.; Guthold, R.; Cowan, M.; Savin, S.; Bhatti, L.; Armstrong, T.; Bonita, R. The World Health Organization STEP Wise Approach to Noncommunicable Disease Risk-Factor Surveillance: Methods, Challenges, And Opportunities. Am. J. Public Health 2016, 106, 74–78. [Google Scholar] [CrossRef]
- Finger, J.D.; Tafforeau, J.; Gisle, L.; Oja, L.; Ziese, T.; Thelen, J.; Mensink, G.B.M.; Lange, C. Development of the European Health Interview Survey-Physical Activity Questionnaire (EHIS-PAQ) to Monitor Physical Activity in the European Union. Arch. Public Health 2015, 73, 59. [Google Scholar] [CrossRef] [Green Version]
- Wolin, K.Y.; Heil, D.P.; Askew, S.; Matthews, C.E.; Bennett, G.G. Validation of the International Physical Activity Questionnaire-Short Among Blacks. J. Phys. Act. Health 2008, 5, 746–760. [Google Scholar] [CrossRef] [Green Version]
- Mannocci, A.; Di Thiene, D.; Del Cimmuto, A.; Masala, D.; Boccia, A.; De Vito, E.; La Torre, G. International Physical Activity Questionnaire: Validation And Assessment in An Italian Sample. Ital. J. Public Health 2010, 7, 369–376. [Google Scholar] [CrossRef]
- Hoos, M.B.; Plasqui, G.; Gerver, W.-J.M.; Westerterp, K.R. Physical Activity Level Measured by Doubly Labeled Water and Accelerometry in Children. Eur. J. Appl. Physiol. 2003, 89, 624–626. [Google Scholar] [CrossRef]
- Baumeister, S.E.; Ricci, C.; Kohler, S.; Fischer, B.; Töpfer, C.; Finger, J.D.; Leitzmann, M.F. Physical Activity Surveillance in the European Union: Reliability and Validity of the European Health Interview Survey-Physical Activity Questionnaire (EHIS-PAQ). Int. J. Behav. Nutr. Phys. Act. 2016, 13, 61. [Google Scholar] [CrossRef] [Green Version]
- Kim, Y.; Park, I.; Kang, M. Convergent Validity of the International Physical Activity Questionnaire (IPAQ): Meta-analysis. Public Health Nutr. 2013, 16, 440–452. [Google Scholar] [CrossRef] [Green Version]
- Bakker, E.A.; Hartman, Y.A.W.; Hopman, M.T.E.; Hopkins, N.D.; Graves, L.E.F.; Dunstan, D.W.; Healy, G.N.; Eijsvogels, T.M.H.; Thijssen, D.H.J. Validity and Reliability of Subjective Methods to Assess Sedentary Behaviour in Adults: A Systematic Review and Meta-Analysis. Int. J. Behav. Nutr. Phys. Act. 2020, 17, 1–31. [Google Scholar] [CrossRef]
- Keating, X.D.; Zhou, K.; Liu, X.; Hodges, M.; Liu, J.; Guan, J.; Phelps, A.; Castro-Piñero, J. Reliability and Concurrent Validity of Global Physical Activity Questionnaire (GPAQ): A Systematic Review. Int. J. Environ. Res. Public Health 2019, 16, 4128. [Google Scholar] [CrossRef] [Green Version]
- Moher, D.; Liberati, A.; Tetzlaff, J.; Altman, D.G.; Group, P. Preferred Reporting Items for Systematic Reviews and Meta-Analyses: The PRISMA Statement. PLoS Med. 2009, 6, e1000097. [Google Scholar] [CrossRef] [Green Version]
- Moher, D.; Shamseer, L.; Clarke, M.; Ghersi, D.; Liberati, A.; Petticrew, M.; Shekelle, P.; Stewart, L.A. Preferred Reporting Items for Systematic Review and Meta-Analysis Protocols (PRISMA-P) 2015 Statement. Syst. Rev. 2015, 4, 1. [Google Scholar] [CrossRef] [Green Version]
- Sneck, S.; Viholainen, H.; Syväoja, H.; Kankaapää, A.; Hakonen, H.; Poikkeus, A.-M.; Tammelin, T. Effects of School-Based Physical Activity on Mathematics Performance in Children. Int. J. Behav. Nutr. Phys. Act. 2019, 16, 109. [Google Scholar] [CrossRef] [Green Version]
- Sember, V.; Jurak, G.; Kovač, M.; Morrison, S.A.; Starc, G. Children’s Physical Activity, Academic Performance and Cognitive Functioning: A Systematic Review And Meta-Analysis. Front. Public Health 2020, 8, 307. [Google Scholar] [CrossRef]
- Terwee, C.B.; Mokkink, L.B.; van Poppel, M.N.M.; Chinapaw, M.J.M.; van Mechelen, W.; de Vet, H.C.W. Qualitative Attributes and Measurement Properties of Physical Activity Questionnaires. Sports Med. 2010, 40, 525–537. [Google Scholar] [CrossRef]
- Egger, M.; Smith, G.D.; Schneider, M.; Minder, C. Bias in Meta-Analysis Detected by A Simple, Graphical Test. BMJ 1997, 315, 629–634. [Google Scholar] [CrossRef] [Green Version]
- Hunter, J.E.; Schmidt, F.L.; Le, H. Implications of Direct and Indirect Range Restriction for Meta-Analysis Methods and Findings. J. Appl. Psychol. 2006, 91, 594. [Google Scholar] [CrossRef] [Green Version]
- Teugels, J.L.; Vet, H. Observer Reliability and Agreement. Wiley StatsRef Stat. Ref. Online 2014. [Google Scholar] [CrossRef]
- Plasqui, G.; Westerterp, K.R. Physical Activity Assessment with Accelerometers: An Evaluation Against Doubly Labeled Water. Obesity 2007, 15, 2371–2379. [Google Scholar] [CrossRef]
- Laeremans, M.; Dons, E.; Avila-Palencia, I.; Carrasco-Turigas, G.; Orjuela, J.P.; Anaya, E.; Brand, C.; Cole-Hunter, T.; de Nazelle, A.; Götschi, T. Physical Activity and Sedentary Behaviour in Daily Life: A Comparative Analysis of the Global Physical Activity Questionnaire (GPAQ) and the SenseWear armband. PLoS ONE 2017, 12, e0177765. [Google Scholar] [CrossRef] [Green Version]
- Rütten, A.; Vuillemin, A.; Ooijendijk, W.T.M.; Schena, F.; Sjöström, M.; Stahl, T.; Vanden Auweele, Y.; Welshman, J.; Ziemainz, H. Physical Activity Monitoring in Europe. The European Physical Activity Surveillance System (EUPASS) Approach and Indicator Testing. Public Health Nutr. 2003, 6, 377–384. [Google Scholar] [CrossRef] [PubMed] [Green Version]
- De La Cámara, M.A.; Higueras-Fresnillo, S.; Cabanas-Sánchez, V.; Sadarangani, K.P.; Martinez-Gomez, D.; Veiga, Ó.L. Criterion Validity of the Sedentary Behavior Question from the Global Physical Activity Questionnaire in Older Adults. J. Phys. Act. Health 2020, 17, 2–12. [Google Scholar] [CrossRef] [PubMed]
- Cleland, C.L.; Hunter, R.F.; Kee, F.; Cupples, M.E.; Sallis, J.F.; Tully, M.A. Validity of the Global Physical Activity Questionnaire (GPAQ) in Assessing Levels and Change in Moderate-Vigorous Physical Activity and Sedentary Behaviour. BMC Public Health 2014, 14, 1255. [Google Scholar] [CrossRef] [PubMed] [Green Version]
- Ekelund, U.; Sepp, H.; Brage, S.; Becker, W.; Jakes, R.; Hennings, M.; Wareham, N.J. Criterion-Related Validity of the Last 7-Day, Short Form of the International Physical Activity Questionnaire in Swedish Adults. Public Health Nutr. 2006, 9, 258–265. [Google Scholar] [CrossRef]
- Kalvenas, A.; Burlacu, I.; Abu-Omar, K. Reliability and Validity of the International Physical Activity Questionnaire in Lithuania. Balt. J. Heal. Phys. Act. 2016, 8, 29–41. [Google Scholar] [CrossRef]
- Kleinauskienė, L. Tarptautinio Fizinio Aktyvumo Klausimyno Trumposios Lietuviškos Versijos (IPAQ-LT) Patikimumo Ir Pagrįstumo Nustatymas; Lithuanian Sports University: Kaunas, Lithuania, 2012; pp. 3–52. [Google Scholar]
- Kastelic, K.; Šarabon, N. Comparison of Self-Reported Sedentary Time on Weekdays with An Objective Measure (activPAL). Meas. Phys. Educ. Exerc. Sci. 2019, 23, 227–236. [Google Scholar] [CrossRef]
- Milton, K.; Bull, F.C.; Bauman, A. Reliability and Validity Testing of A Single-Item Physical Activity Measure. Br. J. Sports Med. 2011, 45, 203–208. [Google Scholar] [CrossRef]
- Murphy, J.J.; Murphy, M.H.; MacDonncha, C.; Murphy, N.; Nevill, A.M.; Woods, C.B. Validity and Reliability of Three Self-Report Instruments for Assessing Attainment of Physical Activity Guidelines in University Students. Meas. Phys. Educ. Exerc. Sci. 2017, 21, 134–141. [Google Scholar] [CrossRef]
- Novak, B.; Holler, P.; Jaunig, J.; Ruf, W.; van Poppel, M.N.M.; Sattler, M.C. Do We Have To Reduce the Recall Period? Validity of A Daily Physical Activity Questionnaire (PAQ24) in Young Active Adults. BMC Public Health 2020, 20, 72. [Google Scholar] [CrossRef] [PubMed] [Green Version]
- Rivière, F.; Widad, F.Z.; Speyer, E.; Erpelding, M.-L.; Escalon, H.; Vuillemin, A. Reliability and Validity of the French Version of the Global Physical Activity Questionnaire. J. Sport Heal. Sci. 2018, 7, 339–345. [Google Scholar] [CrossRef] [PubMed] [Green Version]
- Rudolf, K.; Lammer, F.; Stassen, G.; Froböse, I.; Schaller, A. Show Cards of the Global Physical Activity Questionnaire (GPAQ)–do They Impact Validity? A Crossover Study. BMC Public Health 2020, 20, 223. [Google Scholar] [CrossRef] [PubMed] [Green Version]
- Taylor, N.J.; Crouter, S.E.; Lawton, R.J.; Conner, M.T.; Prestwich, A. Development and Validation of the Online Self-Reported Walking and Exercise Questionnaire (OSWEQ). J. Phys. Act. Health 2013, 10, 1091–1101. [Google Scholar] [CrossRef]
- Vinas, B.R.; Barba, L.R.; Ngo, J.; Majem, L.S. Validación en población catalana del cuestionario internacional de actividad física. Gac. Sanit. 2013, 27, 254–257. [Google Scholar] [CrossRef] [Green Version]
- Rodríguez-Muńoz, S.; Corella, C.; Abarca-Sos, A.; Zaragoza, J. Validation of Three Short Physical Activity Questionnaires with Accelerometers among University Students in Spain. J. Sports Med. Phys. Fit. 2017, 57, 1660. [Google Scholar] [CrossRef]
- Scholes, S.; Bridges, S.; Fat, L.N.; Mindell, J.S. Comparison of the Physical Activity and Sedentary Behaviour Assessment Questionnaire and the Short-Form International Physical Activity Questionnaire: An Analysis of Health Survey for England Data. PLoS ONE 2016, 11, e0151647. [Google Scholar] [CrossRef]
- Rütten, A.; Ziemainz, H.; Schena, F.; Stahl, T.; Stiggelbout, M.; Vanden Auweele, Y.; Vuillemin, A.; Welshman, J. Using Different Physical Activity Measurements in Eight European Countries. Results of the European Physical Activity Surveillance System (EUPASS) Time Series Survey. Public Health Nutr. 2003, 6, 371–376. [Google Scholar] [CrossRef] [Green Version]
- Lameck, W.U. Sampling Design, Validity and Reliability in General Social Survey. Int. J. Acad. Res. Bus. Soc. Sci. 2013, 3, 212–218. [Google Scholar] [CrossRef] [Green Version]
- Meyers, R.M.; Bryan, J.G.; McFarland, J.M.; Weir, B.A.; Sizemore, A.E.; Xu, H.; Dharia, N.V.; Montgomery, P.G.; Cowley, G.S.; Pantel, S. Computational Correction of Copy Number Effect Improves Specificity of CRISPR–Cas9 Essentiality Screens in Cancer Cells. Nat. Genet. 2017, 49, 1779–1784. [Google Scholar] [CrossRef] [PubMed] [Green Version]
- Jinyuan, L.I.U.; Wan, T.; Guanqin, C.; Yin, L.U.; Changyong, F. Correlation and Agreement: Overview and Clarification of Competing Concepts and Measures. Shanghai Arch. Psychiatry 2016, 28, 115–120. [Google Scholar] [CrossRef]
- Sallis, J.F.; Saelens, B.E. Assessment of Physical Activity by Self-Report: Status, Limitations, and Future Directions. Res. Q. Exerc. Sport 2000, 71, 1–14. [Google Scholar] [CrossRef] [PubMed]
- Hansen, B.H.; Børtnes, I.; Hildebrand, M.; Holme, I.; Kolle, E.; Anderssen, S.A. Validity of the ActiGraph GT1M during Walking And Cycling. J. Sports Sci. 2014, 32, 510–516. [Google Scholar] [CrossRef] [PubMed]
- Abarca-Gómez, L.; Abdeen, Z.A.; Hamid, Z.A.; Abu-Rmeileh, N.M.; Acosta-Cazares, B.; Acuin, C.; Adams, R.J.; Aekplakorn, W.; Afsana, K.; Aguilar-Salinas, C.A. Worldwide Trends in Body-Mass Index, Underweight, Overweight, and Obesity from 1975 to 2016: A Pooled Analysis of 2416 Population-Based Measurement Studies in 1289 Million Children, Adolescents, and Adults. Lancet 2017, 390, 2627–2642. [Google Scholar] [CrossRef] [Green Version]
- Voss, M.W.; Weng, T.B.; Burzynska, A.Z.; Wong, C.N.; Cooke, G.E.; Clark, R.; Fanning, J.; Awick, E.; Gothe, N.P.; Olson, E.A. Fitness, but not Physical Activity, is Related to Functional Integrity of Brain Networks Associated with Aging. Neuroimage 2016, 131, 113–125. [Google Scholar] [CrossRef] [Green Version]
- Sylvia, L.G.; Bernstein, E.E.; Hubbard, H.L.; Keating, L.; Anderson, E.J. A Practical Guide to Measuring Physical Activity. J. Acad. Nutr. Diet. 2014, 114, 199–208. [Google Scholar] [CrossRef] [Green Version]
- Sattler, M.C.; Jaunig, J.; Tösch, C.; Watson, E.D.; Mokkink, L.B.; Dietz, P.; van Poppel, M.N. Current Evidence of Measurement Properties of Physical Activity Questionnaires for Older Adults: An Updated Systematic Review. Sports Med. 2020, 50, 1271–1315. [Google Scholar] [CrossRef] [Green Version]


| Author (PAQ) Language Version | Country | Population ** | Construct | Format | |||||||||
|---|---|---|---|---|---|---|---|---|---|---|---|---|---|
| Size | Age; (Range) | Gender (Male, Female) | Sample Description | Dimension | Setting | Recall Period | No. of Q | Mode and Means of Administration | Parameters | Scores | Unit of Measurement | ||
| Baumeister et al. [46] (EHIS-PAQ) German | DE | 140 | 55 (18–79) | 73 + 67 | Random community sample | Sitting, LPA, MPA, VPA | Work-related PA, transport, leisure time, sport activities, HEPA, sedentary | 30-days | 9 | Self-administered Unknown mode | Duration, frequency | MVPA, LPA | Min/day, MET *min |
| Bull et al. [35] (GPAQ), Portugese | PT | 67 | 18–75 | 17 + 50 | Prevalence of young participants (18–44, n = 56) Convenient regional sample | Sitting, MPA, VPA | Work-related PA, transport, leisure time, sedentary | 7-days | 19 | Interview Unknown mode | Duration. frequency | VPA, MPA, TPA, sedentary | Min |
| Cámara et al. [61] (GPAQ), Spanish | ES | 163 | 70 (67–75) | 67 + 96 | Older adults from IMPACT65+ study | Sitting | Sedentary time | 7-days | 1 | Interview Face to face | Duration, frequency | Sedentary time | Min |
| Cleland et al. [62] (GPAQ), English | UK | 22 | 46 | 8 + 14 | Random national sample | Sitting, MPA, VPA | Work-related PA, transport, leisure time, sedentary | 7-days | 16 | Self-administered Unknown mode | Duration, frequency | MVPA, sedentary | Min/day |
| Craig et al. [33] (IPAQ-SF), German, English, Finnish, Dutch, Portugese, Sweedish | Cross-national: AT, UK, FI, NL, PT, SE | 2115: 200 SE1 50 SE2; 149 UK1 101 UK2 88 FI 196 PT 74 NL | 47 41 35 41 56 35 33 | 77 + 123 22 + 28 68 + 81 38 + 63 43 + 45 96 + 100 34 + 40 | Specific populations Convenient samples, but collectively, the participants represented a wide range of age, education, income, and activity levels | Sitting, MPA, VPA | Leisure time PA, domestic and gardening activities, work-related PA, transport-related PA | 7-days | 9 | Self- administered Unknown modes | Duration. frequency | Categorical measure of % min/week | Min/week |
| Ekelund et al. [63] (IPAQ-SF), Sweedish | SE | 185 | 42 (20–69) | 93 + 92 | Workers and students Convenient regional sample | Sitting, MVPA | Leisure time PA, domestic and gardening activities, work-related PA, transport-related PA | 7-days | 7 | Telephone interview | Duration. frequency | MVPA | MET min/day. MET min/week |
| Kalvenas et al. [64] (IPAQ-SF), Lithuanian | LT | 92 # | 18–69 | reliability 29 + 63 validity 23 + 58 | Employees of university and private company Convenient sample from urban area | Sitting, MPA, VPA | Leisure time PA, domestic and gardening activities, work-related PA, transport-related PA | 7-days | 9 | Self-administered Unknown mode | Duration. frequency | VPA, MPA+walking, MPA, WPA, sitting, TPA | |
| Kastelic et al. [66] (GPAQ), Slovenian | SI | 42 | M 39 F 50 | 37 + 5 | Crane operators and office workers Convenient sample | Sitting, MPA, VPA | Work-related PA, transport, leisure time, sedentary | 7-days | 16 | Interview Unknown mode | Duration. frequency | sedentary | Min/day |
| Kleinauskiene et al. [65] (IPAQ-SF), Lithuanian | LT | 92 | 18–69 | 29 + 63 | Convenient sample from Kaunas city | Sitting, MPA, VPA | Leisure time PA, domestic and gardening activities, work-related PA, transport-related PA | 7-days | 9 | Self-administered | Duration. frequency | MET min/week | MET, min/week |
| Laeremans et al. [59] (GPAQ), German, Spanish, English | Cross-national: B. ES, UK | 122: 41 B; 41 ES; 40 UK | 35 | 55 + 67 | Random regional sample | Sitting, MPA, VPA | Work-related PA, transport, leisure time, sedentary | 7-days | 16 | Self-administered Online | Duration. frequency | MPA, MVPA, VPA, sedentary | MET min/week |
| Milton et al. [67] (GPAQ), English | UK | 240 | 18–64 | 119 + 121 | Quota sample from across England, Scotland and Wales | Sitting, MPA, VPA | Work-related PA, transport, leisure time, sedentary | 7-days | 16 | Telephone interview | Duration. frequency | MVPA | Min/day |
| Murphy et al. [68] (IPAQ-SF), English | IE | 155 ## | 23 | 69 + 86 | Students Convenient sample | Sitting, MPA, VPA | Leisure time PA, domestic and gardening activities, work-related PA, transport-related PA | 7-days | 9 | Self-administered Unknown mode | Duration. frequency | MVPA as % in PA population | Min/week |
| Novak et al. [69] (GPAQ), German | AT | 50 | 25 | 39 + 11 | Students Convenient sample | Sitting, Total PA, VPA | Work-related PA, transport, leisure time, sedentary | 7-days | 16 | Self-administered Unknown mode | Duration. frequency | Total PA, VPA, sedentary | Min/week |
| Rivière et al. [70] (GPAQ), French | FR | 87 ### | 30 | 25 + 67 | Medical personnel and students, convenience sample | Sitting, MPA, VPA | Work-related PA, transport, leisure time, sedentary | 7-days | 16 | Interview and self-administered Unknown mode | Duration. frequency | LPA, VPA, TPA, MVPA | Min/day |
| Rodríguez-Muńoz et. al. [74] (IPAQ) | ES | 95 | 22 | 33+ 62 | University students Convenience sample | Sitting, MPA, VPA | Moderate-to-vigorous PA | 7-days | Self-administered Unknown mode | Duration. frequency | MVPA | Min/day | |
| Rudolf et al. [71] (GPAQ), German | DE | 54 | 28 | 23 + 31 | University students Convenience sample | MPA, VPA, Sitting | Work-related PA, transport, leisure time, sedentary | 7 days | 16 | Self- administered Online | Duration. frequency | MPA, VPA, sedentary | Min/day |
| Rütten et al. [60] (IPAQ–SF), German, Finnish, French, Italian, Dutch, Spanish, English | Cross-national: B, FI, FR, DE, I, NL, ES, UK | 951: 100 B; 127 FI; 91 FR; 223 GR; 98 I; 86 N; 128 S; 98 UK | >18 | unknown | Random sample | Sitting, MPA, VPA | Leisure time PA, domestic and gardening activities, work-related PA, transport-related PA | 7-days | 9 | Interview Face to face | Duration. frequency | VPA, MPA, sedentary | Min/week, MET |
| Scholes et al. [75] (IPAQ-SF), English | UK | 1252 | >16 | Unknown | Multistage stratified probability sampling | Sitting, MPA, VPA | Leisure time PA, domestic and gardening activities, work-related PA, transport-related PA | 7-days | 9 | Self-administered Pen and paper | Duration. frequency | Categorical MVPA | Min/week |
| Taylor et al. [72] (IPAQ-SF), English | UK | 49 | 27 | 11 + 38 | Students and university staff Convenient sample | Sitting, MPA, VPA | Leisure time PA, domestic and gardening activities, work-related PA, transport-related PA | 7-days | 9 | Self-administered Online | Duration. frequency | MPA, MVPA | MET min/day |
| Vinas et al. [73] (IPAQ-SF), Spanish | ES | 24 | 41 | 26 + 29 | Convenient sample 91% of the participants had a high level of education | Sitting, MPA, VPA | Leisure time PA, domestic and gardening activities, work-related PA, transport-related PA | 7-days | 9 | Self-administered (Catalan version) Unknown mode | Duration. frequency | Min/day | |
| Reference (PAQ) | Study Pop | Method | Construct (Comparison Method) | Results | Rating |
|---|---|---|---|---|---|
| Baumeister et al. [46] (EHIS-PAQ) | DE | TRR | MVPA | ICC = 0.73 | 1 |
| CRV | MVPA (ActiGraph GT3X) | ICC = 0.32 | 3 | ||
| CCV | MVPA (IPAQ-L) | ICC = 0.45 | 2 | ||
| MVPA (7-d PAR) | ICC = 0.26 | 3 | |||
| Bull et al. [35] (GPAQ) | PT | CCV | VPA (IPAQ-SF) | Spearman ρ = 0.52 | 2 |
| MPA (IPAQ-SF) | Spearman ρ = 0.50 | 2 | |||
| tPA (IPAQ-SF) | Spearman ρ = 0.23 | 3 | |||
| Cleland et al. [62] (GPAQ) | UK | CRV | MVPA (ActiGraph GT3X) | Spearman ρ = 0.48 | 3 |
| Craig et al. [33] (IPAQ) | SE 1 | TRR | Total PA | Spearman ρ = 0.66 | 3 |
| CCV | tPA 1st session (IPAQ L7T) | Spearman ρ = 0.6 | 2 | ||
| tPA 2nd session (IPAQ L7T) | Spearman ρ = 0.63 | 2 | |||
| UK1 | TRR | tPA | Spearman ρ = 0.87 | 2 | |
| UK2 | TRR | tPA | Spearman ρ = 0.69 | 3 | |
| CRV | tPA (CSA motion detector MTI) | Spearman ρ = 0.40 | 3 | ||
| FI | TRR | tPA | Spearman ρ = 0.65 | 2 | |
| CRV | tPA (CSA motion detector MTI) | Spearman ρ = 0.47 | 3 | ||
| CVV | tPA 1st session (IPAQ LUS) | Spearman ρ = 0.68 | 2 | ||
| tPA 2nd session (IPAQ LUS) | Spearman ρ = 0.71 | 2 | |||
| PT | TRR | tPA | Spearman ρ = 0.77 | 2 | |
| CCV | tPA 1st session (IPAQ LUS) | Spearman ρ = 0.49 | 3 | ||
| tPA 2nd session (IPAQ LUS) | Spearman ρ = 0.43 | 3 | |||
| SE 2 | TRR | tPA | Spearman ρ = 0.77 | 2 | |
| CRV | tPA (CSA motion detector MTI) | Spearman ρ = 0.02 | 3 | ||
| CCV | tPA 1st session (IPAQ LUS) | Spearman ρ = 0.77 | 2 | ||
| tPA 2nd session (IPAQ LUS) | Spearman ρ = 0.87 | 2 | |||
| NL | TRR | tPA | Spearman ρ = 0.85 | 2 | |
| CRV | tPA (CSA motion detector MTI) | Spearman ρ = 0.32 | 3 | ||
| CCV | tPA 1st session (IPAQ L7T) | Spearman ρ = 0.85 | 1 | ||
| tPA 2nd session (IPAQ L7T) | Spearman ρ = 0.88 | 1 | |||
| Ekelund et al. [62] (IPAQ) | SE | CRV | MVPA (ActiGraph) | Pearson r = 0.17 | 3 |
| tPA (ActiGraph) | Pearson r = 0.34 | 3 | |||
| Kalvenas et al. [64] (IPAQ) | LT | TRR | MPA (min/weak) | Spearman ρ = 0.53 | 3 |
| VPA (min/weak) | Spearman ρ = 0.67 | 3 | |||
| tPA (min/weak) | Spearman ρ = 0.51 | 3 | |||
| CRV | VPA (ActiGraph GT3X) | Spearman r = 0.40 | 3 | ||
| MPA (ActiGraph GT3X) | Spearman r = -0.03 | 3 | |||
| tPA (ActiGraph GT3X) | Spearman r = -0.11 | 3 | |||
| Kleinauskiene [65] (IPAQ) | LT | TRR | MPA | Spearman ρ = 0.35 | 3 |
| VPA | Spearman ρ = 0.83 | 2 | |||
| CRV | weekly tPA 1st session | Spearman ρ = 0.27 | 3 | ||
| weekly tPA 2nd session | Spearman ρ = 0.06 | 3 | |||
| Laeremans et al. [58](GPAQ) | B, ES, UK | CRV | MVPA (SWA) 1st session | Spearman r = 0.56 | 2 |
| MVPA (SWA) 1st session | Spearman r = 0.64 | 2 | |||
| MVPA (SWA) 1st session | Spearman r = 0.55 | 2 | |||
| Overall MVPA (SWA) 1st session | Spearman r = 0.54 | 2 | |||
| VPA (SWA) 2nd session | Spearman r = 0.62 | 2 | |||
| VPA (SWA) 2nd session | Spearman r = 0.69 | 2 | |||
| VPA (SWA) 2nd session | Spearman r = 0.59 | 2 | |||
| Overall VPA (SWA) 2nd session | Spearman r = 0.64 | 2 | |||
| MPA (SWA) 3rd session | Spearman r = 0.11 | 3 | |||
| MPA (SWA) 3rd session | Spearman r = 0.34 | 3 | |||
| MPA (SWA) 3rd session | Spearman r = 0.02 | 3 | |||
| Overall MPA (SWA) 3rd session | Spearman r = 0.34 | 3 | |||
| Murphy et al. [68] (IPAQ) | IE | TRR | tPA | ICC = 0.77 | 2 |
| CRV | MVPA (ActiGraph GT1 M & GT3X) | Spearman ρ = 0.31 | 3 | ||
| tPA (ActiGraph GT1 M & GT3X) | Spearman ρ = 0.28 | 3 | |||
| Novak et al. [69] (GPAQ) | AT | CCV | VPA (PAQ 24) | Spearman ρ = 0.51 | 2 |
| tPA (PAQ 24) | Spearman ρ = 0.43 | 3 | |||
| Rivière et al. [70] (GPAQ) | FR | TRR | MPA | Spearman ρ = 0.56 ICC = 0.48 | 3 3 |
| Total VPA | Spearman ρ = 0.8 ICC = 0.84 | 2 1 | |||
| Total PA | Spearman ρ = 0.82 ICC = 0.58 | 2 2 | |||
| CRV | VPA (ActiGraph GT3X) | Spearman ρ = 0.38 | 3 | ||
| VPA (ActiGraph GT3X) | Spearman ρ = 0.10 | 3 | |||
| tPA (ActiGraph GT3X) | Spearman ρ = 0.24 | 3 | |||
| CCV | VPA 1st session (IPAQ-LF) | Spearman ρ = 0.86 | 1 | ||
| VPA 2nd session (IPAQ-LF) | Spearman ρ = 0.76 | 1 | |||
| MPA 1st session (IPAQ-LF) | Spearman ρ = 0.41 | 3 | |||
| MPA 2nd session (IPAQ-LF) | Spearman ρ = 0.58 | 2 | |||
| tPA 1st session (IPAQ-LF) | Spearman ρ = 0.66 | 2 | |||
| tPA 2nd session (IPAQ-LF) | Spearman ρ = 0.67 | 2 | |||
| Rodríguez-Muńoz et al. [74] (IPAQ) | ES | CRV | MVPA uniaxial (Actigraph GT3x and GT3X+) male | Pearson r = 0.66 | 2 |
| MVPA uniaxial (Actigraph GT3x and GT3X+) female | Pearson r = 0.27 | 3 | |||
| MVPA uniaxial (Actigraph GT3x and GT3X+) all | Pearson r = 0.47 | 3 | |||
| MVPA triaxial (Actigraph GT3x and GT3X+) male | Pearson r = 0.65 | 2 | |||
| MVPA triaxial (Actigraph GT3x and GT3X+) female | Pearson r = 0.34 | 3 | |||
| MVPA triaxial (Actigraph GT3x and GT3X+) all | Pearson r = 0.49 | 3 | |||
| Rudolf et al. [71] (GPAQ) | DE | CRV | MPA (ActiGraph GT3X and GPAQ +) | Spearman ρ = 0.19 | 3 |
| MPA (ActiGraph GT3X and GPAQ) | Spearman ρ = 0.17 | 3 | |||
| VPA (ActiGraph GT3X and GPAQ +) | Spearman ρ = 0.42 | 3 | |||
| VPA (ActiGraph GT3X and GPAQ) | Spearman ρ = 0.31 | 3 | |||
| Rütten et al. [60] (IPAQ) | B | TRR | MPA days | Spearman ρ = 0.37 | 3 |
| MPA total minutes | Spearman ρ = 0.39 | 3 | |||
| VPA days | Spearman ρ = 0.55 | 3 | |||
| VPA total minutes | Spearman ρ = 0.44 | 3 | |||
| tPA Sum MET (moderate, vigorous, walking) | Spearman ρ = 0.53 | 3 | |||
| FI | TRR | MPA days | Spearman ρ = 0.28 | 3 | |
| MPA total minutes | Spearman ρ = 0.55 | 3 | |||
| VPA days | Spearman ρ = 0.48 | 3 | |||
| VPA total minutes | Spearman ρ = 0.59 | 3 | |||
| tPA Sum MET (moderate, vigorous, walking) | Spearman ρ = 0.41 | 3 | |||
| FR | TRR | MPA days | Spearman ρ = 0.18 | 3 | |
| MPA total minutes | Spearman ρ = 0.28 | 3 | |||
| VPA days | Spearman ρ = 0.36 | 3 | |||
| VPA total minutes | Spearman ρ = 0.44 | 3 | |||
| tPA Sum MET (moderate, vigorous, walking) | Spearman ρ = 0.29 | 3 | |||
| DE | TRR | MPA days | Spearman ρ = 0.43 | 3 | |
| MPA total minutes | Spearman ρ = 0.54 | 3 | |||
| VPA days | Spearman ρ = 0.51 | 3 | |||
| VPA total minutes | Spearman ρ = 0.54 | 3 | |||
| tPA Sum MET (moderate, vigorous, walking) | Spearman ρ = 0.39 | 3 | |||
| I | TRR | MPA days | Spearman ρ = 0.21 | 3 | |
| MPA total minutes | Spearman ρ = 0.22 | 3 | |||
| VPA days | Spearman ρ = 0.41 | 3 | |||
| VPA total minutes | Spearman ρ = 0.53 | 3 | |||
| tPA Sum MET (moderate, vigorous, walking) | Spearman ρ = 0.14 | 3 | |||
| NL | TRR | MPA days | Spearman ρ = 0.40 | 3 | |
| MPA total minutes | Spearman ρ = 0.34 | 3 | |||
| VPA days | Spearman ρ = 0.34 | 3 | |||
| VPA total minutes | Spearman ρ = 0.41 | 3 | |||
| tPA Sum MET (moderate, vigorous, walking) | Spearman ρ = 0.34 | 3 | |||
| ES | TRR | MPA days | Spearman ρ = 0.38 | 3 | |
| MPA total minutes | Spearman ρ = 0.32 | 3 | |||
| VPA days | Spearman ρ = 0.54 | 3 | |||
| VPA total minutes | Spearman ρ = 0.62 | 3 | |||
| tPA Sum MET (moderate, vigorous, walking) | Spearman ρ = 0.58 | 3 | |||
| UK | TRR | MPA days | Spearman ρ = 0.25 | 3 | |
| MPA total minutes | Spearman ρ = 0.43 | 3 | |||
| VPA days | Spearman ρ = 0.47 | 3 | |||
| VPA total minutes | Spearman ρ = 0.36 | 3 | |||
| tPA Sum MET (moderate, vigorous, walking) | Spearman ρ = 0.50 | 3 | |||
| All nations | TRR | MPA days | Spearman ρ = 0.36 | 3 | |
| MPA total minutes | Spearman ρ = 0.39 | 3 | |||
| VPA days | Spearman ρ = 0.47 | 3 | |||
| VPA total minutes | Spearman ρ = 0.51 | 3 | |||
| tPA Sum MET (moderate, vigorous, walking) | Spearman ρ = 0.45 | 3 | |||
| Scholes et al. [75] (IPAQ) | ES | CCV | MVPA (PASBAQ) male | Pearson r = 0.43 | 3 |
| MVPA (PASBAQ) female | Pearson r = 0.40 | 3 | |||
| Taylor et al. [72] (IPAQ) | UK | TRR | MVPA minutes | Spearman ρ = 0.67 ICC = 0.7 | 2 1 |
| Mean MVPA METs | Spearman ρ = 0.79 ICC = 0.8 | 2 1 | |||
| MPA total minutes | Spearman ρ = 0.59 ICC = 0.57 | 3 2 | |||
| MPA METs | Spearman ρ = 0.61 ICC = 0.58 | 3 2 | |||
| VPA min | Spearman ρ = 0.71 ICC = 0.64 | 2 2 | |||
| VPA METs | Spearman ρ = 0.71 ICC = 0.61 | 2 2 | |||
| CRV | MVPA METs (ActiGraph GT3X) | Spearman ρ = 0.08 | 3 | ||
| MVPA minutes (ActiGraph GT3X) | Spearman ρ = 0.13 | 3 | |||
| VPA METs (ActiGraph GT3X) | Spearman ρ = 0.05 | 3 | |||
| VPA (ActiGraph GT3X) | Spearman ρ = 0.04 | 3 | |||
| MPA METs (ActiGraph GT3X) | Spearman ρ = 0.11 | 3 | |||
| MPA (ActiGraph GT3X) | Spearman ρ = 0.14 | 3 | |||
| tPA (ActiGraph GT3X) | Spearman ρ = 0.14 | 3 | |||
| CCV | MPA MET (OSWEQ) | Spearman ρ = 0.52 | 2 | ||
| MPA (OSWEQ) | Spearman ρ = 0.46 | 3 | |||
| VPA (OSWEQ) | Spearman ρ = 0.53 | 2 | |||
| VPA METs (OSWEQ) | Spearman ρ = 0.53 | 2 | |||
| MVPA (OSWEQ) | Spearman ρ = 0.56 | 2 | |||
| MVPA METs (OSWEQ) | Spearman ρ = 0.62 | 2 | |||
| Vinas et al. [73] (IPAQ) | ES | CRV | VPA (ActiGraph) | Spearman r = 0.38 | 3 |
| tPA (ActiGraph) | Spearman r = 0.27 | 3 |
| Measurement Characteristic | PA Construct | Sample | Population Effect | Egger’s Bias Test | Heterogeneity | |||||||||
|---|---|---|---|---|---|---|---|---|---|---|---|---|---|---|
| N (k) | k | n | Unweighted Mean | Weighted Mean | 95% CI | 80% CRI | Bias | 95% CI | p | I2 (%) | Q | p | ||
| Reliability (test-retest | MPA | 5 | 30 | 4592 | 0.42 | 0.40 | 0.37 to 0.43 | 0.32 to 0.47 | 0.52 | −0.52 to 1.54 | 0.34 | 46.34 | 54.05 | 0.00 |
| MVPA | 2 | 5 | 319 | 0.74 | 0.74 | 0.70 to 0.77 | 0.74 to 0.74 | −0.46 | −3.26 to 2.34 | 0.77 | 36.45 | 2.93 | 0.57 | |
| VPA | 3 | 28 | 4456 | 0.57 | 0.53 | 0.49 to 0.58 | 0.39 to 0.67 | −0.30 | −2.75 to 2.14 | 0.81 | 70.41 | 131.16 | 0.00 | |
| tPA | 5 | 19 | 3048 | 0.55 | 0.52 | 0.44 to 0.59 | 0.33 to 0.71 | −0.71 | −4.22 to 2.80 | 0.70 | 87.52 | 144.28 | 0.00 | |
| Concurrent validity | MPA | 3 | 9 | 687 | 0.51 | 0.52 | 0.48 to 0.56 | 0.52 to 0.52 | −2.53 | −5.56 to 0.51 | 0.15 | 59.10 | 5.03 | 0.76 |
| MVPA | 3 | 6 | 1909 | 0.43 | 0.41 | 0.36 to 0.46 | 0.34 to 0.47 | 0.41 | −1.92 to 2.73 | 0.74 | 52.33 | 14.69 | 0.04 | |
| VPA | 3 | 9 | 687 | 0.69 | 0.72 | 0.63 to 0.80 | 0.56 to 0.87 | −5.63 | −6.80 to −4.46 | 0.00 | 84.75 | 52.47 | 0.00 | |
| tPA | 8 | 11 | 1308 | 0.61 | 0.58 | 0.50 to 0.66 | 0.43 to 0.74 | −0.14 | −6.47 to 6.20 | 0.97 | 55.30 | 81.92 | 0.00 | |
| Criterion validity | MPA | 4 | 11 | 943 | 0.14 | 0.15 | 0.07 to 0.22 | 0.06 to 0.23 | −2.05 | −5.88 to 1.78 | 0.32 | 47.65 | 15.51 | 0.05 |
| MVPA | 7 | 15 | 1484 | 0.42 | 0.41 | 0.32 to 0.49 | 0.22 to 0.60 | −1.70 | −5.45 to 2.05 | 0.38 | 75.40 | 60.96 | 0.00 | |
| VPA | 6 | 11 | 893 | 0.41 | 0.48 | 0.37 to 0.60 | 0.26 to 0.71 | −5.59 | −7.38 to −3.81 | 0.00 | 82.67 | 57.68 | 0.00 | |
| tPA | 8 | 11 | 1056 | 0.22 | 0.25 | 0.16 to 0.34 | 0.09 to 0.41 | −3.22 | −6.55 to 0.11 | 0.09 | 66.20 | 29.56 | 0.00 | |
| Author (Year) | Outcome | R | BC | BV | T | BM | VO | DA | RR | PC | Total |
|---|---|---|---|---|---|---|---|---|---|---|---|
| Baumeister (2016) [46] | EHIS * + − | 0 | 0 | 1 | 1 | 0 | 1 | 0 | 1 | 1 | 5/9 (0.56) |
| Bull et al. (2009) [35] | GPAQ + | 0 | 0 | 1 | 1 | 0 | 1 | 0 | 1 | 0 | 4/9 (0.44) |
| Cámara et al. 2020 [61] | GPAQ + | 0 | 0 | 1 | 0 | 0 | 1 | 0 | 1 | 0 | 3/9 (0.33) |
| Cleland et al. (2014) [62] | GPAQ − | 1 | 0 | 1 | 1 | 0 | 1 | 1 | 1 | 1 | 7/9 (0.78) |
| Craig et al. (2003) [33] | IPAQ * + − | 0 | 0 | 0 | 0 | 0 | 1 | 0 | 1 | 0 | 2/9 (0.22) |
| Ekelund et al. (2005) [63] | IPAQ − | 1 | 0 | 0 | 1 | 0 | 1 | 0 | 0 | 0 | 3/9 (0.33) |
| Kalvenas et al. (2016) [64] | IPAQ * − | 0 | 0 | 0 | 1 | 0 | 1 | 0 | 1 | 0 | 3/9 (0.33) |
| Kastelic et al. (2019) [66] | GPAQ − | 0 | 0 | 0 | 1 | 0 | 1 | 0 | 1 | 0 | 3/9 (0.33) |
| Kleinauskienė (2012) [65] | IPAQ * − | 0 | 0 | 0 | 1 | 0 | 1 | 0 | 1 | 0 | 3/9 (0.33) |
| Laeremans et al. (2016) [59] | GPAQ − | 0 | 0 | 1 | 1 | 0 | 1 | 0 | 0 | 0 | 3/9 (0.33) |
| Milton et al. (2009) [67] | GPAQ + | 0 | 0 | 1 | 1 | 0 | 1 | 0 | 1 | 0 | 4/9 (0.44) |
| Murphy et al. (2017) [68] | IPAQ * − | 0 | 0 | 1 | 1 | 0 | 1 | 0 | 1 | 0 | 4/9 (0.44) |
| Novak et al. (2020) [69] | GPAQ + | 0 | 0 | 0 | 1 | 0 | 1 | 0 | 1 | 1 | 4/9 (0.44) |
| Rivière et al. (2016) [64] | GPAQ * + − | 0 | 0 | 0 | 1 | 0 | 1 | 0 | 1 | 1 | 4/9 (0.44) |
| Rodríguez-Muńoz et. al. (2020) [74] | IPAQ − | 0 | 0 | 1 | 1 | 0 | 1 | 0 | 1 | 0 | 4/9 (0.44) |
| Rudolf et al. (2020) [71] | GPAQ − | 0 | 0 | 0 | 1 | 0 | 1 | 1 | 1 | 0 | 4/9 (0.44) |
| Rütten et al. (2003) [60] | IPAQ * | 1 | 0 | 1 | 1 | 0 | 1 | 0 | 1 | 1 | 6/9 (0.67) |
| Scholes et al. (2016) [75] | IPAQ + | 1 | 0 | 0 | 1 | 0 | 1 | 0 | 1 | 0 | 4/9 (0.44) |
| Taylor et al. (2013) [72] | IPAQ * + − | 0 | 0 | 0 | 1 | 0 | 1 | 0 | 1 | 1 | 4/9 (0.44) |
| Vinas (2012) [73] | IPAQ − | 0 | 0 | 0 | 1 | 0 | 1 | 0 | 1 | 0 | 3/9 (0.33) |
| average of all studies | 0.20 | 0.00 | 0.45 | 0.90 | 0.00 | 1.00 | 0.10 | 0.90 | 0.30 | 0.43 |
© 2020 by the authors. Licensee MDPI, Basel, Switzerland. This article is an open access article distributed under the terms and conditions of the Creative Commons Attribution (CC BY) license (http://creativecommons.org/licenses/by/4.0/).
Share and Cite
Sember, V.; Meh, K.; Sorić, M.; Starc, G.; Rocha, P.; Jurak, G. Validity and Reliability of International Physical Activity Questionnaires for Adults across EU Countries: Systematic Review and Meta Analysis. Int. J. Environ. Res. Public Health 2020, 17, 7161. https://0-doi-org.brum.beds.ac.uk/10.3390/ijerph17197161
Sember V, Meh K, Sorić M, Starc G, Rocha P, Jurak G. Validity and Reliability of International Physical Activity Questionnaires for Adults across EU Countries: Systematic Review and Meta Analysis. International Journal of Environmental Research and Public Health. 2020; 17(19):7161. https://0-doi-org.brum.beds.ac.uk/10.3390/ijerph17197161
Chicago/Turabian StyleSember, Vedrana, Kaja Meh, Maroje Sorić, Gregor Starc, Paulo Rocha, and Gregor Jurak. 2020. "Validity and Reliability of International Physical Activity Questionnaires for Adults across EU Countries: Systematic Review and Meta Analysis" International Journal of Environmental Research and Public Health 17, no. 19: 7161. https://0-doi-org.brum.beds.ac.uk/10.3390/ijerph17197161