Expectancy-Value Model Related to Physical Activity Behaviors in Chilean and Spanish Adolescents


Abstract
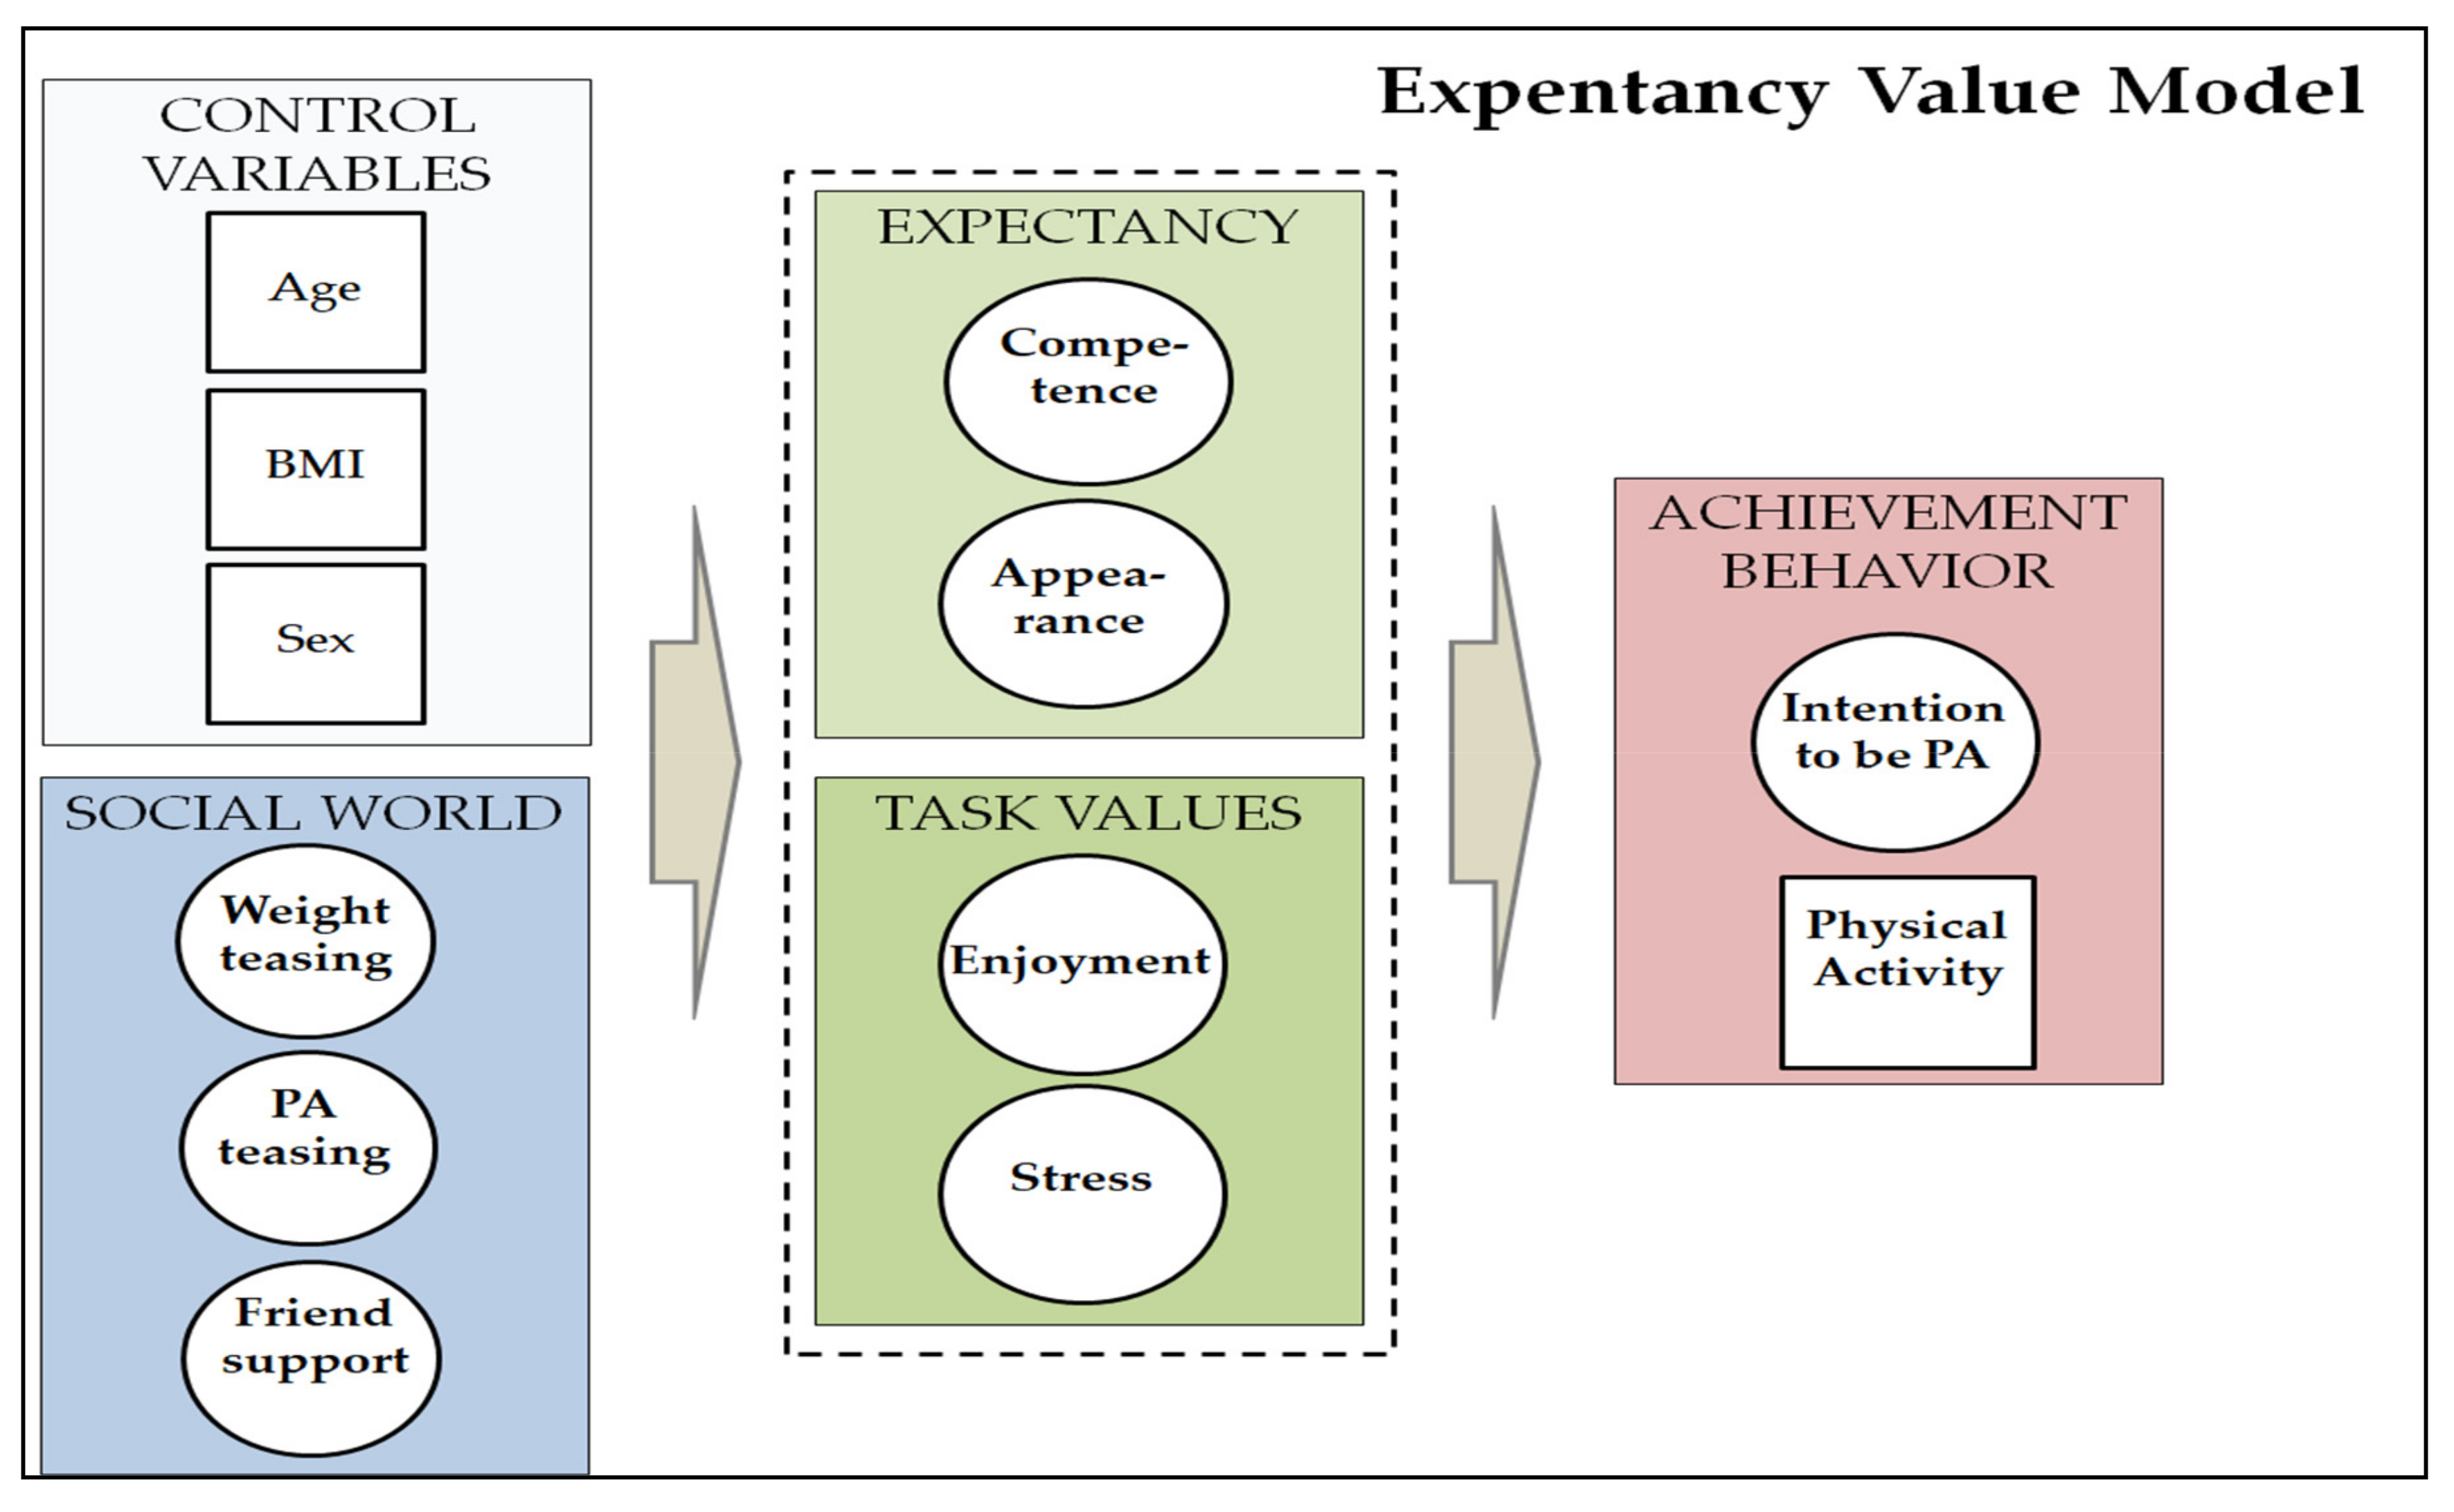
:1. Introduction
2. Materials and Methods
2.1. Sample
2.2. Measurement Instruments
2.3. Procedure
2.4. Data Analysis
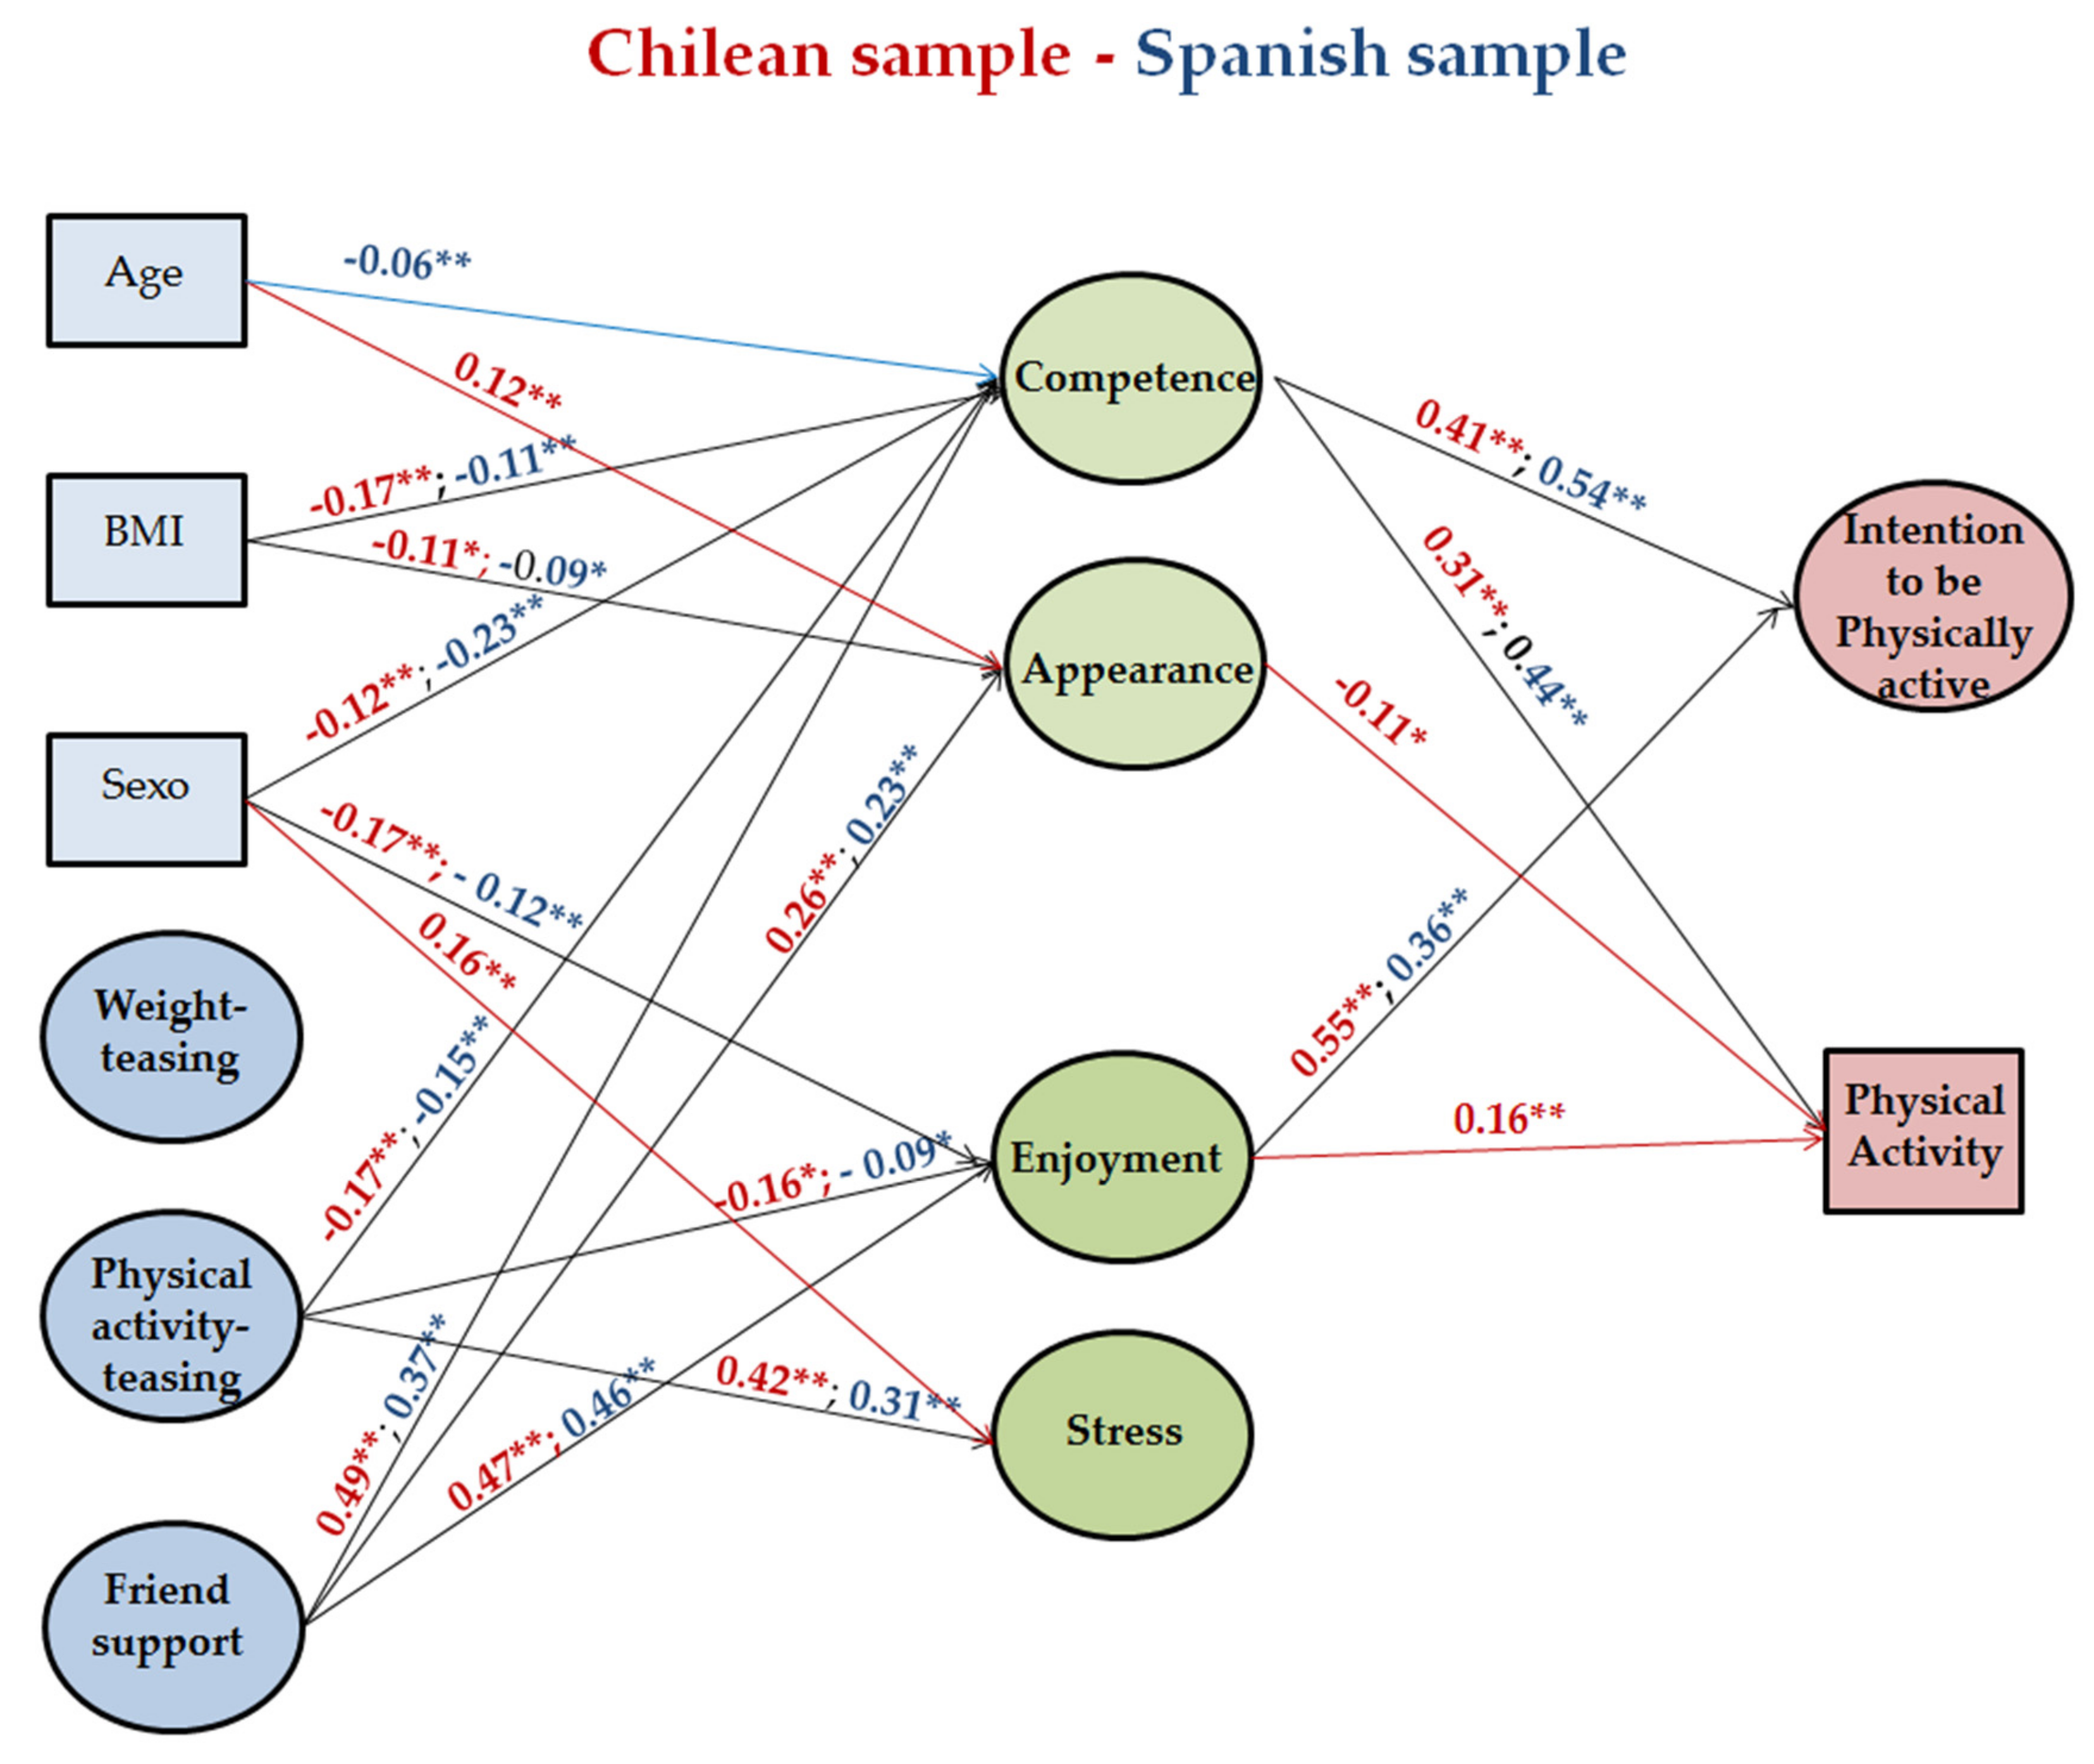
3. Results
3.1. Previous Analysis: Invariance Testing
3.2. The Overall Model
3.3. Comparing Models: Multi-Group Analysis by Country
3.4. Testing Teasing Differences
4. Discussion
5. Conclusions
Author Contributions
Funding
Conflicts of Interest
References
- World Health Organization. Global Recommendations on Physical Activity for Health; World Health Orgnaization: Geneva, Switzerland, 2010. [Google Scholar]
- Roman-Viñas, B.; Zazo, F.; Martínez-Martínez, J.; Aznar-Laín, S.; Serra-Majem, L. Results from Spain’s 2018 report card on physical activity for children and youth. J. Phys. Activ. Health 2018, 15, 411–412. [Google Scholar] [CrossRef] [PubMed] [Green Version]
- Aubert, S.; Barnes, J.D.; Abdeta, C.; Abi Nader, P.; Adeniyi, A.F.; Aguilar-Farias, N.; Tenesaca, D.S.A.; Bhawra, J.; Brazo-Sayavera, J.; Cardon, G.; et al. Global Matrix 3.0 physical activity report card grades for children and youth: Results and analysis from 49 countries. J. Phys. Activ. Health 2018, 15, 251–273. [Google Scholar] [CrossRef] [PubMed] [Green Version]
- Demetriou, Y.; Vondung, C.; Bucksch, J.; Shlund, J.; Shulze, C.; Knapp, G.; Coeh, S.E.; Puil, L.; Phillips, S.P.; Reimers, A.K. Interventions on children’s and adolescents’ physical activity and sedentary behaviour: Protocol for a systematic review from a sex/gender perspective. Syst. Rev. 2019, 8, 1–7. [Google Scholar] [CrossRef] [Green Version]
- Corder, K.; Winpenny, E.; Love, R.; Brown, H.E.; White, M.; Van Sluijs, E. Change in physical activity from adolescence to early adulthood: A systematic review and meta-analysis of longitudinal cohort studies. Br. J. Sports Med. 2019, 53, 496–503. [Google Scholar] [CrossRef]
- World Health Organization. Physical Activity. 2014. Available online: http://www.who.int/mediacentre/factsheets/fs385/es/ (accessed on 13 July 2020).
- Ruiz-Pérez, L.M.; Ramón-Otero, I.; Palomo-Nieto, M.; Ruiz-Amengual, A.; Navia-Manzano, J.A. La intención de practicar en el futuro en escolares adolescentes. Kronos 2014, 13, 1–9. [Google Scholar]
- Shephard, R.; Trudeau, F. The legacy of physical education: Influences on adult lifestyle. Pediatr. Exerc. Sci. 2000, 12, 34–50. [Google Scholar] [CrossRef]
- Eccles, J.S.; Adler, T.F.; Kaczala, C.M. Socialization of achievement attitudes and beliefs: Parental influences. Child Dev. 1982, 53, 310–321. [Google Scholar]
- Eccles, J.S.; Freedman-Doan, C.; Frome, P.M.; Jacobs, J.E.; Yoon, K.S. Gender role socialization in the family: A longitudinal approach. In The Developmental Social Psychology of Gender; Edkes, T.Y., Trautners, H.M., Eds.; Lawrence Erlbaum Associates: Mahwah, NJ, USA, 2000; pp. 333–360. [Google Scholar]
- Eccles, J.S.; Harold, R.D. Gender differences in sport involvement: Applying the Eccles expectancy-value model. J. Appl. Sport Psychol. 1991, 3, 7–35. [Google Scholar] [CrossRef]
- Babic, M.J.; Morgan, P.J.; Plotnikoff, R.C.; Lonsdale, C.; White, R.L.; Lubans, D.R. Physical activity and physical self-concept in youth: Systematic review and meta-analysis. Sports Med. 2014, 44, 1589–1601. [Google Scholar] [CrossRef]
- Harter, S. The perceived competence scale for children. Child Dev. 1982, 53, 87–97. [Google Scholar] [CrossRef]
- Marsh, H.W. Physical self-description questionnaire: Stability and discriminant validity. Res. Q. Exerc. Sport 1996, 67, 249–264. [Google Scholar] [CrossRef]
- Fernández-Bustos, J.G.; Infantes-Paniagua, Á.; Gonzalez-Martí, I.; Contreras-Jordán, O.R. Body Dissatisfaction in Adolescents: Diferences by Sex, BMI and Type and Organisation of Physical Activity. Int. J. Environ. Res. Public Health 2019, 16, 3109. [Google Scholar] [CrossRef] [PubMed] [Green Version]
- Wigfield, A.; Eccles, J.S. Expectancy-value theory of achievement motivation. Contemp. Educ. Psychol. 2000, 25, 68–81. [Google Scholar] [CrossRef]
- Abarca-Sos, A.; Bois, J.; Zaragoza, J.; Generelo, E.; Julian, J.A. Ecological correlates of physical activity in youth: Importance of parents, friends, physical education teachers and geographical localization. Int. J. Sport Psychol. 2013, 44, 215–233. [Google Scholar] [CrossRef]
- Castro-Sánchez, M.; Zurita-Ortega, F.; García-Marmol, E.; Chacón-Cuberos, R. Motivational climate in sport is associated with life stress levels, academic performance and physical activity engagement of adolescents. Int. J. Environ. Res. Public Health 2019, 16, 1198. [Google Scholar] [CrossRef] [Green Version]
- Duda, J.L.; Nicholls, J.G. Dimensions of achievement motivation in schoolwork and sport. J. Educ. Psychol. 1992, 84, 290. [Google Scholar] [CrossRef]
- Invernizzi, P.L.; Crotti, M.; Bosio, A.; Cavaggioni, L.; Alberti, G.; Scurati, R. Multi-teaching styles approach and active reflection: Effectiveness in improving fitness level, motor competence, enjoyment, amount of physical activity, and effects on the perception of physical education lessons in primary school children. Sustainability 2019, 11, 405. [Google Scholar] [CrossRef] [Green Version]
- Aronson, E.; Wilson, T.D.; Akert, R.M. Social Psychology, 6th ed.; Prentice Hall: Garden City, NY, USA, 2007. [Google Scholar]
- Munsey, C. The kids aren’t all right. In New Data from APA’s Stress in America Survey Indicate Parents Don’t Know What’s Bothering Their Children; American Psychological Association: Washington, DC, USA, 2010. [Google Scholar]
- Grilo, C.M.; Winfley, D.E.; Brownell, K.D.; Rodin, J. Teasing, body image, and self-esteem in a clinical sample of obese woman. Addic. Behav. 1994, 19, 443–450. [Google Scholar] [CrossRef]
- Jensen, C.D.; Cushing, C.C.; Elledge, A.R. Associations between teasing, quality of life, and physical activity among preadolescent children. J. Pediatr. Psychol. 2013, 39, 65–73. [Google Scholar] [CrossRef] [Green Version]
- Faith, M.S.; Leone, M.A.; Ayers, T.S.; Heo, M.; Pietrobelli, A. Weight criticism during physical activity, coping skills, and reported physical activity in children. Pediatrics 2002, 110, 23. [Google Scholar] [CrossRef] [Green Version]
- Watanabe, P.I.; Fontana, F.E.; Da Silva, M.P.; Mazzardo, O.; Bacil, E.D.A.; De Campos, W. Association between weight-teasing and physical activity in adolescents. Rev. Paul. Pediatr. 2017, 35, 309. [Google Scholar] [CrossRef]
- Benas, J.S.; Gibb, B.E. Weight-related teasing, dysfunctional cognitions, and symptoms of depression and eating disturbances. Cogn. Ther. Res. 2008, 32, 143–160. [Google Scholar] [CrossRef]
- Slater, A. Tiggemann, M. Gender differences in adolescent sport participation, teasing, self-objectification and body image concerns. J. Adolesc. 2011, 34, 455–463. [Google Scholar] [CrossRef]
- Schvey, N.A.; Marwitz, S.E.; Mi, S.J.; Galescu, O.A.; Broadney, M.M.; Young-Hyman, D.; Brady, S.M.; Reynolds, J.C.; Tanofsky-Kraff, M.; Yanovski, S.Z.; et al. Weight-based teasing is associated with gain in BMI and fat mass among children and adolescents at-risk for obesity: A longitudinal study. Pediatr. Obes. 2019, 14, e12538. [Google Scholar] [CrossRef]
- Van Der Horst, K.; Paw, M.J.C.A.; Twisk, J.W.R.; Van Mechelen, W. A brief review on correlates of physical activity and sedentariness in youth. Med. Sci. Sports Exerc. 2007, 39, 1241–1250. [Google Scholar] [CrossRef]
- Tremblay, M.S.; Barnes, J.D.; González, S.A.; Katzmarzyk, P.T.; Onywera, V.O.; Reilly, J.J.; Tomkinson, G.R. Global matrix 2.0: Report card grades on the physical activity of children and youth comparing 38 countries. J. Phys. Act. Health 2016, 13, 343–366. [Google Scholar] [CrossRef] [Green Version]
- Sigmundová, D.; Sigmund, E.; Tesler, R.; Ng, K.W.; Hamrik, Z.; Mathisen, F.K.S.; Inchley, J.; Busckh, J. Vigorous physical activity in relation to family affluence: Time trends in Europe and North America. Int. J. Public Health 2019, 64, 1049–1058. [Google Scholar] [CrossRef] [Green Version]
- Guthold, R.; Stevens, G.A.; Riley, L.M.; Bull, F.C. Global trends in insufficient physical activity among adolescents: A pooled analysis of 298 population-based surveys with 1 · 6 million participants. Lancet Child Adolesc. Health 2020, 4, 23–35. [Google Scholar] [CrossRef]
- Aguilar-Farias, N.; Martino-Fuentealba, P.; Carcamo-Oyarzun, J.; Cortinez-O’Ryan, A.; Cristi-Montero, C.; Von Oetinger, A.; Sadarangani, K.P. A regional vision of physical activity, sedentary behaviour and physical education in adolescents from Latin America and the Caribbean: Results from 26 countries. Int. J. Epidemiol. 2018, 47, 976–986. [Google Scholar] [CrossRef] [Green Version]
- Brito, J. Motivación E Intención de Ser Físicamente Activo En Adolescentes Ecuatorianos Y Españoles. Master’s Thesis, Universidad Politécnica de Madrid, Madrid, Spain, 2015. [Google Scholar]
- Craig, C.L.; Marshall, A.L.; Sjöström, M.; Bauman, A.E.; Booth, M.L.; Ainsworth, B.E.; Pratt, M.; Ekelund, U.; Yngve, A.; Sallis, J.F.; et al. International physical activity questionnaire: 12-country reliability and validity. Med. Sci. Sports Exerc. 2003, 35, 1381–1395. [Google Scholar] [CrossRef] [Green Version]
- Aibar, A.; García-González, L.; Abarca-Sos, A.; Murillo, B.; Zaragoza, J. Analizando la validación del International Physical Activity Questionnaire en jóvenes adolescentes: Un protocolo modificado para la recogida de los datos. Sport TK 2016, 5, 123–132. [Google Scholar] [CrossRef]
- Hein, V.; Müür, M.; Koka, A. Intention to be physically active after school graduation and its relationship to three types of intrinsic motivation. Eur. Phys. Educ. Rev. 2004, 10, 5–19. [Google Scholar] [CrossRef] [Green Version]
- Moreno, J.A.; Moreno, R.; Cervelló, E. El autoconcepto físico como predictor de la intención de ser físicamente activo. Psicol. Salud 2007, 17, 261–267. [Google Scholar]
- Marsh, H.W.; Richards, G.E.; Johnson, S.; Roche, L.; Tremayne, P. Physical Self-Description Questionnaire: Psychometric properties and a miiltitrait-meltimethod analysis of relations to existing instruments. J. Sport Exerc. Psychol. 1994, 16, 270–305. [Google Scholar] [CrossRef]
- Marsh, H.W.; Marco, I.T.; Abcy, F.H. Cross-cultural validity of the Physical Self-Description Questionnaire: Comparison of factor structures in Australia, Spain, and Turkey. Res. Q. Exerc. Sport 2002, 73, 257–270. [Google Scholar] [CrossRef] [PubMed]
- Cervelló Gimeno, E.; Escartí, A.; Balagué Gea, G. Relaciones entre la orientación de meta disposicional y la satisfacción con los resultados deportivos, las creencias sobre las causas de éxito en deporte y la diversión con la práctica. Rev. Psicol. Deporte 1999, 8, 7–19. [Google Scholar]
- Cohen, S.; Kamarck, T.; Mermelstein, R. A global measure of perceived stress. J. Health Soc. Behav. 1983, 24, 385–396. [Google Scholar] [CrossRef] [PubMed]
- Remor, E.; Carrobles, J.A. Versión Española de la escala de estrés percibido (PSS-14): Estudio psicométrico en una muestra VIH+. Ansiedad Estrés 2001, 7, 195–201. [Google Scholar]
- Cohen, S.; Williamson, G. Perceived stress in a probability sample of the United States. In The Social Psychology of Health: Claremont Symposium on Applied Social Psychology; Spacapan, S., Oskamp, S., Eds.; SAGE: Newbury Park, CA, USA, 1988; pp. 31–67. [Google Scholar]
- Thompson, J.K.; Cattarin, J.; Fowler, B.; Fisher, E. The Perception of Teasing Scale (POTS): A revision and extension of the Physical Appearance-Related Teasing Scale (PARTS). J. Personal. Assess. 1995, 65, 146–157. [Google Scholar] [CrossRef]
- Rojo, L.; Benavent, P.; Vila, M.; Piera, G.; Livianos, L. Validation and adaptation of the Perception of Teasing Scale (POTS-WT) in a Spanish population. Int. J. Eat. Disord. 2004, 35, 480–481. [Google Scholar]
- Weiss, M.R.; Smith, A.L. Quality of Youth Sport Friendships: Measurement Development and Validation. J. Sport Exerc. Psychol. 1999, 21, 145–166. [Google Scholar] [CrossRef]
- Chicote-López, J.; Abarca-Sos, A.; Gallardo, L.O.; García-González, L. Social antecedents in physical activity: Tracking the self-determination theory sequence in adolescents. J. Community Psychol. 2018, 46, 356–373. [Google Scholar] [CrossRef] [Green Version]
- Fonseca, H.; Silva, A.M.; Matos, M.G.; Esteves, I.; Costa, P.; Guerra, A.; Gomes-Pedro, J. Validity of BMI based on self-reported weight and height in adolescents. Acta Paediatr. 2010, 99, 83–88. [Google Scholar] [CrossRef]
- Sousa, V.D.; Rojjanasrirat, W. Translation, adaptation and validation of instruments or scales for use in cross-cultural health care research: A clear and user-friendly guideline. J. Eval. Clin. Pract. 2011, 17, 268–274. [Google Scholar] [CrossRef]
- Milfont, T.L.; Fischer, R. Testing measurement invariance across groups: Applications in cross-cultural research. Int. J. Psychol. Res. 2010, 3, 111–130. [Google Scholar] [CrossRef] [Green Version]
- Little, T.D. Longitudinal Structural Equation Modeling; Guilford Press: New York, NY, USA, 2013. [Google Scholar]
- Little, T.D.; Preacher, K.J.; Selig, J.P.; Card, N.A. New developments in latent variable panel analyses of longitudinal data. Int. J. Behav. Dev. 2007, 31, 357–365. [Google Scholar] [CrossRef] [Green Version]
- Cheung, G.W.; Rensvold, R.B. Evaluating goodness-of-fit indexes for testing measurement invariance. Struct. Equ. Modeling 2002, 9, 233–255. [Google Scholar] [CrossRef]
- Burkholder, G.J.; Harlow, L.L. An illustration of a longitudinal cross-lagged design for larger structural equation models. Struct. Equ. Modeling 2003, 10, 465–486. [Google Scholar] [CrossRef]
- Wang, J.; Wang, X. Structural Equation Modeling: Applications Using Mplus; Wiley Series in Probability and Statistics: Washington, DC, USA, 2012. [Google Scholar] [CrossRef]
- Iacobucci, D. Structural equations modeling: Fit indices, sample sizes, and advanced topics. J. Consum. Psychol. 2010, 20, 90–98. [Google Scholar] [CrossRef]
- Vandenberg, R.J.; Lance, C.E. A review and synthesis of the measurement invariance literature: Suggestions, practices, and recommendations for organizational research. Organ. Res. Methods 2000, 3, 4–70. [Google Scholar] [CrossRef]
- Greenleaf, C.; Petrie, T.A.; Martin, S.B. Relationship of weight-based teasing and adolescents’ psychological well-being and physical health. J. School Health 2014, 84, 49–55. [Google Scholar] [CrossRef] [PubMed]
- Ievers-Landis, C.E.; Dykstra, C.; Uli, N.; O’Riordan, M.A. Weight-related teasing of adolescents who are primarily obese: Roles of sociocultural attitudes towards appearance and physical activity self-efficacy. Int. J. Env. Res. Public Health 2019, 16, 1540. [Google Scholar] [CrossRef] [Green Version]
- Jensen, C.D.; Steele, R.G. Validation of the Perceptions of Teasing Scale (POTS) in a preadolescent sample: Associations with attitudes toward physical activity. Child. Health Care 2010, 39, 249–265. [Google Scholar] [CrossRef]
- Vancampfort, D.; Van Damme, T.; Firth, J.; Smith, L.; Stubbs, B.; Rosenbaum, S.; Hallgren, M.; Hagemann, N.; Koyanagi, A. Correlates of physical activity among 142,118 adolescents aged 12–15 years from 48 low-and middle-income countries. Prev. Med. 2019, 127, 105819. [Google Scholar] [CrossRef]
- Fitzgerald, A.; Fitzgerald, N.; Aherne, C. Do peers matter? A review of peer and/or friends’ influence on physical activity among American adolescents. J. Adolesc. 2012, 35, 941–958. [Google Scholar] [CrossRef] [Green Version]
- Dishman, R.K.; McIver, K.L.; Dowda, M.; Saunders, R.P.; Pate, R.R. Self-efficacy, beliefs, and goals: Moderation of declining physical activity during adolescence. Health Psychol. 2019, 38, 483. [Google Scholar] [CrossRef]
- Moljord, I.E.O.; Eriksen, L.; Moksnes, U.K.; Espnes, G.A. Stress and happiness among adolescents with varying frequency of physical activity. Percept. Mot. Ski. 2011, 113, 631–646. [Google Scholar] [CrossRef] [PubMed]
- Ghorbani, S.; Nouhpisheh, S.; Shakki, M. Gender Differences in the Relationship between Perceived Competence and Physical Activity in Middle School Students: Mediating Role of Enjoyment. Int. J. Sch. Health 2020, 7, 14–20. [Google Scholar] [CrossRef] [Green Version]
- Timo, J.; Sami, Y.P.; Anthony, W.; Jarmo, L. Perceived physical competence towards physical activity, and motivation and enjoyment in physical education as longitudinal predictors of adolescents’ self-reported physical activity. J. Sci. Med. Sport 2016, 19, 750–754. [Google Scholar] [CrossRef]
- Raudsepp, L.; Liblik, R.; Hannus, A. Children’s and adolescents’ physical self-perceptions as related to moderate to vigorous physical activity and physical fitness. Pediatr. Exerc. Sci. 2002, 14, 97–106. [Google Scholar] [CrossRef]
- Hagger, M.S.; Biddle, S.J.; John Wang, C.K. Physical self-concept in adolescence: Generalizability of a multidimensional, hierarchical model across gender and grade. Educ. Psychol. Meas. 2005, 65, 297–322. [Google Scholar] [CrossRef]
- Smith Carter, J. Stress and self-esteem in adolescence predict physical activity and sedentary behavior in adulthood. Ment. Health Phys. Act. 2018, 14, 90–97. [Google Scholar] [CrossRef]
- United Nations Development Programme. Human Developmental Reports; United Nations: New York, NY, USA, 2019. [Google Scholar]
- Carcamo-Oyarzun, J.; Wydra, G.; Hernandez-Mosqueira, C.; Martinez-Salazar, C. Actitudes hacia la educación física: Grados de importancia y conformidad según escolares de Chile y Alemania. Una mirada intercultural. Retos. Nuevas Tend. Educ. Física Deporte Recreación 2017, 32, 158–162. [Google Scholar]
- Martin, K.A. Puberty, Sexuality, and the Self: Girls and Boys at Adolescence; Routledge: New York, NY, USA, 1996. [Google Scholar]
- Parker, S.; Nichter, M.; Nichter, M.; Vuckovic, N.; Sims, C.; Ritenbaugh, C. Body-image and weight concerns among African–American and white adolescent females—differences that make a difference. Hum. Organ. 1995, 54, 103–114. [Google Scholar] [CrossRef]
- Vantieghem, W.; Van Houtte, M. Differences in study motivation within and between genders: An examination by gender typicality among early adolescents. Youth Soc. 2018, 50, 377–404. [Google Scholar] [CrossRef]


| Chile | M | SD | α | 1 | 2 | 3 | 4 | 5 | 6 | 7 | 8 | 9 | 10 | 11 | 12 | |
|---|---|---|---|---|---|---|---|---|---|---|---|---|---|---|---|---|
| Spain | ||||||||||||||||
| M | – | 7.45 | 8.82 | 3.80 | 23.74 | 23.67 | 4.12 | 5.21 | 3.78 | 39.22 | 14.70 | 22.44 | – | |||
| SD | – | 3.70 | 3.70 | 1.09 | 8.22 | 7.79 | 0.95 | 4.28 | 0.95 | 37.87 | 1.49 | 5.23 | – | |||
| α | – | 0.945 | 0.867 | 0.856 | 0.936 | 0.884 | 0.901 | 0.826 | 0.813 | – | – | – | – | |||
| 1 Weight teasing | 7.92 | 4.63 | 0.957 | – | 0.61 | −0.08 | −0.11 | −0.07 | −0.05 | 0.18 | −0.03 | −0.02 | 0.05 | 0.15 | −0.07 | |
| 2 PA teasing | 9.23 | 4.66 | 0.923 | 0.61 | − | −0.07 | −0.10 | −0.10 | −0.08 | 0.30 | −0.02 | 0.05 | −0.06 | −0.05 | −0.11 | |
| 3 Friend support | 4.02 | 0.93 | 0.842 | −0.10 | −0.15 | − | 0.43 | 0.23 | 0.41 | −0.08 | 0.41 | 0.17 | 0.03 | -0.02 | 0.02 | |
| 4 Competence | 24.10 | 7.16 | 0.932 | −0.18 | −0.23 | 0.33 | – | 0.41 | 0.56 | −0.23 | 0.60 | 0.34 | −0.05 | −0.19 | −0.12 | |
| 5 Appearance | 25.45 | 5.87 | 0.812 | −0.23 | −0.27 | 0.21 | 0.46 | − | 0.18 | −0.14 | 0.19 | 0.05 | 0.09 | −0.11 | 0.01 | |
| 6 Enjoyment | 4.33 | 0.81 | 0.907 | −0.14 | −0.18 | 0.42 | 0.55 | 0.28 | − | −0.26 | 0.64 | 0.30 | −0.02 | −0.09 | −0.16 | |
| 7 Stress | 6.09 | 3.54 | 0.751 | 0.20 | −0.28 | −0.08 | −0.21 | −0.19 | −0.17 | − | −0.16 | −0.07 | −0.05 | 0.07 | 0.13 | |
| 8 Intention to be Physically active | 4.05 | 0.85 | 0.813 | −0.14 | −0.19 | 0.40 | 0.65 | 0.29 | 0.58 | −0.16 | − | 0.44 | −0.04 | −0.14 | −0.15 | |
| 9 Physical activity | 50.35 | 48.57 | – | −0.07 | −0.07 | 0.17 | 0.43 | 0.18 | 0.28 | −0.06 | 0.43 | − | −0.06 | −0.11 | −0.14 | |
| 10 Age | 14.59 | 1.35 | – | 0.05 | 0.01 | −0.11 | −0.10 | −0.03 | −0.16 | −0.03 | −0.10 | −0.09 | − | 0.17 | 0.02 | |
| 11 BMI | 20.89 | 4.37 | – | 0.28 | 0.13 | −0.05 | −0.16 | −0.13 | −0.07 | 0.09 | −0.10 | −0.02 | 0.18 | − | 0.17 | |
| 12 Sex | – | – | – | −0.07 | −0.01 | 0.08 | −0.19 | −0.07 | −0.08 | 0.01 | −0.07 | −0.15 | −0.03 | −0.07 | − | |
| Measurement Invariance | χ2 | df | RMSEA | SRMR | TLI | CFI | ΔCFI | ΔModel |
|---|---|---|---|---|---|---|---|---|
| Configural invariance | 5138.057 | 1502 | 0.05 | 0.06 | 0.924 | 0.927 | -- | -- |
| Weak factorial invariance | 5253.286 | 1509 | 0.05 | 0.06 | 0.922 | 0.924 | −0.003 | 2 vs. 1 |
| Strong factorial invariance | 5352.663 | 1511 | 0.05 | 0.06 | 0.920 | 0.922 | −0.005 | 3 vs. 1 |
| Strict factorial invariance | 5869.539 | 11550 | 0.055 | 0.07 | 0.912 | 0.913 | 0.014 | 4 vs. 1 |
Publisher’s Note: MDPI stays neutral with regard to jurisdictional claims in published maps and institutional affiliations. |
© 2020 by the authors. Licensee MDPI, Basel, Switzerland. This article is an open access article distributed under the terms and conditions of the Creative Commons Attribution (CC BY) license (http://creativecommons.org/licenses/by/4.0/).
Share and Cite
Gallardo, L.O.; Abarca-Sos, A.; Doña, A.M. Expectancy-Value Model Related to Physical Activity Behaviors in Chilean and Spanish Adolescents. Int. J. Environ. Res. Public Health 2020, 17, 8219. https://0-doi-org.brum.beds.ac.uk/10.3390/ijerph17218219
Gallardo LO, Abarca-Sos A, Doña AM. Expectancy-Value Model Related to Physical Activity Behaviors in Chilean and Spanish Adolescents. International Journal of Environmental Research and Public Health. 2020; 17(21):8219. https://0-doi-org.brum.beds.ac.uk/10.3390/ijerph17218219
Chicago/Turabian StyleGallardo, Laura O., Alberto Abarca-Sos, and Alberto Moreno Doña. 2020. "Expectancy-Value Model Related to Physical Activity Behaviors in Chilean and Spanish Adolescents" International Journal of Environmental Research and Public Health 17, no. 21: 8219. https://0-doi-org.brum.beds.ac.uk/10.3390/ijerph17218219