Geochemical Behaviors of Rare Earth Elements (REEs) in Karst Soils under Different Land-Use Types: A Case in Yinjiang Karst Catchment, Southwest China


Abstract
:1. Introduction
2. Materials and Methods
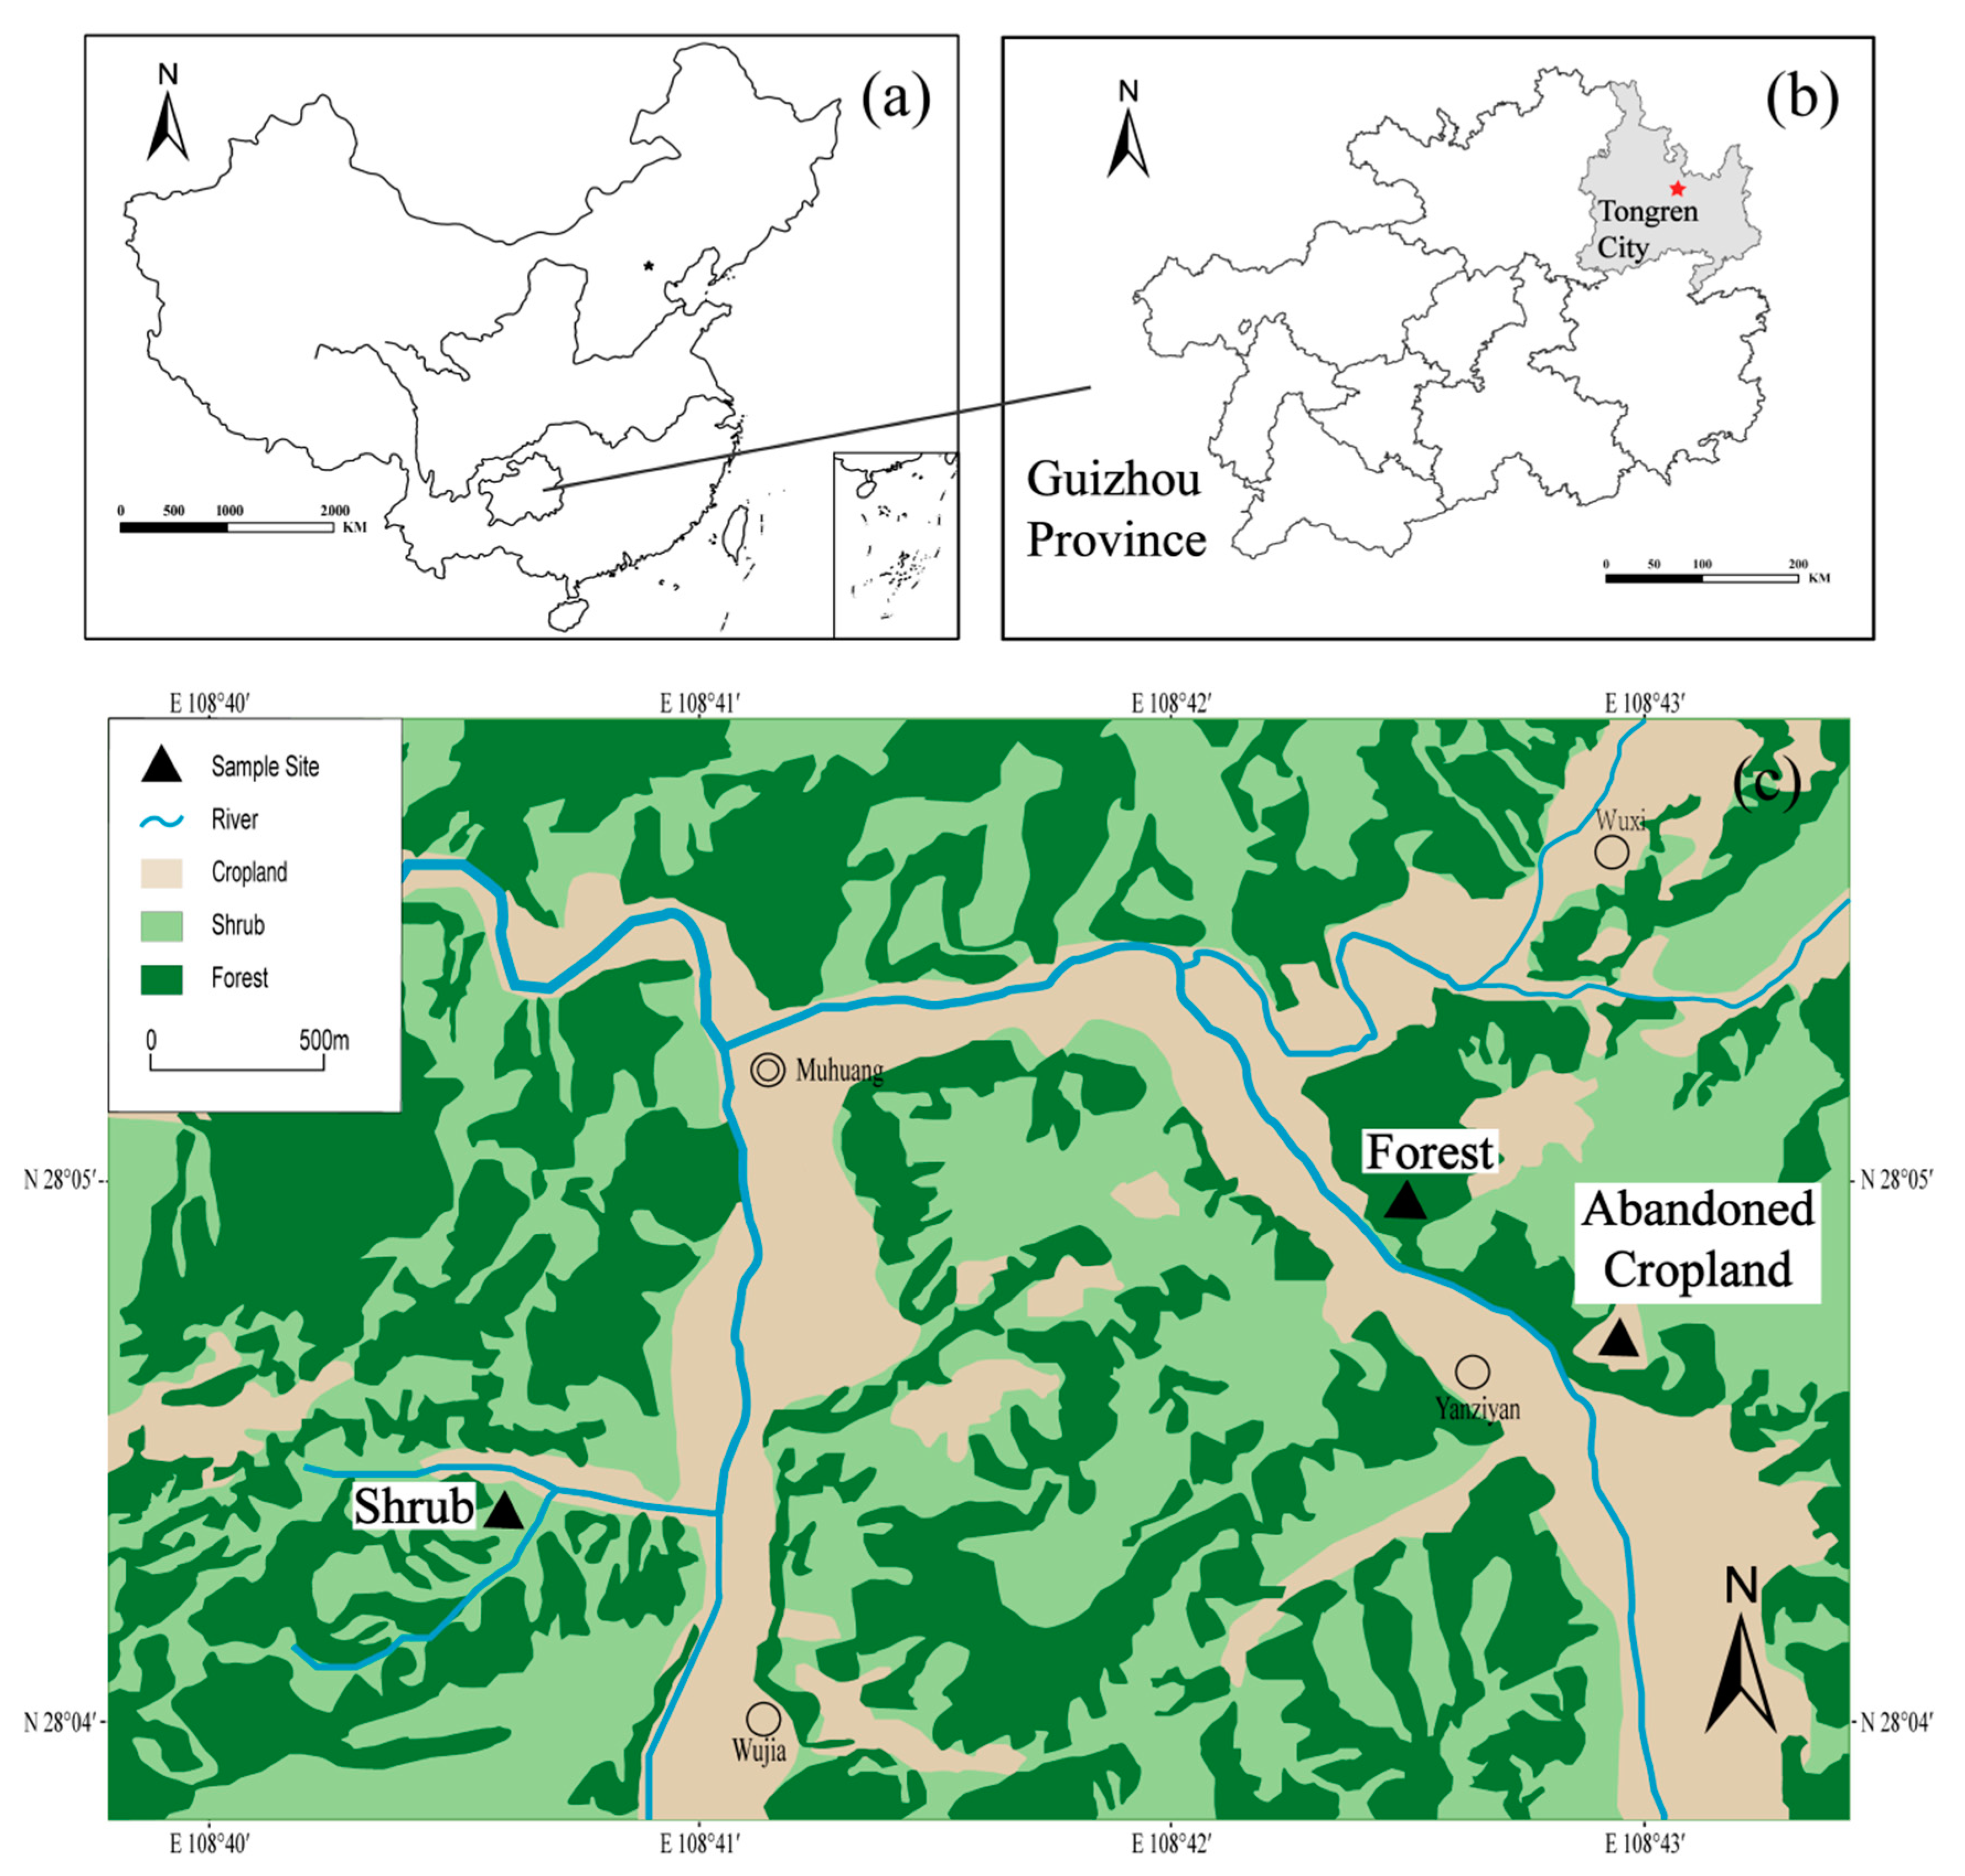
2.1. Study Area
2.2. Soil Sampling and Analysis
2.3. Data Analysis
3. Results and Discussion
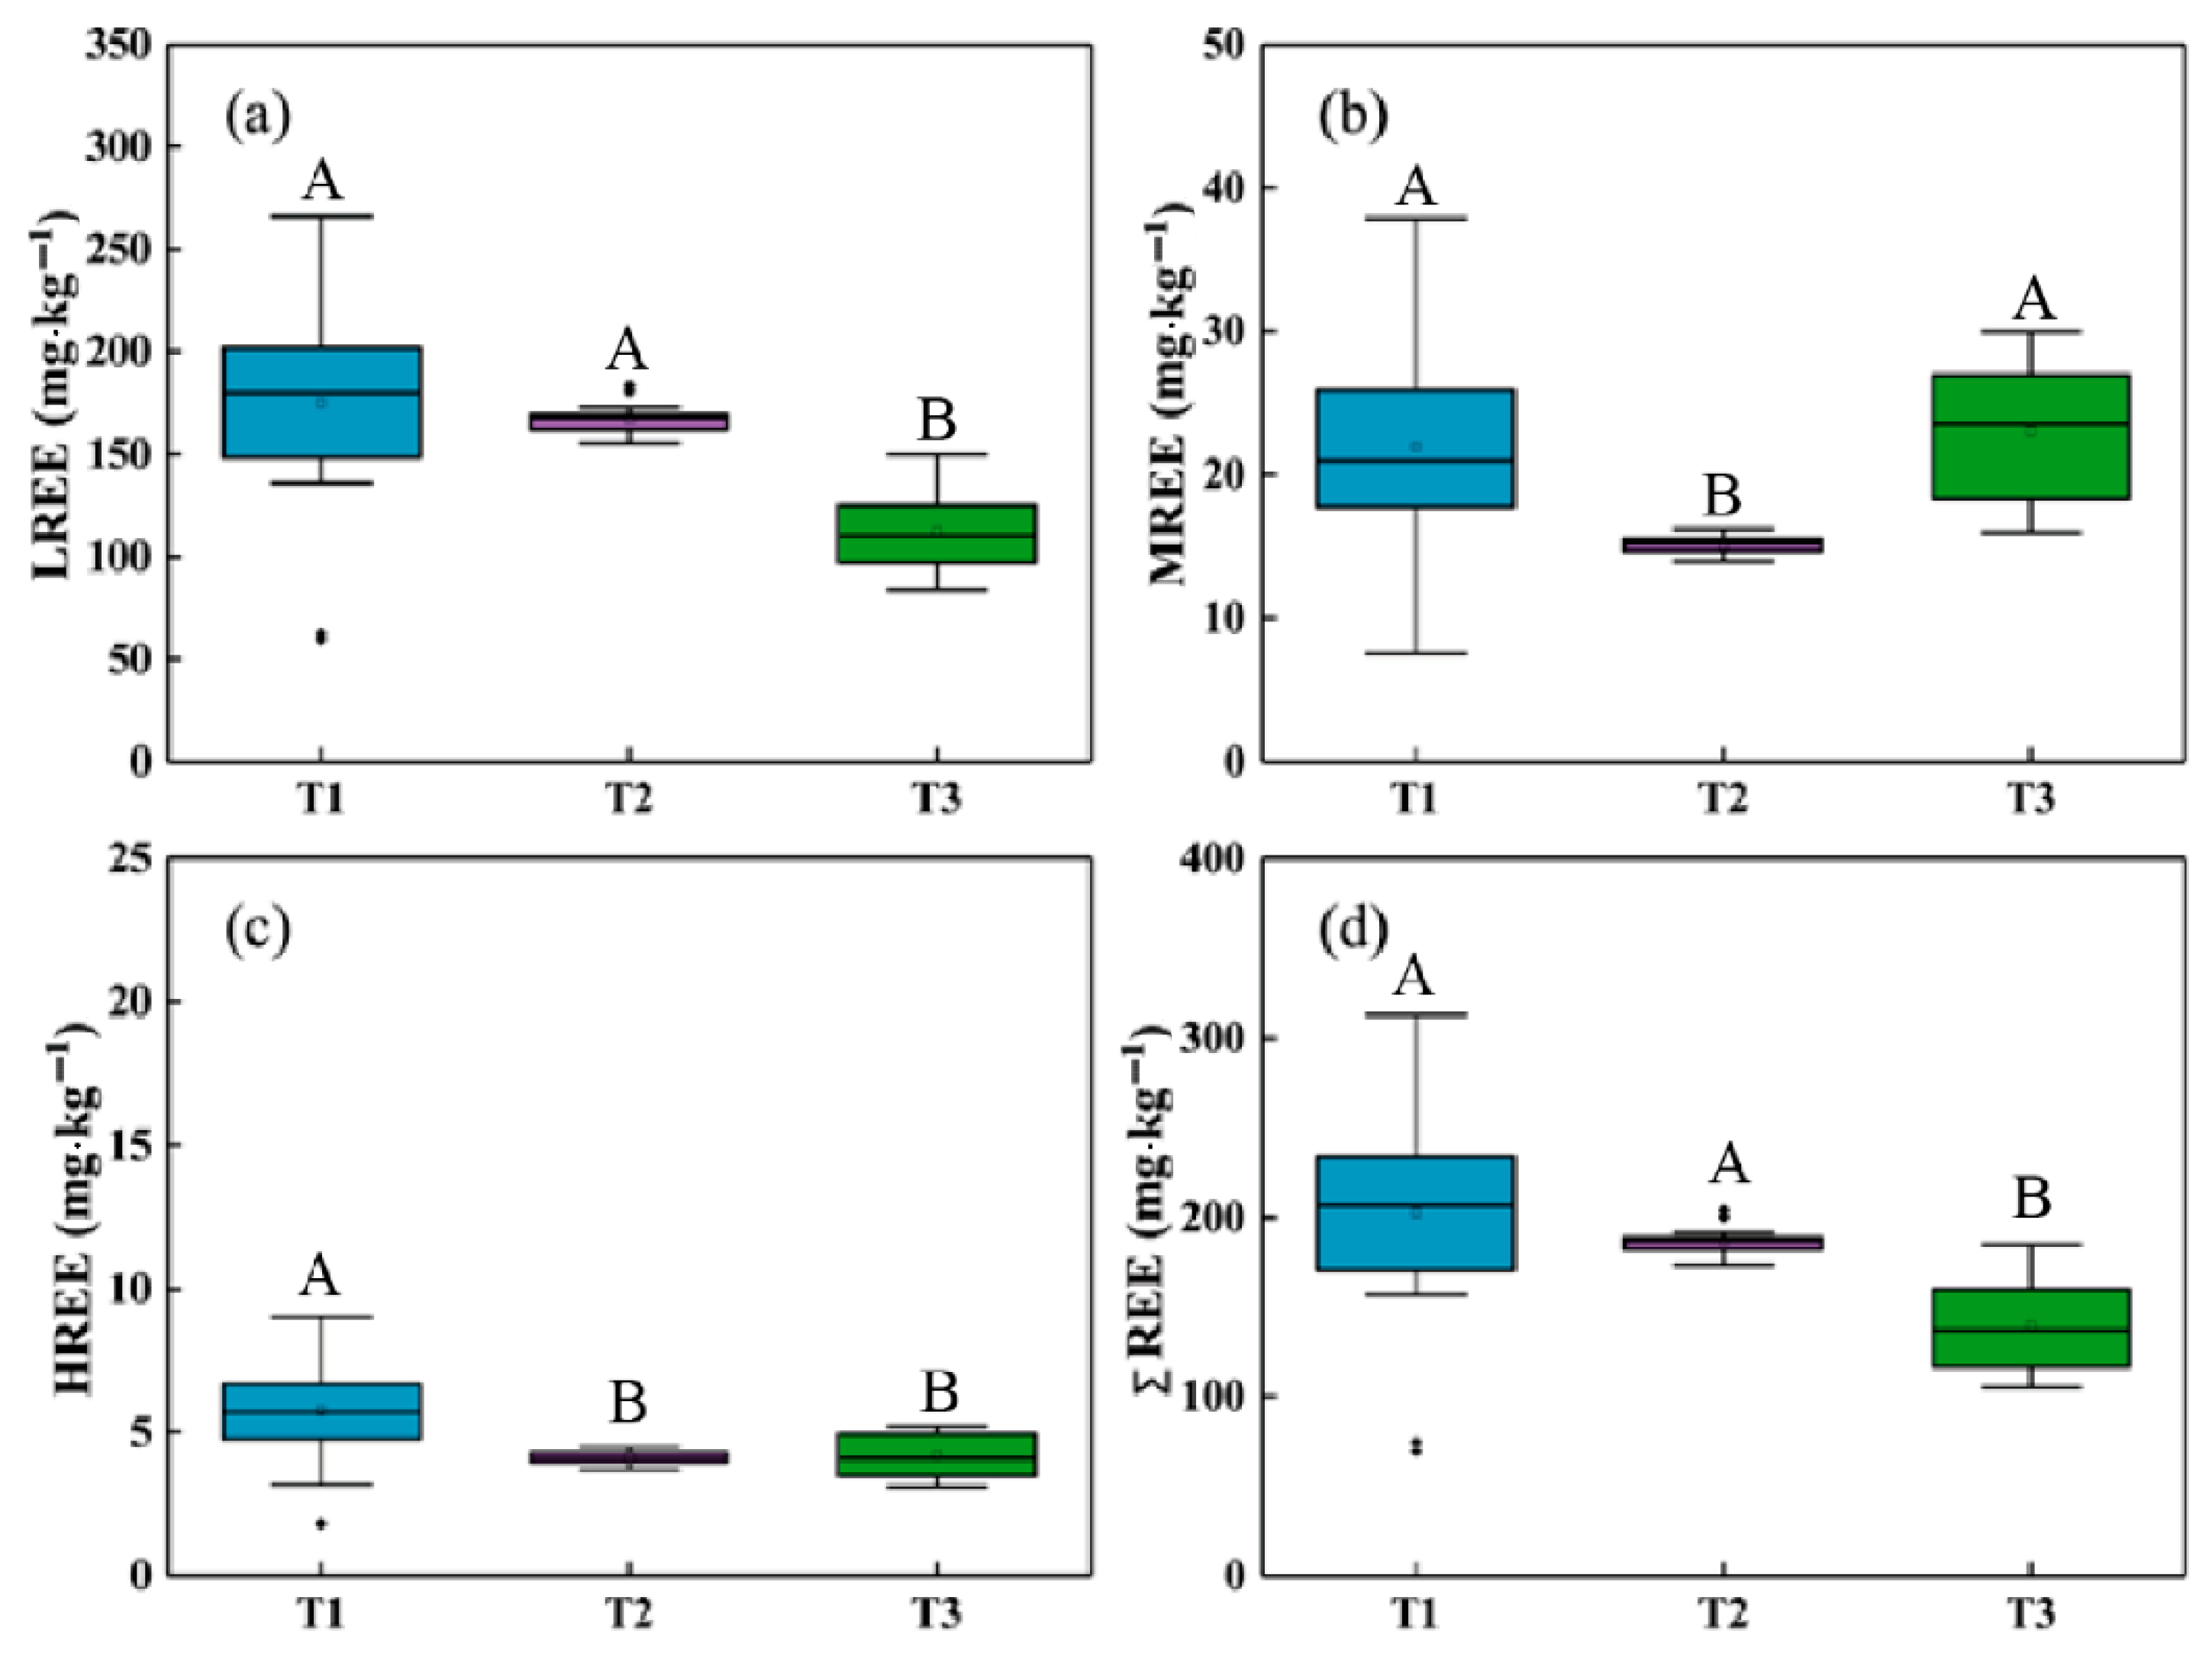
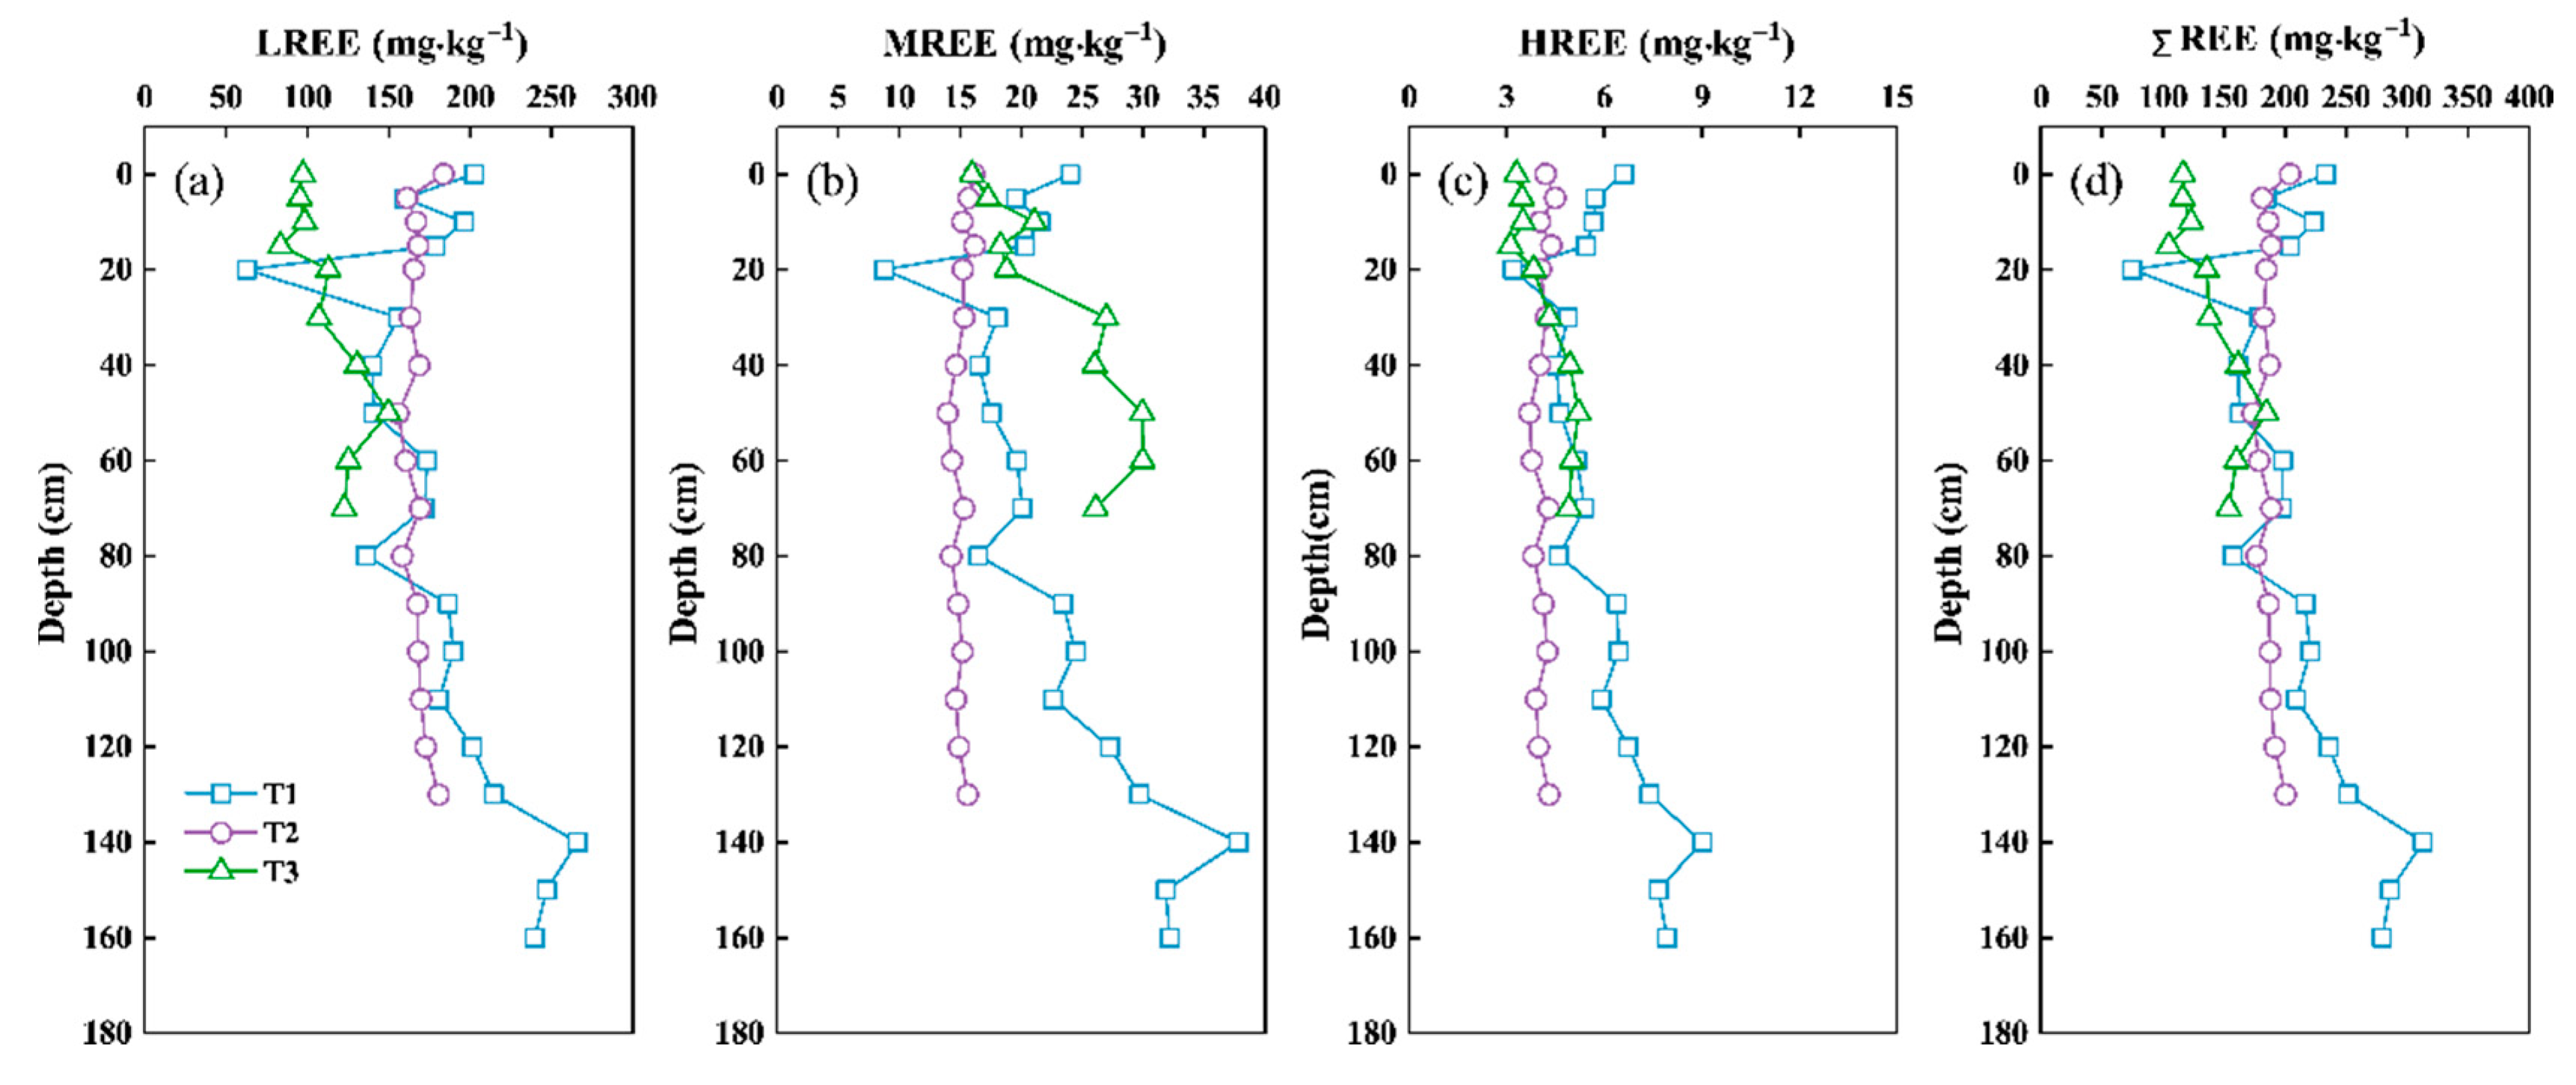
3.1. Distributions of REEs in Soil Profiles
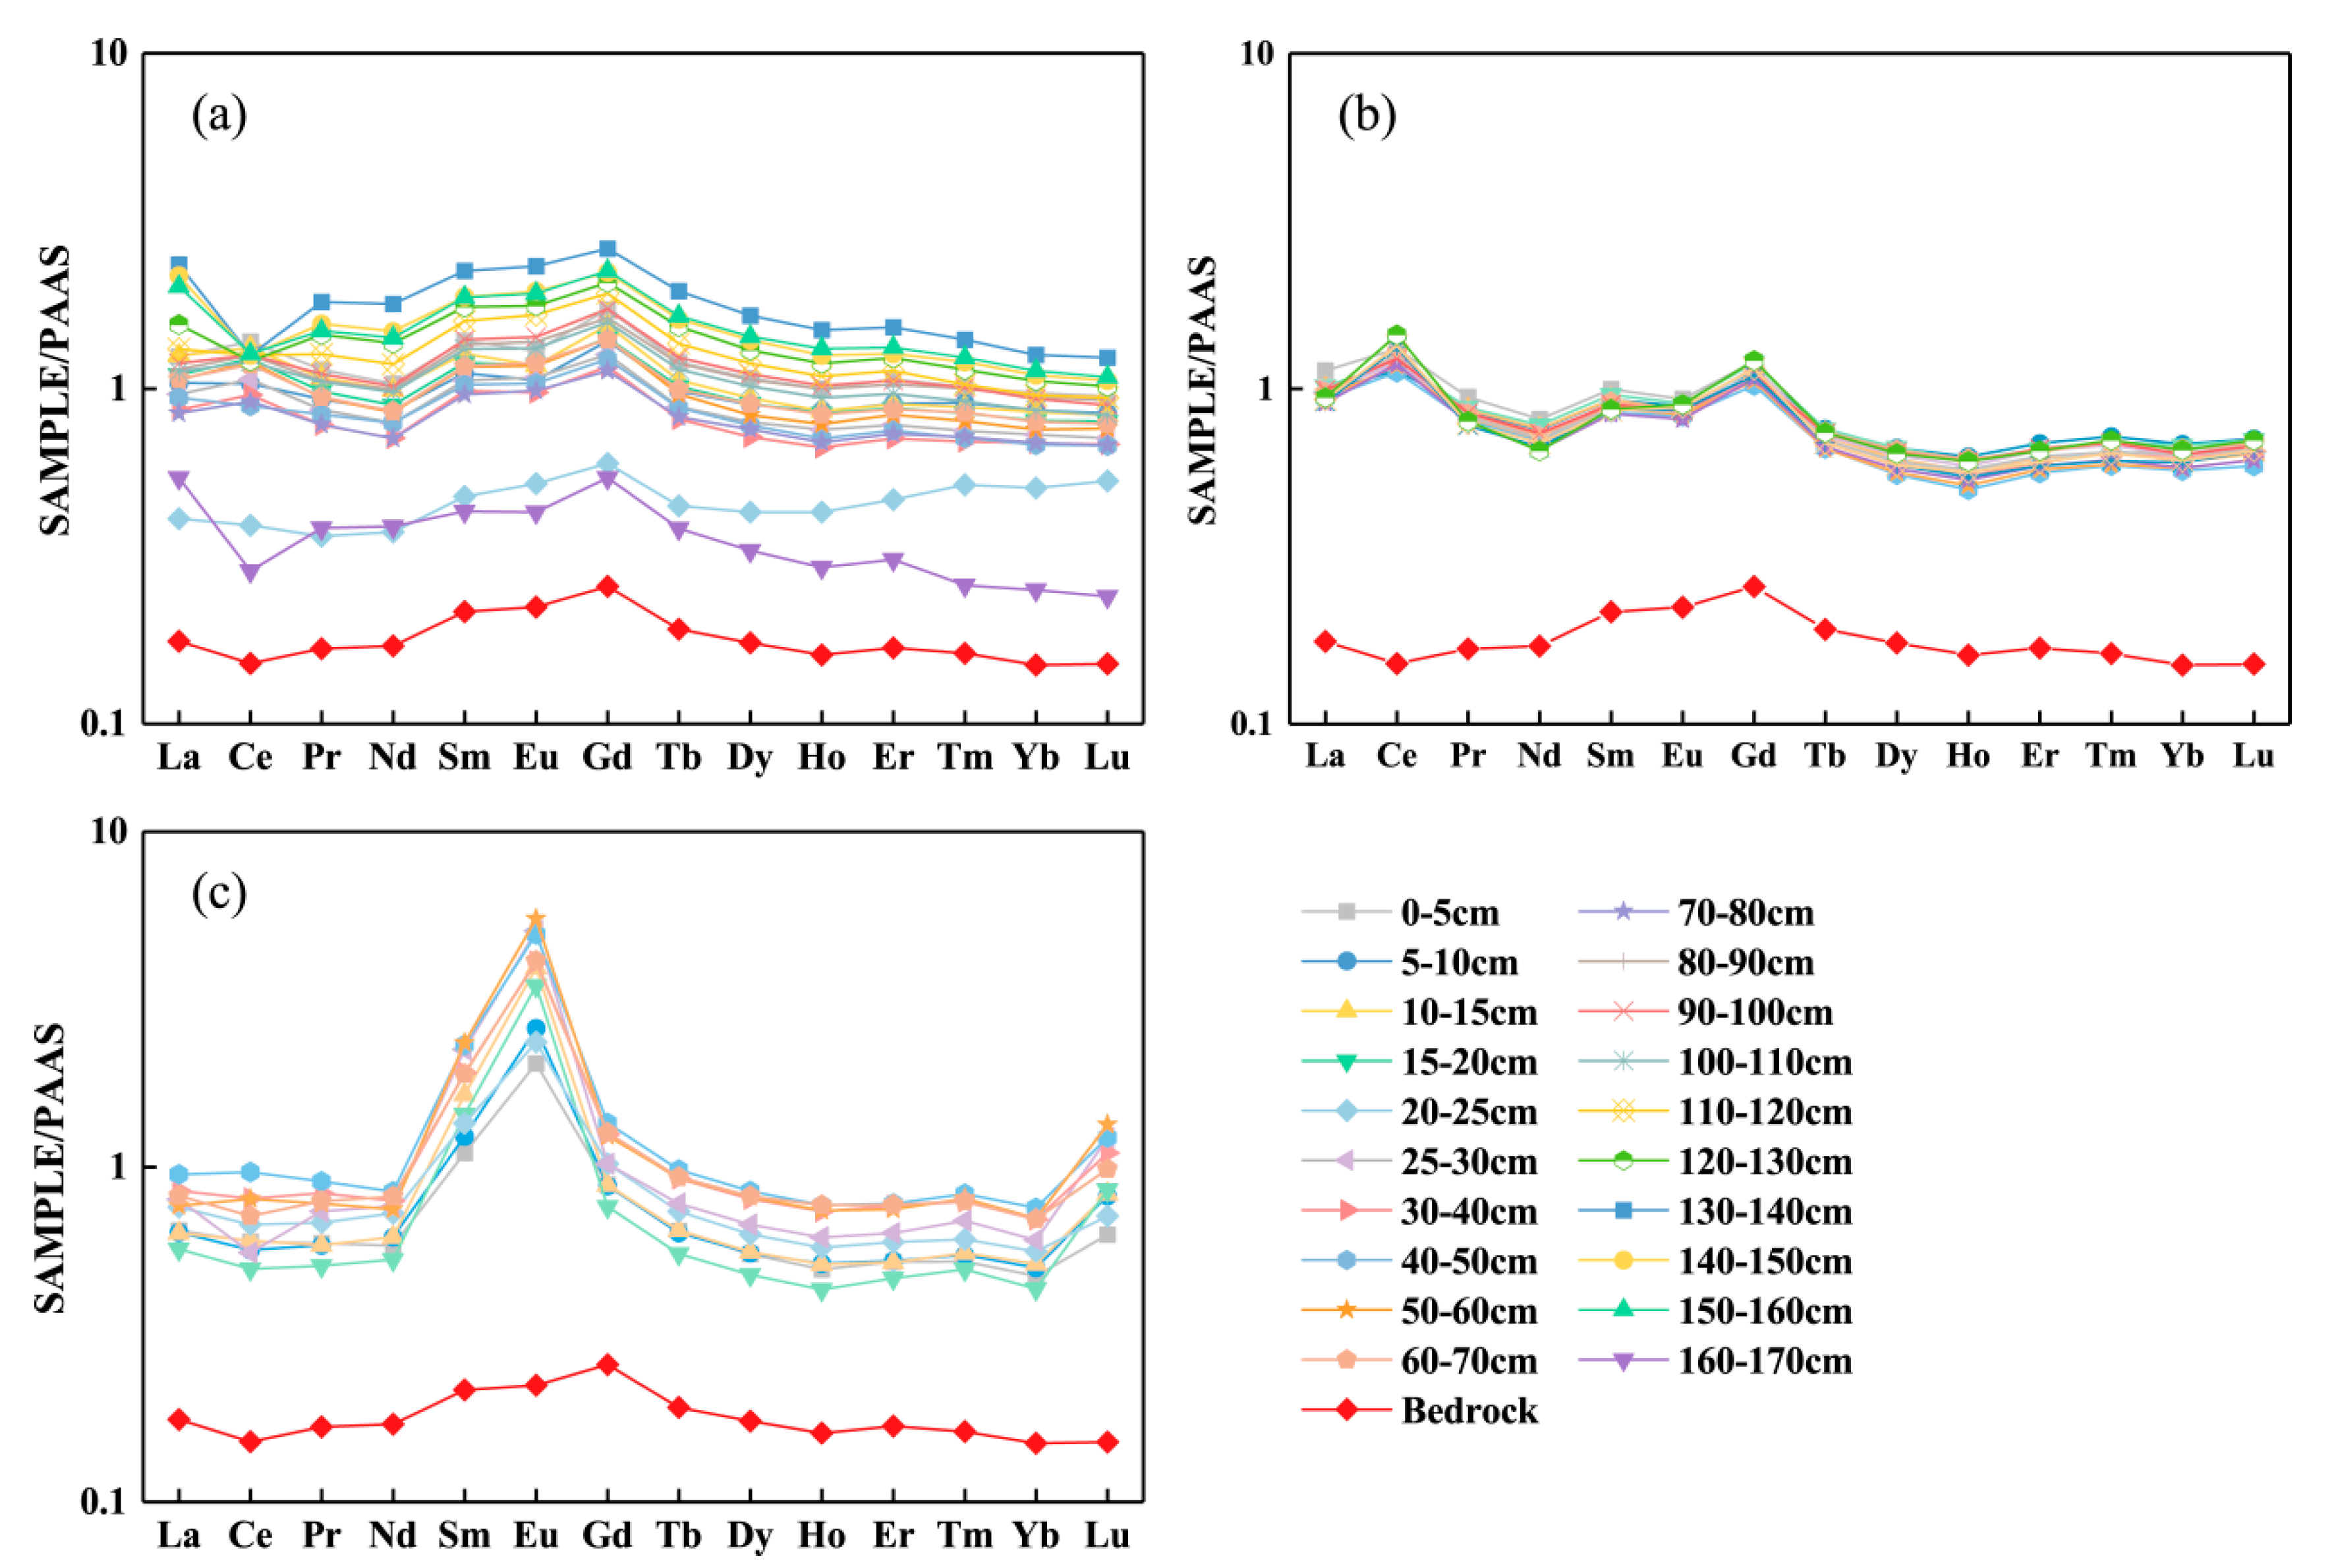
3.2. The Fractionation Patterns of LREE, MREE, and HREE
3.3. Ce and Eu Anomalies in Karst Soils
3.3.1. Ce Anomalies
3.3.2. Eu Anomalies
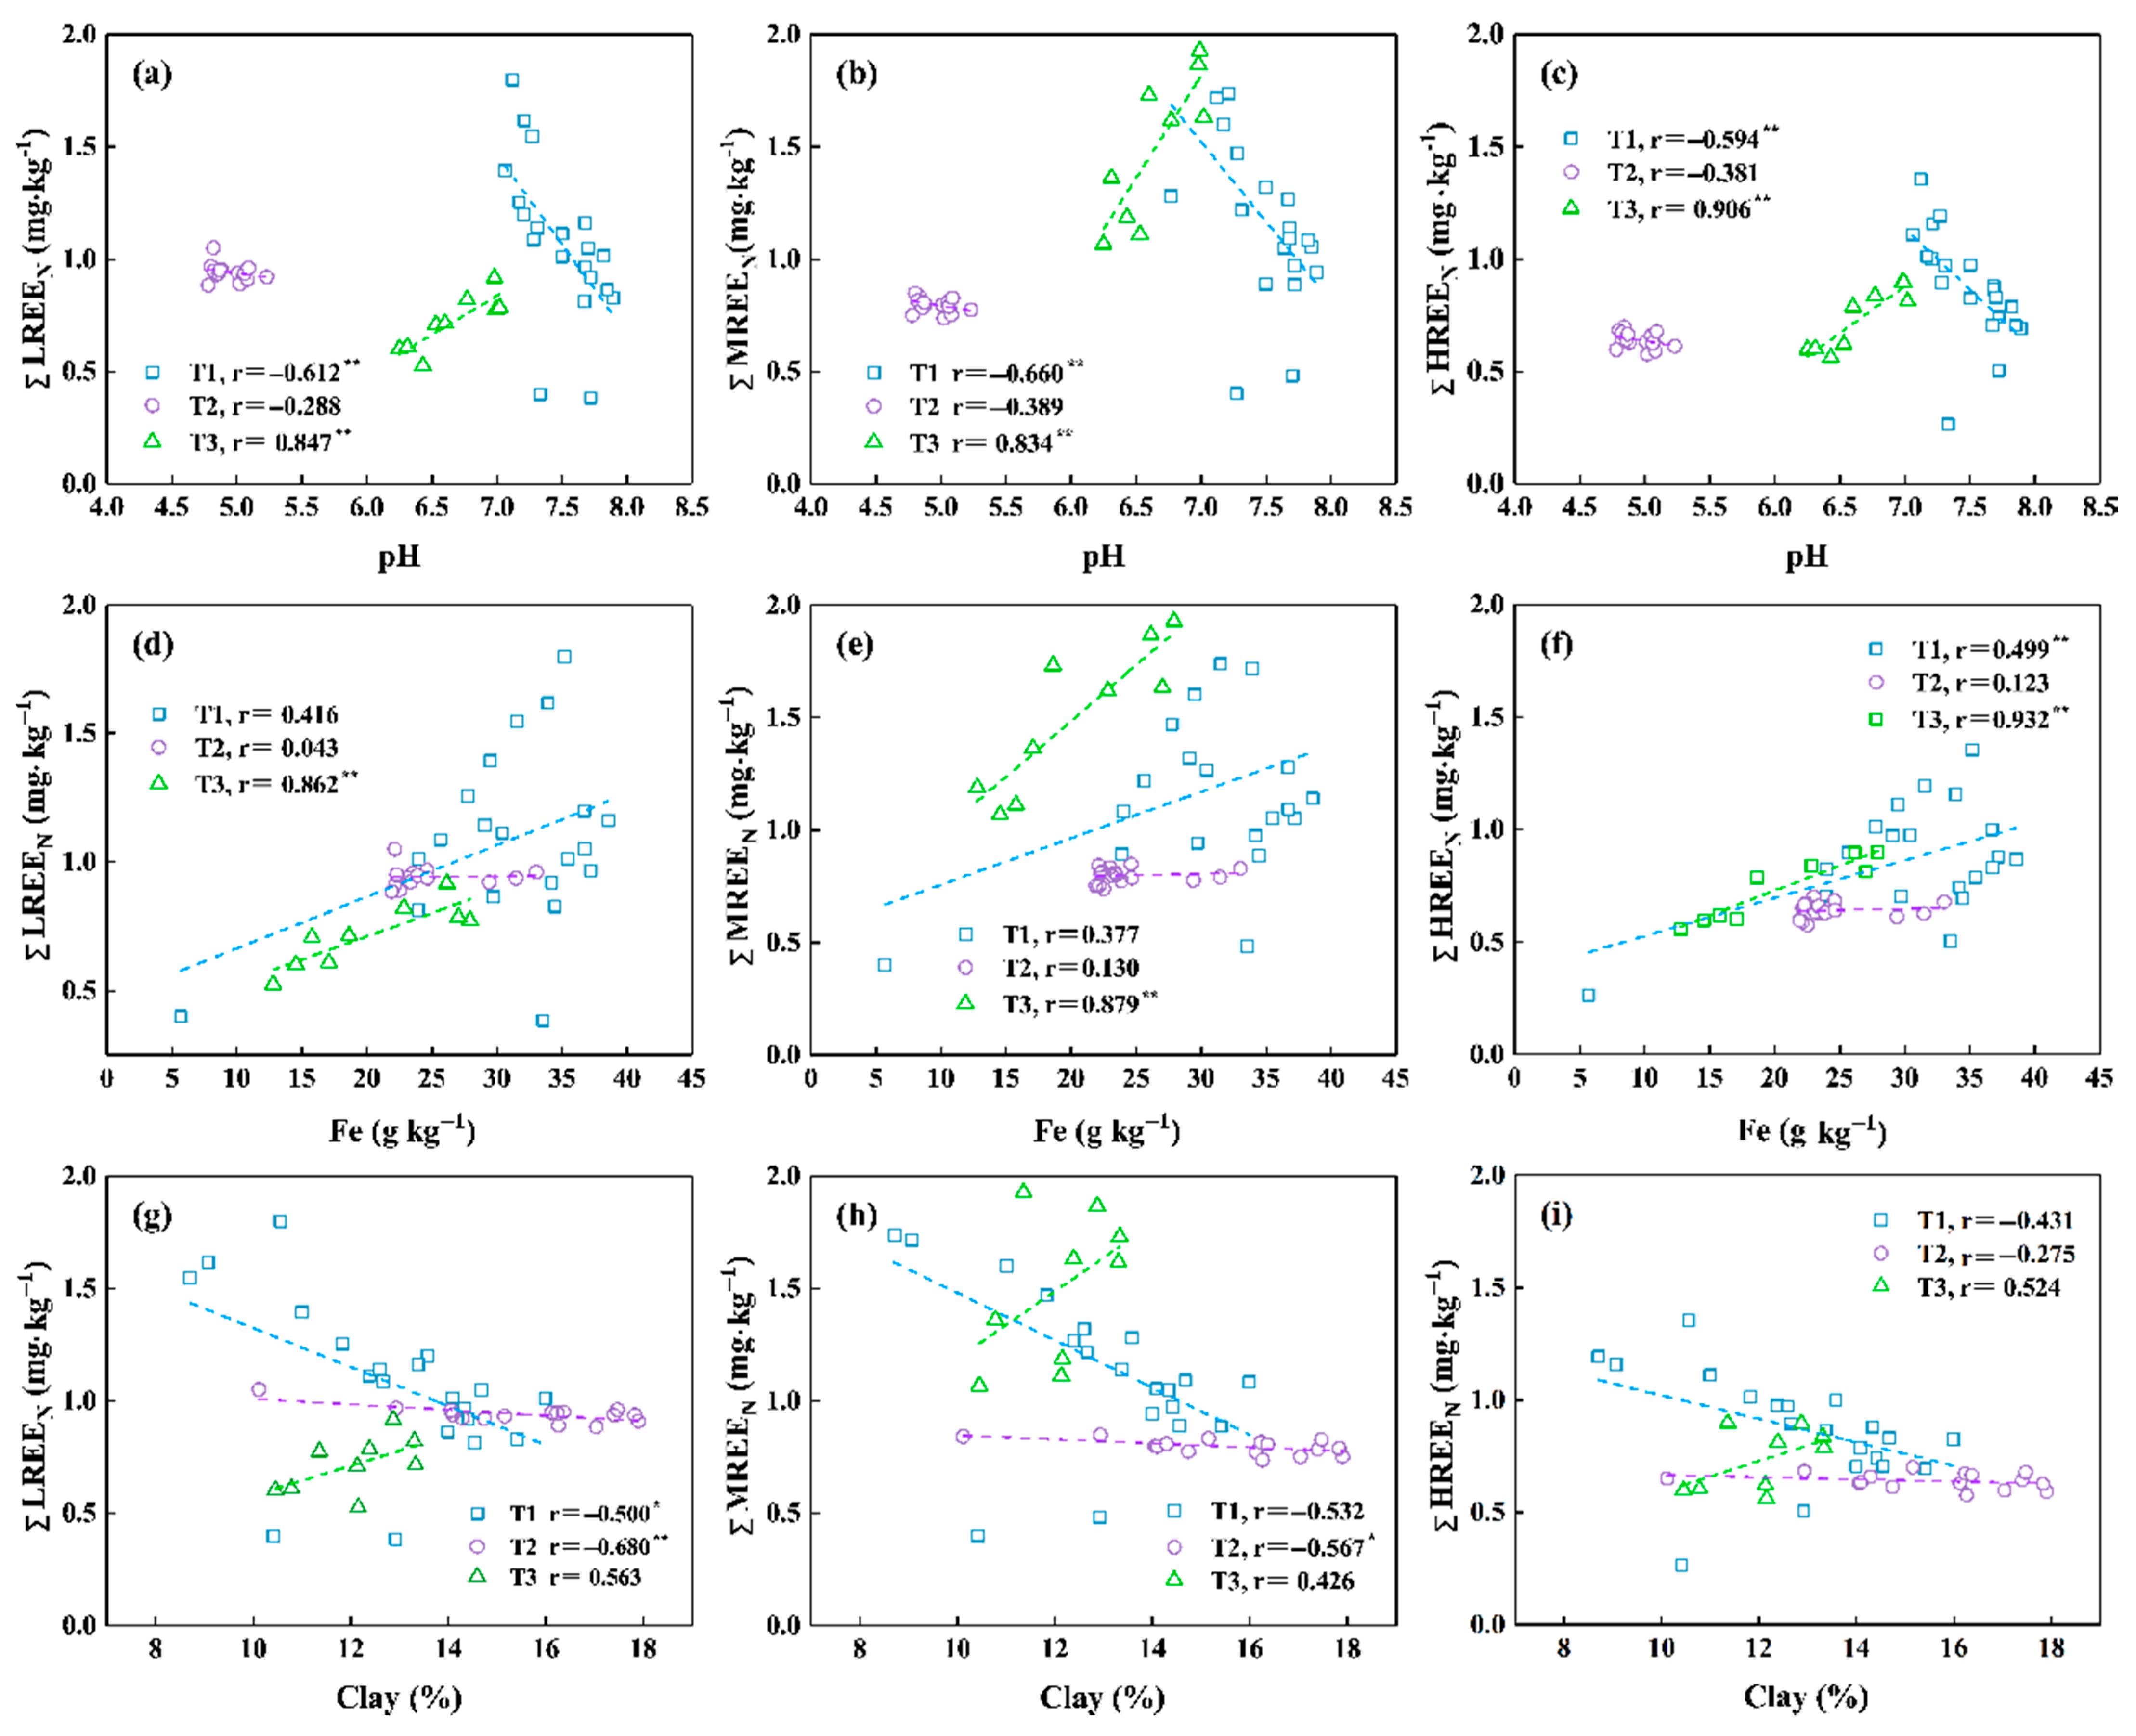
3.4. Impacts of Soil Properties on REEs Distribution
3.4.1. Soil pH
3.4.2. Clay Content
3.4.3. Fe Content
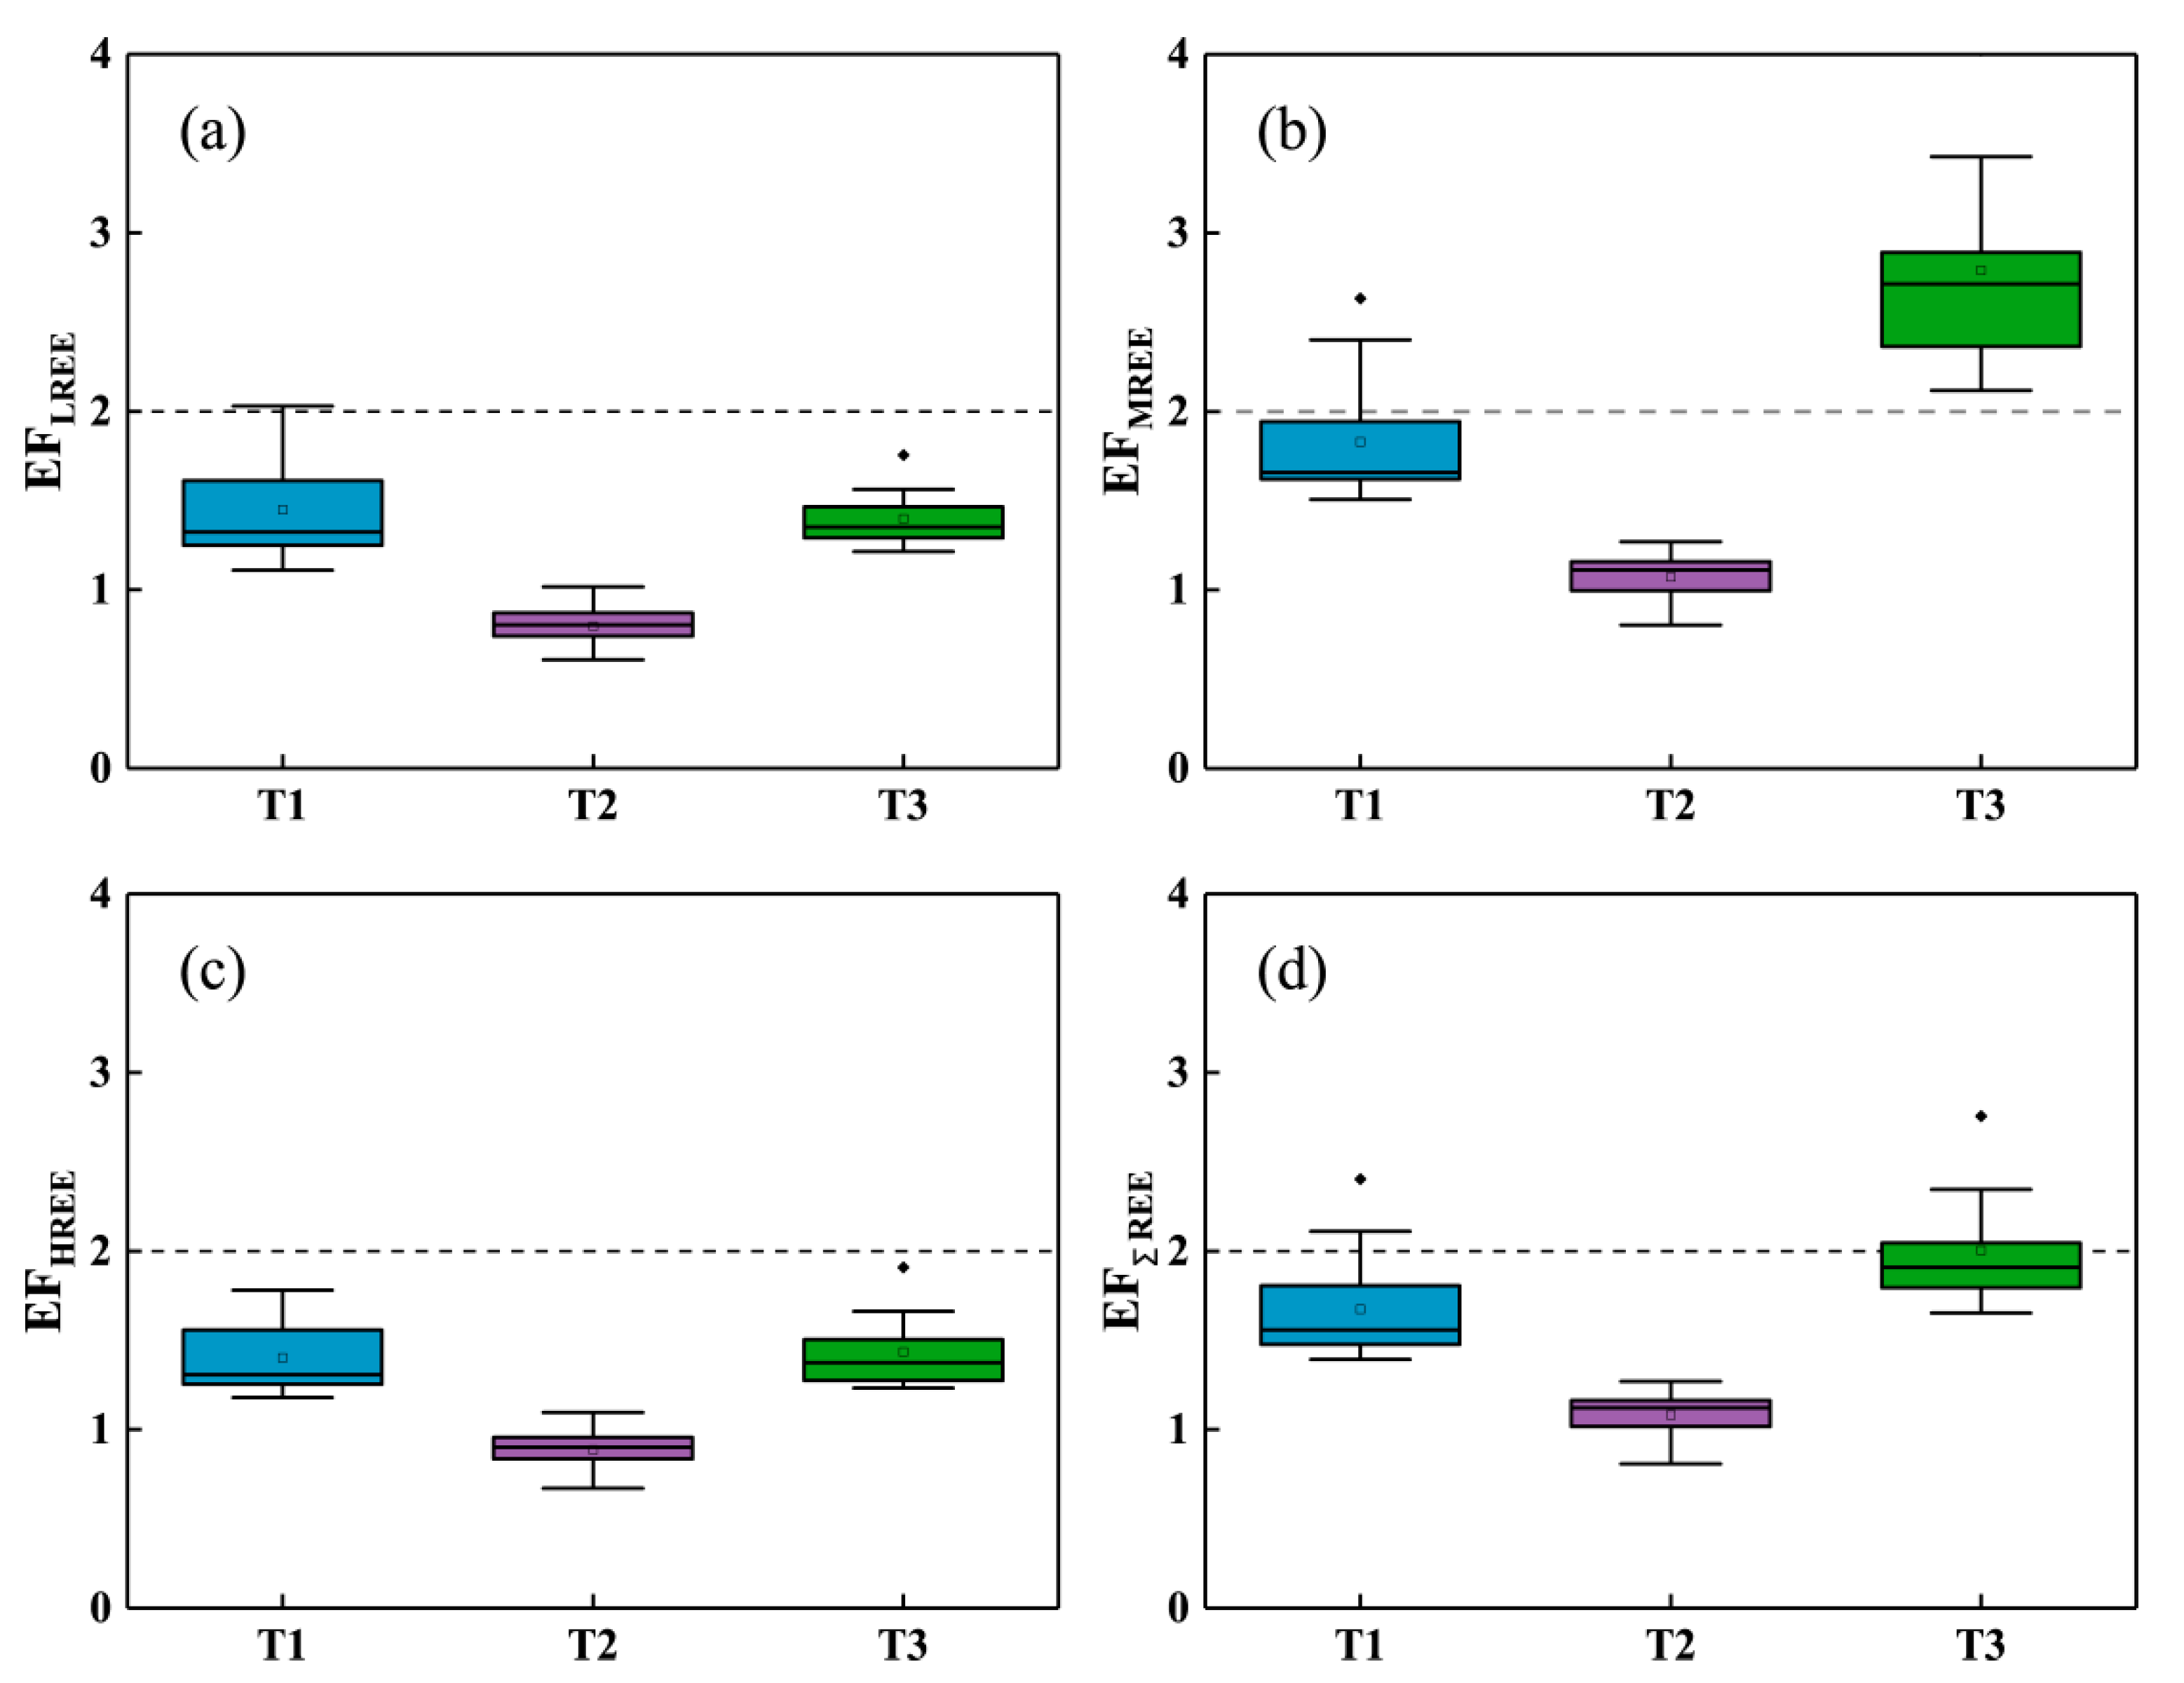
3.5. Environmental Effect of REEs
3.5.1. Enrichment Factors (EFs) of REEs
3.5.2. Environmental Implication of Soil REEs
4. Conclusions
Author Contributions
Funding
Institutional Review Board Statement
Informed Consent Statement
Acknowledgments
Conflicts of Interest
Appendix A

| Sampling Sites | Depth (cm) | Fe (g·kg−1) | Mn (g·kg−1) | pH | Clay (%) | La (mg·kg−1) | Ce (mg·kg−1) | Pr (mg·kg−1) | Nd (mg·kg−1) | Sm (mg·kg−1) | Eu (mg·kg−1) | Gd (mg·kg−1) | Tb (mg·kg−1) | Dy (mg·kg−1) | Ho (mg·kg−1) | Er (mg·kg−1) | Tm (mg·kg−1) | Yb (mg·kg−1) | Lu (mg·kg−1) |
|---|---|---|---|---|---|---|---|---|---|---|---|---|---|---|---|---|---|---|---|
| T1 | 0.00 | 36.70 | 0.68 | 7.21 | 13.58 | 47.56 | 109.85 | 10.05 | 35.03 | 7.70 | 1.40 | 8.02 | 0.93 | 5.02 | 0.99 | 3.04 | 0.41 | 2.73 | 0.41 |
| 5.00 | 37.20 | 0.64 | 7.68 | 14.34 | 39.71 | 82.35 | 8.21 | 29.12 | 6.17 | 1.14 | 6.47 | 0.76 | 4.19 | 0.85 | 2.57 | 0.37 | 2.43 | 0.37 | |
| 10.00 | 38.56 | 0.69 | 7.68 | 13.38 | 47.90 | 105.21 | 9.50 | 33.54 | 7.05 | 1.27 | 7.19 | 0.82 | 4.39 | 0.85 | 2.56 | 0.36 | 2.40 | 0.36 | |
| 15.00 | 36.72 | 0.67 | 7.70 | 14.68 | 42.03 | 97.58 | 8.65 | 30.25 | 6.63 | 1.27 | 6.58 | 0.79 | 4.22 | 0.84 | 2.49 | 0.34 | 2.26 | 0.35 | |
| 20.00 | 33.54 | 0.63 | 7.72 | 12.92 | 15.64 | 31.12 | 3.21 | 12.66 | 2.64 | 0.56 | 2.78 | 0.35 | 2.00 | 0.42 | 1.33 | 0.21 | 1.42 | 0.23 | |
| 30.00 | 34.20 | 0.61 | 7.72 | 14.41 | 36.73 | 84.66 | 7.63 | 26.76 | 5.85 | 1.17 | 5.89 | 0.68 | 3.72 | 0.75 | 2.22 | 0.30 | 2.05 | 0.31 | |
| 40.00 | 34.46 | 0.58 | 7.89 | 15.41 | 32.99 | 76.21 | 6.88 | 24.10 | 5.45 | 1.05 | 5.42 | 0.63 | 3.36 | 0.66 | 2.02 | 0.28 | 1.94 | 0.29 | |
| 50.00 | 29.73 | 0.56 | 7.85 | 13.99 | 35.83 | 70.64 | 7.39 | 26.73 | 5.69 | 1.12 | 5.70 | 0.68 | 3.64 | 0.70 | 2.14 | 0.29 | 1.92 | 0.29 | |
| 60.00 | 35.46 | 0.65 | 7.82 | 14.09 | 40.55 | 95.68 | 8.30 | 28.80 | 6.44 | 1.26 | 6.57 | 0.75 | 3.90 | 0.78 | 2.38 | 0.32 | 2.13 | 0.33 | |
| 70.00 | 24.00 | 0.45 | 7.50 | 15.99 | 40.77 | 93.93 | 8.34 | 29.02 | 6.47 | 1.29 | 6.54 | 0.77 | 4.21 | 0.83 | 2.47 | 0.34 | 2.25 | 0.34 | |
| 80.00 | 23.92 | 0.40 | 7.67 | 14.55 | 32.22 | 72.74 | 6.90 | 24.08 | 5.33 | 1.06 | 5.26 | 0.64 | 3.53 | 0.69 | 2.09 | 0.29 | 1.94 | 0.29 | |
| 90.00 | 30.42 | 0.34 | 7.50 | 12.38 | 43.58 | 99.99 | 9.32 | 33.72 | 7.50 | 1.49 | 7.56 | 0.92 | 4.97 | 0.99 | 2.94 | 0.40 | 2.66 | 0.40 | |
| 100.00 | 29.09 | 0.40 | 7.31 | 12.60 | 45.35 | 100.19 | 9.77 | 34.36 | 7.76 | 1.54 | 8.04 | 0.96 | 5.17 | 1.01 | 3.01 | 0.41 | 2.63 | 0.39 | |
| 110.00 | 25.64 | 0.42 | 7.28 | 12.66 | 42.96 | 95.57 | 9.25 | 33.07 | 7.27 | 1.42 | 7.36 | 0.88 | 4.75 | 0.93 | 2.75 | 0.37 | 2.43 | 0.36 | |
| 120.00 | 27.74 | 0.45 | 7.17 | 11.83 | 50.10 | 100.11 | 11.19 | 40.06 | 8.83 | 1.79 | 8.96 | 1.05 | 5.56 | 1.08 | 3.22 | 0.42 | 2.69 | 0.41 | |
| 130.00 | 29.49 | 0.43 | 7.06 | 11.00 | 59.26 | 96.06 | 12.78 | 46.30 | 9.70 | 1.91 | 9.65 | 1.19 | 6.09 | 1.18 | 3.51 | 0.46 | 2.97 | 0.44 | |
| 140.00 | 35.20 | 0.48 | 7.12 | 10.56 | 89.38 | 99.94 | 16.01 | 60.66 | 12.44 | 2.50 | 12.17 | 1.51 | 7.73 | 1.48 | 4.34 | 0.57 | 3.55 | 0.54 | |
| 150.00 | 33.92 | 0.51 | 7.21 | 9.07 | 82.83 | 100.00 | 13.77 | 50.33 | 10.41 | 2.10 | 10.34 | 1.25 | 6.53 | 1.25 | 3.62 | 0.49 | 3.09 | 0.46 | |
| 160.00 | 31.50 | 0.37 | 7.27 | 8.71 | 77.02 | 101.17 | 13.12 | 48.08 | 10.40 | 2.07 | 10.45 | 1.27 | 6.69 | 1.30 | 3.78 | 0.50 | 3.18 | 0.47 | |
| Bedrock | 4.47 | 0.09 | 6.64 | 12.61 | 1.50 | 5.89 | 1.24 | 0.24 | 1.23 | 0.15 | 0.82 | 0.16 | 0.49 | 0.07 | 0.43 | 0.07 | |||
| T2 | 0.00 | 22.13 | 0.30 | 4.82 | 10.12 | 43.27 | 104.60 | 8.34 | 27.45 | 5.53 | 1.01 | 5.61 | 0.57 | 2.88 | 0.57 | 1.79 | 0.26 | 1.86 | 0.29 |
| 5.00 | 23.00 | 0.26 | 4.84 | 15.16 | 37.38 | 90.62 | 7.59 | 25.57 | 5.15 | 0.96 | 5.27 | 0.59 | 3.12 | 0.62 | 1.96 | 0.29 | 1.93 | 0.31 | |
| 10.00 | 23.49 | 0.28 | 4.88 | 14.05 | 38.22 | 95.22 | 7.66 | 25.80 | 5.16 | 0.93 | 5.12 | 0.56 | 2.88 | 0.56 | 1.77 | 0.26 | 1.71 | 0.28 | |
| 15.00 | 24.61 | 0.36 | 4.80 | 12.94 | 38.85 | 95.08 | 7.76 | 26.43 | 5.33 | 0.98 | 5.57 | 0.58 | 3.12 | 0.61 | 1.88 | 0.28 | 1.91 | 0.31 | |
| 20.00 | 23.14 | 0.33 | 5.01 | 14.10 | 37.47 | 96.15 | 7.45 | 24.48 | 5.02 | 0.93 | 5.34 | 0.54 | 2.84 | 0.56 | 1.73 | 0.26 | 1.78 | 0.28 | |
| 30.00 | 23.37 | 0.32 | 5.05 | 14.30 | 37.15 | 95.22 | 7.33 | 23.47 | 4.90 | 0.94 | 5.41 | 0.56 | 2.96 | 0.58 | 1.86 | 0.27 | 1.78 | 0.29 | |
| 40.00 | 23.88 | 0.33 | 5.07 | 16.12 | 37.69 | 98.85 | 7.41 | 24.61 | 4.94 | 0.92 | 4.98 | 0.53 | 2.76 | 0.54 | 1.72 | 0.26 | 1.77 | 0.28 | |
| 50.00 | 22.50 | 0.32 | 5.02 | 16.26 | 35.73 | 89.09 | 7.09 | 23.82 | 4.72 | 0.89 | 4.77 | 0.51 | 2.59 | 0.50 | 1.60 | 0.24 | 1.61 | 0.25 | |
| 60.00 | 22.16 | 0.31 | 5.08 | 17.90 | 35.94 | 93.22 | 7.23 | 24.07 | 4.87 | 0.90 | 4.92 | 0.51 | 2.63 | 0.51 | 1.63 | 0.24 | 1.63 | 0.27 | |
| 70.00 | 22.40 | 0.34 | 4.82 | 16.23 | 37.14 | 100.20 | 7.41 | 24.33 | 5.07 | 0.94 | 5.11 | 0.58 | 3.06 | 0.61 | 1.85 | 0.28 | 1.86 | 0.30 | |
| 80.00 | 21.92 | 0.31 | 4.78 | 17.04 | 34.63 | 94.45 | 6.97 | 22.23 | 4.67 | 0.88 | 5.00 | 0.52 | 2.70 | 0.53 | 1.67 | 0.25 | 1.64 | 0.26 | |
| 90.00 | 24.64 | 0.33 | 4.86 | 17.40 | 36.78 | 99.46 | 7.29 | 24.08 | 4.84 | 0.92 | 5.16 | 0.55 | 2.83 | 0.57 | 1.79 | 0.26 | 1.79 | 0.28 | |
| 100.00 | 22.27 | 0.32 | 4.87 | 16.37 | 37.81 | 97.95 | 7.47 | 24.97 | 4.99 | 0.93 | 5.12 | 0.57 | 3.01 | 0.60 | 1.89 | 0.28 | 1.80 | 0.29 | |
| 110.00 | 29.41 | 1.63 | 5.23 | 14.74 | 34.93 | 105.27 | 6.86 | 22.70 | 4.81 | 0.94 | 5.10 | 0.53 | 2.77 | 0.54 | 1.68 | 0.25 | 1.70 | 0.28 | |
| 120.00 | 31.47 | 0.78 | 5.06 | 17.82 | 35.49 | 106.85 | 6.95 | 23.34 | 4.77 | 0.95 | 5.35 | 0.53 | 2.77 | 0.56 | 1.72 | 0.26 | 1.72 | 0.28 | |
| 130.00 | 33.02 | 0.53 | 5.09 | 17.47 | 35.98 | 115.35 | 7.06 | 22.13 | 4.82 | 0.97 | 5.66 | 0.57 | 3.00 | 0.60 | 1.86 | 0.28 | 1.85 | 0.30 | |
| T3 | 0.00 | 14.58 | 0.22 | 0.00 | 24.70 | 47.57 | 5.22 | 19.76 | 6.10 | 2.20 | 4.12 | 0.50 | 2.57 | 0.49 | 1.48 | 0.21 | 1.33 | 0.27 | |
| 5.00 | 14.56 | 0.21 | 6.25 | 10.45 | 24.37 | 45.03 | 5.16 | 20.92 | 6.84 | 2.79 | 4.09 | 0.49 | 2.59 | 0.51 | 1.49 | 0.22 | 1.41 | 0.36 | |
| 10.00 | 17.08 | 0.23 | 6.31 | 10.79 | 24.20 | 47.92 | 5.15 | 20.93 | 9.12 | 4.24 | 4.11 | 0.50 | 2.61 | 0.51 | 1.48 | 0.22 | 1.45 | 0.36 | |
| 15.00 | 12.80 | 0.16 | 6.43 | 12.16 | 21.69 | 39.44 | 4.47 | 17.92 | 7.96 | 3.75 | 3.54 | 0.43 | 2.23 | 0.43 | 1.32 | 0.20 | 1.22 | 0.37 | |
| 20.00 | 15.78 | 0.19 | 6.53 | 12.13 | 28.99 | 53.45 | 6.01 | 24.60 | 7.47 | 2.54 | 4.75 | 0.57 | 2.95 | 0.57 | 1.70 | 0.25 | 1.58 | 0.31 | |
| 30.00 | 18.63 | 0.22 | 6.60 | 13.33 | 30.56 | 44.12 | 6.51 | 25.86 | 12.41 | 5.46 | 4.76 | 0.60 | 3.15 | 0.61 | 1.81 | 0.28 | 1.70 | 0.53 | |
| 40.00 | 22.84 | 0.25 | 6.77 | 13.30 | 32.39 | 63.99 | 7.38 | 26.85 | 10.60 | 4.41 | 5.82 | 0.71 | 3.75 | 0.73 | 2.18 | 0.32 | 1.97 | 0.48 | |
| 50.00 | 26.14 | 0.24 | 6.98 | 12.87 | 36.25 | 76.77 | 7.98 | 28.61 | 12.82 | 5.34 | 6.30 | 0.76 | 3.96 | 0.76 | 2.21 | 0.34 | 2.13 | 0.53 | |
| 60.00 | 27.93 | 0.26 | 6.99 | 11.36 | 29.23 | 63.93 | 6.86 | 25.28 | 13.01 | 5.94 | 5.77 | 0.72 | 3.80 | 0.73 | 2.13 | 0.33 | 1.98 | 0.58 | |
| 70.00 | 27.02 | 0.28 | 7.02 | 12.39 | 31.33 | 56.72 | 6.96 | 27.64 | 10.50 | 4.45 | 5.88 | 0.72 | 3.83 | 0.76 | 2.20 | 0.32 | 1.97 | 0.43 | |
| Bedrock | 3.76 | 0.06 | 6.84 | 11.49 | 1.45 | 5.69 | 1.16 | 0.25 | 1.17 | 0.15 | 0.81 | 0.16 | 0.47 | 0.06 | 0.41 | 0.06 | |||
References
- Castor, S.B.; Hedrick, J.B. Rare earth elements. In Industrial Minerals and Rocks; Kogel, J.E., Trivedi, N.C., Barker, J.M., Eds.; Society for Mining, Metallurgy and Exploration: Englewood, IL, USA, 2006; Available online: http://www.rareelementresources.com/i/pdf/RareEarthsCastorHedrickIMAR7.pdf (accessed on 21 November 2020).
- Tyler, G. Rare earth elements in soil and plant systems—A review. Plant Soil 2004, 267, 191–206. [Google Scholar] [CrossRef]
- Fu, F.; Akagi, T.; Yabuki, S.; Iwaki, M. The variation of REE (rare earth elements) patterns in soil–grown plants: A new proxy for the source of rare earth elements and silicon in plants. Plant Soil 2001, 235, 53–64. [Google Scholar] [CrossRef]
- Noack, C.W.; Dzombak, D.A.; Karamalidis, A.K. Rare earth element distributions and trends in natural waters with a focus on groundwater. Environ. Sci. Technol. 2014, 48, 4317–4326. [Google Scholar] [CrossRef] [PubMed]
- Compton, J.S.; White, R.A.; Smith, M. Rare earth element behavior in soils and salt pan sediments of a semi–arid granitic terrain in the Western Cape, South Africa. Chem. Geol. 2003, 201, 239–255. [Google Scholar] [CrossRef]
- Vázquez–Ortega, A.; Perdrial, J.; Harpold, A.; Zapata–Ríos, X.; Rasmussen, C.; McIntosh, J.; Schaap, M.; Pelletier, J.D.; Brooks, P.D.; Amistadi, M.K.; et al. Rare earth elements as reactive tracers of biogeochemical weathering in forested rhyolitic terrain. Chem. Geol. 2015, 391, 19–32. [Google Scholar] [CrossRef]
- Haskin, L.A.; Haskin, M.A.; Frey, F.A.; Wildeman, T.R. Relative and Absolute Terrestrial Abundances of the Rare Earths. In Origin and Distribution of the Elements; Ahrens, L.H., Ed.; Pergamon: Oxford, UK, 1968. [Google Scholar] [CrossRef]
- Ji, H.; Wang, S.; Ouyang, Z.; Zhang, S.; Sun, C.; Liu, X.; Zhou, D. Geochemistry of red residua underlying dolomites in karst terrains of Yunnan–Guizhou Plateau II. The mobility of rare earth elements during weathering. Chem. Geol. 2004, 203, 29–50. [Google Scholar] [CrossRef]
- Pang, X.; Li, D.; Peng, A. Application of rare–earth elements in the agriculture of china and its environmental behavior in soil. J. Soils Sediments 2001, 1, 124. [Google Scholar] [CrossRef]
- Huang, H.; Lin, C.; Yu, R.; Yan, Y.; Hu, G.; Wang, Q. Spatial distribution and source appointment of rare earth elements in paddy soils of Jiulong River Basin, Southeast China. J. Geochem. Explor. 2019, 200, 213–220. [Google Scholar] [CrossRef]
- Zhu, Z.; Wang, Z.; Li, J.; Li, Y.; Zhang, Z.; Zhang, P. Distribution of rare earth elements in sewage–irrigated soil profiles in Tianjin, China. J. Rare Earths 2012, 30, 609–613. [Google Scholar] [CrossRef]
- Hanson, G.N. Rare earth elements in petrogenetic studies of igneous systems. Annu. Rev. Earth Planet. Sci. 1980, 8, 371–406. [Google Scholar] [CrossRef]
- Piper, D.Z. Rare earth elements in the sedimentary cycle: A summary. Chem. Geol. 1974, 14, 285–304. [Google Scholar] [CrossRef]
- Haskin, M.A.; Haskin, L.A. Rare Earths in European Shales: A Redetermination. Science 1966, 154, 507–509. [Google Scholar]
- Han, G.; Liu, C. Dissolved rare earth elements in river waters draining karst terrains in Guizhou Province, China. Aquat. Geochem. 2007, 13, 95–107. [Google Scholar] [CrossRef]
- Henderson, P. General Geochemical Properties and Abundances of the Rare Earth Elements. In Developments in Geochemistry; Henderson, P., Ed.; Elsevier: Amsterdam, The Netherlands, 1984; Volume 2, pp. 1–32. [Google Scholar]
- Pagano, G.; Guida, M.; Tommasi, F.; Oral, R. Health effects and toxicity mechanisms of rare earth elements—Knowledge gaps and research prospects. Ecotoxicol. Environ. Saf. 2015, 115, 40–48. [Google Scholar] [CrossRef] [PubMed]
- Wyttenbach, A.; Furrer, V.; Schleppi, P.; Tobler, L. Rare earth elements in soil and in soil–grown plants. Plant Soil 1998, 199, 267–273. [Google Scholar] [CrossRef]
- Han, G.; Li, F.; Tang, Y. Variations in soil organic carbon contents and isotopic compositions under different land uses in a typical karst area in Southwest China. Geochem. J. 2015, 49, 63–71. [Google Scholar] [CrossRef] [Green Version]
- Mihajlovic, J.; Bauriegel, A.; Stärk, H.-J.; Roßkopf, N.; Zeitz, J.; Milbert, G.; Rinklebe, J. Rare earth elements in soil profiles of various ecosystems across Germany. Appl. Geochem. 2019, 102, 197–217. [Google Scholar] [CrossRef]
- Brioschi, L.; Steinmann, M.; Lucot, E.; Pierret, M.; Stille, P.; Prunier, J.; Badot, P. Transfer of rare earth elements (REE) from natural soil to plant systems: Implications for the environmental availability of anthropogenic REE. Plant Soil 2013, 366, 143–163. [Google Scholar] [CrossRef]
- Ramos, S.J.; Dinali, G.S.; Oliveira, C.; Martins, G.C.; Moreira, C.G.; Siqueira, J.O.; Guilherme, L.R.G. Rare Earth Elements in the Soil Environment. Curr. Pollut. Rep. 2016, 2, 28–50. [Google Scholar] [CrossRef] [Green Version]
- Cao, X.; Chen, Y.; Wang, X. The effects of change of environmental conditions on the release and species transformation of rare earth elements (REEs) in soil. China Environ. Sci. 2000, 20, 486–490. [Google Scholar]
- Feng, J. Behaviour of rare earth elements and yttrium in ferromanganese concretions, gibbsite spots, and the surrounding terra rossa over dolomite during chemical weathering. Chem. Geol. 2010, 271, 112–132. [Google Scholar] [CrossRef]
- Gammons, C.H.; Wood, S.A.; Nimick, D.A. Diel behavior of rare earth elements in a mountain stream with acidic to neutral pH. Geochim. Cosmochim. Acta 2005, 69, 3747–3758. [Google Scholar] [CrossRef]
- Li, D.; Huang, S.; Wang, D.; Wang, W.; Peng, A. Transfer characteristics of rare earth elements applied in agricultural soils. J. Environ. Sci. Health Part A 2000, 35, 1869–1881. [Google Scholar] [CrossRef]
- Cai, D.; Rui, Y.-K. Determination of rare earth elements in Camellia oleifera seeds from rare earth elements mining areas in Southern Jiangxi, China by ICP–MS. J. Verbrauch. Lebensm. 2011, 6, 349–351. [Google Scholar] [CrossRef]
- Yang, S.; Li, C. Research progress in REE tracer for sediment source. Adv. Earth Sci. 1999, 14, 164–167. [Google Scholar]
- Chang, C.; Song, C.; Beckford, H.O.; Wang, S.; Ji, H. Behaviors of REEs during pedogenetic processes in the karst areas of Southwest China. J. Asian Earth Sci. 2019, 185, 104023. [Google Scholar] [CrossRef]
- Parise, M.; De Waele, J.; Gutierrez, F. Current perspectives on the environmental impacts and hazards in karst. Environ. Geol. 2009, 58, 235–237. [Google Scholar] [CrossRef]
- Yang, Q.; Peng, T.; Qin, T.; Li, Y.; Liang, Z. Preliminary study on structure of zooplankton community in Yinjiang county. J. Aquac. 2019, 40, 1–5. [Google Scholar]
- Zhong, Y.; Zhou, Y.; Li, Z. Research on the Carbon Storage and Potential Carbon Sequestration of Vegetation in the Trough Valley of a Karst Area, Yinjiang. Eeath Environ. 2014, 42, 82–89. [Google Scholar] [CrossRef]
- Huang, J.; Li, X.; Yang, Z.; Li, Q.; Cui, G. Effects of Land Use Change on DIC Contents and δ13 C DIC Valuesof Surface Water in a Small Karst Catchment in Yinjiang County, Guizhou Province. Earth Environ. 2017, 45, 84–90. [Google Scholar]
- Xu, Z.; Zhao, C. Temporal and Spatial Pattern Evolution of Rural Settlements in the Karst Trough Valley Area in the Past 50 Years. Res. Soil Water Conserv. 2020, 27, 365–372. [Google Scholar]
- Xu, P.; An, Q.; Ding, L.; Zhang, G.; Luo, H. Dynamic Analysis of Land Use Change in Yinjiang County from 2010 to 2015. J. Green Sci. Technol. 2017, 211, 215. [Google Scholar]
- Li, C. Study on the growth path and Ideal state of forest coverage in Yinjiang County. J. Green Sci. Technol. 2018, 9, 199–200. [Google Scholar]
- Xu, Y.; Zhou, X.; Zhao, C.; Yang, J.; Niu, Q. Ecological security pattern construction in Yinjiang watershed based on Karst vulnerability assessment. J. Guizhou Norm. Univ. Nat. Sci. 2017, 35, 22–29. [Google Scholar]
- Shu, D. Geological Hazards in Yinjiang, Guizhou and Its Origin and Treatments. Guizhou Geol. 2001, 4, 263–267. [Google Scholar]
- Gao, Y.; Han, X.; Wang, S. The effects of grazing on grassland soils. Acta Ecol. Sin. 2004, 24, 790–797. [Google Scholar] [CrossRef]
- Zhang, Q.; Han, G.; Liu, M.; Liang, T. Spatial distribution and controlling factors of heavy metals in soils from Puding Karst Critical Zone Observatory, southwest China. Environ. Earth Sci. 2019, 78, 279. [Google Scholar] [CrossRef]
- Li, X.; Han, G.; Zhang, Q.; Miao, Z. An optimal separation method for high–precision K isotope analysis by using MC–ICP–MS with a dummy bucket. J. Anal. At. Spectrom. 2020, 35, 1330–1339. [Google Scholar] [CrossRef]
- Liu, M.; Han, G.; Li, X. Comparative analysis of soil nutrients under different land–use types in the Mun River basin of Northeast Thailand. J. Soils Sediments 2021. [Google Scholar] [CrossRef]
- Mclennan, S.M. Rare–Earth Elements In Sedimentary–Rocks—Influence of Provenance And Sedimentary Processes. Rev Miner. 1989, 21, 169–200. [Google Scholar]
- Sadeghi, M.; Morris, G.A.; Carranza, E.J.M.; Ladenberger, A.; Andersson, M. Rare earth element distribution and mineralization in Sweden: An application of principal component analysis to FOREGS soil geochemistry. J. Geochem. Explor. 2013, 133, 160–175. [Google Scholar] [CrossRef]
- Han, G.; Xu, Z.; Tang, Y.; Zhang, G. Rare Earth Element Patterns in the Karst Terrains of Guizhou Province, China: Implication for Water/Particle Interaction. Aquat. Geochem. 2009, 15, 457–484. [Google Scholar] [CrossRef]
- Barbieri, M. The Importance of Enrichment Factor (EF) and Geoaccumulation Index (Igeo) to Evaluate the Soil Contamination. J. Geol. Geophys. 2016, 5. [Google Scholar] [CrossRef]
- Reimann, C.; Caritat, P.D. Intrinsic Flaws of Element Enrichment Factors (EFs) in Environmental Geochemistry. Environ. Sci. Technol. 2000, 34, 5084–5091. [Google Scholar] [CrossRef]
- Ackermann, F. A procedure for correcting the grain size effect in heavy metal analyses of estuarine and coastal sediments. Environ. Technol. Lett. 1980, 1, 518–527. [Google Scholar] [CrossRef]
- Loring, D.H. Lithium—A new approach for the granulometric normalization of trace metal data. Mar. Chem. 1990, 29, 155–168. [Google Scholar] [CrossRef]
- Balls, P.W.; Hull, S.; Miller, B.S.; Pirie, J.M.; Proctor, W. Trace metal in Scottish estuarine and coastal sediments. Mar. Pollut. Bull. 1997, 34, 42–50. [Google Scholar] [CrossRef]
- Taylor, S.R.; McLennan, S.M.; Armstrong, R.L.; Tarney, J. The Composition and Evolution of the Continental Crust: Rare Earth Element Evidence from Sedimentary Rocks [and Discussion]. Philos. Trans. R. Soc. Lond. Ser. A Math. Phys. Sci. 1981, 301, 381–399. [Google Scholar]
- Hu, Z.; Haneklaus, S.; Sparovek, G.; Schnug, E. Rare earth elements in soils. Commun. Soil Sci. Plant Anal. 2006, 37, 1381–1420. [Google Scholar] [CrossRef]
- Fu, S.; Yan, C.; Wu, S.; Yang, X. Content and distribution of rare earth elements in typical soils of Guizhou province. Acta Pedol. Sin. 2000, 1, 109–115. [Google Scholar]
- Han, G.; Tang, Y.; Liu, M.; Van Zwieten, L.; Yang, X.; Yu, C.; Wang, H.; Song, Z. Carbon–nitrogen isotope coupling of soil organic matter in a karst region under land use change, Southwest China. Agric. Ecosyst. Environ. 2020, 301, 107027. [Google Scholar] [CrossRef]
- Pourret, O.; Davranche, M.; Gruau, G.; Dia, A. New insights into cerium anomalies in organic–rich alkaline waters. Chem. Geol. 2008, 251, 120–127. [Google Scholar] [CrossRef] [Green Version]
- Liu, M.; Han, G.; Zhang, Q. Effects of agricultural abandonment on soil aggregation, soil organic carbon storage and stabilization: Results from observation in a small karst catchment, Southwest China. Agric. Ecosyst. Environ. 2020, 288, 106719. [Google Scholar] [CrossRef]
- Liu, M.; Han, G.; Zhang, Q. Effects of Soil Aggregate Stability on Soil Organic Carbon and Nitrogen under Land Use Change in an Erodible Region in Southwest China. Int. J. Environ. Res. Public Health 2019, 16, 3809. [Google Scholar] [CrossRef] [Green Version]
- Liu, M.; Han, G.; Zhang, Q.; Song, Z. Variations and Indications of δ13CSOC and δ15NSON in Soil Profiles in Karst Critical Zone Observatory (CZO), Southwest China. Sustainability 2019, 11, 2144. [Google Scholar] [CrossRef] [Green Version]
- Li, D.; Niu, S.; Luo, Y. Global patterns of the dynamics of soil carbon and nitrogen stocks following afforestation: A meta–analysis. New Phytol. 2012, 195, 172–181. [Google Scholar] [CrossRef]
- Zhang, Q.; Han, G.; Liu, M.; Wang, L. Geochemical Characteristics of Rare Earth Elements in Soils from Puding Karst Critical Zone Observatory, Southwest China. Sustainability 2019, 11, 4963. [Google Scholar] [CrossRef] [Green Version]
- Chen, B.; Wang, Z.; Huang, L.; Wu, F.; Chen, J.; Xu, W. The microbial metallogeny of weathering crust REE deposits in South China. Chin. Sci. Bull. 1999, 44, 3–5. [Google Scholar]
- Chen, Z.; Zhuang, W. A preliminary study of the role of organic matter in fissolution, migration and concentration of rare earth elements in weathering crust of granites from south China. Chem. Geol. 1994, 23, 168–178. [Google Scholar]
- Feng, X.; Zhang, T.; Zhang, X.; Wen, Y.; Xiong, K.; Li, Y.; Ji, H. Spatial distribution characteristics of soil organic carbon and analysis of the weathering erosion and REE in karst funnel slope. Geochimica 2019, 48, 249–260. [Google Scholar]
- He, S.; Liang, Z.; Han, R.; Wang, Y.; Liu, G. Soil carbon dynamics during grass restoration on abandoned sloping cropland in the hilly area of the Loess Plateau, China. Catena 2016, 137, 679–685. [Google Scholar] [CrossRef]
- Peng, A.; Zhu, J. Environmental Chemistry and Ecological Effects of Rare Earth Elements; China Environmental Press: Beijing, China, 2003; pp. 196–198. [Google Scholar]
- Han, G.; Song, Z.; Tang, Y. Geochemistry of rare earth elements in soils under different land uses in a typical karst area, Guizhou Province, Southwest China. Can. J. Soil Sci. 2017, 97, 606–612. [Google Scholar] [CrossRef] [Green Version]
- Zhang, L.; Ji, H.; Gao, J.; Li, R.; Li, J. Geochemical characteristics of major, trace and rare earth elements in typical carbonate weathered profiles of Guizhou Plateau. Geochimica 2015, 44, 323–336. [Google Scholar] [CrossRef]
- Chen, Y.; Wang, X.; Peng, A. The research progress of fractionation among rare earth elements. Adv. Environ. Sci. 1999, 1, 10–17. [Google Scholar]
- Tang, J.; Johannesson, K.H. Ligand extraction of rare earth elements from aquifer sediments: Implications for rare earth element complexation with organic matter in natural waters. Geochim. Cosmochim. Acta 2010, 74, 6690–6705. [Google Scholar] [CrossRef]
- Zhang, L.; Liu, J.; Yao, D. The variation and distribution characteristics of rare earth elements in submarine water—Sediment interface system. Acta Ocean. Sin. 1999, 4, 323–336. [Google Scholar]
- Guo, P.; Jia, X.; Duan, T.; Zhang, Y.; Xu, T.; Chen, H. Special analysis of rare earth elements in soil. Chin. J. Anal. Chem. 2008, 11, 1483–1487. [Google Scholar]
- Laveuf, C.; Cornu, S.; Juillot, F. Rare earth elements as tracers of pedogenetic processes. Comptes Rendus Geosci. 2008, 340, 523–532. [Google Scholar] [CrossRef]
- Zhou, W.; Han, G.; Liu, M.; Song, C.; Li, X. Geochemical Distribution Characteristics of Rare Earth Elements in Different Soil Profiles in Mun River Basin, Northeast Thailand. Sustainability 2020, 12, 457. [Google Scholar] [CrossRef] [Green Version]
- Nakada, R.; Takahashi, Y.; Tanimizu, M. Isotopic and speciation study on cerium during its solid–water distribution with implication for Ce stable isotope as a paleo–redox proxy. Geochim. Cosmochim. Acta 2013, 103, 49–62. [Google Scholar] [CrossRef]
- Wang, Z.; Yu, X.; Zhao, Z. The Geochemistry of rare earth elements (in Chinese). Beijing: Sci. Press 1989, 5, 737. [Google Scholar]
- Robinson, W.O.; Bastron, H.; Murata, K.J. Biogeochemistry of the rare–earth elements with particular reference to hickory trees. Geochim. Cosmochim. Acta 1958, 14, 55–67. [Google Scholar] [CrossRef]
- Danielson, A.; Möller, P.; Dulski, P. The europium anomalies in banded iron formations and the thermal history of the oceanic crust. Chem. Geol. 1992, 97, 89–100. [Google Scholar] [CrossRef]
- Lei, G.; Zhang, Z. The distribution characteristics of REE in some soils in Guizhou. Gui Zhou Sci. 1996, 3, 11–17. [Google Scholar]
- David, G.T.; Spirn, R.V.; Winchester, J.W. Europium Anomalies and the Genesis of Basalt: A Discussion. Chem. Geol. 1968, 4, 461–464. [Google Scholar]
- Guichard, F.; Church, T.M.; Treuil, M.; Jaffrezic, H. Rare earths in barites: Distribution and effects on aqueous partitioning. Geochim. Cosmochim. Acta 1979, 43, 983–997. [Google Scholar] [CrossRef]
- Cao, X.; Chen, Y.; Wang, X.; Deng, X. Effects of redox potential and pH value on the release of rare earth elements from soil. Chemosphere 2001, 44, 655–661. [Google Scholar] [CrossRef]
- Sverjensky, D.A. Europium redox equilibria in aqueous solution. Earth Planet. Sci. Lett. 1984, 67, 70–78. [Google Scholar] [CrossRef]
- Xiong, G.; Wang, J.; Hu, R. Trace Element Characteristics and Sedimentary Environment of the Sinian system of the Fanjingshan Area in Guizhou Province. Acta Geogr. Sin. 2008, 29, 51–60. [Google Scholar]
- Huang, C. Soil Science; China Agricultural Press: Beijing, China, 2000. [Google Scholar]
- Henderson, P. Rare earth Element Geochemistry; Elsevier: Amsterdam, The Netherlands, 2013. [Google Scholar]
- Ma, Y.; Xu, Z.; Liu, C.; Zhang, H.; Huo, R. REE behavior and influence factoraduring chemical weathring. Adv. Earth Sci. 2004, 19, 87–94. [Google Scholar]
- Song, Y.; Shen, L. REE Geochemistry of The Weathered Crust of Acid Volcanic Rocks–an Experimental Study. Geochimica 1986, 3, 225–234. [Google Scholar]
- Ding, W. The general situation of soil elements in China. Rare Earth Elem. 1994, 43, 44–48. [Google Scholar]
- Yang, G.; Wang, Y.; Chen, B.; Tui, S.; Sun, J. Characteristics of distribution of rare earth elements in fluvo–aquic soils. Acta Pedol. Sin. 1984, 10, 211–216. [Google Scholar]
- Rao, W.; Tan, H.; Jiang, S.; Chen, J. Trace element and REE geochemistry of fine– and coarse–grained sands in the Ordos deserts and links with sediments in surrounding areas. Geochemistry 2011, 71, 155–170. [Google Scholar] [CrossRef]
- Ran, Y.; Liu, Z. Adsorption and desorption characteristics of rare earth elements in main soil types in China. Chin. Sci. Bull. 1992, 4, 377–380. [Google Scholar]
- Zhu, W.; Yang, Y.; Bi, H.; Liu, Q. Progress in Geochemical Research of Rare Earth Element in Soils. Bull. Mineral. Petrol. Geochem. 2003. [Google Scholar]
- Yongming, H.; Peixuan, D.; Junji, C.; Posmentier, E.S. Multivariate analysis of heavy metal contamination in urban dusts of Xi’an, Central China. Sci. Total Environ. 2006, 355, 176–186. [Google Scholar] [CrossRef]


| Land-Use Types | Location | Elevation (m) | The Situation of Land Use | Soil Profile Characteristics |
|---|---|---|---|---|
| Secondary forest land (T1) | 28°04′57.64″ N 108°42′31.01″ E | 838 | Subtropical evergreen broad-leaved secondary forest. | 0 to 20 cm: The surface layer is gray soil with more plant roots and dead leaves. The deep is yellow soil with a few small stone particles. 20 to 110 cm: The upper part is yellow with a few stones. 110 to 160 cm: The lower part is brown-red soil with almost no stones. |
| Abandoned cropland (T2) | 28°04′48.35″ N 108°42′58.22″ E | 892 | Sloping farmland. Surrounded by subtropical evergreen secondary forests, the area has been cultivated for about 50 years, and has been abandoned for three years before sampling. | 0 to 20 cm: Yellow soil with a few small stone particles and plant roots. 20 cm to 120 cm: The upper part is yellow and brown soil. 120 cm to 130 cm: The lower part is brown-red soil with more stones. |
| Shrubland (T3) | 28°04′22.68″ N 108°40′37.62″ E | 776 | Native shrub grass. The soil layer is relatively shallow, and some bedrock is exposed. In the last 5 years, a small number of goats were released here. | 0 to 20 cm: The upper part is black soil with more humus and a few stones, while the lower part is gray soil with more stones. 20 cm to 70 cm: Yellow soil with a few stones. |
| Sample Sites | Depth (cm) | ∑REE (mg·kg−1) | (La/Gd)N | (La/Yb)N | (Gd/Yb)N | δCe | δEu |
|---|---|---|---|---|---|---|---|
| T1 | 0 | 233.14 | 0.72 | 1.28 | 1.77 | 0.89 | 0.74 |
| 5 | 184.71 | 0.75 | 1.21 | 1.61 | 0.74 | 0.67 | |
| 10 | 223.40 | 0.81 | 1.47 | 1.81 | 0.87 | 0.70 | |
| 15 | 204.29 | 0.78 | 1.37 | 1.76 | 0.85 | 0.73 | |
| 20 | 74.58 | 0.69 | 0.81 | 1.18 | 0.44 | 0.50 | |
| 30 | 170.01 | 0.75 | 1.29 | 1.72 | 0.77 | 0.69 | |
| 40 | 162.76 | 0.77 | 1.38 | 1.80 | 0.67 | 0.69 | |
| 50 | 198.18 | 0.75 | 1.41 | 1.87 | 0.85 | 0.73 | |
| 60 | 197.57 | 0.76 | 1.34 | 1.76 | 0.83 | 0.75 | |
| 70 | 157.06 | 0.75 | 1.23 | 1.64 | 0.72 | 0.68 | |
| 80 | 216.44 | 0.70 | 1.21 | 1.72 | 0.85 | 0.80 | |
| 90 | 220.56 | 0.69 | 1.27 | 1.85 | 0.83 | 0.81 | |
| 100 | 209.39 | 0.71 | 1.30 | 1.83 | 0.81 | 0.77 | |
| 110 | 235.48 | 0.68 | 1.37 | 2.01 | 0.78 | 0.89 | |
| 120 | 251.49 | 0.75 | 1.47 | 1.97 | 0.70 | 0.90 | |
| 130 | 312.83 | 0.90 | 1.86 | 2.07 | 0.62 | 1.05 | |
| 140 | 286.47 | 0.98 | 1.98 | 2.02 | 0.65 | 0.96 | |
| 150 | 279.51 | 0.90 | 1.79 | 1.99 | 0.68 | 0.95 | |
| 160 | 69.26 | 1.00 | 2.16 | 2.16 | 0.30 | 0.43 | |
| Bedrock | 31.53 | 0.66 | 1.13 | 1.71 | 0.27 | 0.31 | |
| T2 | 0 | 204.01 | 0.94 | 1.72 | 1.83 | 0.91 | 0.63 |
| 5 | 181.34 | 0.87 | 1.43 | 1.65 | 0.84 | 0.62 | |
| 10 | 186.14 | 0.91 | 1.65 | 1.81 | 0.88 | 0.61 | |
| 15 | 188.69 | 0.85 | 1.50 | 1.77 | 0.87 | 0.62 | |
| 20 | 184.83 | 0.86 | 1.56 | 1.82 | 0.89 | 0.60 | |
| 30 | 182.73 | 0.84 | 1.54 | 1.83 | 0.89 | 0.61 | |
| 40 | 187.26 | 0.92 | 1.57 | 1.71 | 0.92 | 0.61 | |
| 50 | 173.41 | 0.91 | 1.64 | 1.80 | 0.85 | 0.61 | |
| 60 | 178.58 | 0.89 | 1.62 | 1.82 | 0.88 | 0.60 | |
| 70 | 188.74 | 0.89 | 1.47 | 1.66 | 0.94 | 0.61 | |
| 80 | 176.39 | 0.85 | 1.56 | 1.85 | 0.91 | 0.59 | |
| 90 | 186.60 | 0.87 | 1.52 | 1.75 | 0.93 | 0.61 | |
| 100 | 187.67 | 0.90 | 1.55 | 1.72 | 0.91 | 0.61 | |
| 110 | 188.34 | 0.84 | 1.52 | 1.82 | 1.02 | 0.62 | |
| 120 | 191.55 | 0.81 | 1.52 | 1.88 | 1.02 | 0.62 | |
| 130 | 200.43 | 0.78 | 1.43 | 1.85 | 1.10 | 0.62 | |
| T3 | 0 | 116.50 | 0.73 | 1.37 | 1.87 | 0.54 | 1.44 |
| 5 | 116.27 | 0.73 | 1.28 | 1.76 | 0.51 | 1.78 | |
| 10 | 122.81 | 0.72 | 1.23 | 1.72 | 0.55 | 2.47 | |
| 15 | 104.96 | 0.75 | 1.31 | 1.76 | 0.48 | 2.34 | |
| 20 | 135.73 | 0.74 | 1.36 | 1.82 | 0.56 | 1.53 | |
| 30 | 138.35 | 0.78 | 1.32 | 1.69 | 0.45 | 2.80 | |
| 40 | 161.57 | 0.68 | 1.22 | 1.79 | 0.62 | 2.30 | |
| 50 | 184.77 | 0.70 | 1.26 | 1.79 | 0.71 | 2.58 | |
| 60 | 160.29 | 0.62 | 1.09 | 1.76 | 0.65 | 2.90 | |
| 70 | 153.70 | 0.65 | 1.17 | 1.81 | 0.56 | 2.32 | |
| Bedrock | 30.17 | 0.71 | 1.23 | 1.72 | 0.25 | 0.34 | |
Publisher’s Note: MDPI stays neutral with regard to jurisdictional claims in published maps and institutional affiliations. |
© 2021 by the authors. Licensee MDPI, Basel, Switzerland. This article is an open access article distributed under the terms and conditions of the Creative Commons Attribution (CC BY) license (http://creativecommons.org/licenses/by/4.0/).
Share and Cite
Han, R.; Xu, Z. Geochemical Behaviors of Rare Earth Elements (REEs) in Karst Soils under Different Land-Use Types: A Case in Yinjiang Karst Catchment, Southwest China. Int. J. Environ. Res. Public Health 2021, 18, 502. https://0-doi-org.brum.beds.ac.uk/10.3390/ijerph18020502
Han R, Xu Z. Geochemical Behaviors of Rare Earth Elements (REEs) in Karst Soils under Different Land-Use Types: A Case in Yinjiang Karst Catchment, Southwest China. International Journal of Environmental Research and Public Health. 2021; 18(2):502. https://0-doi-org.brum.beds.ac.uk/10.3390/ijerph18020502
Chicago/Turabian StyleHan, Ruiyin, and Zhifang Xu. 2021. "Geochemical Behaviors of Rare Earth Elements (REEs) in Karst Soils under Different Land-Use Types: A Case in Yinjiang Karst Catchment, Southwest China" International Journal of Environmental Research and Public Health 18, no. 2: 502. https://0-doi-org.brum.beds.ac.uk/10.3390/ijerph18020502