
Socioeconomic Inequalities in COVID-19 in a European Urban Area: Two Waves, Two Patterns

 , , ,
, , , 
Abstract
:1. Introduction
2. Methodology
2.1. Design, Study Population, and Sources of Information
2.2. Indicators and Data Analysis
3. Result
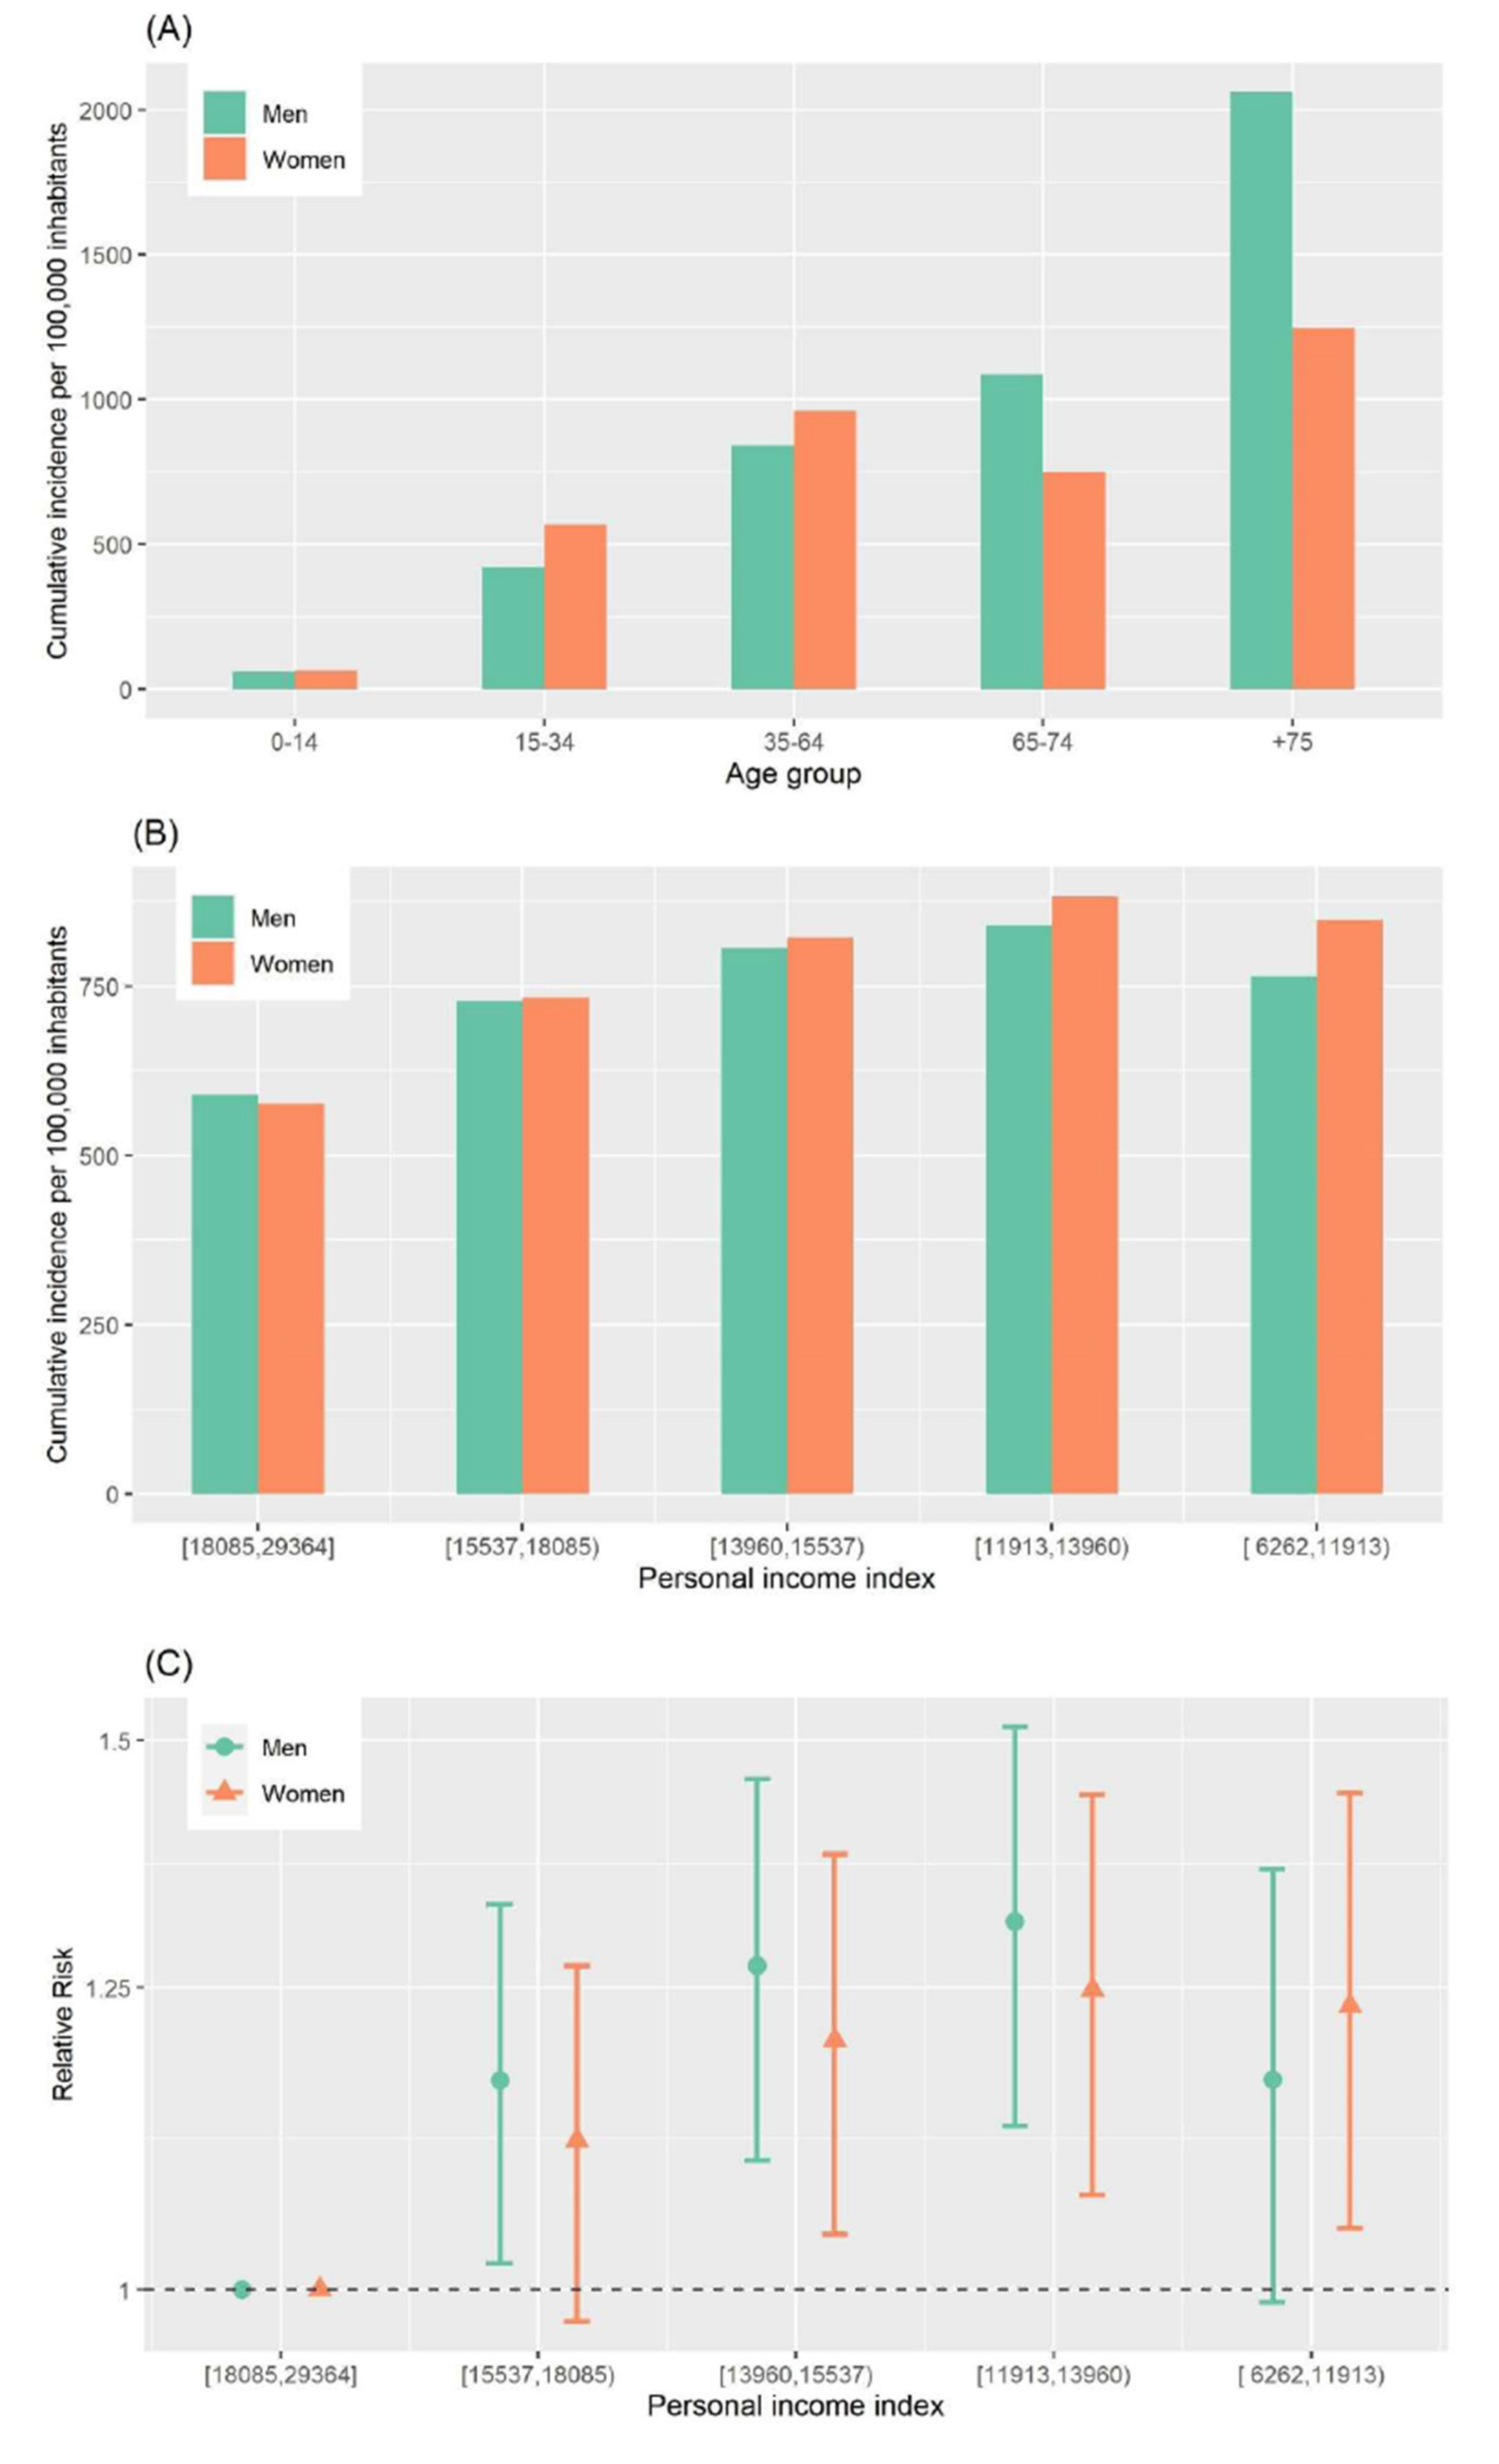
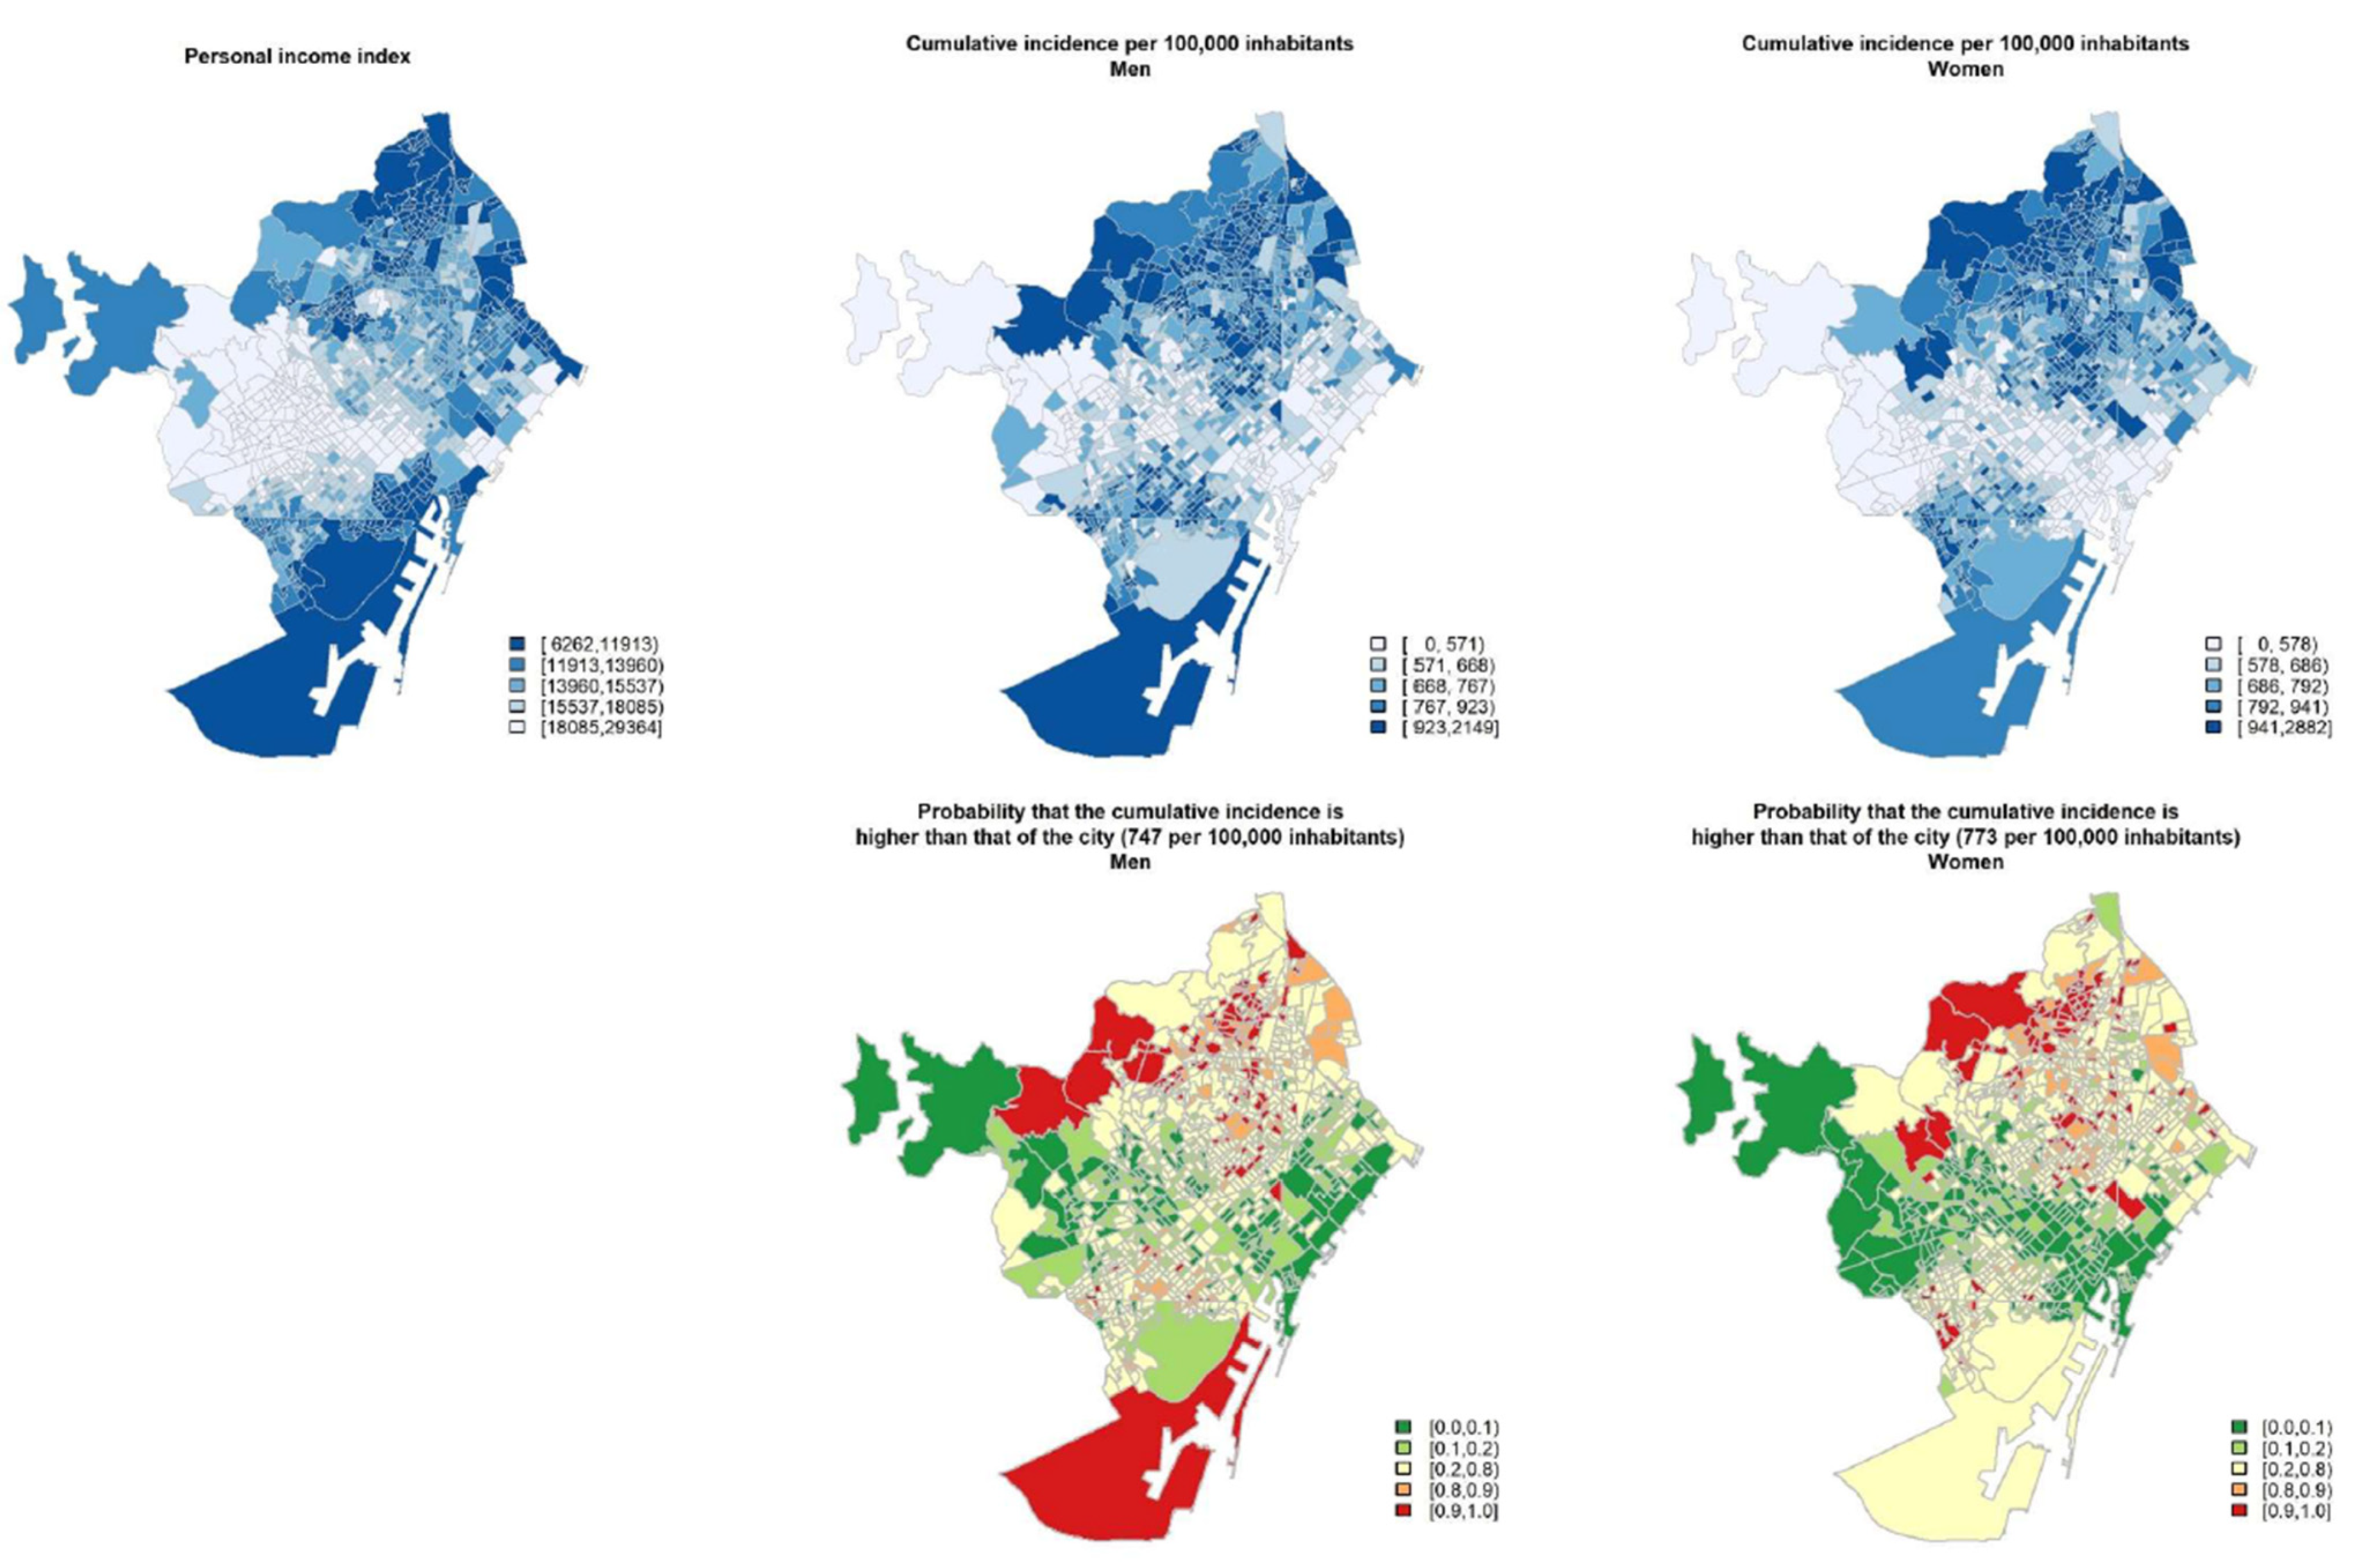
3.1. First Wave
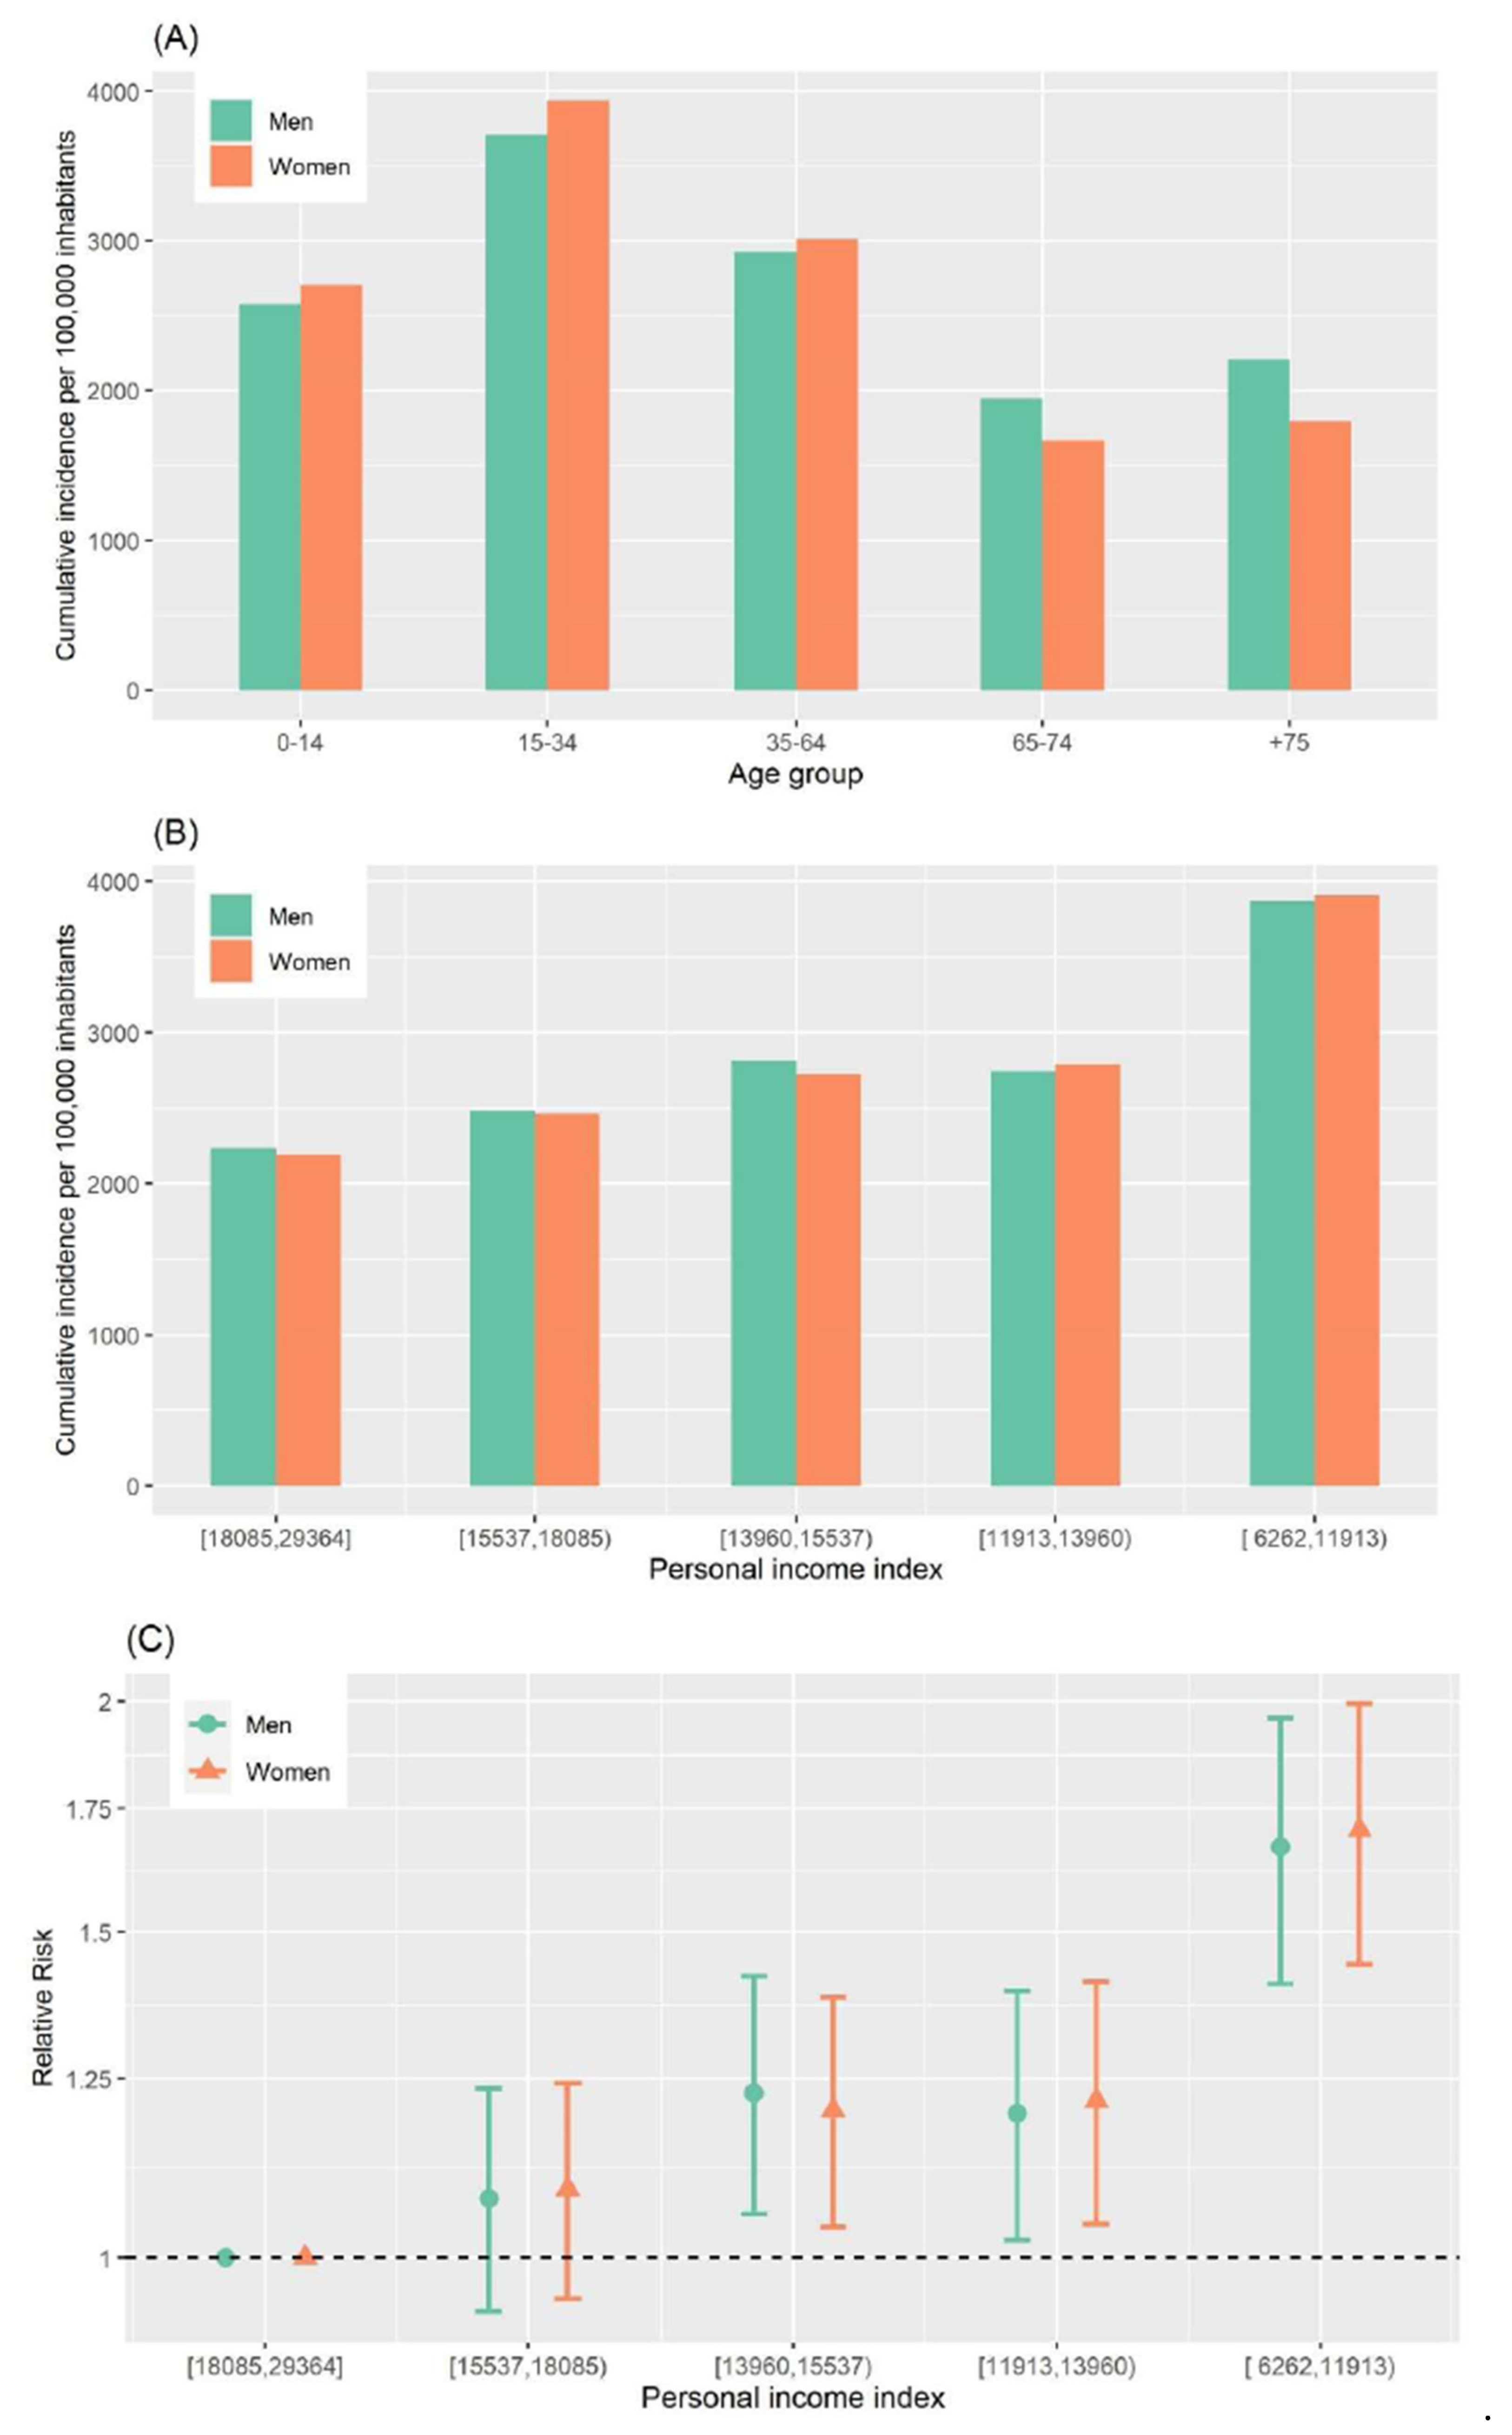
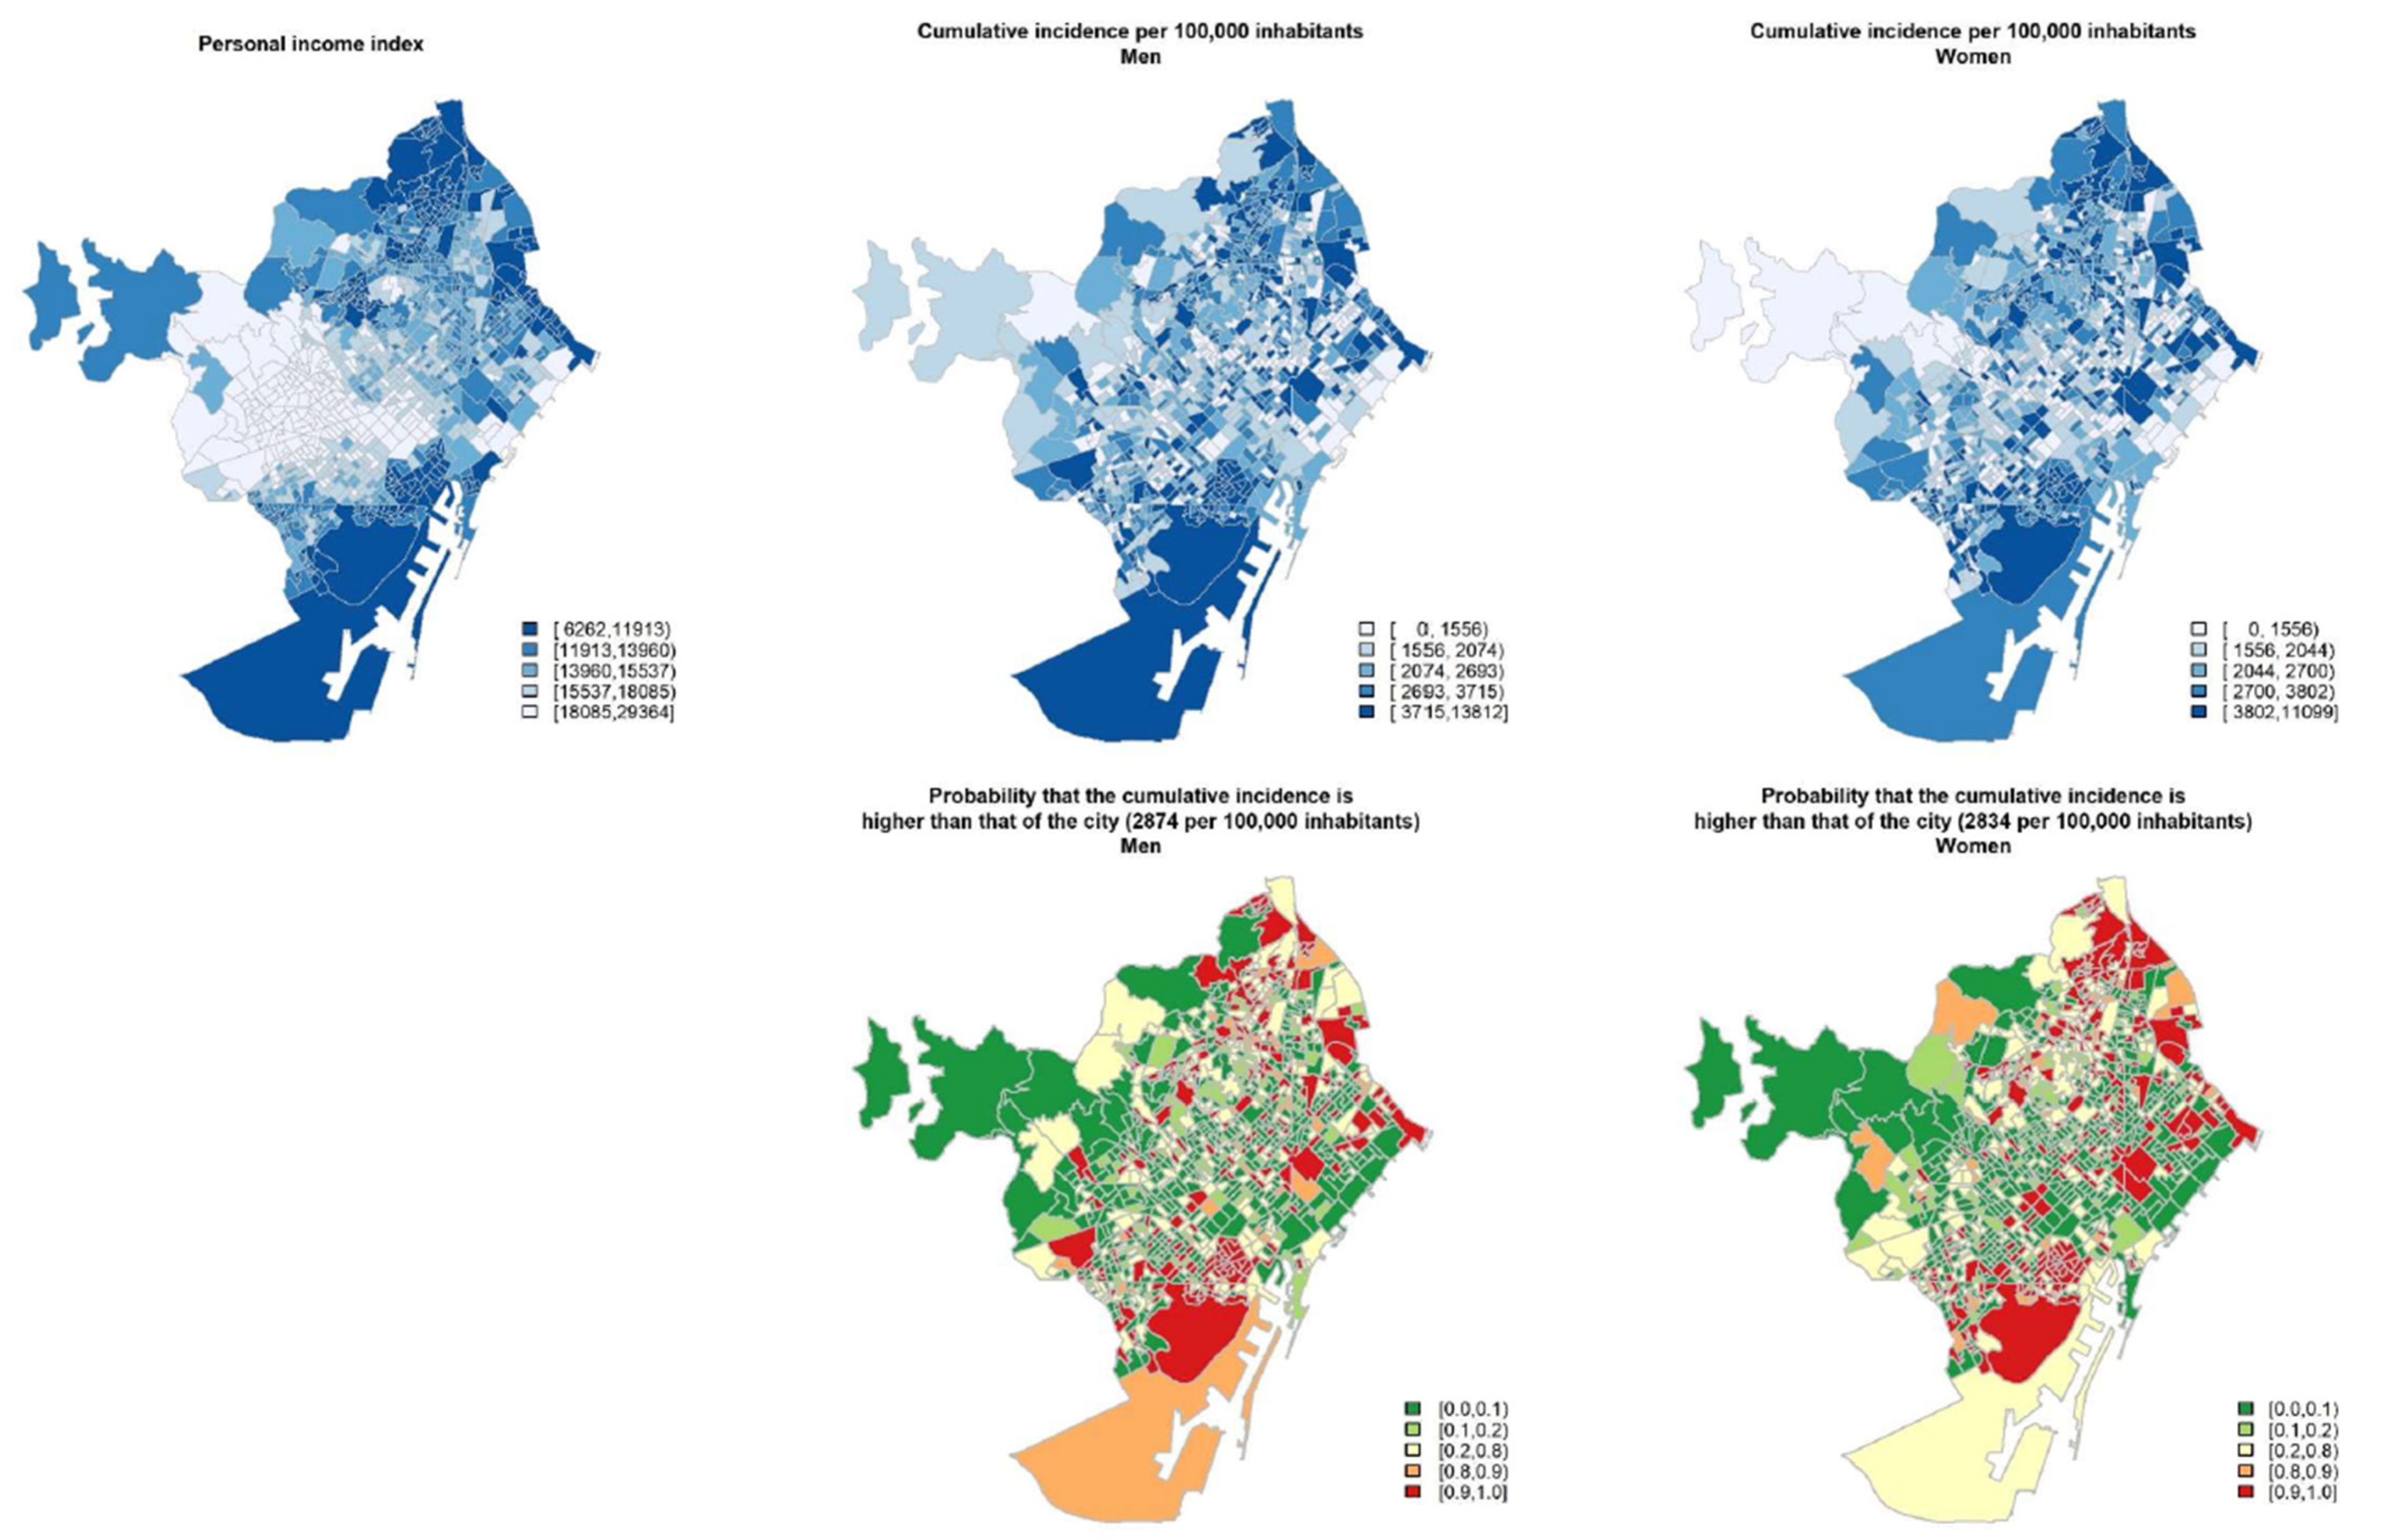
3.2. Second Wave
4. Discussion
4.1. Differences by Age Group
4.2. Gender Inequalities
4.3. Socioeconomic Inequalities
4.4. Limitations
5. Conclusions and Recommendations
Author Contributions
Funding
Institutional Review Board Statement
Informed Consent Statement
Data Availability Statement
Conflicts of Interest
References
- Kapiriri, L.; Ross, A. The Politics of Disease Epidemics: A Comparative Analysis of the SARS, Zika, and Ebola Outbreaks. Glob. Soc. Welf. 2020, 7, 33–45. [Google Scholar] [CrossRef] [PubMed] [Green Version]
- Is SARS a Poor Man’s Disease? Socioeconomic Status and Risk Factors for SARS Transmission. Available online: https://ssrn.com/abstract=1881714 (accessed on 16 January 2021).
- Mamelund, S.E. Social inequality—A forgotten factor in pandemic influenza preparedness. Tidsskr. Nor Laegeforen. 2017, 137, 137. [Google Scholar] [CrossRef] [PubMed]
- Sachs, J.D.; Karim, S.A.; Aknin, L.; Allen, J.; Brosbøl, K.; Barron, G.C.; Daszak, P.; Espinosa, M.F.; Gaspar, V.; Gaviria, A.; et al. Lancet COVID-19 Commission Statement on the Occasion of the 75th Session of the UN General Assembly. Lancet 2020, 396, 1102–1124. Available online: https://0-linkinghub-elsevier-com.brum.beds.ac.uk/retrieve/pii/S0140673620319279 (accessed on 16 January 2021). [CrossRef]
- Borrell, C.; Pons-Vigués, M.; Morrison, J.; Díez, E. Factors and processes influencing health inequalities in urban areas. J. Epidemiol. Community Health 2013, 67, 389–391. [Google Scholar] [CrossRef] [PubMed]
- Shadmi, E.; Chen, Y.; Dourado, I.; Faran-Perach, I.; Furler, J.; Hangoma, P.; Hanvoravongchai, P.; Obando, C.; Petrosyan, V.; Rao, K.D.; et al. Health equity and COVID-19: Global perspectives. Int. J. Equity Health 2020, 19, 1–16. [Google Scholar] [CrossRef]
- Bambra, C.; Riordan, R.; Ford, J.; Matthews, F. The COVID-19 pandemic and health inequalities. J. Epidemiol. Community Health 2020, 74, 964–968. [Google Scholar] [CrossRef]
- Marmot, M.; Allen, J.; Goldblatt, P.; Herd, J.M.E. Build Back Fairer: The COVID-19 Marmot Review. The Pandemic, Socioeconomic and Health Inequalities in England; Institute of Health Equity: London, UK, 2020. [Google Scholar]
- Wang, Z.; Tang, K. Combating COVID-19: Health equity matters. Nat. Med. 2020, 26, 458. [Google Scholar] [CrossRef]
- Nassif-Pires, L.; De Lima Xavier, L.; Masterson, T.; Nikiforos, M.; Rios-Avila, F. Pandemic of Inequalitiy; Levy Economics Inst: New York, NY, USA, 2020; Available online: http://www.levyinstitute.org/pubs/ppb_149.pdf (accessed on 16 January 2021).
- Harlem, G.; Lynn, M. Descriptive analysis of social determinant factors in urban communities affected by COVID-19. J. Public Health 2020, 42, 466–469. [Google Scholar] [CrossRef]
- Abrams, E.M.; Szefler, E. COVID-19 and the impact of social determinants of health. Lancet Respir. Med. 2020, 8, 659–661. [Google Scholar] [CrossRef]
- van Dorn, A.; Cooney, R.E.; Sabin, M.L. COVID-19 exacerbating inequalities in the US. Lancet 2020, 395, 1243–1244. [Google Scholar] [CrossRef]
- Khalatbari-Soltani, S.; Cumming, R.G.; Delpierre, C.; Kelly-Irving, M. Importance of collecting data on socioeconomic determinants from the early stage of the COVID-19 outbreak onwards. J. Epidemiol. Community Health 2020, 74, 620–623. [Google Scholar] [PubMed]
- Agència de Salut Pública de Barcelona. #COVID19aldiaBCN: Com afecta la COVID-19 a la ciutat de Barcelona? Available online: https://webs.aspb.cat/covid19aldiabcn (accessed on 16 January 2021).
- Instituto de Salud Carlos III. COVID-19. Documentación y Datos. Cnecovid.isciii.es. Available online: https://cnecovid.isciii.es/covid19/#ccaa (accessed on 14 January 2021).
- Böger, B.; Fachi, M.M.; Vilhena, R.O.; Cobre, A.F.; Tonin, F.S.; Pontarolo, R. Systematic review with meta-analysis of the accuracy of diagnostic tests for COVID-19. Am. J. Infect. Control 2021, 49, 21–29. [Google Scholar] [CrossRef] [PubMed]
- caRtociudad: Interface to Cartociudad API. R Package Version 0.6.2. 2018. Available online: https://github.com/rOpenSpain/caRtociudad (accessed on 16 January 2021).
- Kahle, D.; Wickham, H. ggmap: Spatial Visualization with ggplot2. R J. 2013, 5, 144–161. [Google Scholar] [CrossRef] [Green Version]
- Besag, J.; York, J.; Mollié, A. Bayesian image restoration, with two applications in spatial statistics. Ann. Inst. Stat. Math. 1991, 43, 1–20. [Google Scholar] [CrossRef]
- Marí-Dell’Olmo, M.; Gotsens, M.; Palència, L.; Burström, B.; Corman, D.; Costa, G.; Deboosere, P.; Díez, È.; Domínguez-Berjón, F.; Dzúrová, D.; et al. Socioeconomic inequalities in cause-specific mortality in 15 European cities. J. Epidemiol. Community Health 2015, 69, 432–441. [Google Scholar] [CrossRef] [PubMed] [Green Version]
- Borrell, C.; Palència, L.; Dell’Olmo, M.M.; Morrisson, J.; Deboosere, P.; Gotsens, M.; Dzurova, D.; Costa, C.; Lustigova, M.; Burstrom, B.; et al. Socioeconomic inequalities in suicide mortality in European urban areas before and during the economic recession. Eur. J. Public Health 2020, 30, 92–98. [Google Scholar] [CrossRef]
- Rue, H.; Martino, S.; Chopin, N. Approximate Bayesian Inference for Latent Gaussian Models Using Integrated Nested Laplace Approximations (with discussion). J. R. Stat. Soc. B 2009, 71, 319–392. [Google Scholar] [CrossRef]
- R Core Team. R: A Language and Environment for Statistical Computing; R Foundation for Statistical Computing: Vienna, Austria, 2020; Available online: https://www.R-project.org/ (accessed on 16 January 2021).
- Wenham, C.; Smith, J.; Morgan, R. COVID-19: The gendered impacts of the outbreak. Lancet 2020, 395, 846–848. [Google Scholar] [CrossRef] [Green Version]
- The Lancet. The gendered dimensions of COVID-19. Lancet 2020, 395, 1168. [Google Scholar] [CrossRef]
- Sex, Gender and COVID-19: Disaggregated Data and Health Disparities. Available online: https://0-blogs-bmj-com.brum.beds.ac.uk/bmjgh/2020/03/24/sex-gender-and-covid-19-disaggregated-data-and-health-disparities/ (accessed on 16 January 2021).
- Conti, P.; Younes, A. Coronavirus COV-19/SARS-CoV-2 affects women less than men: Clinical response to viral infection. J. Biol. Regul. Homeost. Agents 2020, 34, 339–343. [Google Scholar]
- Castellanos-Torres, E.; Mateos, J.T.; Chilet-Rosell, E. COVID-19 en clave de género. Gac. Sanit. 2020, 34, 419–421. [Google Scholar] [CrossRef] [PubMed]
- United Nations Population Fund. COVID-19: Un Enfoque de Género. Proteger la Salud y los Derechos Sexuales y Reproductivos y Promover la Igualdad de Género; United Nations Population Fund: New York, NY, USA, 2020. [Google Scholar]
- Vieira, C.M.; Franco, O.H.; Restrepo, C.G.; Abel, T. COVID-19: The forgotten priorities of the pandemic. Maturitas 2020, 136, 38–41. [Google Scholar] [CrossRef] [PubMed]
- Whittle, R.S.; Diaz-Artiles, A. An ecological study of socioeconomic predictors in detection of COVID-19 cases across neighborhoods in New York City. BMC Med. 2020, 18, 271. [Google Scholar] [CrossRef] [PubMed]
- Mollalo, A.; Vahedi, B.; Rivera, K.M. GIS-based spatial modeling of COVID-19 incidence rate in the continental United States. Sci. Total Environ. 2020, 738, 138–884. [Google Scholar] [CrossRef] [PubMed]
- Class and COVID: How the Less Affluent Face Double Risks. Available online: https://www.brookings.edu/blog/up-front/2020/03/27/class-and-covid-how-the-less-affluent-face-double-risks/ (accessed on 16 January 2021).
- How Is Covid-19 Affecting Inequality? Available online: http://www.post-crasheconomics.com/how-is-covid-19-affecting-inequality (accessed on 16 January 2021).
- Confinarse en Barcelona: 87 Metros Cuadrados de Diferencia Entre Barrios Ricos y Pobres. Available online: https://elpais.com/espana/catalunya/2020-04-18/confinarse-en-barcelona-87-metros-cuadrados-de-diferencia-entre-barrios-ricos-y-pobres.html (accessed on 16 January 2021).
- Relació entre mobilitat i renda de la població a l’àrea metropolitana de Barcelona i la ciutat de Barcelona en el context de l’epidèmia Covid19. Available online: https://observatori.atm.cat/estudis/Estudi_sobre_mobilitat_i_renda.pdf (accessed on 16 January 2021).
- Raifman, M.; Raifman, J. Disparities in the Population at Risk of Severe Illness From COVID-19 by Race/Ethnicity and Income. Am. J. Prev. Med. 2020, 59, 137–139. [Google Scholar] [CrossRef]
- Sørensen, K.; Pelikan, J.M.; Röthlin, F.; Ganahl, K.; Slonska, Z.; Doyle, G.; Fullam, J.; Kondilis, B.; Agrafiotis, D.; Uiters, E.; et al. Health literacy in Europe: Comparative results of the European health literacy survey (HLS-EU). Eur. J. Public Health 2015, 25, 1053–1058. [Google Scholar] [CrossRef] [Green Version]
- Diez-Roux, A.V. Cities, Health Equity, and COVID-19. Available online: https://drexel.edu/lac/media/blog/2020/March/COVIDandcities/?utm_source=LAC+Urban+Health&utm_campaign=36de518069-EMAIL_CAMPAIGN_2019_07_17_06_25_COPY_01&utm_medium=email&utm_term=0_d578ebf30b-36de518069-302113435&mc_cid=36de518069&mc_eid=12ec09e (accessed on 16 January 2021).
- ¿Cómo Podemos Garantizar un Enfoque Socialmente Equitativo del Desconfinamiento? Available online: https://www.isglobal.org/-/-como-podemos-garantizar-un-enfoque-socialmente-equitativo-en-el-desconfinamiento- (accessed on 16 January 2021).
- Levelling Up (Part 2): A Discussion Paper on European Strategies for Tackling Social Inequities in Health/by Goran Dahlgren and Margaret Whitehead. Available online: https://apps.who.int/iris/handle/10665/107791 (accessed on 16 January 2021).
- Barcelona Posa en Marxa un nou Hotel, Apartaments i Serveis Específics a Domicili per Garantir el bon Aïllament de les Persones amb la Covid-19: Servei de Premsa. Available online: https://ajuntament.barcelona.cat/premsa/2020/05/08/barcelona-posa-en-marxa-un-nou-hotel-apartaments-i-serveis-especifics-a-domicili-per-garantir-el-bon-aillament-de-les-persones-amb-la-covid-19 (accessed on 16 January 2021).


Publisher’s Note: MDPI stays neutral with regard to jurisdictional claims in published maps and institutional affiliations. |
© 2021 by the authors. Licensee MDPI, Basel, Switzerland. This article is an open access article distributed under the terms and conditions of the Creative Commons Attribution (CC BY) license (http://creativecommons.org/licenses/by/4.0/).
Share and Cite
Marí-Dell’Olmo, M.; Gotsens, M.; Pasarín, M.I.; Rodríguez-Sanz, M.; Artazcoz, L.; Garcia de Olalla, P.; Rius, C.; Borrell, C. Socioeconomic Inequalities in COVID-19 in a European Urban Area: Two Waves, Two Patterns. Int. J. Environ. Res. Public Health 2021, 18, 1256. https://0-doi-org.brum.beds.ac.uk/10.3390/ijerph18031256
Marí-Dell’Olmo M, Gotsens M, Pasarín MI, Rodríguez-Sanz M, Artazcoz L, Garcia de Olalla P, Rius C, Borrell C. Socioeconomic Inequalities in COVID-19 in a European Urban Area: Two Waves, Two Patterns. International Journal of Environmental Research and Public Health. 2021; 18(3):1256. https://0-doi-org.brum.beds.ac.uk/10.3390/ijerph18031256
Chicago/Turabian StyleMarí-Dell’Olmo, Marc, Mercè Gotsens, M Isabel Pasarín, Maica Rodríguez-Sanz, Lucía Artazcoz, Patricia Garcia de Olalla, Cristina Rius, and Carme Borrell. 2021. "Socioeconomic Inequalities in COVID-19 in a European Urban Area: Two Waves, Two Patterns" International Journal of Environmental Research and Public Health 18, no. 3: 1256. https://0-doi-org.brum.beds.ac.uk/10.3390/ijerph18031256