1. Introduction
A carbon footprint is composed of the “total set of greenhouse gas emissions (CO
2e or carbon dioxide equivalent) caused directly and indirectly by an individual, organization, event or product” [
1]. Despite the health benefits of running, the people involved with sports often engage in practices that produce large amounts of CO
2 emission [
2,
3]. The estimated quantity of CO
2 emissions from sports practices such as transportation, the construction of sports facilities, and the production of sporting goods and services [
4] are a significant threat to the quality of the natural environment [
5,
6]. Modes of transportation used by spectators and the athletes are believed to be the bulk of CO
2 emissions [
7,
8].
The CO
2 emissions implications of training and competing in a marathon have not been studied. Previous studies have highlighted that sporting events have become a negative contributor towards environmental degradation [
2,
9]. Indeed, the carbon footprint associated with sport participation has been a significant source of CO
2 emissions, (i.e., 8% of overall emissions for a German adult). Interestingly, non-mainstream individual sports such as diving, golf and surfing leaves the three highest individual carbon footprints. The greenhouse gas emissions from more universal sports activities, such as cycling and walking, are not negligible (because of additional fueling, walking, and cycling). Replacing short car trips with cycling or walking does not significantly produce a carbon emissions savings.
Nowadays, sport is no longer considered to be separated from environment [
10], and sports participation results in a disproportionate consumption of raw materials, traffic congestion, related air pollution, exhausting local water supplies, and a challenge around waste disposal [
11,
12]. However, increasingly there is a sociology of sports’ awareness with the environment [
13]. The notion of “environmental waves” of sport has been proposed to understand the past, present, and future of environmental sustainability [
14,
15]. There is a need for sports to find a balance between the health benefits and the associated CO
2 emissions. Modifications to equipment, infrastructure, materials, and industrial food are all current areas of interest [
16,
17]. Sustainable development of sports tourism as it relates to a positive carbon footprint is currently being investigated.
In addition, the impact of new walking and cycling infrastructures (brides and paths) on CO
2 emissions from motorized only showed minor effects on CO
2 emissions; living near the infrastructures nor using it, predicted significant changes in CO
2 emissions [
18]. Including active mobility sports such as cycling has been reported to be an additional source of CO
2 emissions due to fueling, walking and cycling. Human-powered locomotion is associated with non-negligible greenhouse gas emissions [
19].
Marathons offer a unique opportunity to study the balance between sports participation and CO2 emissions. Marathon participation has exponentially increased over the last 2 decades and the CO2 emission associated with marathon events has exploded. The additional CO2 emissions associated with training and competing in a marathon should be potentially given that runners often train locally, consume less industrial nutrition, and use domestic transportation.
Our aim of this study is to test the hypothesis of a person who is training and competing in marathons locally (within 1000 km) and the associated CO2 emissions related to this athletes’ activities and preparation for his marathon. We also compared the CO2 emissions of the athlete competing in a marathon locally versus travelling internationally to New York.
2. Materials and Methods
A carbon footprint is the total greenhouse gas (GHG) emissions or assessment caused by an individual, event, organization, service, or product which can be limited to its life cycle or one year. GHG are expressed as carbon dioxide equivalent (CO2e). The goal of the study is to focus on the primary sources of total CO2 emissions and how to reduce future impact by direct or indirect modifications. Several categories must be taken into consideration to evaluate GHG as it related to sports activity, such as raw energy consumption, raw materials and goods, food, services, transportation, travel, waste management, and equipment. To calculate the impact of the total emissions in equivalent CO2 mass, the data are multiplied by emission factors. Our calculations are in line with IPCC (Intergovernmental Panel on Climate Change) works and publications which provide regular assessments of the scientific basis of climate change, its impacts and future risks, and options for reducing GHG emissions on many levels.
The aim of this study is to determine the carbon footprint of a typical French marathon runner preparing for a local marathon over a one-year period. We evaluated the results and costs associated with the decision to compete locally versus internationally and assumed that our runner will live domestically and commute via conventional French transit systems. We then compared the results of our French marathon runner to his running colleagues as well to the other choices related to competing in a marathon. Finally, we will determine whether these observed activities are in line with reducing GHG emissions as it relates to the medium-term stabilization of climate change.
2.1. Marathon Runner Carbon Footprint
Our French marathon runner, Henri, lives in Alfortville, which is a Paris-suburb about 7 km east of Paris-Notre Dame, France. On January 1st, Henri decides to run a marathon by the end of the year, and he chooses the New York City Marathon. In preparation, Henri runs nearly every day, competes in several local races, including the Paris Marathon in April. His programs consider all purchases, nutrition changes as it relates to his marathon preparation, which are grouped into fifteen categories:
Shoes: 4 pairs of running shoes
Clothes: tee shirts (5), running shorts (3), running socks (10), water-proof track suit
Miscellaneous running supplies: Camel-Back® hydration system, head lamp (Nao-Petzl France®), Garmin® GPS-watch, 1 running book (The Science of the Marathon©), running magazine subscriptions (Wider outdoor® and Runners World®)
Daily runs: running 20 km to work (La Defense) each morning (instead of using the subway station)
Weekend runs: 15 km near his home
Sports infrastructure: negligible because he runs existing on roads or tracks and we assume that he does not damage them
Nutrition: besides his regular diet, he adds quinoa pasta (100 g), 4 eggs, meats (150 g), nuts (100 g), and prunes (250 g)
Hygiene: 5 additional hot showers per week
Laundry: 2 additional loads of laundry each month
IT: 2 h of additional internet, computer, and smartphone use
Running Race fees: running license, entry fees to three 10 km races, 3 half-marathons, 1 trail race, and the Paris Marathon (all races are local). He travels to these events by car or via public transportation.
New York Marathon: race fees, lodging, food, economy class round trip airfare to New York (we assume a 50% chance his wife will accompany him; thus we include half of the impact of a second airline ticket).
Its CO2 respiration additional emission is neglected because it corresponds to crop absorption on fields, as a carbon cycle effect–would omit this because the CO2 emissions of produce transportation is not negligible and very difficult to account for.
The assessment will be presented with the six standard carbon footprint categories (Pandey et al., 2010):
Energy: heat energy and electricity consumption.
“Intrants”: goods, foods, and services purchases.
Transportation: goods transportation.
Travel: people traveling by mechanized systems.
Waste: waste management.
Immobilization: infrastructure amortization.
2.2. Changing the Carbon Footprint
We change Henri’s race location from the New York City Marathon to a closer city (1000 km round-trip) to estimate the decrease in the carbon footprint.
2.3. Other Leisure Sportive Activities Comparison
Finally, we will compare the activity of marathon running to tennis and soccer, but in different ways.
Choosing tennis as an alternative activity (at a similar level) would correspond to the purchases of different goods (racket, tennis clothes, balls, and stringing), tennis club membership, weekly practice, tournament fees, and tickets and travel to the “Roland Garros Open de France” tennis tournament.
Regarding soccer, we assume that the person is a fan and not a player. The soccer fan supports a professional team which competes at national and international level. This activity will comprise purchasing one stadium season pass (in the Parc des Princes, supporting Paris-Saint-Germain soccer team), a subscription to a dedicated sports channel, purchasing a new wide-screen television set (assuming his current television is not broken), purchasing additional clothes (team scarf, team shirt with the name of his preferred player), eating additional foods while watching matches (peanuts, beers, and champagne), traveling occasionally to follow his team through France (by train or car-sharing), traveling by plane to see two European championship matches, and using more internet. We also replaced the professional events by a national tennis match and to a local fan zone attendance.
3. Results
The carbon footprint according each sport and traveling conditions is expressed in absolute tCO
2e and relative value to the annual French carbon footprint is indicated in
Table 1.
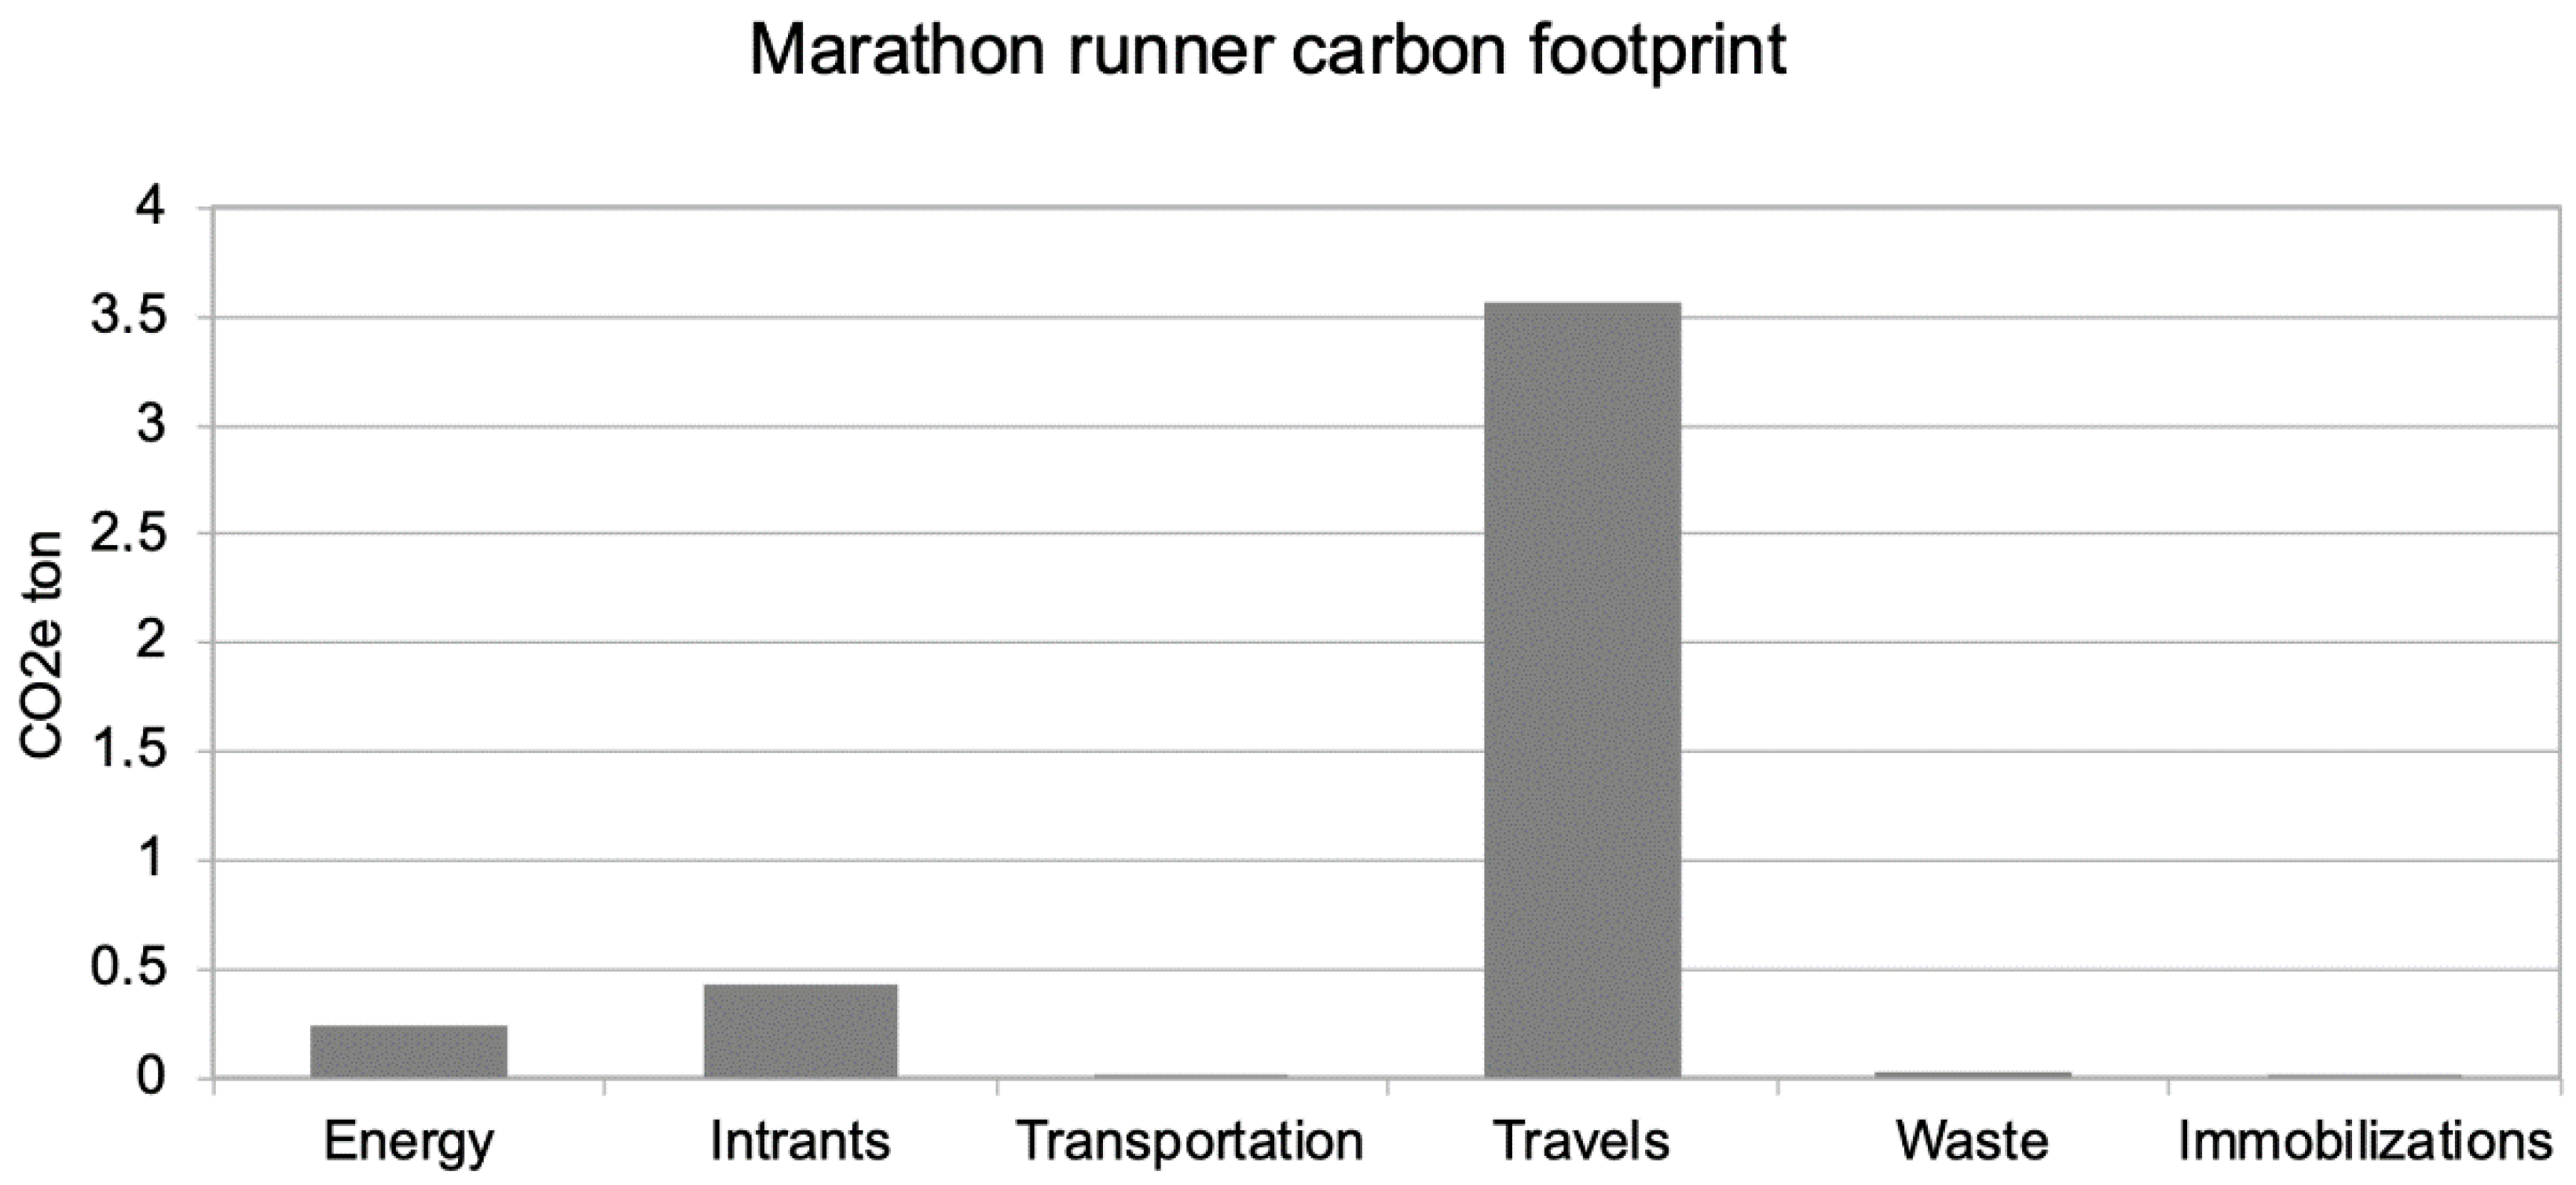
3.1. With the New York City Marathon Option
The first evaluation of GHG representative emissions shows a total mass of 4.3 tons of CO
2e (equivalent CO
2 including the effect of all GHG emitted), as represented in
Figure 1.
In this case, it shows the greatest impact in the travel category, with the New York trip representing nearly all (83%) of the whole carbon footprint (3.56/4.3).
If we compare this global impact to the French annual carbon footprint of 11 tCO2e, we note that this running activity represents, on average, an additional 40% GHG impact. This is mainly due to the transatlantic travel for the New York City Marathon.
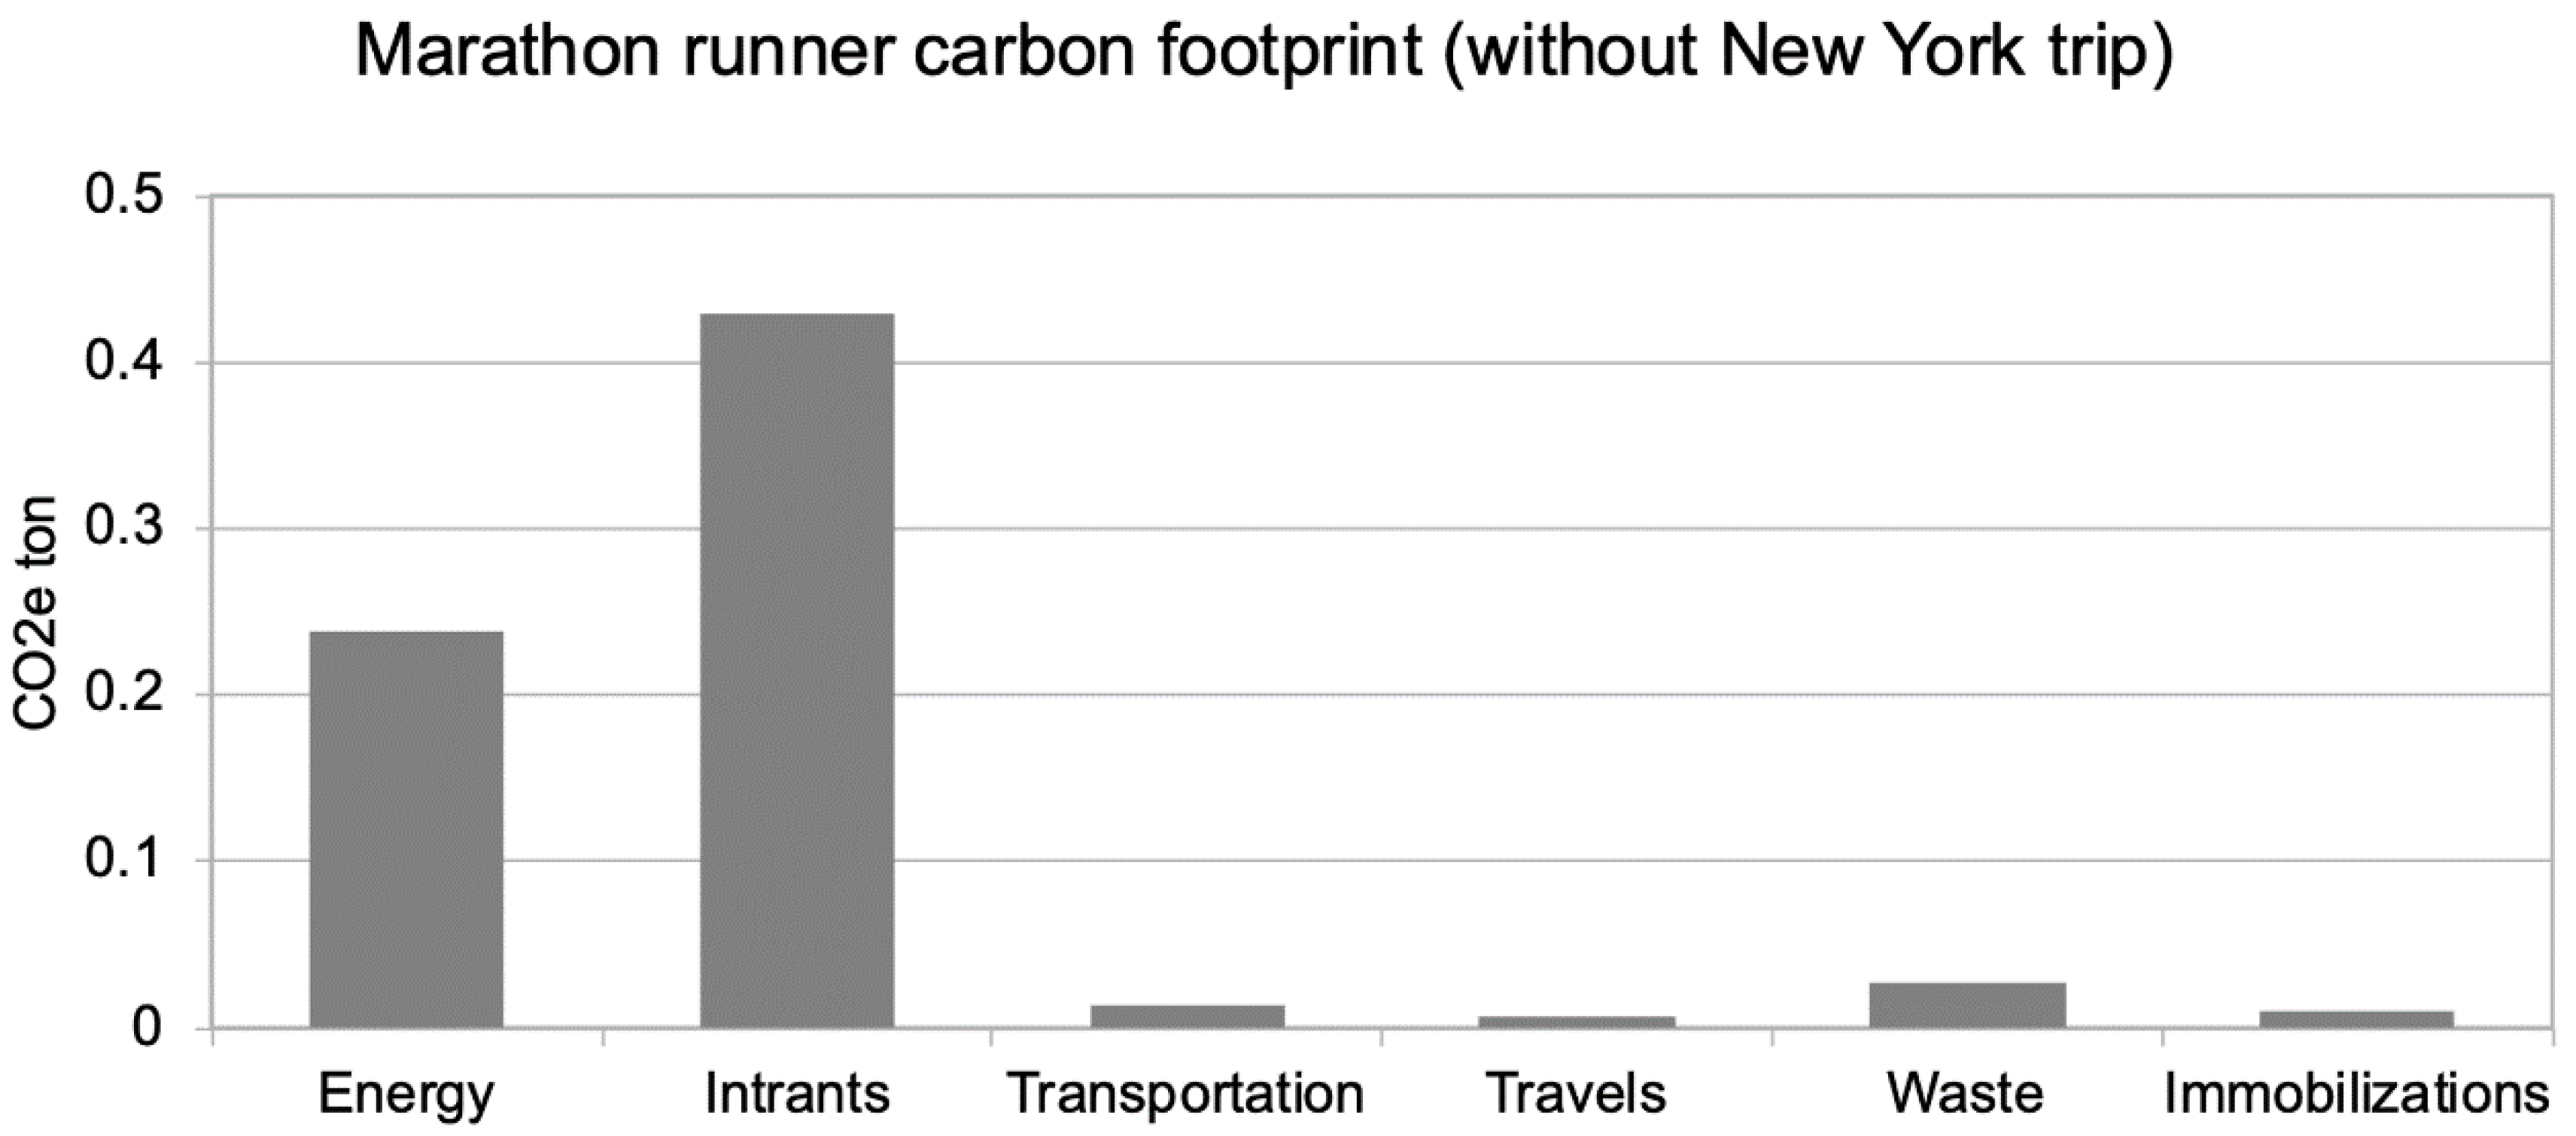
3.2. With the Local Marathon Option
By replacing the New York trip with a closer destination corresponding to a train travel (we supposed a 1000 km round trip), the total mass is lowered 6 times less to 0.7 tCO
2e, (
Figure 2). Interestingly, the travels impacts are almost neutral: running daily to work instead of using public transportation almost compensates for the additional travel to go to races.
Figure 2 demonstrates that the first item is now the “intrants” category, which is mainly composed of electronics, race fees, and additional food. The second item is energy, mainly composed of additional showers.
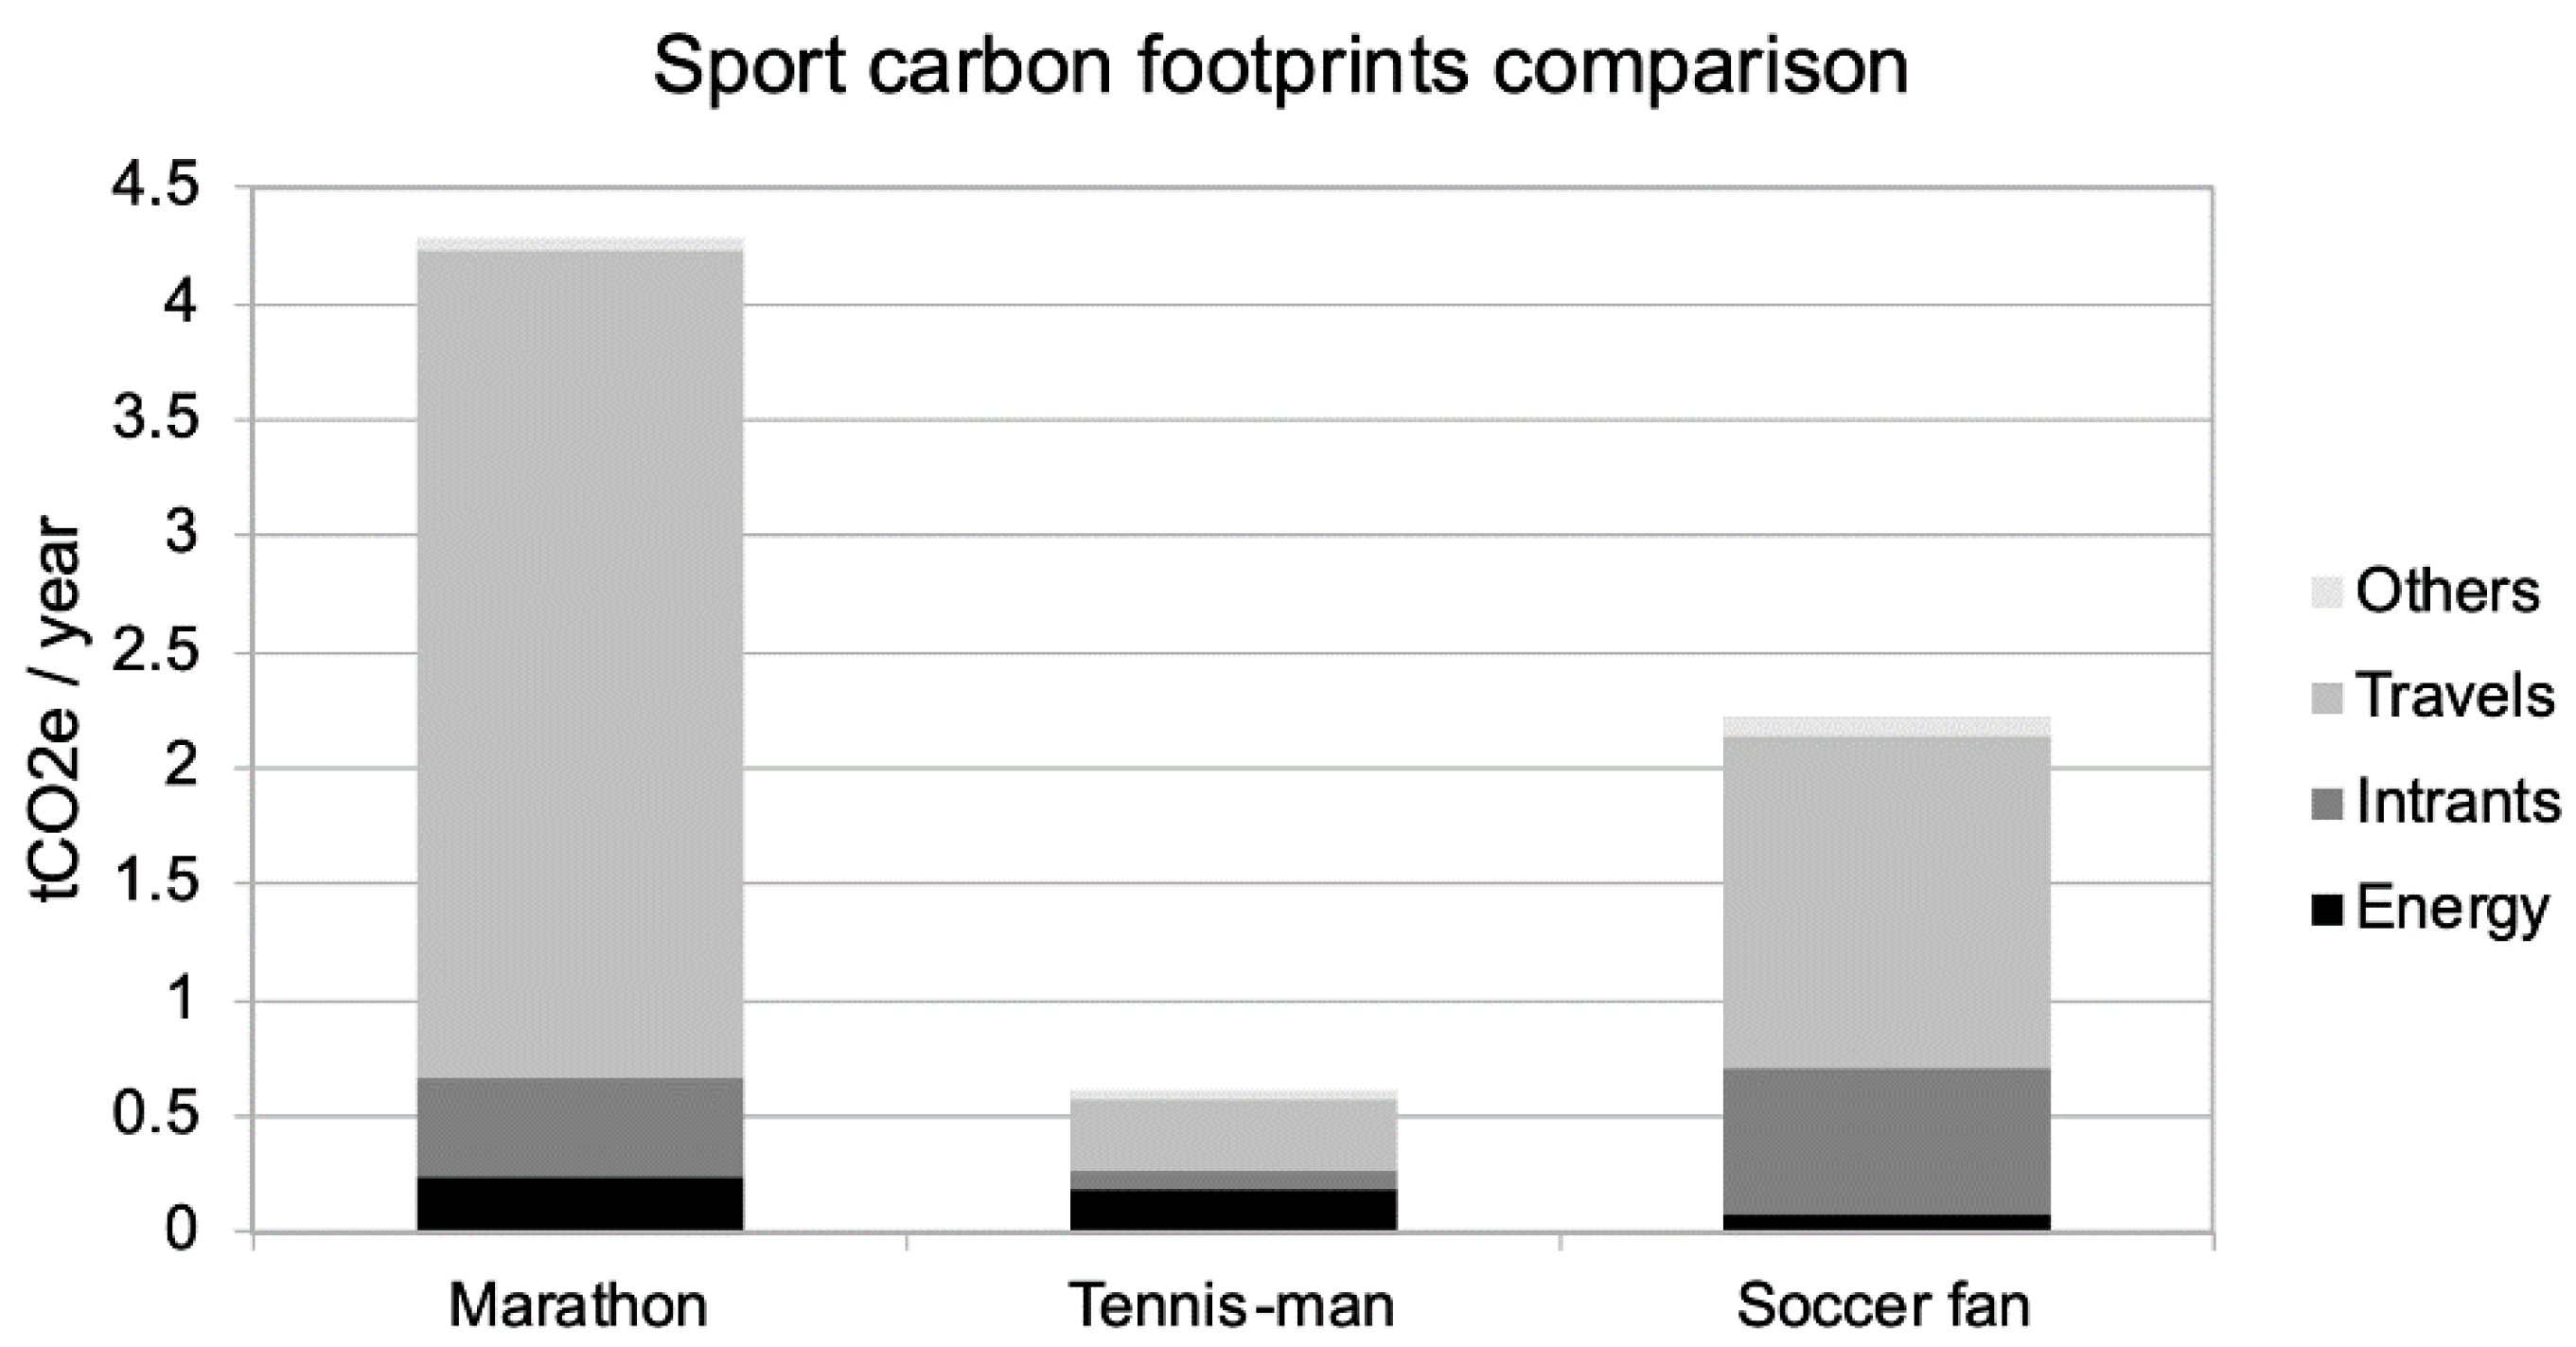
3.3. Comparison of the Carbon Footprint Impact of Marathon Running to Other Leisure Sport Activities (Tennis and Soccer Fan)
Figure 3 shows the comparison of the footprint impact of marathon running with other leisure sport activities.
As shown in the
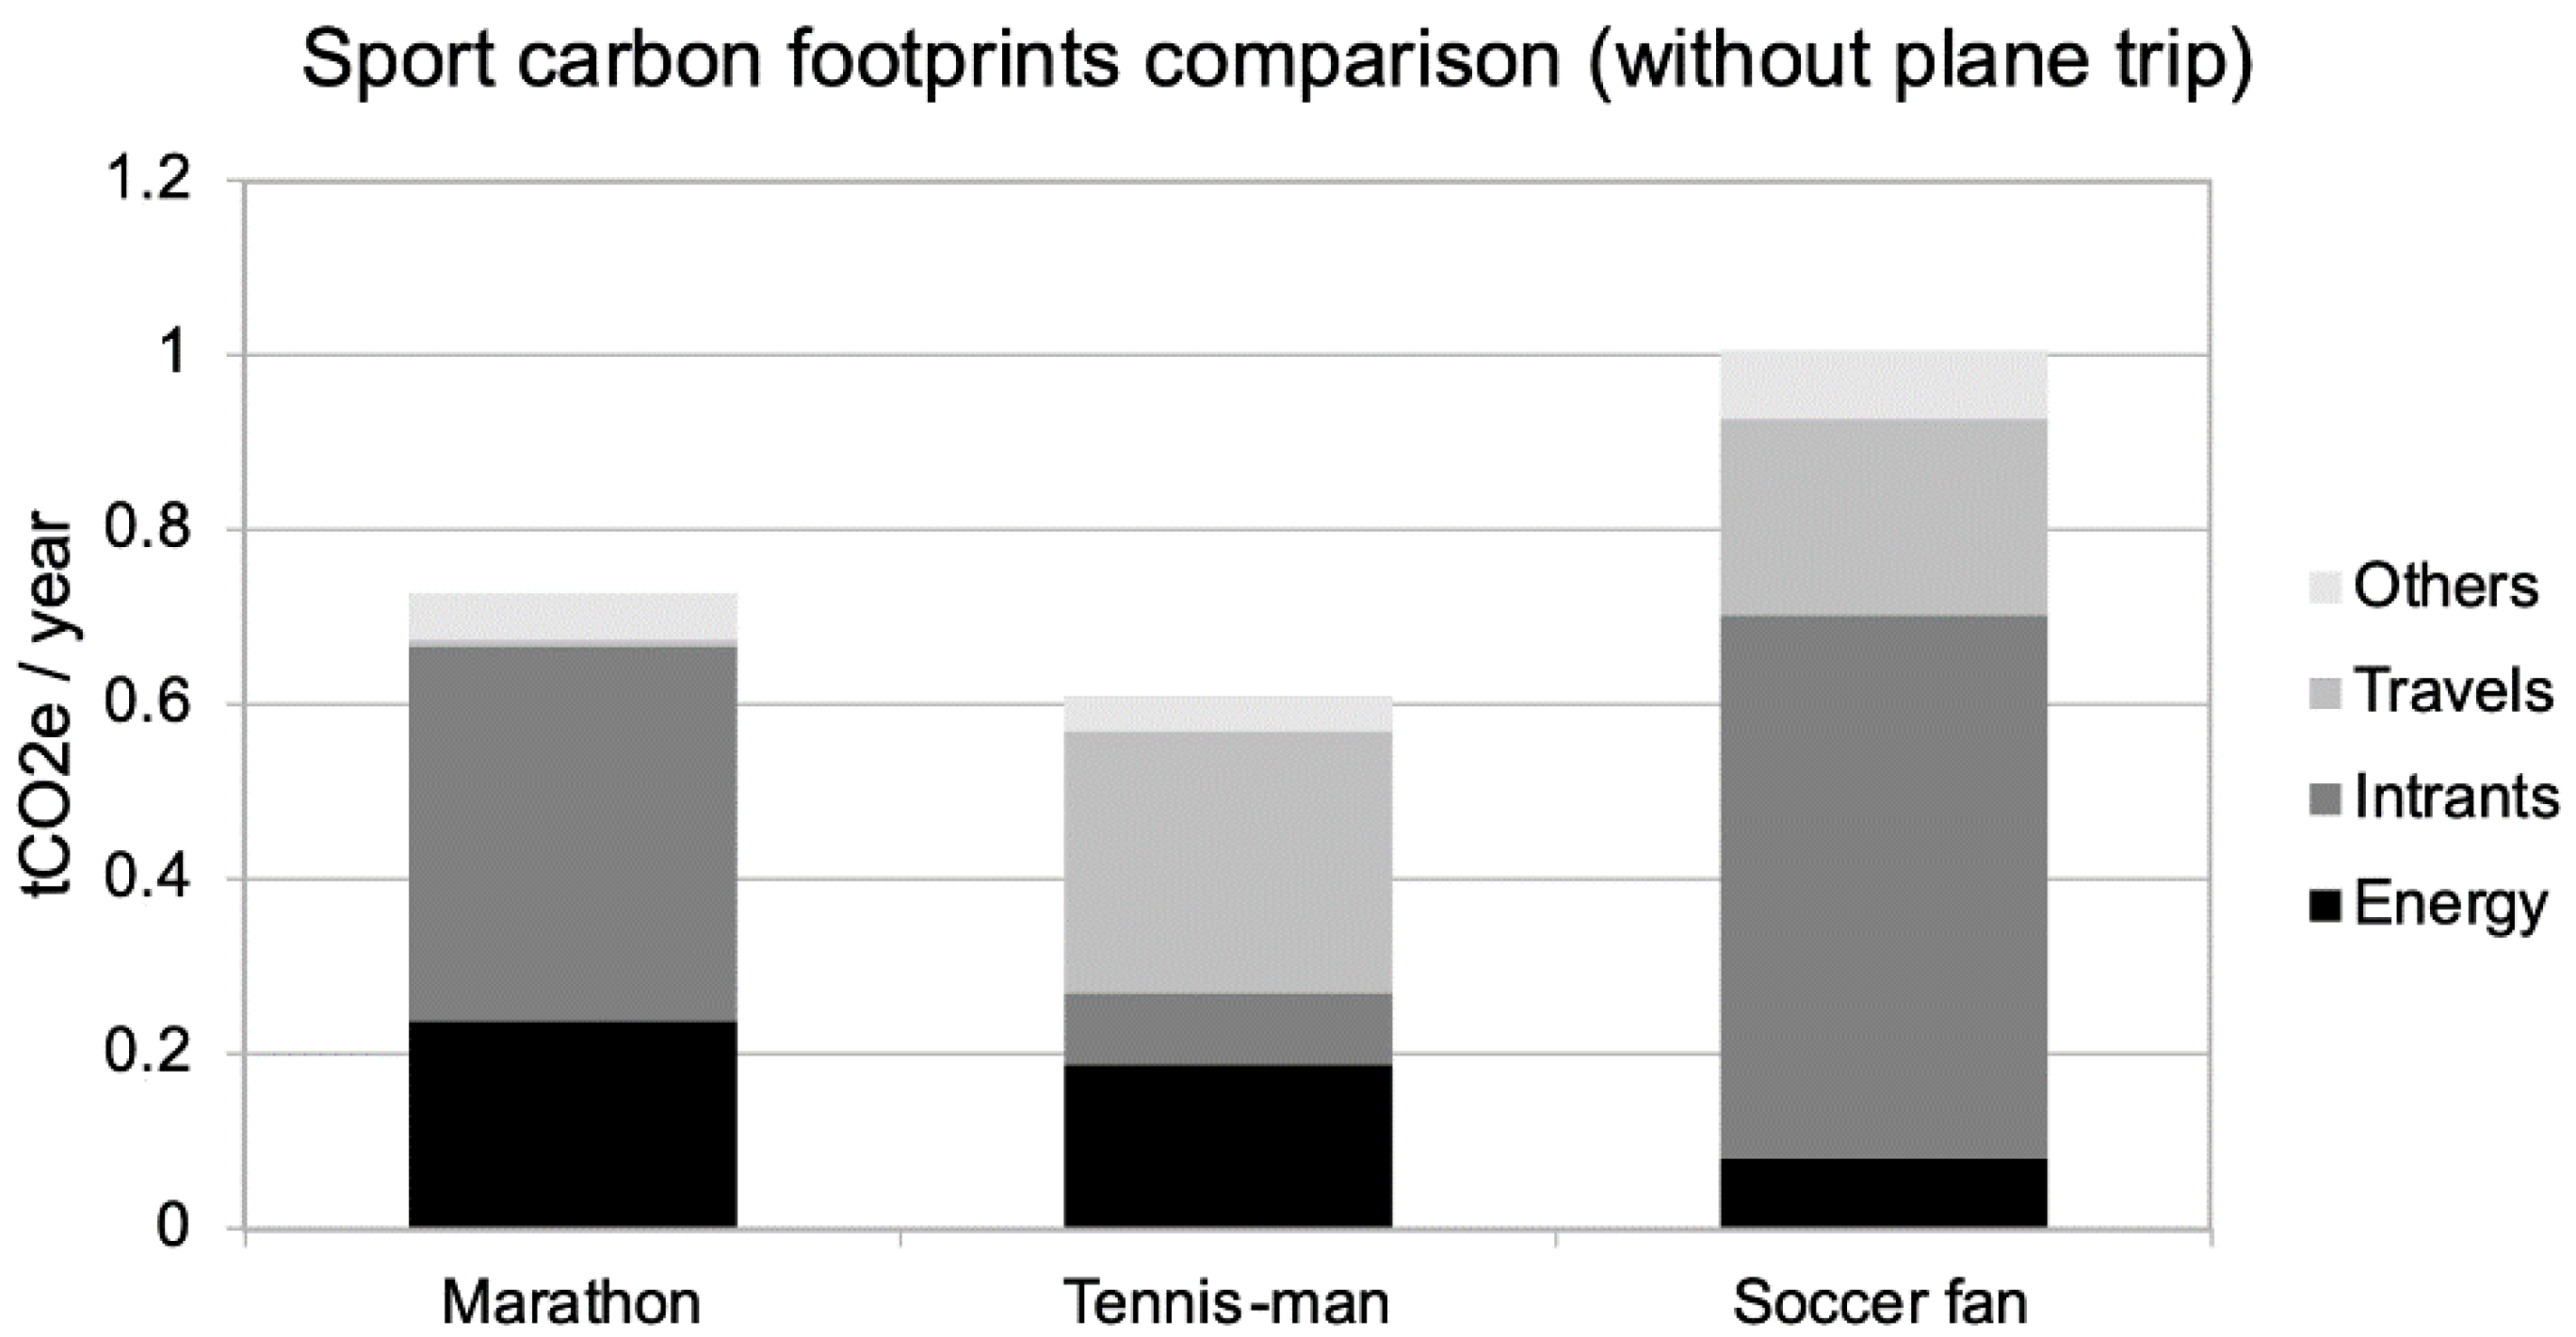
Figure 3, the main impacts are still travelling, which are mainly composed of plane trips (to New York for the runner as noted before, zero for the tennis player and twice into Europe for the soccer fan). If we cancel these plane trips, and replace them with a national running race and to a local fan-zone event, the modified diagram is shown in
Figure 4.
In this comparison, the soccer fan has the highest carbon footprint, mainly impacted by electronic purchases and attending events. The tennis player has the lowest carbon footprint, even considering the amount of travel to tournaments, because, with our hypothesis, he specifically does not purchase electronics (unless he wants a new wide screen television to better watch matches as is the soccer fan’s case).
4. Discussion
This article is the first to demonstrate that marathon training and competition is a low carbon footprint activity if you do not travel to the competition. The CO
2 emissions implications of training and competing in a marathon have not been studied. Previous studies have highlighted that sporting events have become a negative contributor towards environmental degradation [
2,
9]. Indeed, the carbon footprint associated with sport participation has been a significant source of CO
2 emissions, (i.e., 8% of overall emissions for a German adult). Interestingly, non-mainstream individual sports such as diving, golf and surfing leaves the three highest individual carbon footprints. The greenhouse gas emissions from more universal sports activities, such as cycling and walking, are not negligible (because of additional fueling, walking, and cycling). Replacing short car trips with cycling or walking does not significantly produce a carbon emissions savings.
It is a response to a major concern of runners regarding the environment, since a movement is taking place in favor of localized competition, which is largely possible in the context of a sport that offers a great possibility of a wide range of competition throughout the national territory. It was a question of determining how much of this low carbon footprint is due to training and competition. This study provides answers to practitioners for a sport that is in full growth and does not require any particular infrastructure except for the least polluted environment possible. Furthermore, marathon training is an activity that is often integrated into the domestic travel of people running to work, which makes it possible to consider it as an active soft mobility in the same way as cycling.
Indeed, the main result of this study shows that by considering the 6 standard carbon footprint categories, marathon running can reach 40% of the average annual French carbon footprint if the runner competes in an international marathon. If he chooses to run locally, the carbon footprint decreases to only represent 7% of the total carbon footprint. This last case is comparable with the tennis player (6% of the total carbon footprint carbon) and much less than the soccer fan (20%).
The primary advantage of marathon running is that it was included in the active travel, even if we did not calculate the consequence of the positive effects on health outcomes. Indeed, even short distance travel by walking and cycling (less than 3 km) [
20], shows little evidence to the effectiveness of active transport interventions for reducing obesity [
21]. Higher relative VO2max values are associated with greater life expectancy [
22].
Independent of the level of training, running could be included in public health strategies to reduce greenhouse-gas emissions in urban-land transport [
23,
24]. However, prior studies have shown the benefits of walking and cycling, but it is unclear how environmental interventions that might attract walkers and cyclists can reduce CO
2 emissions from transportation. To encourage higher running participation, digital personalized programs [
25] and security for walking paths are included in the walkability index, [
26] and may be helpful to promote active transportation [
18].
Accordingly, with prior studies assessing the carbon footprint of travel patterns of the English Premier Soccer League clubs [
3] and other fan-clubs [
7,
8,
16], the main category increasing CO
2 emissions is the travel for all sports (Marathon, Tennis and Soccer Fan-83, 49 and 65% respectively). Travel CO
2 emissions, however, become negligible for the marathon running when the travel is limited to 1000 km by train (1%). For the last case, the Intrants (goods, food, and services purchases) become the main carbon footprint category. The additional food for marathon runners is not important; even if we balance food intake and energy expenditure which would require less food with an additional energy savings [
17]. However, there are now food supply shortages [
27].
The carbon footprint of the playing tennis agrees with prior studies [
28] and active sport enthusiast [
29,
30]:
Transportation: goods transportation.
Travels: travel by mechanized systems.
Waste: waste management.
Immobilization: infrastructure amortization.
The main finding of this study shows that carbon footprint of marathon running, and other sports activities depends on the amount and distance traveled. Travel represents 83% (with a transatlantic flight) or less than 1% (with a 1000 km train round-trip) of the carbon footprint in our marathon scenario, which also shows that if we compare these last two figures to an ideal carbon footprint, with the goal of climate stabilization, we should target a goal of 2 tons CO
2e. The overall impact of these extra-activities (corresponding to 0.6 to 1 t CO
2e/year) is therefore too much to reach this goal [
14,
15]). Giving up plane travel simply does not reach such a goal. In order to be compliant in climate stabilization, it is necessary to give up electronics, not renewing licenses and memberships, avoid adding additional showers, and take part almost only in local activities. Therefore, beside the personal footprint carbon, society must also consider that the mega sporting events cause a considerable impact on the environment [
11,
13] as in sports industry [
5].
5. Conclusions
Marathon running is an activity that corresponds to a significant carbon footprint. A typical marathon runner can decrease his carbon footprint by 80% by choosing to take part in a local marathon event and avoiding a transatlantic flight. The global impact of this activity is not climate friendly with over 40% of the average annual impact of the current French citizen. Perhaps even this is too much. Even if a person only changes the destination for a train accessible one, that person still only achieves one-third of the average annual climate impact if we maintain the goal of stabilizing the global carbon impact. We need to reduce many other impacts, especially electronics purchases, energy consumption, and the distance traveled.
Marathon event organizers must reconsider the dynamics surrounding attracting international participants if they genuinely want to lower the carbon footprint of their events.
Comparisons of other activities such as tennis and a soccer fan reveal that these are very carbon intensive; especially when they include travel, many extra purchases, etc. This implies that all sports activities must take into consideration the global perspective if they want to address the global climate issue.
6. Limitation of This Study
We wanted to answer a growing question of marathon runners who are wondering about the carbon footprint of their sports practice with a new environmentalist trend that is considering not traveling anymore to participate in marathons and stay local. It was a question of demonstrating the practice of the marathon on the condition of taking part in local competitions (in sufficient supply due to the explosion of offers), will induce a carbon footprint as low as that reported in the literature for the practice of tennis in the context of a territory already well equipped in terms of terrain like Germany [
28]
However, the representativeness in the selection of calculation objectives is very low. There is no need for statistics since this study is a theoretical simulation of traditional training and competition practices of marathon runners [
31]. Additionally, we applied the official calculation method according to the standards [
32].
Indeed, this paper does not have statistics but is a prospective study based on the training, competition and consumption practices of marathon runners based on a sociological study conducted on French marathon runners. We will thus specify within the limits of the study that this study cannot be immediately generalized to marathon runners worldwide, except to demonstrate that a local vs. international competitive practice will contribute to strongly decrease the carbon footprint of marathon practice which had, these last years, seen a tourist development with a strong valence of globalization with travel agencies offering stays whose final objective was the participation in a marathon (New York, Paris, London, Tokyo, etc.).
7. Perspective
Future work on the possibility of running in the case of marathon training in an urban environment will now have to address the question of the influence of pollution on the practice of training and potentially set limits on the intensity of effort as a percentage of the maximum oxygen consumption not to be exceeded according to a given pollution index.
Author Contributions
Conceptualization has been performed by V.B.; methodology, L.C.; software, L.C.; validation, V.B. and F.V.; formal analysis, J.E.; investigation, V.B. and L.C.; resources, V.B. and L.C.; data curation, L.C. and F.V.; writing—original draft preparation, V.B. and L.C.; writing—review and editing, F.V. and J.E.; visualization, J.E.; supervision, V.B.; project administration, F.V.; funding acquisition, V.B. and L.C. All authors have read and agreed to the published version of the manuscript.
Funding
This research received no external funding.
Institutional Review Board Statement
Not applicable.
Informed Consent Statement
Not applicable.
Data Availability Statement
The data presented in this study are available on request from the corresponding author.
Conflicts of Interest
No conflicts of Interest.
References
- The Carbon Trus. Carbon Footprinting Measurement Methodology, version 1.1; The Carbon Trust: London, UK, 2007. [Google Scholar]
- Dosumu, A.; Colbeck, I.; Bragg, R. Greenhouse gas emissions as a result of spectators travelling to football in England. Sci. Rep. 2017, 7, 6986. [Google Scholar] [CrossRef] [Green Version]
- Pereira, R.P.T.; Filimonau, V.; Ribeiro, G.M. Score a goal for climate: Assessing the carbon footprint of travel patterns of the English Premier League clubs. J. Clean. Product. 2019, 227, 167–177. [Google Scholar] [CrossRef]
- Babiak, K.; Trendafilova, S. CSR and environmental responsibility: Motives and pressures to adopt green management practices. Corp. Soc. Responsib. Environ. Mgmt. 2011, 18, 11–24. [Google Scholar] [CrossRef]
- Triantafyllidis, S. Carbon Dioxide Emissions Research and Sustainable Transportation in the Sports industry. C J. Carbon Res. 2018, 4, 57. [Google Scholar] [CrossRef] [Green Version]
- McCullough, B.; Pfahl, M.; Nguyen, S. The green waves of environmental sustainability in sport. Sport Soc. 2016, 19, 1040–1065. [Google Scholar] [CrossRef]
- Triantafyllidis, S.; Ries, R.J.; Kaplanidou, K. Carbon Dioxide Emissions of Spectators’ Transportation in Collegiate Sporting Events: Comparing On-Campus and Off-Campus Stadium Locations. Sustainability 2018, 10, 241. [Google Scholar] [CrossRef] [Green Version]
- Chard, C.; Mallen, C. Examining the Linkages between Automobile Use and Carbon Impacts of Community-Based Ice Hockey. Sport Manag. Rev. 2012, 15, 476–484. [Google Scholar] [CrossRef]
- Collins, A.; Flynn, A. Engaging with the ecological footprint as a decision-making tool: Process and responses. Local Environ. 2007, 12, 295–312. [Google Scholar] [CrossRef]
- Pfahl, M. The Environmental awakening in sport. Solut. J. 2013, 4, 67–76. [Google Scholar]
- Collins, A.; Jones, C.; Munday, M. Assessing the Environmental Impacts of Mega Sporting Events: Two Options? Tour. Manag. 2009, 30, 828–837. [Google Scholar] [CrossRef]
- Grant, T.J. Green monsters: Examining the environmental impact of sport stadiums. Vill. Envtl. LJ 2014, 25, 148–176. [Google Scholar]
- Bunds, K.; Casper, J. Sport, Physical Culture, and the Environment: An Introduction. Sociol. Sport J. 2018, 35, 1–7. [Google Scholar] [CrossRef]
- Mallen, C.; Stevens, J.; Adams, L.; McRobert, S. The Assessment of the Environmental Performance of an International Multi-Sport Event. Eur. Sport Manag. Quart. 2010, 10, 97–122. [Google Scholar] [CrossRef]
- Brian, P. McCullough and Timothy Kellison. Making our footprint: Constraints in the legitimization of sport ecology in practice and the academy. In Sport and the Environment Research in the Sociology of Sport; Wilson, B., Millington, B., Eds.; Emerald Publishing Limited: Bingley, UK, 2020; Volume 13, pp. 199–216. [Google Scholar]
- Dolf, M.; Teehan, P. Reducing the Carbon footprint of Spectator and Team Travel at the University of British Columbia’s Varsity Sports Events. Sport Manag. Rev. 2015, 18, 244–255. [Google Scholar] [CrossRef]
- Bjørnarå, H.B.; Torstveit, M.K.; Stea, T.H.; Bere, E. Is There Such a Thing as Sustainable Physical Activity? Scand. J. Med. Sci. Sports 2017, 27, 366–372. [Google Scholar] [CrossRef] [PubMed] [Green Version]
- Brand, C.; Goodman, A.; Ogilvie, D. Evaluating the Impacts of New Walking and Cycling Infrastructure on Carbon Dioxide Emissions from Motorized Travel: A Controlled Longitudinal Study. Appl. Energy 2014, 128, 284–295. [Google Scholar] [CrossRef] [PubMed] [Green Version]
- Mizdrak, A.; Cobiac, L.J.; Cleghorn, C.L.; Woodward, A.; Blakely, T. Fueling walking and cycling: Human powered locomotion is associated with non-negligible greenhouse gas emissions. Sci. Rep. 2020, 10, 9196. [Google Scholar] [CrossRef]
- Rojas-Rueda, D.; de Nazelle, A.; Andersen, Z.J.; Braun-Fahrländer, C.; Bruha, J.; Bruhova-Foltynova, H.; Desqueyroux, H.; Praznoczy, C.; Ragettli, M.S.; Tainio, M.; et al. Health Impacts of Active Transportation in Europe. PLoS ONE 2016, 11, e0149990. [Google Scholar] [CrossRef]
- Saunders, L.E.; Green, J.M.; Petticrew, M.P.; Steinbach, R.; Roberts, H. What Are the Health Benefits of Active Travel? A Systematic Review of Trials and Cohort Studies. PLoS ONE 2013, 8, e69912. [Google Scholar] [CrossRef] [PubMed] [Green Version]
- Strasser, B.; Burtscher, M. Survival of the fittest: VO2max, a key predictor of longevity? Front. Biosci. 2018, 23, 1505–1516. [Google Scholar] [CrossRef] [PubMed]
- Woodcock, J.; Edwards, P.; Tonne, C.; Armstrong, B.G.; Ashiru, O.; Banister, D.; Beevers, B.; Chalabi, Z.; Chowdhury, Z.; Cohen, A.; et al. Public Health Benefits of Strategies to Reduce Greenhouse-Gas Emissions: Urban Land Transport. Lancet 2009, 374, 1330–1343. [Google Scholar] [CrossRef]
- Bernard, P.; Chevance, G.; Kingsbury, C.; Baillot, A.; Romain, A.J.; Molinier, V.; Gadais, T.; Dancause, K.N. Climate Change, Physical Activity and Sport: A Systematic Review. SportRxiv 2020, 1, 1–39. [Google Scholar]
- Molinari, C.A.; Palacin, F.; Poinsard, L.; Billat, V.L. Determination of Submaximal and Maximal Training Zones From a 3-Stage, Variable-Duration, Perceptually Regulated Track Test. Int. J. Sports Physiol. Perform. 2020, 15, 853–861. [Google Scholar] [CrossRef]
- Frank, L.D.; Sallis, J.F.; Saelens, B.E.; Leary, L.; Cain, K.; Conway, T.L.; Hess, P.M. The development of a walkability index: Application to the Neighborhood Quality of Life Study. Br. J. Sports Med. 2010, 44, 924–933. [Google Scholar] [CrossRef]
- Canfora, I. Is the short food supply chain an efficient solution for sustainability in food market? Agric. Agric. Sci. Procedia 2016, 8, 402–407. [Google Scholar] [CrossRef] [Green Version]
- Wicker, P. The Carbon Footprint of Active Sport Participants. Sport Manage. Rev. 2019, 22, 513–526. [Google Scholar] [CrossRef]
- Wicker, P. The carbon Footprint of Active Sport Tourists: An Empirical Analysis of Skiers and Boarders. J. Sport Tourism. 2018, 22, 151–171. [Google Scholar] [CrossRef]
- Grofelnik, H.; Peric, M.; Wise, N. Applying Carbon Footprint Method Possibilities to the Sustainable Development of Sports Tourism. Sustainable Tourism. WIT Trans. Ecol. Environ. 2020, 248, 153–163. [Google Scholar]
- Lapeyronie, B. Socio-economic consequences of sporting tourism. Examples of marathons in France. Téoros Rev. Rech. Tour. 2009, 28, 37–44. [Google Scholar] [CrossRef] [Green Version]
- Wackernagel, M.; Rees, W. Our Ecological Footprint: Reducing Human Impact on the Earth; New Society Publishers: Philadelphia, PA, USA, 1996; 160p. [Google Scholar]
| Publisher’s Note: MDPI stays neutral with regard to jurisdictional claims in published maps and institutional affiliations. |
© 2021 by the authors. Licensee MDPI, Basel, Switzerland. This article is an open access article distributed under the terms and conditions of the Creative Commons Attribution (CC BY) license (http://creativecommons.org/licenses/by/4.0/).


