
Perceiving Social-Emotional Volatility and Triggered Causes of COVID-19

Abstract
:1. Introduction
2. Related Work
2.1. Public Emotion and Discrete Emotion Lexicon
2.2. Emotional Abrupt and Cause Detection
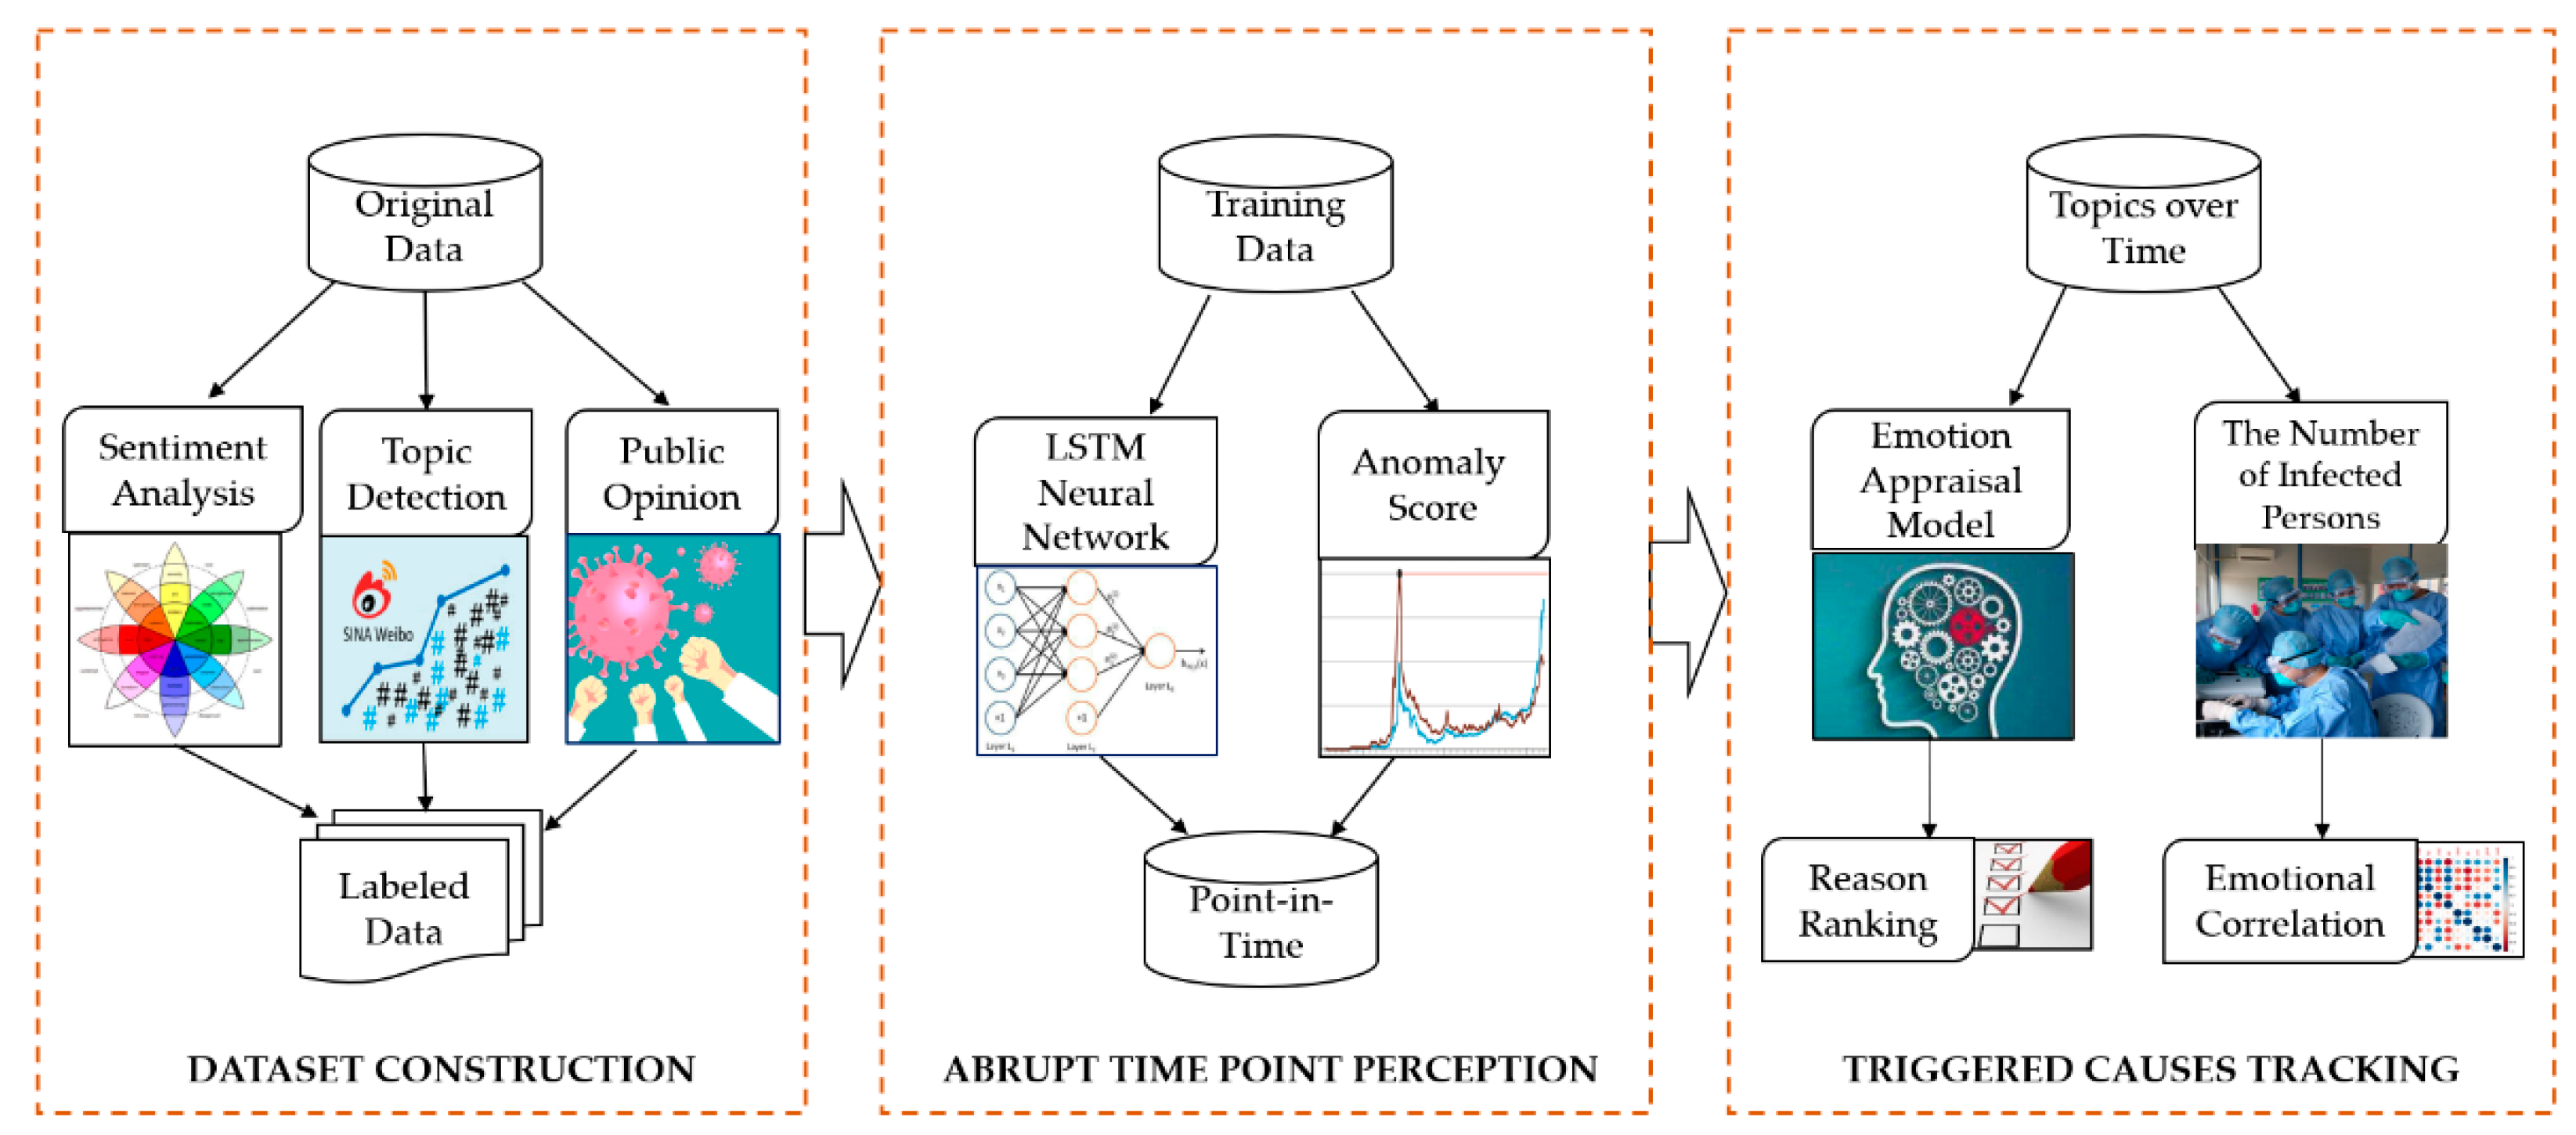
3. Methods
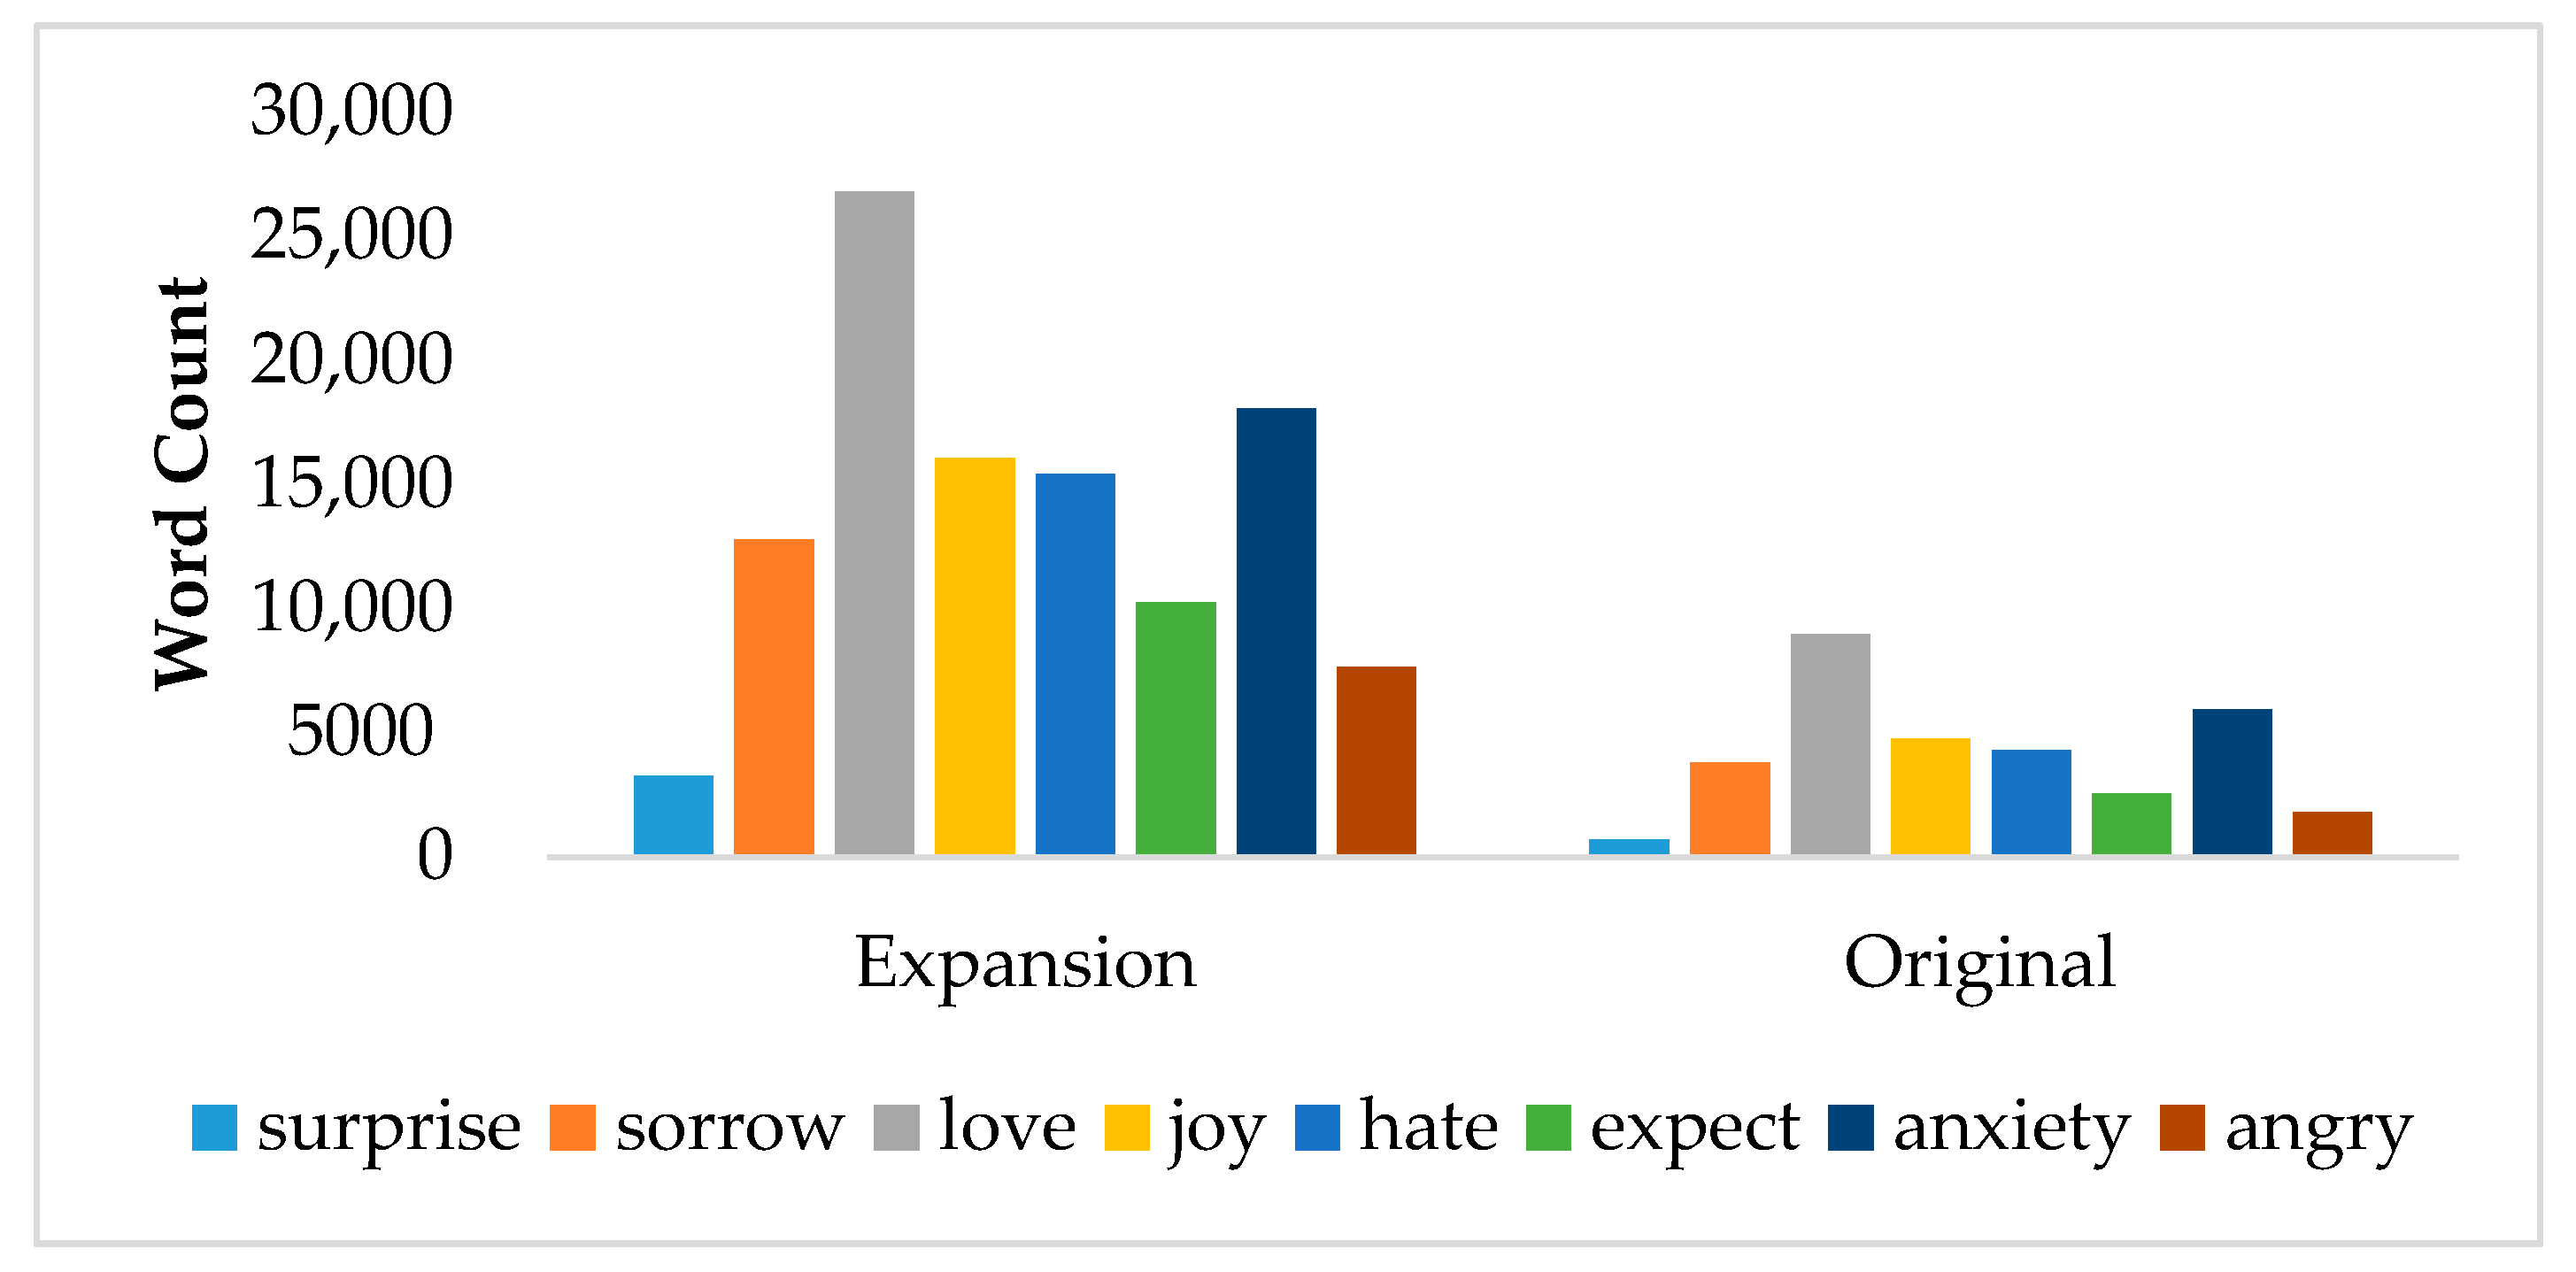
3.1. Dataset Analysis
3.2. Measurement of Public Emotions
3.2.1. Discrete Emotion Lexicon Construction
3.2.2. Optimization Strategy of Social-Emotional Volatility
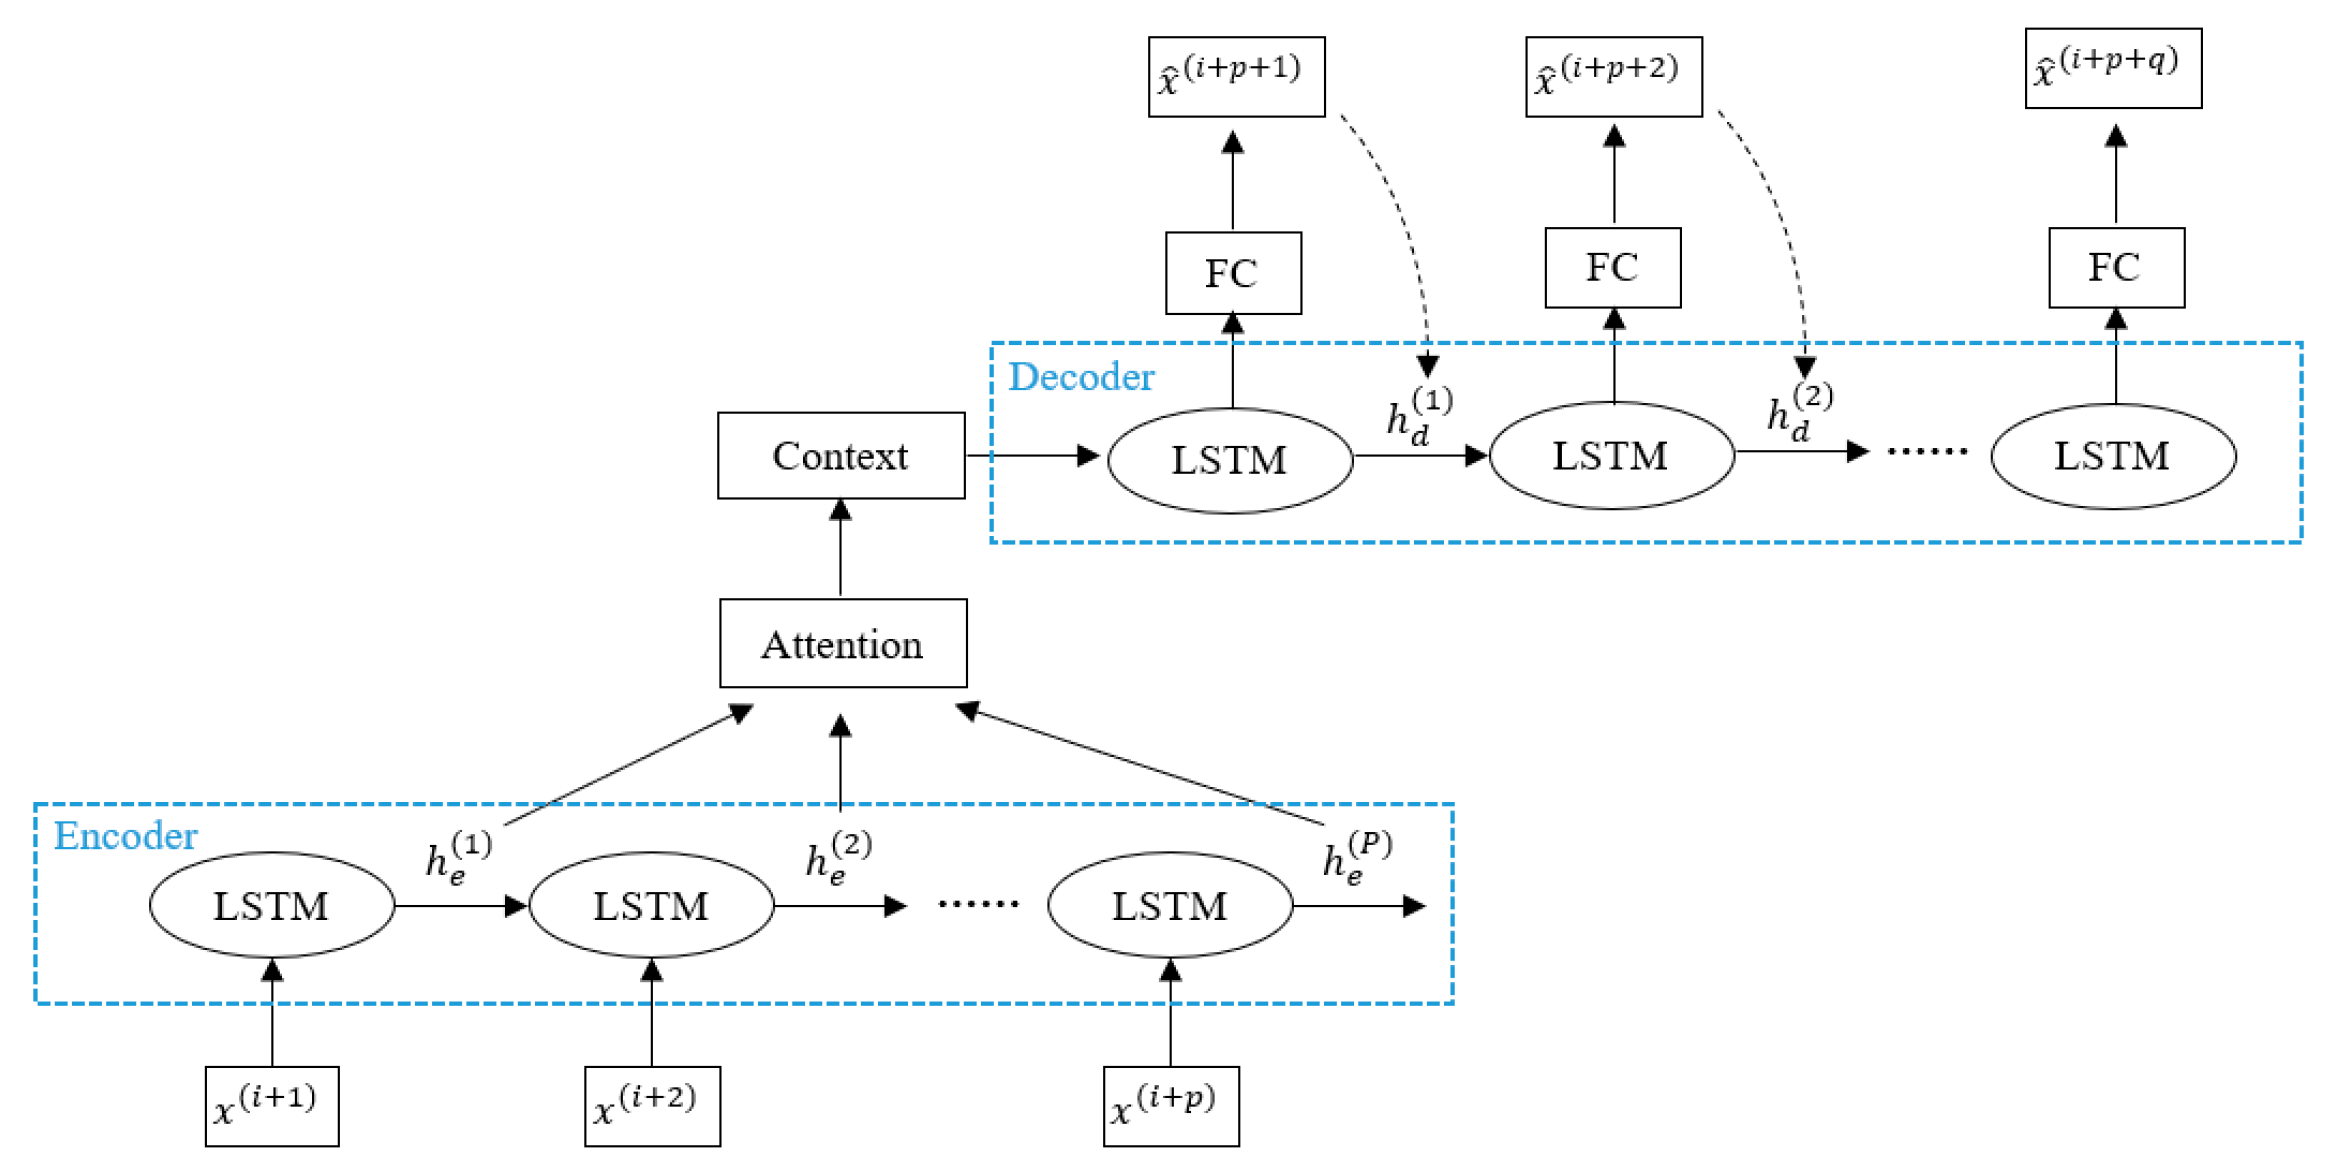
3.3. Public Emotional Perception Model
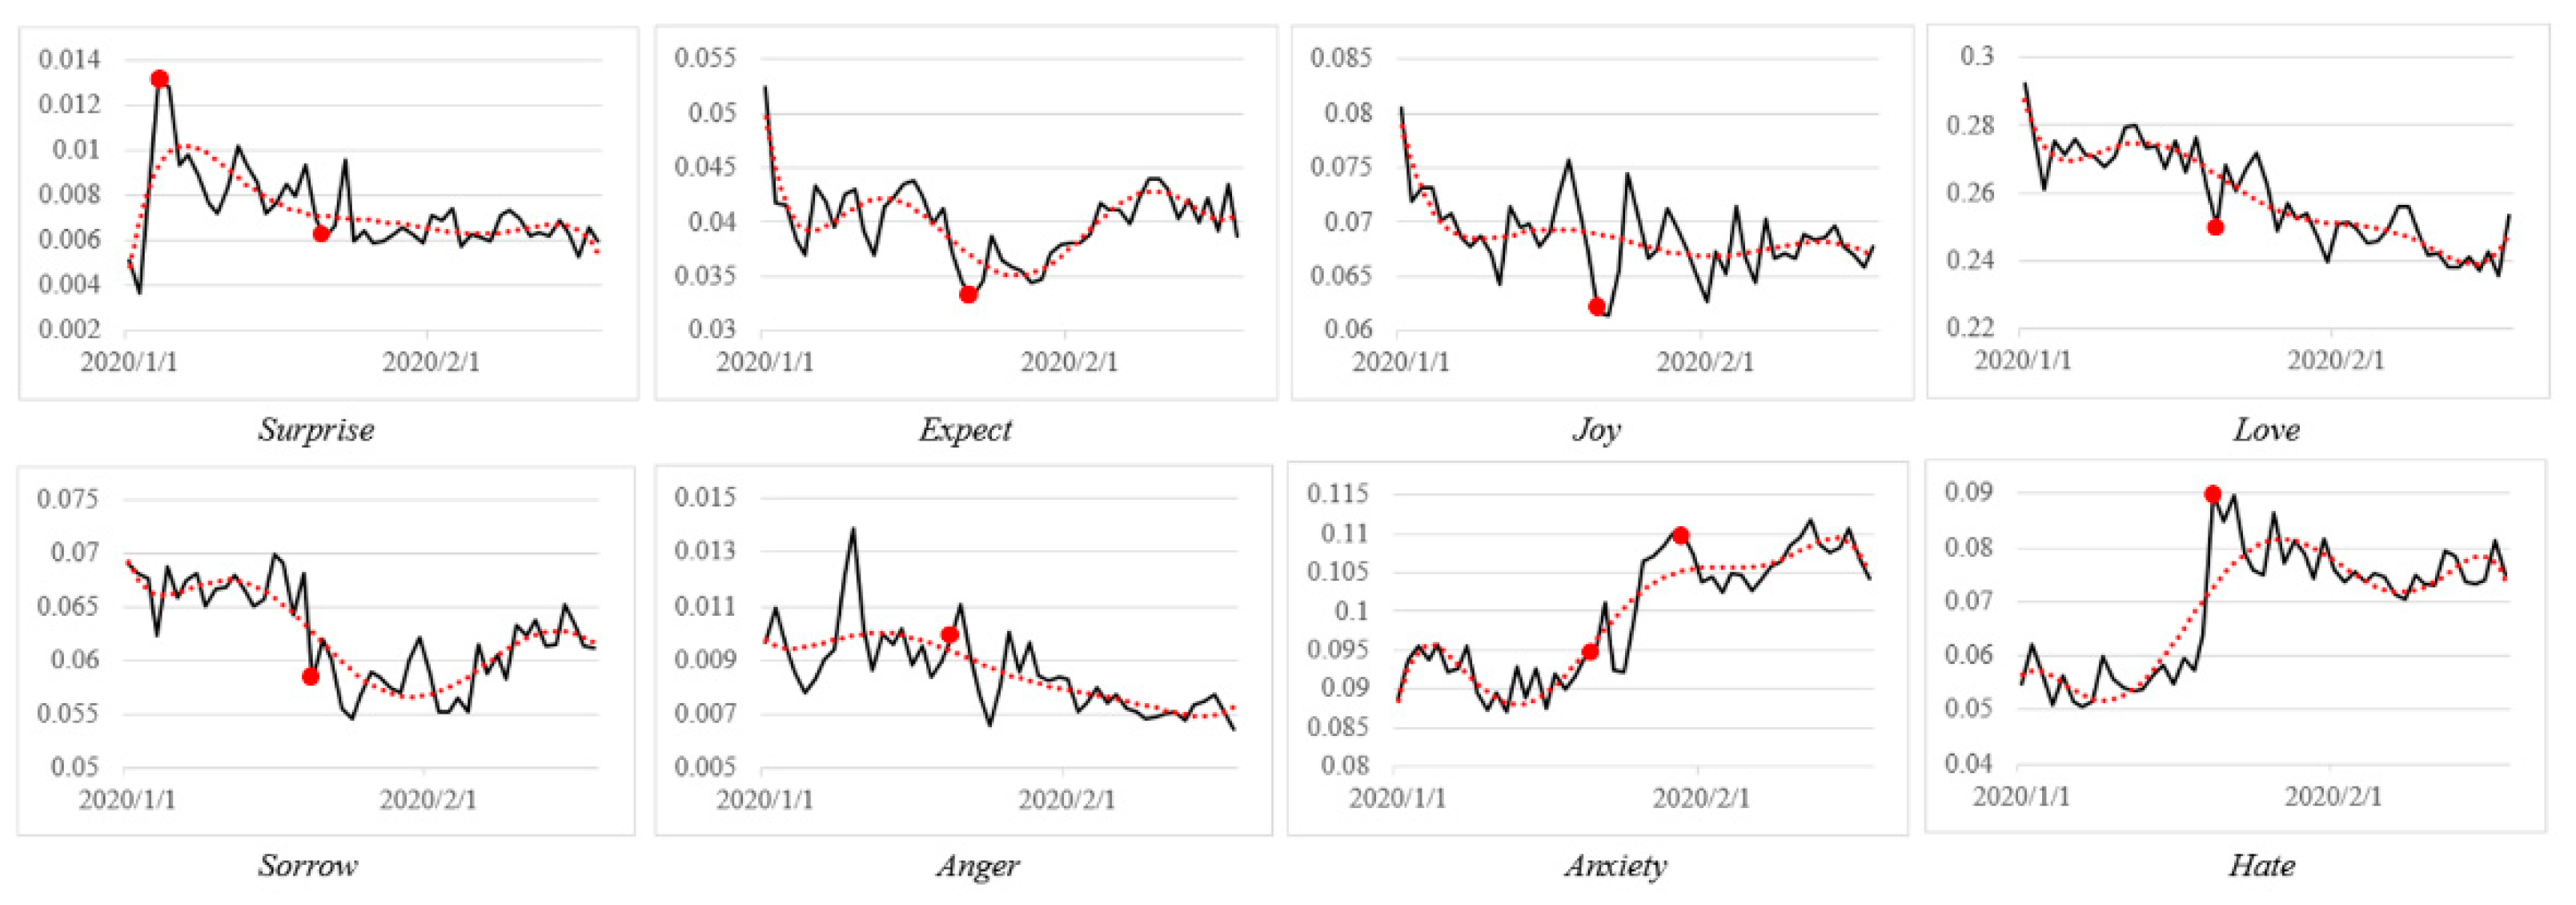
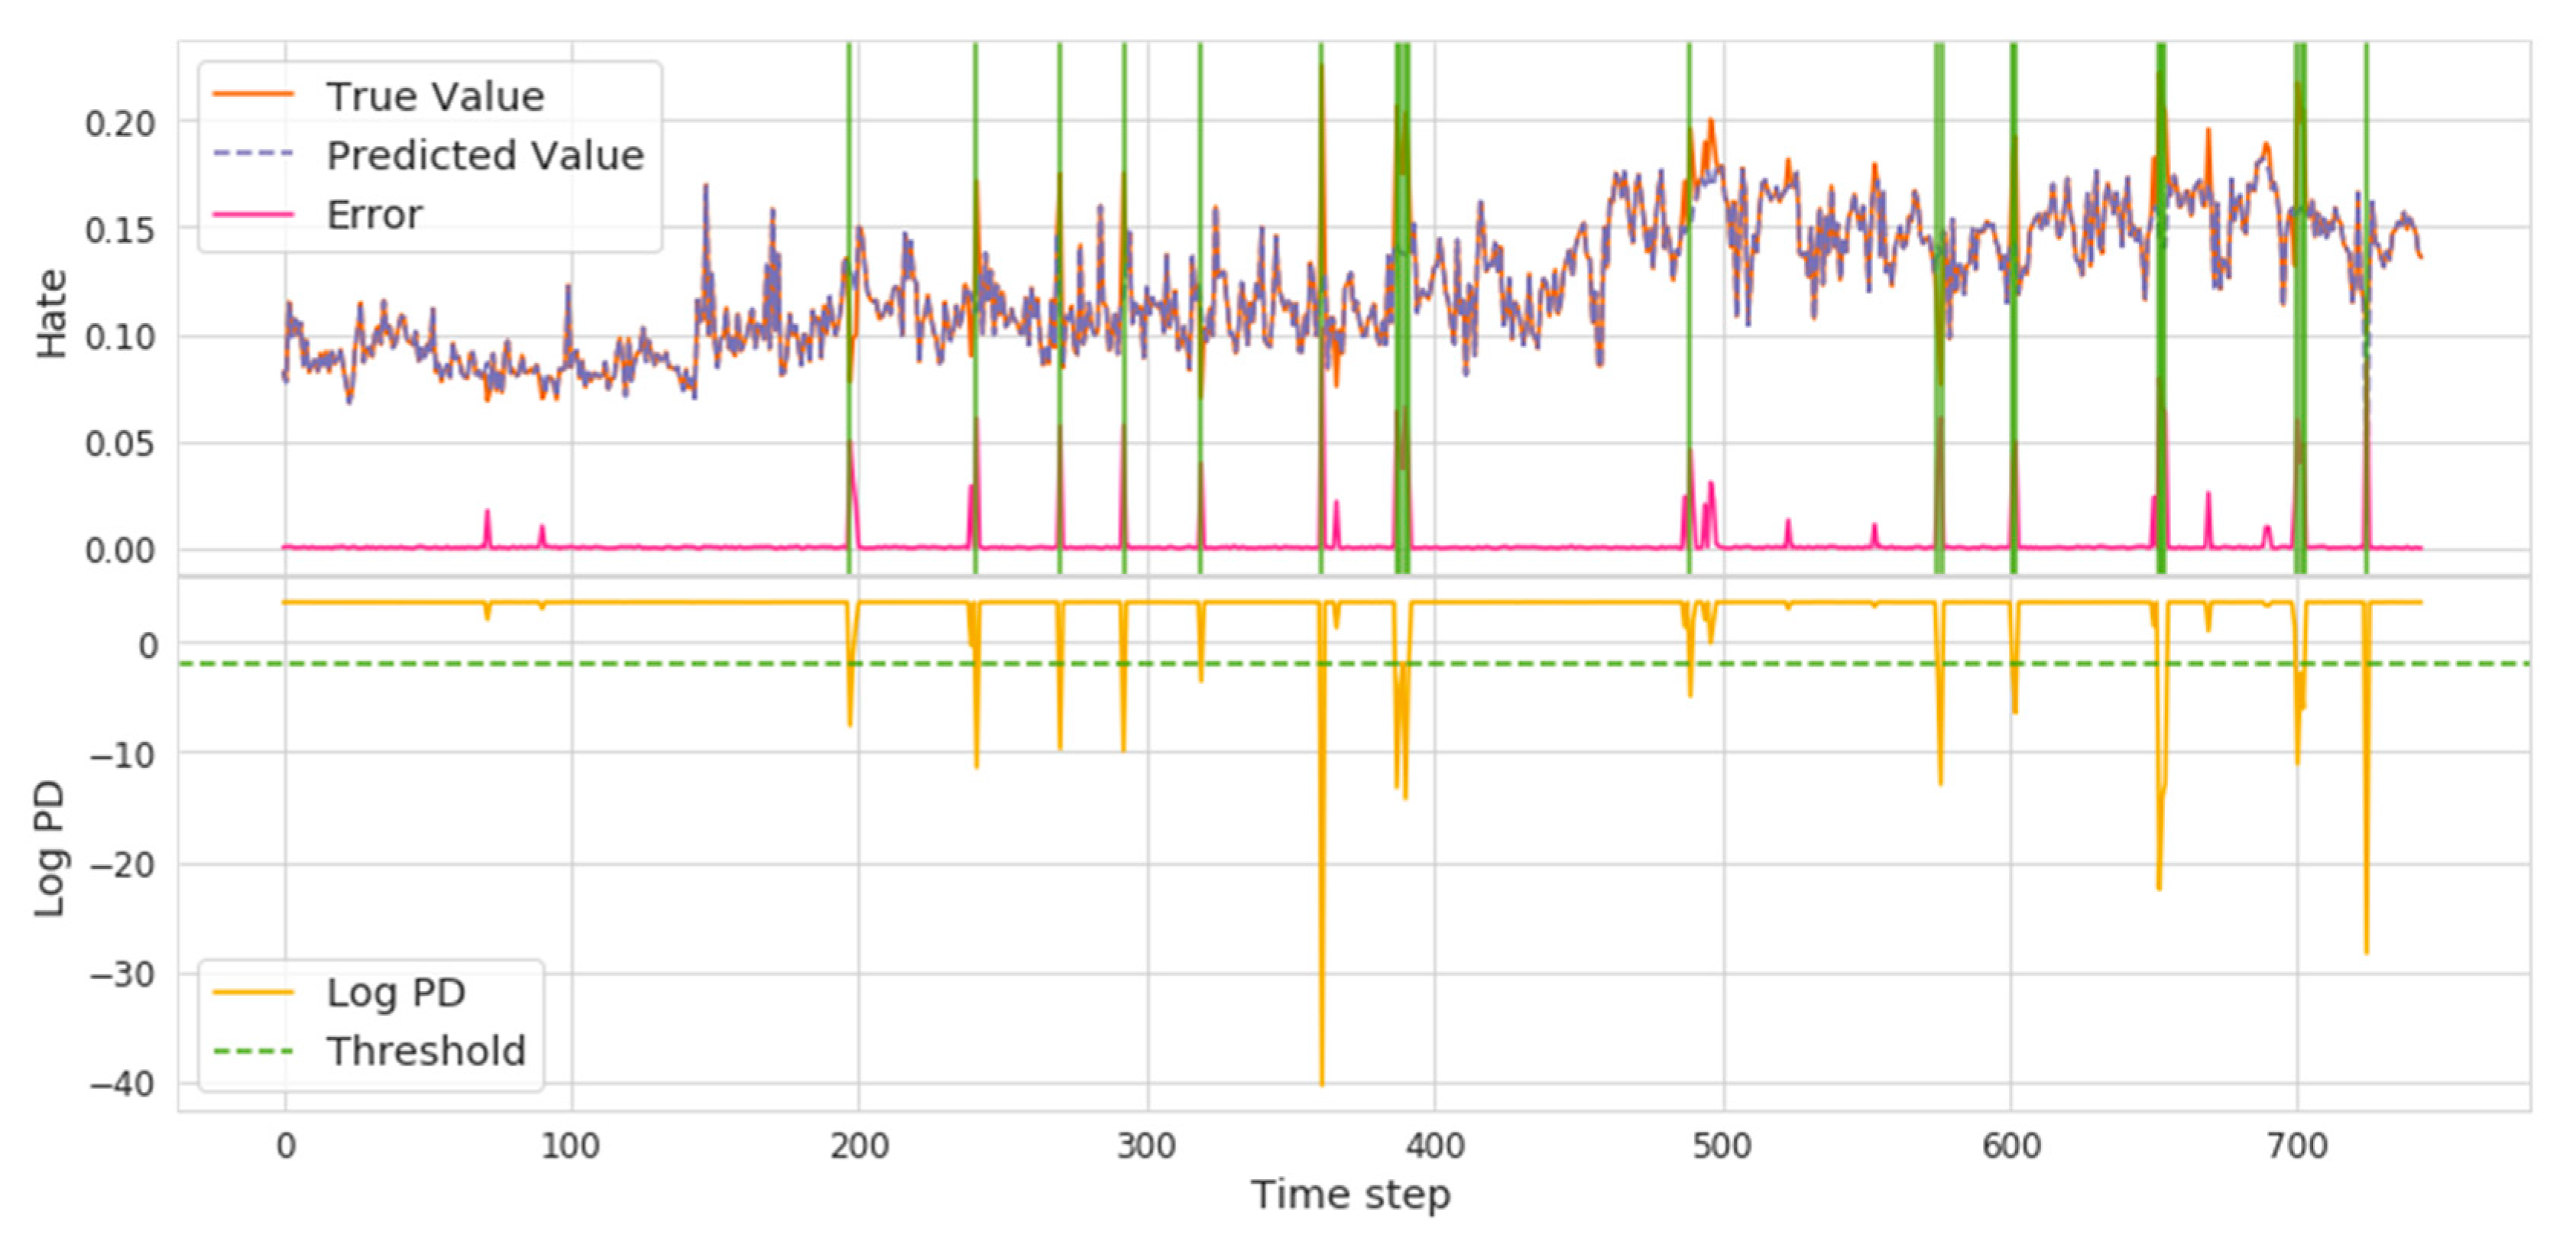
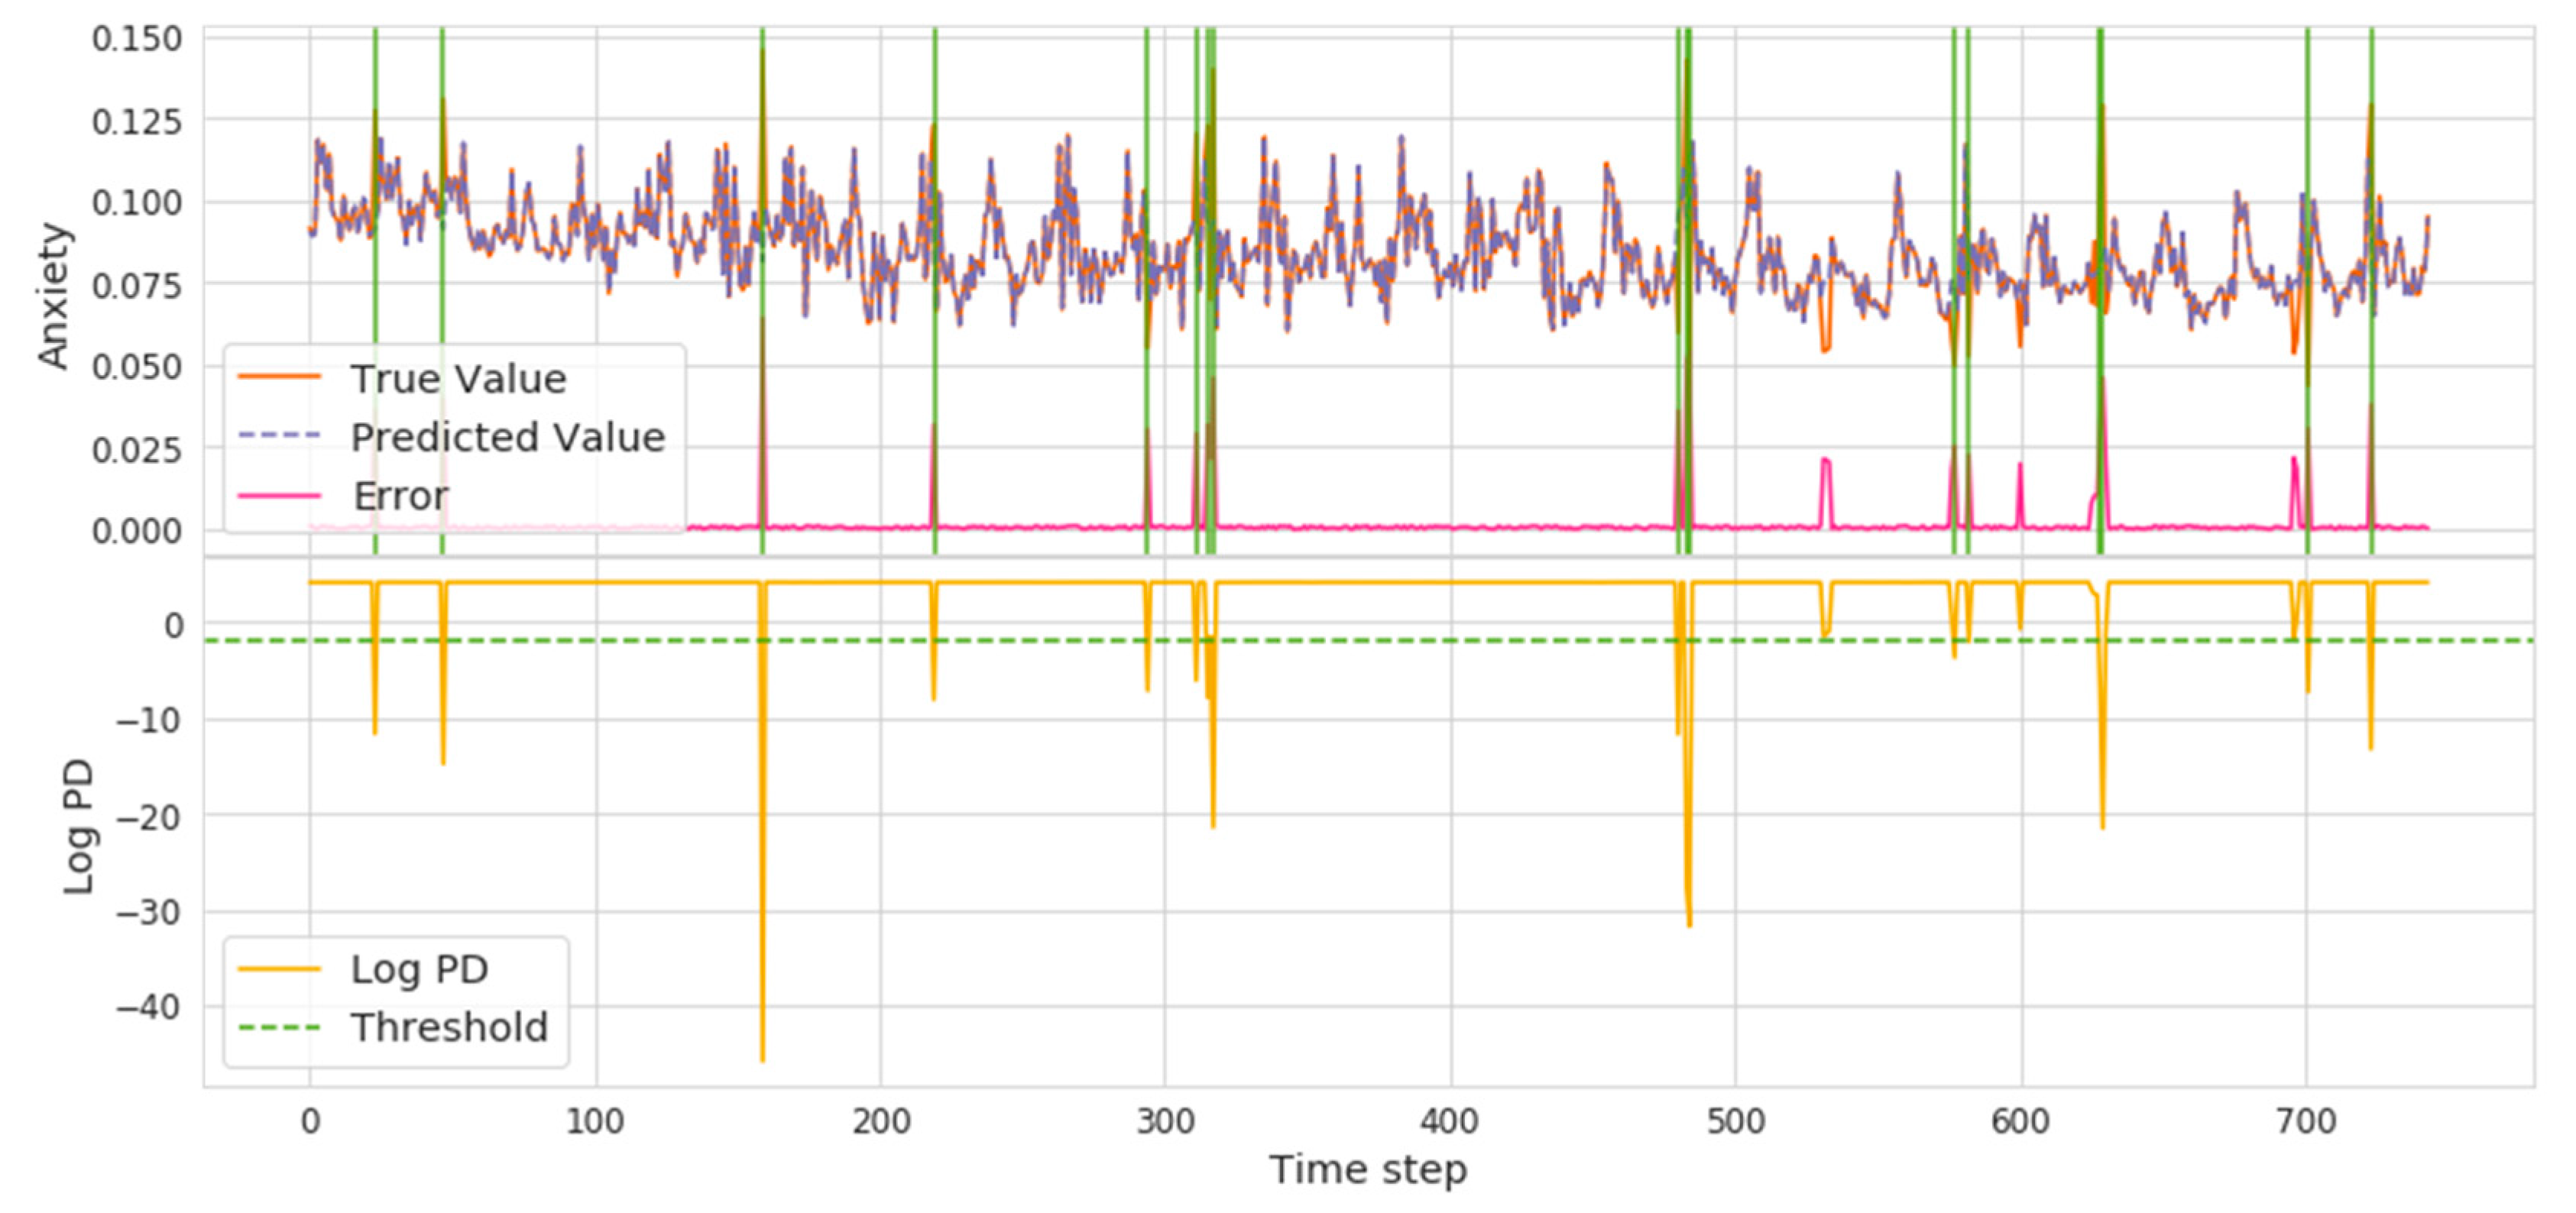
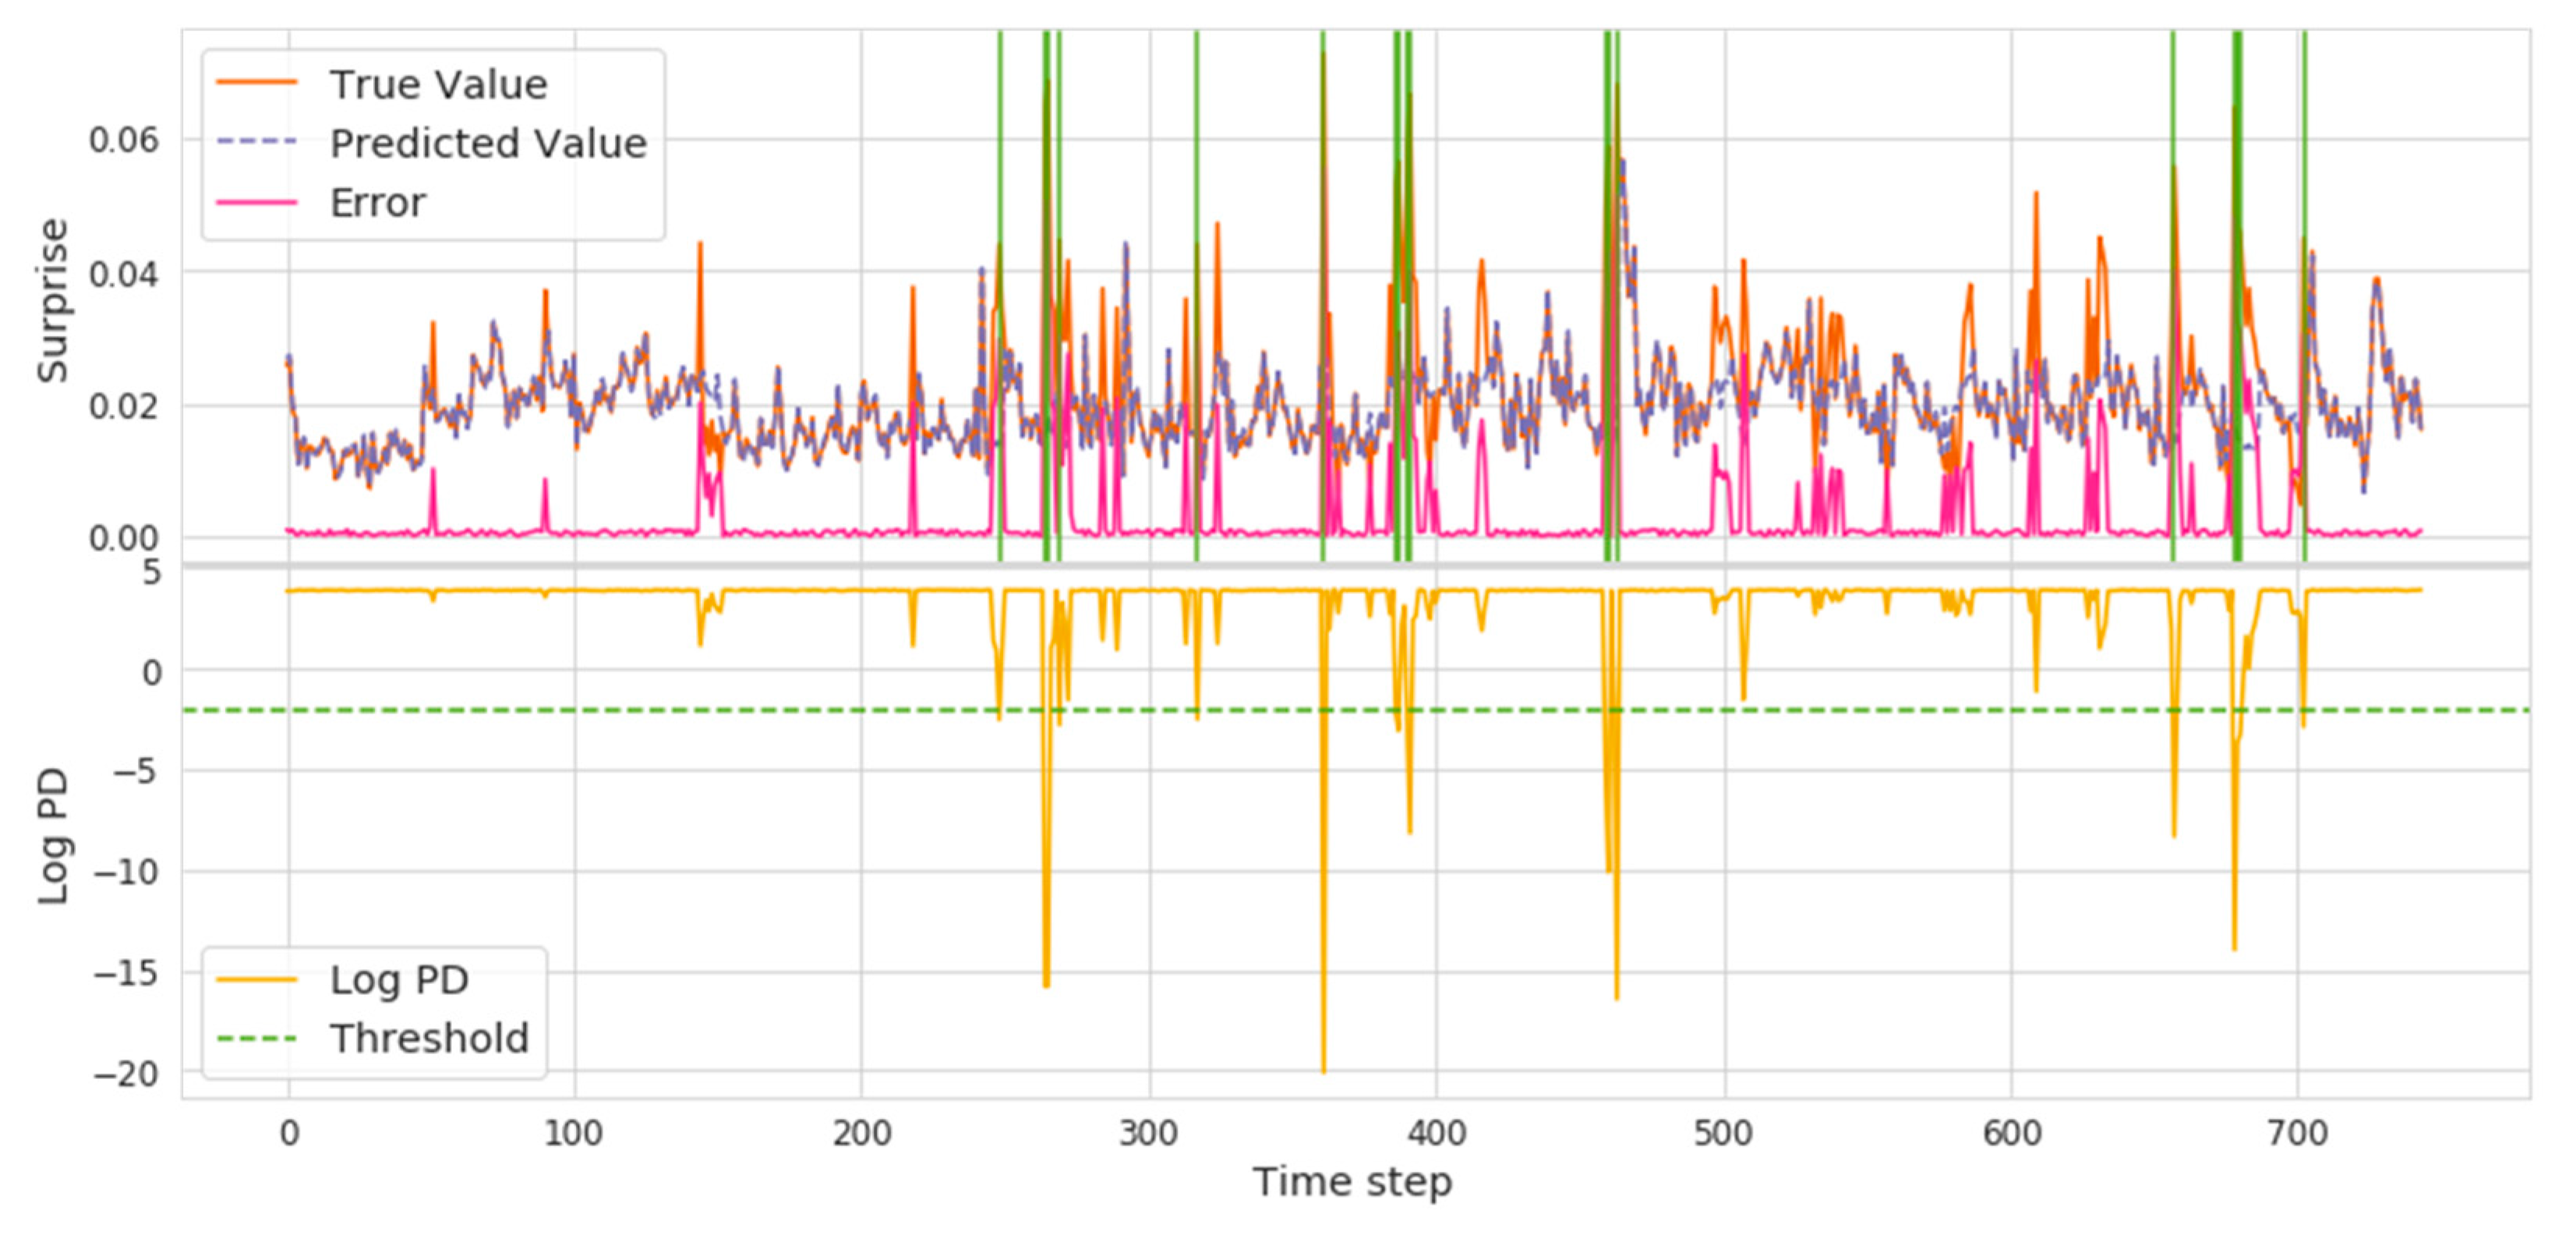
3.3.1. Abrupt Time Point Perception
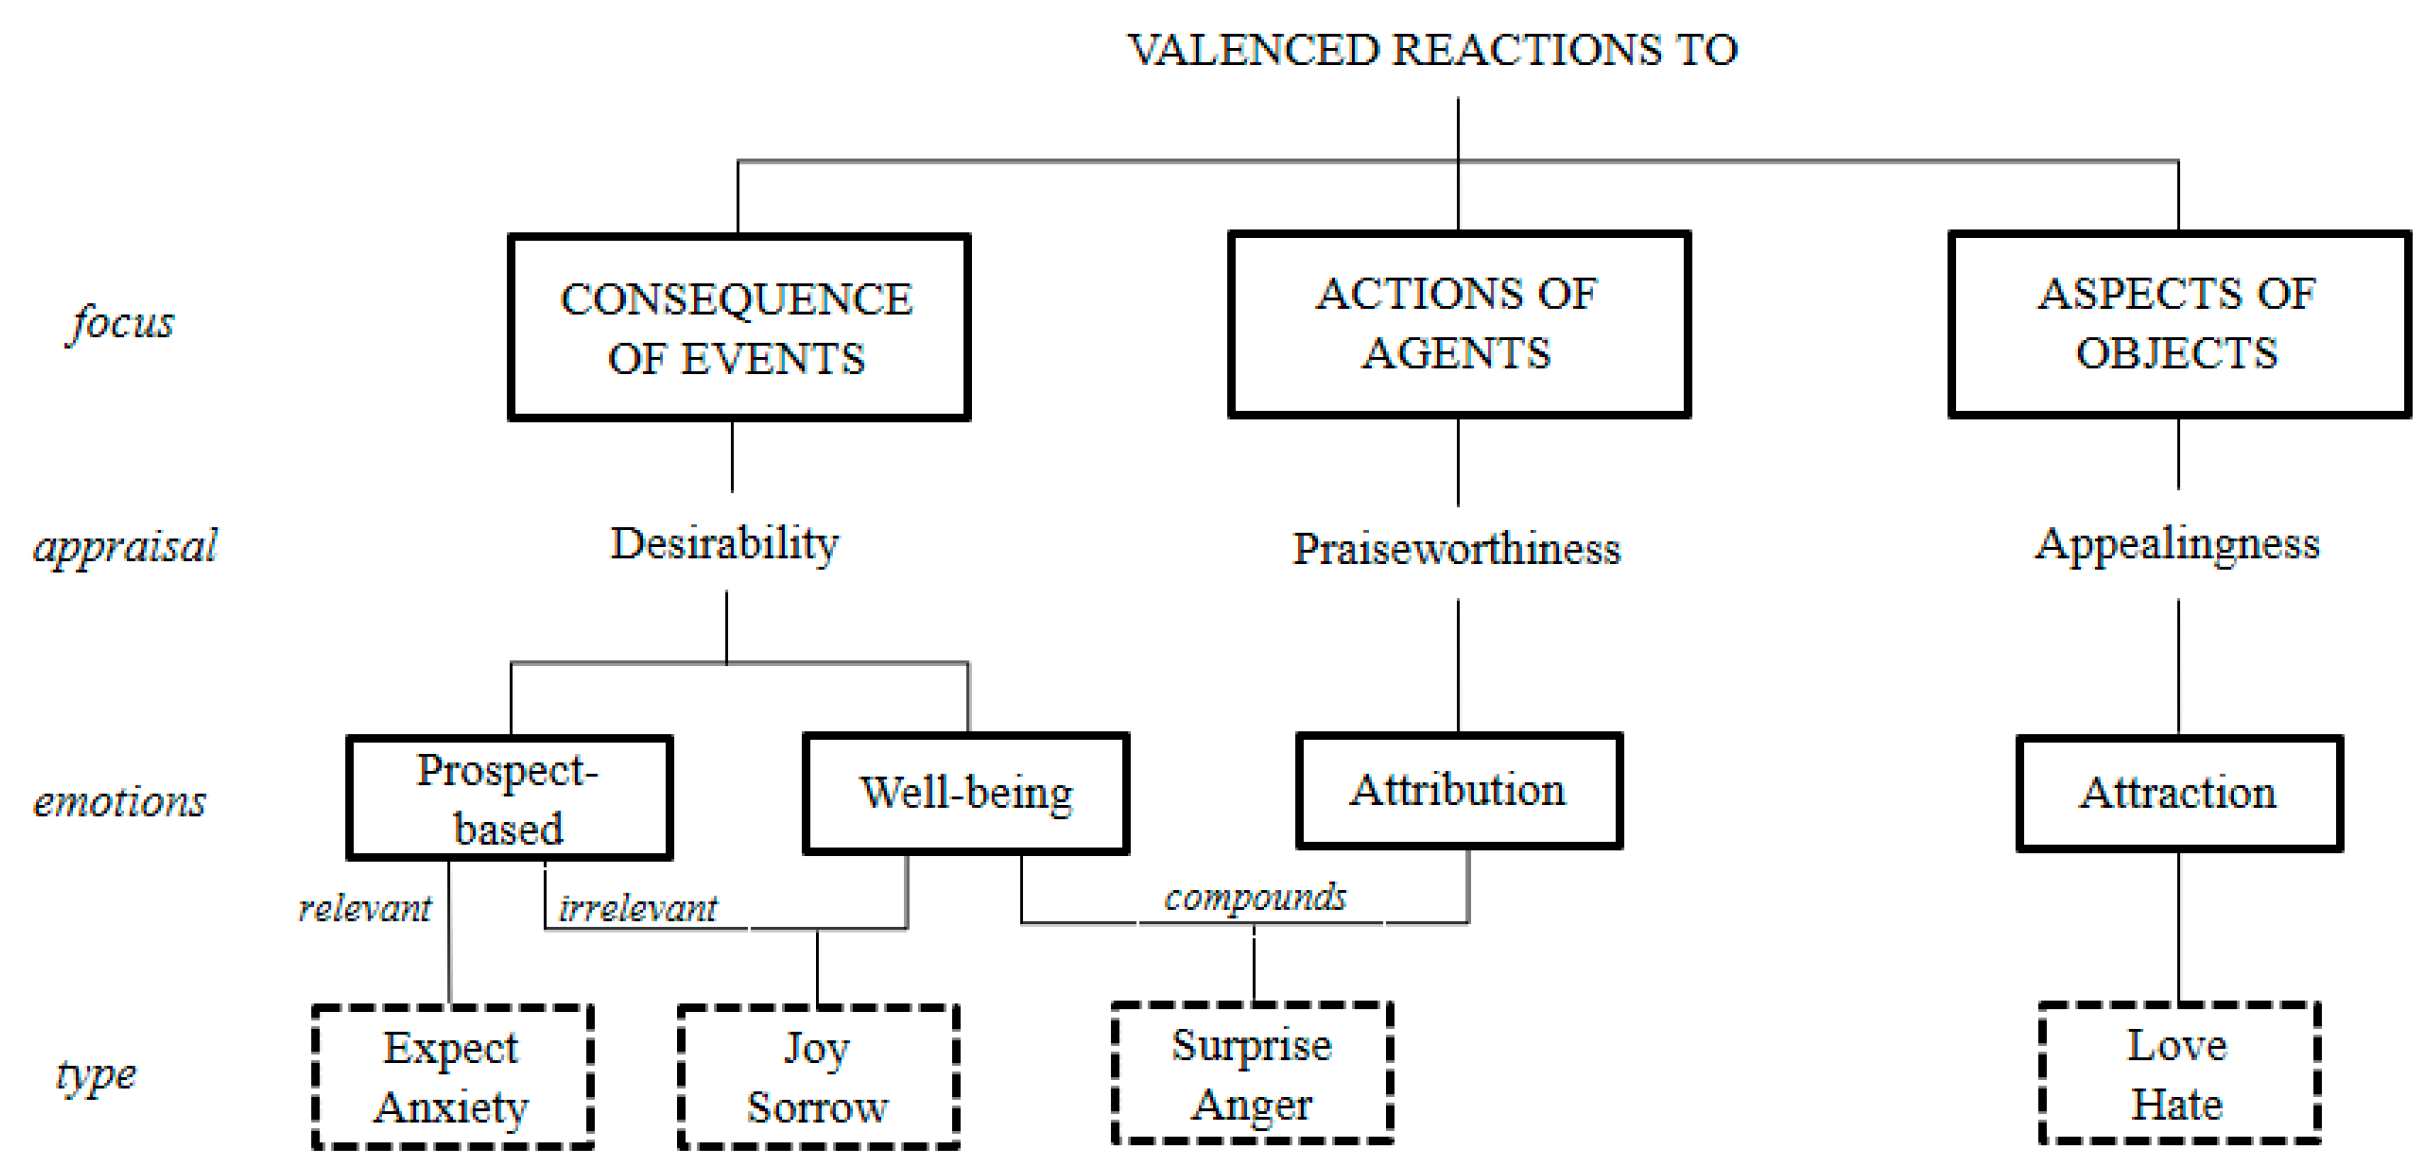
3.3.2. Triggered Causes Tracking
4. Experiment Results and Analyses
4.1. Detection Effect of Abrupt Time Points
4.2. Tracking Effect of Triggered Causes
4.3. Correlation between the Number of Infected People and Emotions Exhibited
5. Discussion
6. Conclusions
Author Contributions
Funding
Institutional Review Board Statement
Informed Consent Statement
Data Availability Statement
Conflicts of Interest
References
- Zhang, Y.; Sun, Y.; Kim, Y. The influence of individual differences on consumer’s selection of online sources for health information. Comput. Hum. Behav. 2017, 67, 303–312. [Google Scholar] [CrossRef]
- Jiménez, Ó.; Sánchez-Sánchez, L.C.; García-Montes, J.M. Psychological Impact of COVID-19 Confinement and Its Relationship with Meditation. Int. J. Environ. Res. Public Health 2020, 17, 6642. [Google Scholar] [CrossRef] [PubMed]
- Jungmann, S.M.; Witthft, M. Health anxiety, cyberchondria, and coping in the current COVID-19 pandemic: Which factors are related to coronavirus anxiety? J. Anxiety Disord. 2020, 73, 102239. [Google Scholar] [CrossRef]
- Garfin, D.R.; Silver, R.C.; Holman, E.A. The novel coronavirus (COVID-2019) outbreak: Amplification of public health consequences by media exposure. Health Psychol. 2020, 39, 355–357. [Google Scholar] [CrossRef]
- Jelodar, H.; Wang, Y.; Orji, R.; Huang, H. Deep Sentiment Classification and Topic Discovery on Novel Coronavirus or COVID-19 Online Discussions: NLP Using LSTM Recurrent Neural Network Approach. IEEE J. Biomed. Health Inform. 2020, 24, 2733–2742. [Google Scholar] [CrossRef]
- Yang, Z.; Ouyang, T.; Xiangling, F.U.; Peng, X. A decision-making algorithm for online shopping using deep-learning–based opinion pairs mining and q-rung orthopair fuzzy interaction Heronian mean operators. Int. J. Intell. Syst. 2020, 35, 783–825. [Google Scholar] [CrossRef]
- Lerner, J.S.; Tiedens, L.Z. Portrait of the angry decision maker: How appraisal tendencies shape anger’s influence on cognition. J. Behav. Decis. Mak. 2010, 19, 115–137. [Google Scholar] [CrossRef]
- Hridoy, S.A.A.; Ekram, M.T.; Islam, M.S.; Ahmed, F.; Rahman, R.M. Localized twitter opinion mining using sentiment analysis. Decis. Anal. 2015, 2, 8. [Google Scholar] [CrossRef] [Green Version]
- Chung, W.; Zeng, D. Dissecting emotion and user influence in social media communities: An interaction modeling approach. Inf. Manag. 2020, 57, 103108. [Google Scholar] [CrossRef]
- A New ANEW: Evaluation of a Word List for Sentiment Analysis in Microblogs. Available online: https://arxiv.org/abs/1103.2903 (accessed on 20 September 2017).
- Peng, H.; Cambria, E.; Hussain, A. A Review of Sentiment Analysis Research in Chinese Language. Cogn. Comput. 2017, 9, 423–435. [Google Scholar] [CrossRef]
- Thelwall, M. TensiStrength: Stress and relaxation magnitude detection for social media texts. Inf. Process. Manag. 2016, 53, 106–121. [Google Scholar] [CrossRef] [Green Version]
- Lin, H.; Jia, J.; Qiu, J.; Zhang, Y.; Shen, G.; Xie, L.; Jie, T.; Ling, F.; Chua, T.S. Detecting Stress Based on Social Interactions in Social Networks. IEEE Trans. Knowl. Data Eng. 2017, 29, 1820–1833. [Google Scholar] [CrossRef]
- Xu, H.; Kai, Z.; Qiu, L.; Hu, C. Expanding Chinese sentiment dictionaries from large scale unlabeled corpus. In Proceedings of the 24th Pacific Asia Conference on Language, Information and Computation, Sendai, Japan, 4–7 November 2010; pp. 301–310. [Google Scholar]
- Fu, X.; Ouyang, T.; Chen, J.; Luo, X. Listening to the investors: A novel framework for online lending default prediction using deep learning neural networks. Inf. Process. Manag. 2020, 57, 102236. [Google Scholar] [CrossRef]
- Quan, C.; Ren, F. Construction of a blog emotion corpus for Chinese emotional expression analysis. In Proceedings of the 2009 Conference on Empirical Methods in Natural Language Processing, Singapore, 6–7 August 2009; pp. 1446–1454. [Google Scholar]
- Qi, J.; Fu, X.; Ge, Z. Subjective Well-being Measurement based on Chinese Grassroots Blog Text Sentiment Analysis. Inf. Manag. 2015, 52, 859–869. [Google Scholar] [CrossRef]
- Asmundson, G.J.G.; Taylor, S. How health anxiety influences responses to viral outbreaks like COVID-19: What all decision-makers, health authorities, and health care professionals need to know. J. Anxiety Disord. 2020, 71, 102211. [Google Scholar] [CrossRef]
- Li, X.; Feng, S.; Wang, D.; Zhang, Y. Context-aware emotion cause analysis with multi-attention-based neural network. Knowl. -Based Syst. 2019, 174, 205–218. [Google Scholar] [CrossRef]
- Ortony, A.; Clore, G.L.; Collins, A. The Cognitive Structure of Emotions. Contemp. Sociol. 1988, 18, 2147–2153. [Google Scholar]
- Gao, K.; Xu, H.; Wang, J. A rule-based approach to emotion cause detection for Chinese micro-blogs. Expert Syst. Appl. 2015, 42, 4517–4528. [Google Scholar] [CrossRef]
- Tan, S.; Yang, L.; Sun, H.; Guan, Z.; He, X. Interpreting the Public Sentiment Variations on Twitter. IEEE Trans. Knowl. Data Eng. 2014, 26, 1158–1170. [Google Scholar]
- Sun, X.; Zhang, C.; Li, G.; Sun, D.; Ren, F.; Zomaya, A.; Ranjan, R. Detecting Users’ Anomalous Emotion Using Social Media for Business Intelligence. J. Comput. Sci. 2018, 25, 193–200. [Google Scholar] [CrossRef]
- Giachanou, A.; Mele, I.; Crestani, F. Explaining Sentiment Spikes in Twitter. In Proceedings of the 25th ACM International Conference on Information and Knowledge Management, CIKM 2016, Indianapolis, IN, USA, 24–28 October 2016. [Google Scholar]
- Sheridan, D.P.; Decker, H.K.; Kloumann, I.M.; Bliss, C.A.; Danforth, C.M.; Johan, B. Temporal patterns of happiness and information in a global social network: Hedonometrics and Twitter. PLoS ONE 2011, 6, e26752. [Google Scholar]
- LSTM-Based Encoder-Decoder for Multi-Sensor Anomaly Detection. Available online: https://arxiv.org/abs/1607.00148 (accessed on 5 May 2020).
- Kullback, S.; Leibler, R.A. On information and sufficiency. Ann. Math. Stat. 1951, 22, 79–86. [Google Scholar] [CrossRef]
- Jiang, S.; Qi, J. Cognitive Detection of Multiple Discrete Emotions from Chinese Online Reviews. In Proceedings of the 2016 IEEE 1st International Conference on Data Science in Cyberspace, DSC 2016, Changsha, China, 27 February 2017; pp. 137–142. [Google Scholar]
- Frijda, N.H. Emotion, Cognitive Structure, and Action Tendency. Cogn. Emot. 1987, 1, 115–143. [Google Scholar] [CrossRef]
- Roseman, I.J. Cognitive determinants of emotion: A structural theory. Rev. Personal. Soc. Psychol. 1984, 5, 11–36. [Google Scholar]
- Richins, M.L. Measuring Emotions in the Consumption Experience. J. Consum. Res. 1997, 24, 127–146. [Google Scholar] [CrossRef]


| Original | Expansion | ≥0.1 | ≥0.2 | ≥0.3 | ≥0.4 | ≥0.5 | ≥0.6 | ≥0.7 | ≥0.8 | ≥0.9 | |
|---|---|---|---|---|---|---|---|---|---|---|---|
| Count in Lexicon | 17,530 | 45,096 | 29,681 | 24,044 | 20,601 | 16,892 | 13,950 | 9052 | 4541 | 2002 | 458 |
| Coverage in Corpus | 0.1485 | 0.7484 | 0.6531 | 0.5186 | 0.4825 | 0.4129 | 0.3371 | 0.2431 | 0.1645 | 0.1292 | 0.0835 |
| Count in Domain | 24 | 1837 | 1625 | 1164 | 1044 | 833 | 600 | 432 | 186 | 75 | 19 |
| Coverage in Domain | 0.0097 | 0.7482 | 0.6619 | 0.4741 | 0.4252 | 0.3393 | 0.2443 | 0.1759 | 0.0757 | 0.0305 | 0.0077 |
| Topics | Emotional Arousal Path |
|---|---|
| Pandemic news and data report | Aspects of Objects |
| Medical care was on the front line | Actions of Agents |
| Nation- and local-issued policy measures | Consequence of Events |
| Public protection initiative | Aspects of Objects |
| Scientific breakthroughs and knowledge dissemination | Consequence of Events |
| Peripheral symptoms cause inner anxiety | Actions of Agents |
| Be objective in daily life | Aspects of Objects |
| Predictive Abrupt Points | True Value | Accuracy | Recall | ||
|---|---|---|---|---|---|
| Abnormal | Normal | ||||
| −1.0 | 24 | 13 | 11 | 0.541 | 0.812 |
| −1.5 | 17 | 12 | 5 | 0.705 | 0.75 |
| −2.0 | 13 | 10 | 3 | 0.769 | 0.625 |
| −2.5 | 9 | 7 | 2 | 0.777 | 0.437 |
| −3.0 | 4 | 4 | 0 | 1.0 | 0.25 |
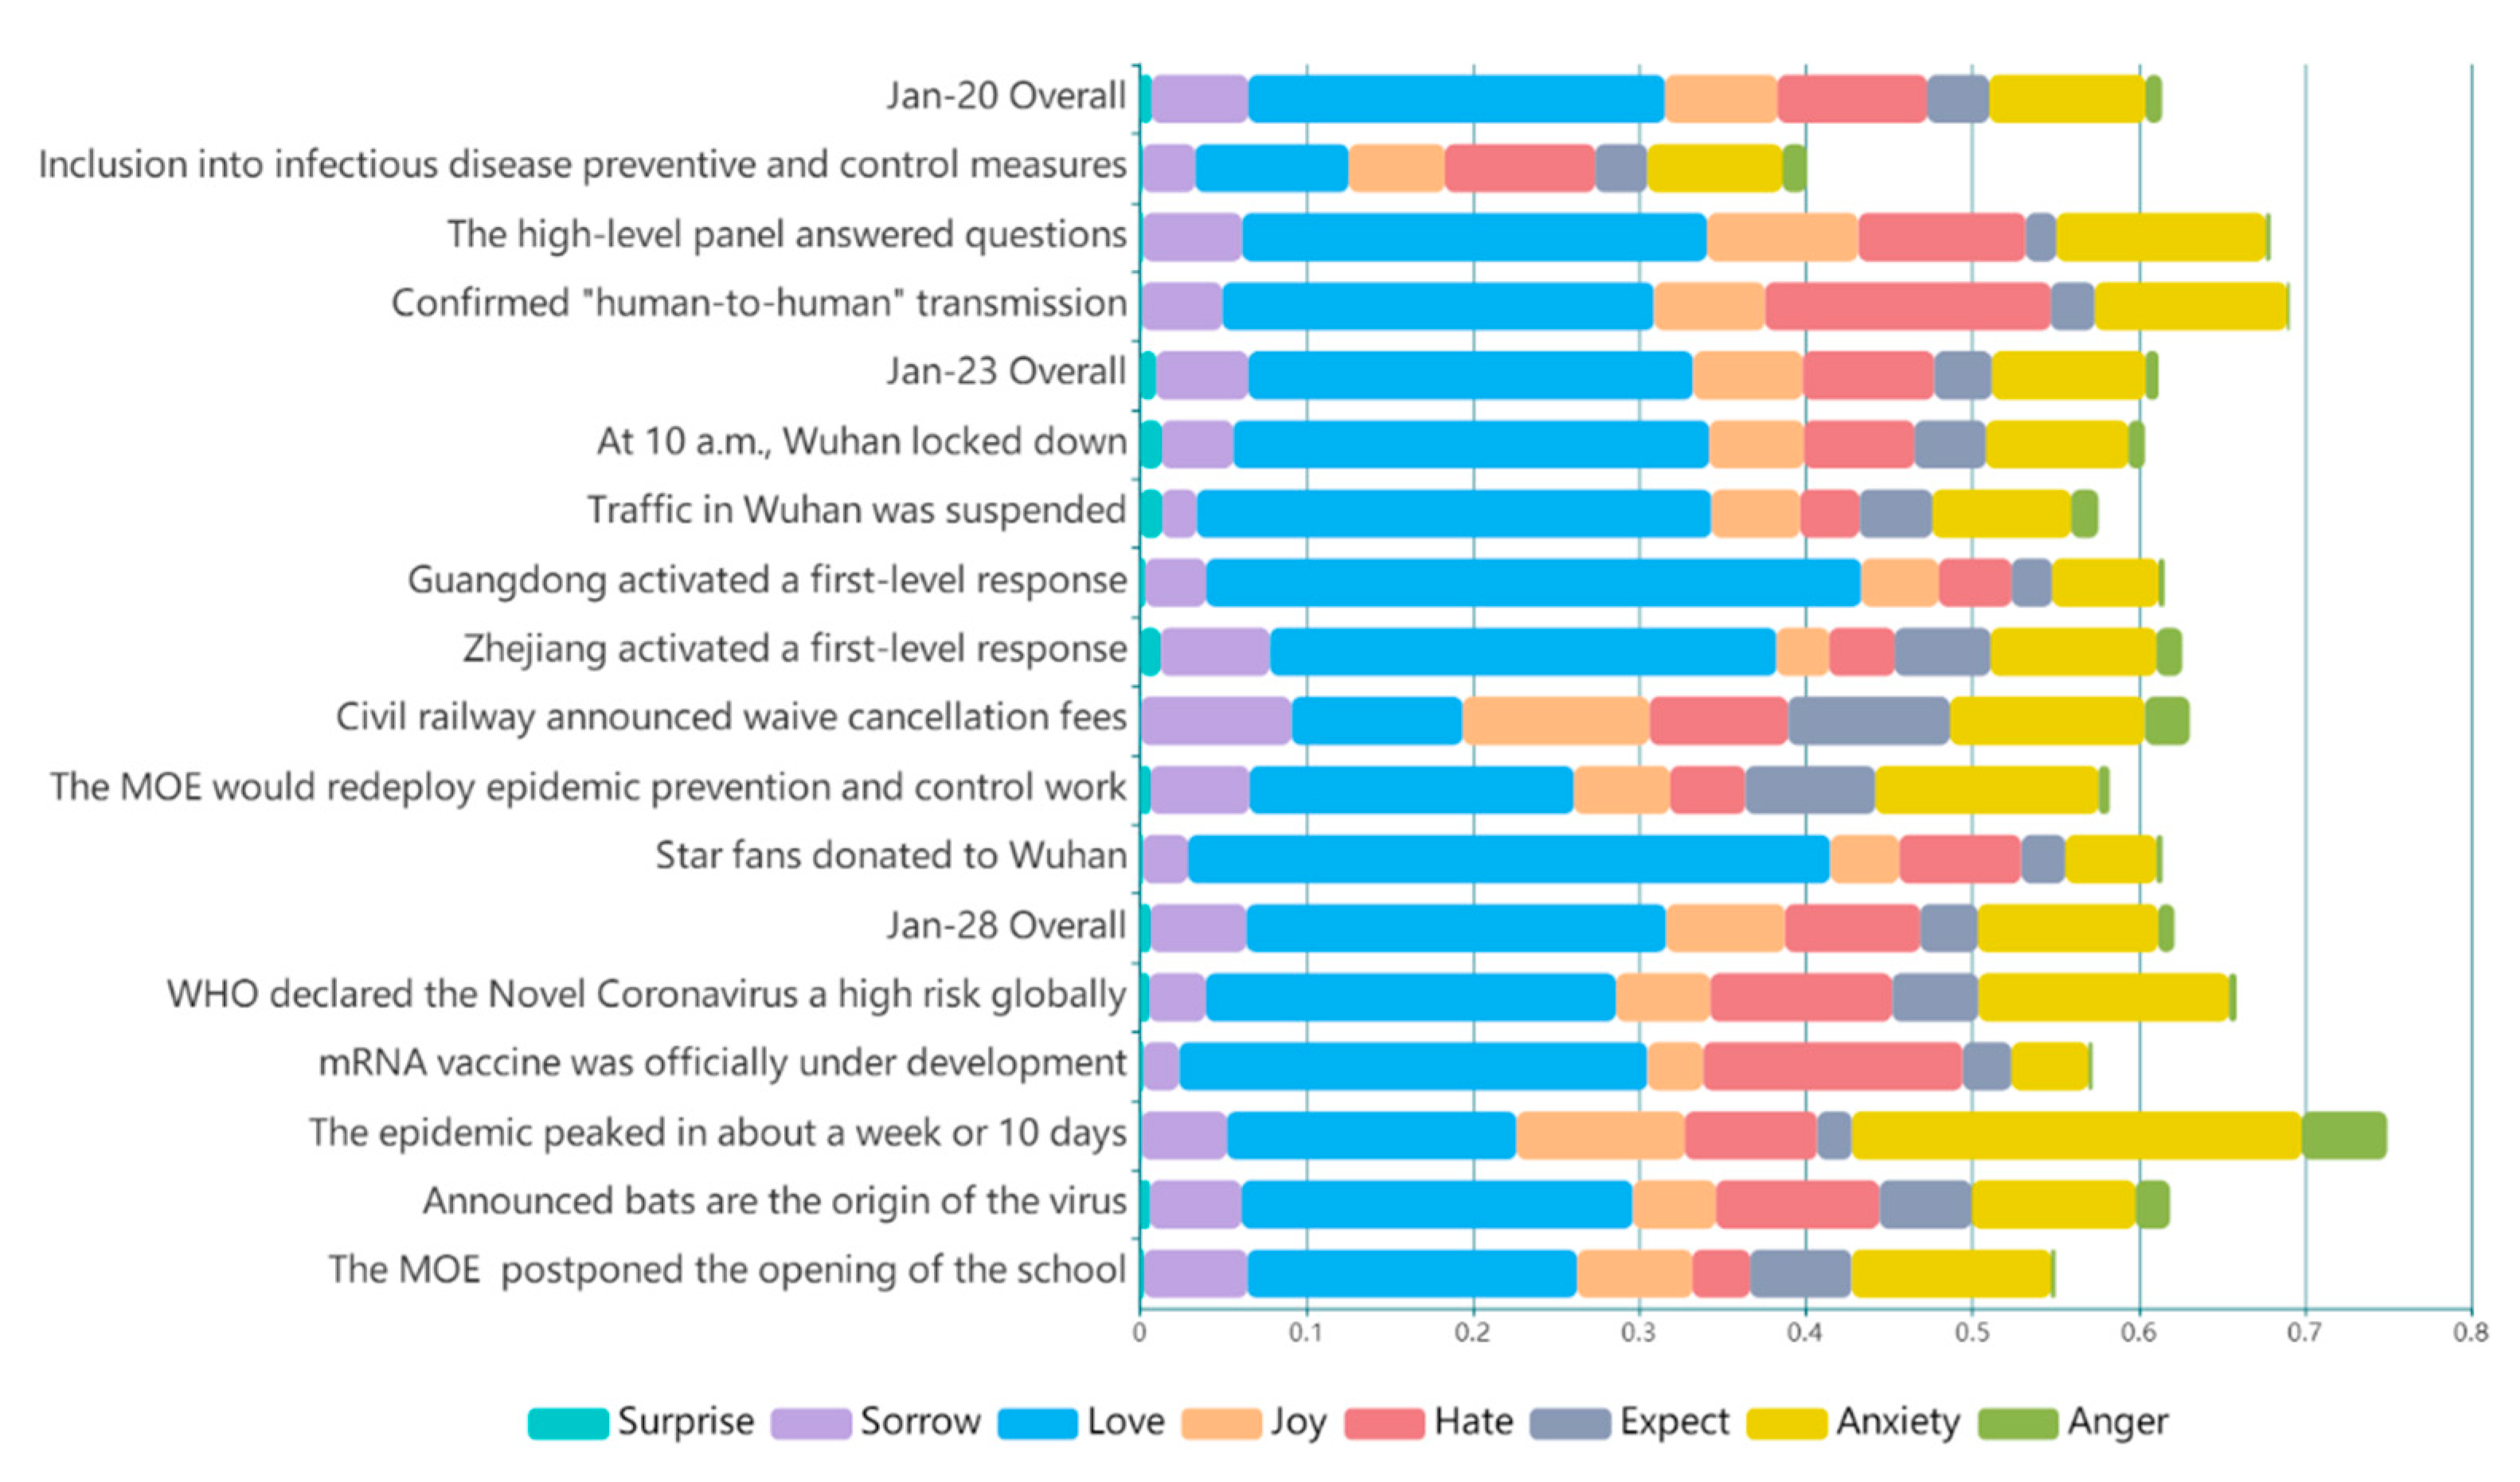
| Time Point | Emotion Type | Public Opinion Events | Topics | Path | KL Value |
|---|---|---|---|---|---|
| 20-Jan | surprise sorrow joy hate anxiety | Inclusion into class B infectious disease and class A preventive and control measures | Nation and local issued policy measures | Consequence of Events | 0.0982 |
| The high-level panel of the National Health Commission answered questions | Epidemic news and data report | Aspects of Objects | 0.0375 | ||
| National Health Commission confirmed “human-to-human” transmission | Scientific breakthroughs and dissemination | Consequence of Events | 0.0674 | ||
| 23-Jan | anger joy expect hate | At 10 a.m., Wuhan locked down | Nation and local issued policy measures | Consequence of Events | 0.0098 |
| Traffic in Wuhan was suspended | Nation and local issued policy measures | Consequence of Events | 0.0786 | ||
| Guangdong activated a first-level response to a major public health emergency | The public took the initiative to protection | Aspects of Objects | 0.0907 | ||
| Zhejiang activated a first-level response to a major public health emergency | The public took the initiative to protection | Aspects of Objects | 0.0667 | ||
| Civil railway announced waive cancellation fees | State and local issued policy measures | Consequence of Events | 0.2835 | ||
| The Ministry of Education would redeploy epidemic prevention and control work | State and local issued policy measures | Consequence of Events | 0.0747 | ||
| Star fans donated to Wuhan | Medical care was on the front line | Actions of Agents | 0.0992 | ||
| 28-Jan | surprise hate expect anxiety | WHO declared the Novel Coronavirus a high risk globally | Epidemic news and data report | Aspects of Objects | 0.0354 |
| Novel coronavirus mRNA vaccine was officially under development | State and local issued policy measures | Consequence of Events | 0.1568 | ||
| The epidemic peaked in about a week or 10 days | Scientific breakthroughs and dissemination | Consequence of Events | 0.1736 | ||
| The Chinese Academy of Medical Sciences announced that bats are the origin of the virus | Scientific breakthroughs and dissemination | Consequence of Events | 0.0245 | ||
| The Ministry of Education postponed the opening of the school | State and local issued policy measures | Consequence of Events | 0.0651 |
| Abrupt Time Point | Events in Media | Events in Dataset | Topics | Event MAP | Topic MAP |
|---|---|---|---|---|---|
| 20-Jan | 6 | 3 | 3 | 0.333 | 0.667 |
| 23-Jan | 9 | 7 | 3 | 0.429 | 1 |
| 28-Jan | 18 | 5 | 3 | 0.6 | 0.667 |
Publisher’s Note: MDPI stays neutral with regard to jurisdictional claims in published maps and institutional affiliations. |
© 2021 by the authors. Licensee MDPI, Basel, Switzerland. This article is an open access article distributed under the terms and conditions of the Creative Commons Attribution (CC BY) license (https://creativecommons.org/licenses/by/4.0/).
Share and Cite
Jiang, S.; Zhang, H.; Qi, J.; Fang, B.; Xu, T. Perceiving Social-Emotional Volatility and Triggered Causes of COVID-19. Int. J. Environ. Res. Public Health 2021, 18, 4591. https://0-doi-org.brum.beds.ac.uk/10.3390/ijerph18094591
Jiang S, Zhang H, Qi J, Fang B, Xu T. Perceiving Social-Emotional Volatility and Triggered Causes of COVID-19. International Journal of Environmental Research and Public Health. 2021; 18(9):4591. https://0-doi-org.brum.beds.ac.uk/10.3390/ijerph18094591
Chicago/Turabian StyleJiang, Si, Hongwei Zhang, Jiayin Qi, Binxing Fang, and Tingliang Xu. 2021. "Perceiving Social-Emotional Volatility and Triggered Causes of COVID-19" International Journal of Environmental Research and Public Health 18, no. 9: 4591. https://0-doi-org.brum.beds.ac.uk/10.3390/ijerph18094591