
Will Next Match Location Influence External and Internal Training Load of a Top-Class Elite Professional European Soccer Team?

 ,
,  ,
,  , ,
, ,  and
and
Abstract
:1. Introduction
2. Materials and Methods
2.1. Experimental Approach to the Problem
2.2. Participants
2.3. External Training Load—Training Data
2.4. Internal Training Load—Training Data
2.5. Statistical Analysis
3. Results
3.1. Comparison of Match Day Minus Preceding Home or Away Matches
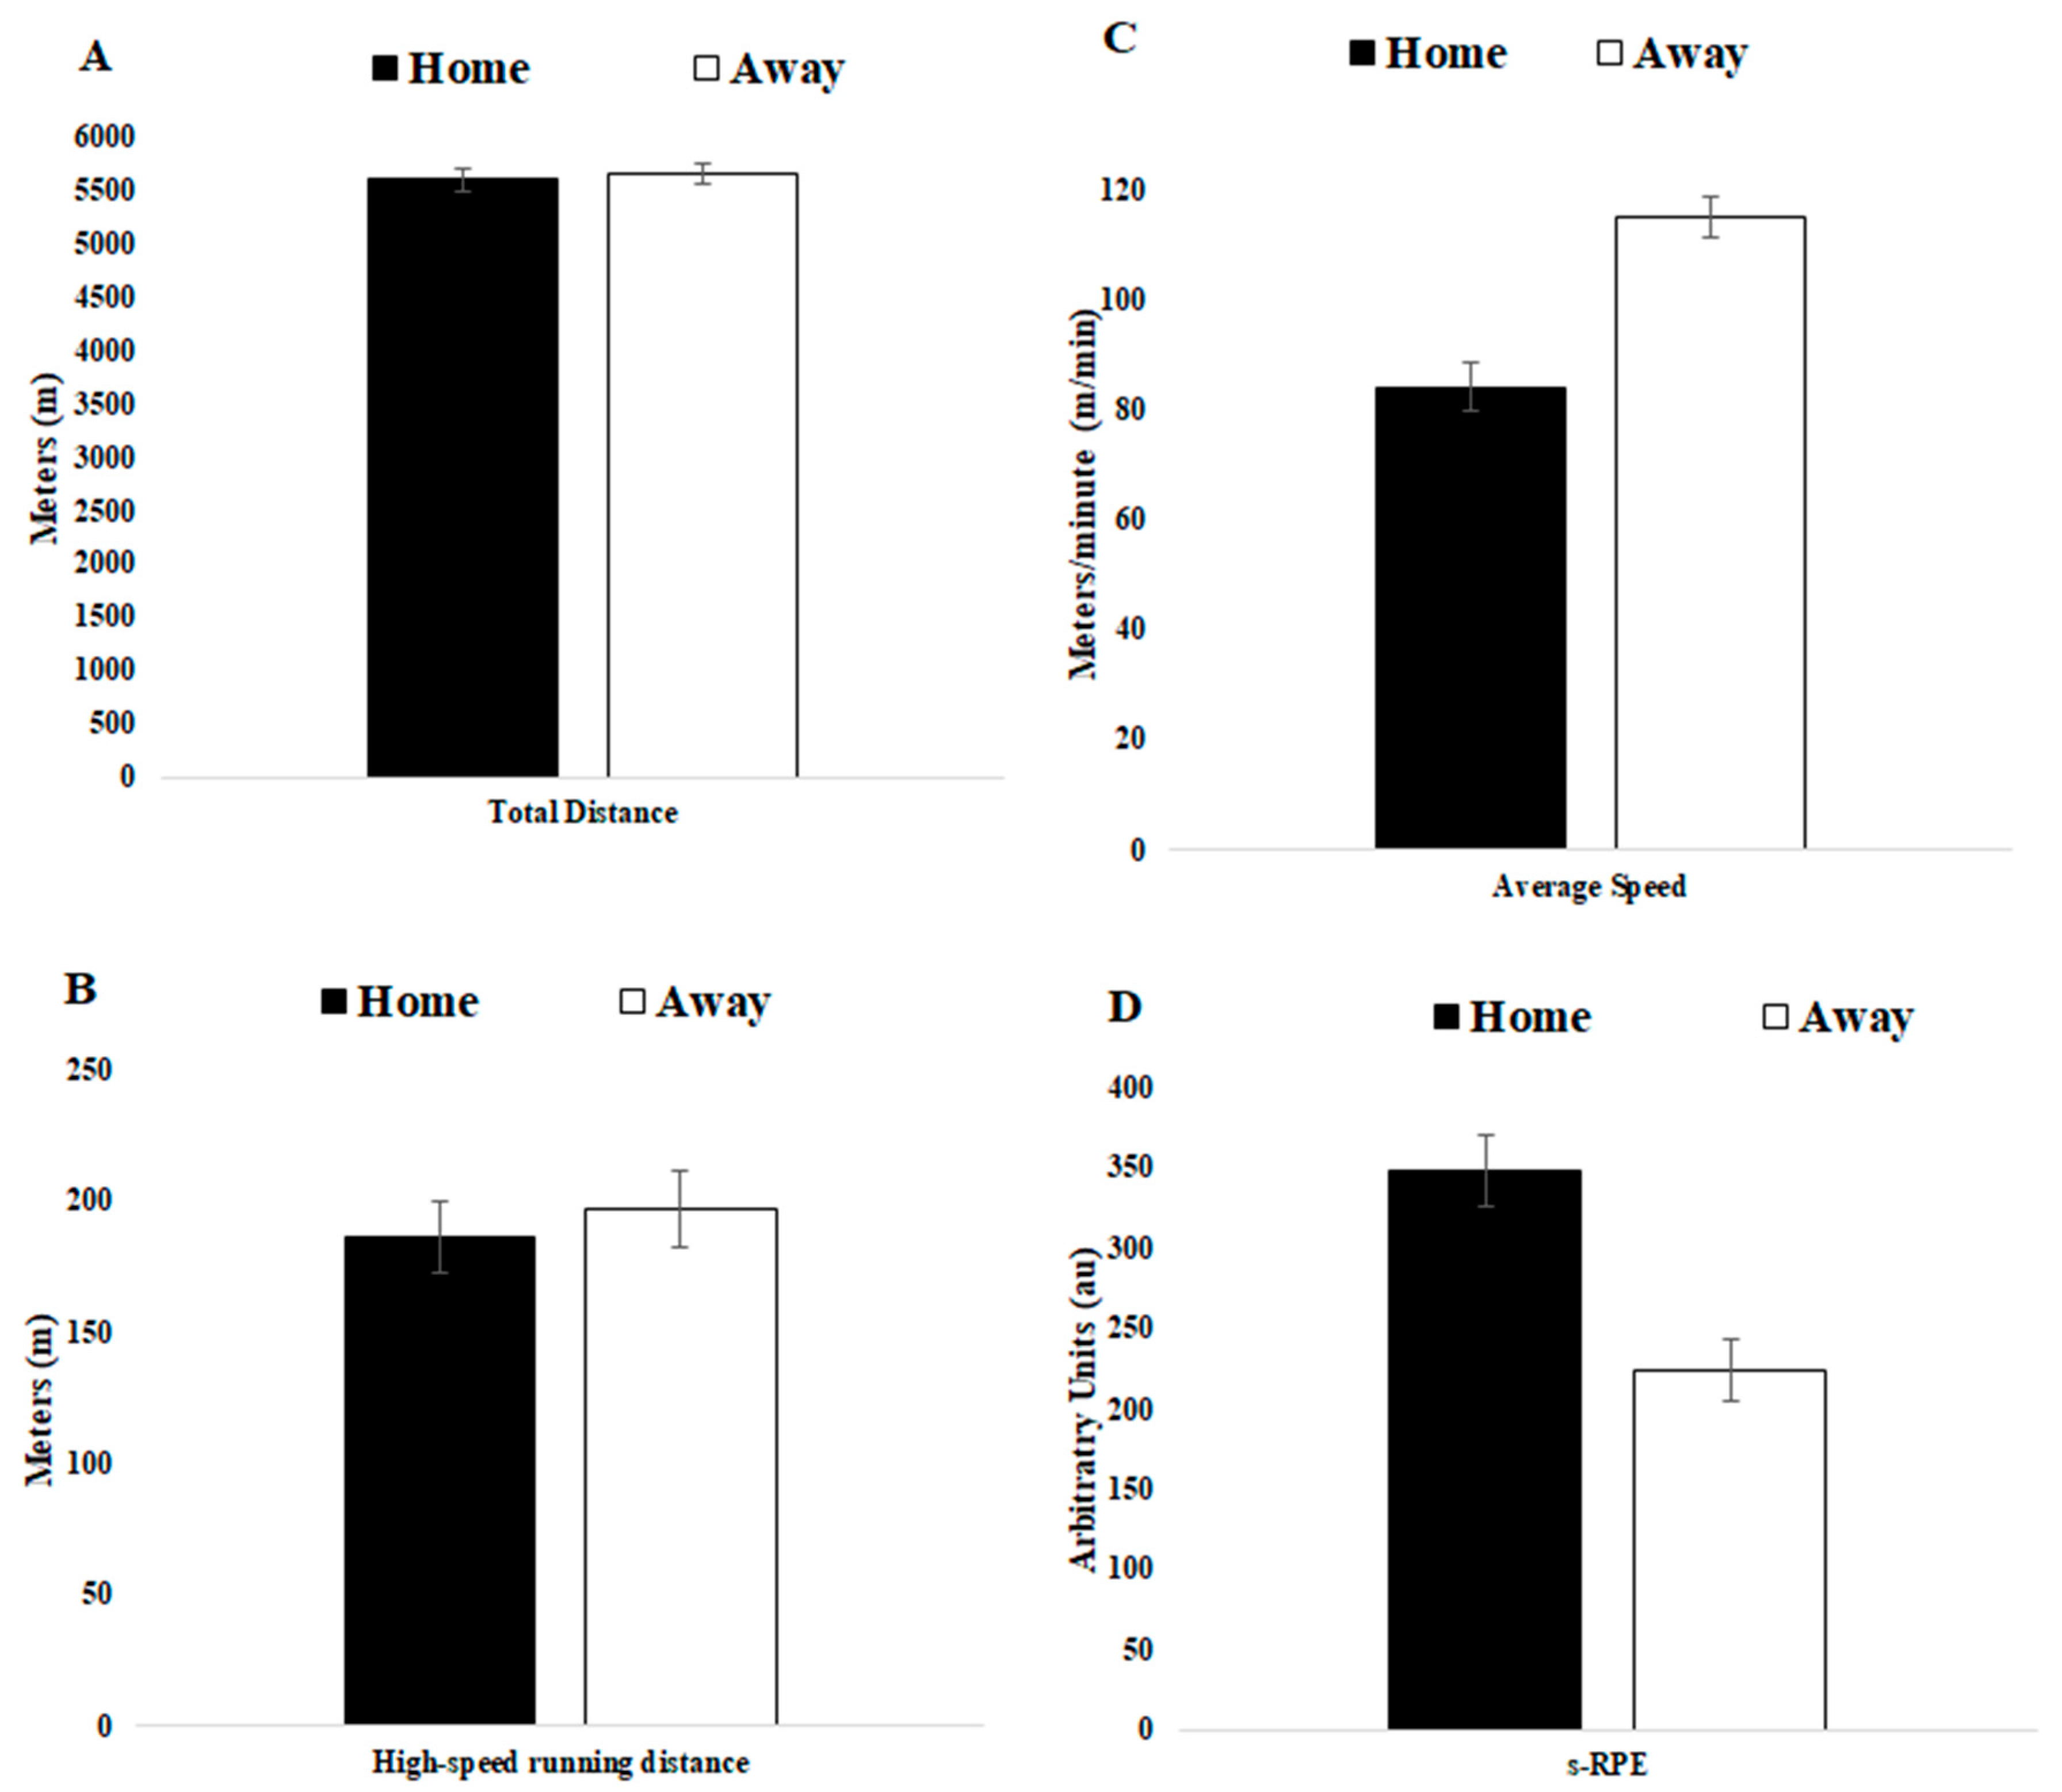
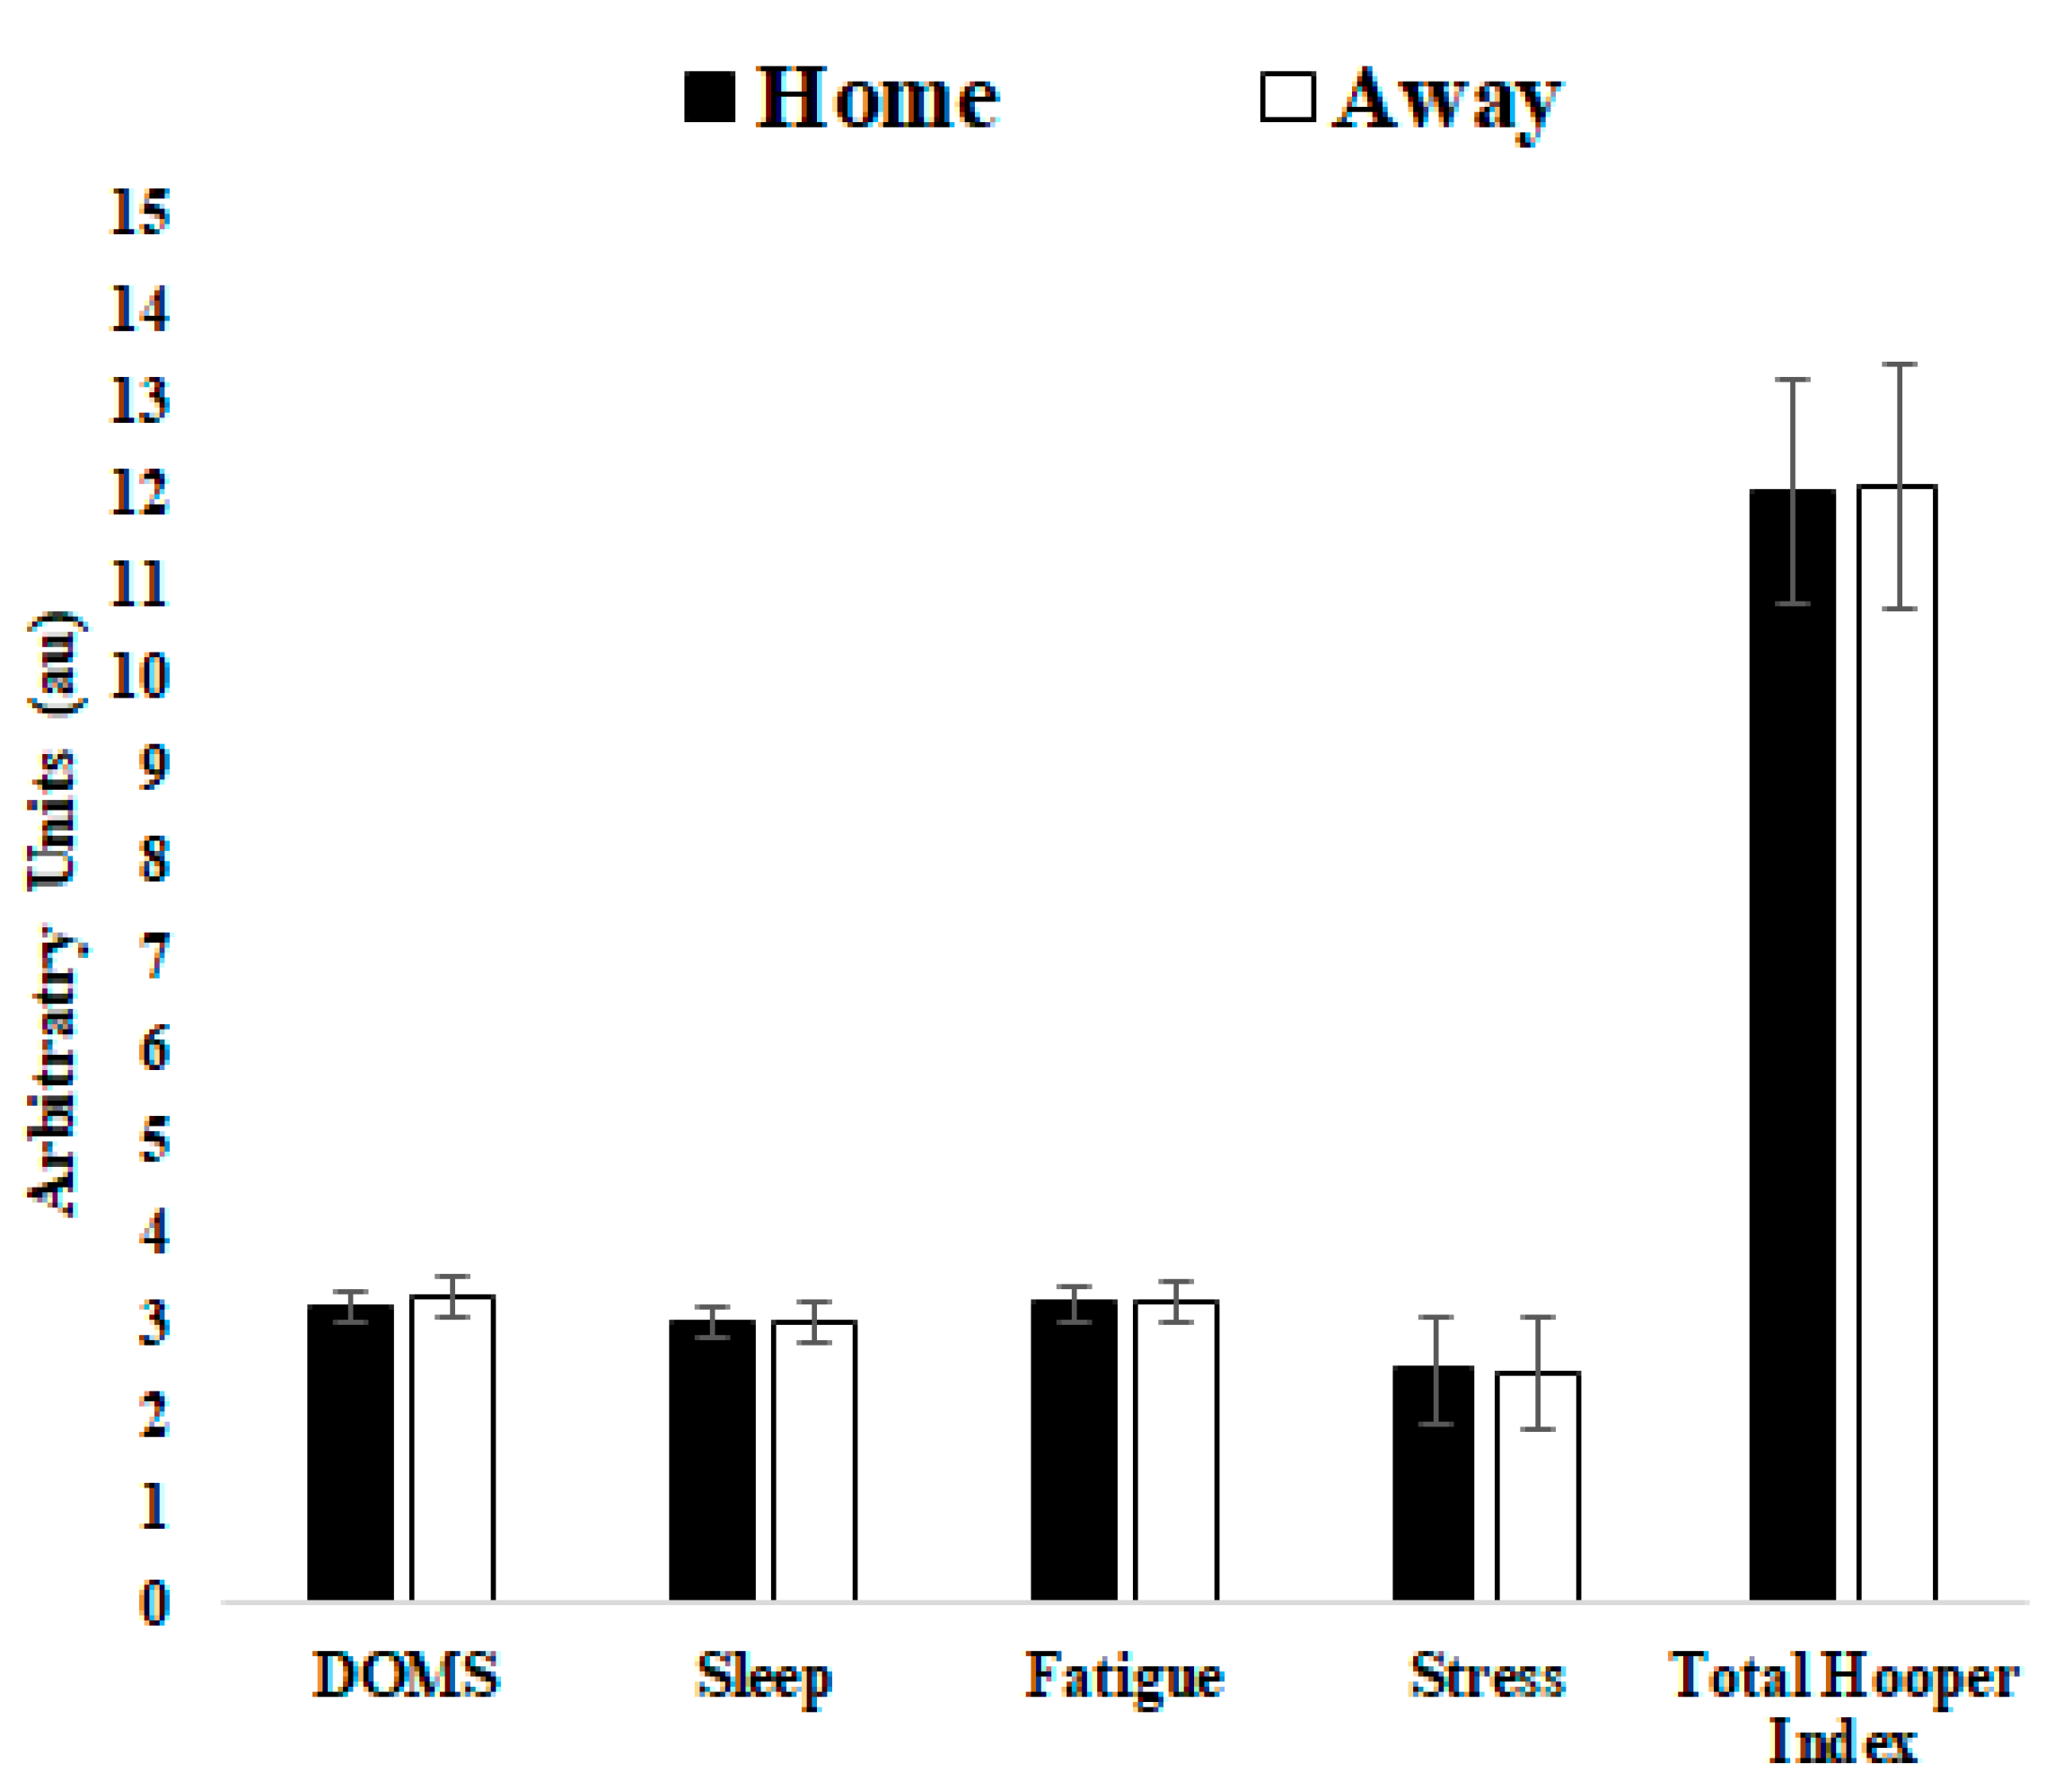
3.2. Comparison of Match Location
4. Discussion
4.1. Comparison of Match Day Minus Preceding Home or Away Matches
4.2. Comparison of Match Location
5. Conclusions
Author Contributions
Funding
Institutional Review Board Statement
Informed Consent Statement
Data Availability Statement
Acknowledgments
Conflicts of Interest
References
- Gómez, M.A.; Gómez-Lopez, M.; Lago, C.; Sampaio, J. Effects of game location and final outcome on game-related statistics in each zone of the pitch in professional football. Eur. J. Sport Sci. 2012, 12, 393–398. [Google Scholar] [CrossRef]
- Aquino, R.; Carling, C.; Vieira, L.; Martins, G.; Jabor, G.; Machado, J.; Santiago, P.; Garganta, J.; Puggina, E. Influence of situational variables, team formation, and playing position on match running performance and social network analysis of Brazilian professional soccer players. J. Strength Cond. Res. 2018, 34, 808–817. [Google Scholar] [CrossRef] [PubMed]
- Aquino, R.; Martins, G.H.M.; Vieira, L.H.P.; Menezes, R.P. Influence of match location, quality of opponents, and match status on movement patterns in Brazilian professional football players. J. Strength Cond. Res. 2017, 31, 2155–2161. [Google Scholar] [CrossRef] [PubMed]
- Lago, C. The influence of match location, quality of opposition, and match status on possession strategies in professional association football. J. Sports Sci. 2009, 27, 1463–1469. [Google Scholar] [CrossRef] [PubMed]
- Lago-Peñas, C. The role of situational variables in analysing physical performance in soccer. J. Hum. Kinetics. 2012, 35, 89–95. [Google Scholar] [CrossRef] [PubMed]
- Lago-Peñas, C.; Dellal, A. Ball possession strategies in elite soccer according to the evolution of the match-score: The influence of situational variables. J. Hum. Kinetics. 2010, 25, 93–100. [Google Scholar] [CrossRef]
- Taylor, J.B.; Mellalieu, S.D.; James, N.; Shearer, D.A. The influence of match location, quality of opposition, and match status on technical performance in professional association football. J. Sports Sci. 2008, 26, 885–895. [Google Scholar] [CrossRef] [PubMed]
- Tucker, W.; Mellalieu, D.S.; James, N.; Taylor, B.J. Game location effects in professional soccer: A case study. Int. J. Perform. Anal. Sport. 2005, 5, 23–35. [Google Scholar] [CrossRef]
- Aquino, R.; Manechini, J.P.V.; Bedo, B.L.S.; Puggina, E.F.; Garganta, J. Effects of match situational variables on possession: The case of England Premier League season 2015/16. Motriz 2017, 23, e101794. [Google Scholar] [CrossRef] [Green Version]
- Polman, R.; Nicholls, A.R.; Cohen, J.; Borkoles, E. The influence of game location and outcome on behaviour and mood states among professional rugby league players. J. Sports Sci. 2007, 25, 1491–1500. [Google Scholar] [CrossRef]
- Abbott, W.; Brownlee, T.E.; Harper, L.D.; Naughton, R.J.; Clifford, T. The independent effects of match location, match result and the quality of opposition on subjective wellbeing in under 23 soccer players: A case study. Res. Sports Med. 2018, 26, 262–275. [Google Scholar] [CrossRef] [PubMed]
- Nobari, H.; Polito, L.F.T.; Clemente, F.M.; Pérez-Gómez, J.; Ahmadi, M.; Garcia-Gordillo, M.A.; Silva, A.F.; Adsuar, J.C. Relationships Between Training Workload Parameters with Variations in Anaerobic Power and Change of Direction Status in Elite Youth Soccer Players. Int. J. Environ. Res. Public Health. 2020, 17, 7934. [Google Scholar] [CrossRef] [PubMed]
- Casamichana, D.; Castellano, J.; Calleja-Gonzalez, J.; San Román, J.; Castagna, C. Relationship between indicators of training load in soccer players. J. Strength Cond. Res. 2013, 27, 369–374. [Google Scholar] [CrossRef]
- Foster, C. Monitoring training in athletes with reference to overtraining syndrome. Med. Sci. Sports Exerc. 1998, 30, 1164–1168. [Google Scholar] [CrossRef] [PubMed]
- Foster, C.; Florhaug, J.A.; Franklin, J.; Gottschall, L.; Hrovatin, L.A.; Parker, S.; Doleshal, P.; Dodge, C. A new approach to monitoring exercise training. J. Strength Cond. Res. 2001, 15, 109–115. [Google Scholar] [CrossRef] [PubMed]
- Foster, C.; Hector, L.L.; Welsh, R.; Schrager, M.; Green, M.A.; Snyder, A.C. Effects of specific versus cross-training on running performance. Eur. J. App. Physiol. Occup. Physiol. 1995, 70, 367–372. [Google Scholar] [CrossRef] [PubMed]
- Impellizzeri, F.M.; Rampinini, E.; Coutts, A.J.; Sassi, A.; Marcora, S.M. Use of RPE Based Training Load in Soccer. Med. Sci. Sports Exerc. 2004, 36, 1042–1047. [Google Scholar] [CrossRef] [PubMed]
- Hooper, S.L.; Mackinnon, L.T. Monitoring overtraining in athletes. Sports Med. 1995, 20, 321–327. [Google Scholar] [CrossRef]
- Nobari, H.; Aquino, R.; Clemente, F.M.; Khalafi, M.; Adsuar, J.C.; Pérez-Gómez, J. Description of acute and chronic load, training monotony and strain over a season and its relationships with well-being status: A study in elite under-16 soccer players. Physiol. Behav. 2020, 225, 113117. [Google Scholar] [CrossRef] [PubMed]
- Oliveira, R.; Brito, J.; Loureiro, N.; Padinha, V.; Ferreira, B.; Mendes, B. Does the distribution of the weekly training load account for the match results of elite professional soccer players? Physiol. Behav. 2020, 225, 113118. [Google Scholar] [CrossRef]
- Clemente, F.; Mendes, B.; Nikolaidis, P.; Calvete, F.; Carriço, S.; Owen, A. Internal training load and its longitudinal relationship with seasonal player wellness in elite professional soccer. Physiol. Behav. 2017, 179, 262–267. [Google Scholar] [CrossRef] [PubMed]
- Oliveira, R.; Brito, J.; Martins, A.; Mendes, B.; Marinho, D.; Ferraz, R.; Marques, M.C. In-season internal and external training load quantification of an elite European soccer team. PLoS ONE 2019, 14, e0209393. [Google Scholar] [CrossRef] [PubMed] [Green Version]
- Brito, J.; Hertzog, M.; Nassis, G.P. Do match-related contextual variables influence training load in highly trained soccer players? J. Strength Cond. Res. 2016, 2, 393–399. [Google Scholar] [CrossRef] [PubMed]
- Beato, M.; Devereux, G.; Stiff, A. Validity and reliability of global positioning system units (STATSports Viper) for measuring distance and peak speed in sports, J. Strength Cond. Res. 2018, 32, 2831–2837. [Google Scholar] [CrossRef] [PubMed]
- Borg, G. Perceived exertion as an indicator of somatic stress. Scand. J. Rehabil. Med. 1970, 2, 92–98. [Google Scholar]
- Hopkins, W.G. Spreadsheet for analysis of controlled trials with adjustment for a subject characteristics. Sport Sci. 2006, 10, 46–50. [Google Scholar]
- Malone, J.; Di Michele, R.; Morgans, R.; Burgess, D.; Morton, J.; Drust, B. Seasonal Training-Load Quantification in Elite English Premier League Soccer Players. Int. J. Sports Physiol. Perform. 2015, 10, 489–497. [Google Scholar] [CrossRef] [Green Version]
- Los Arcos, A.; Mendez-Villanueva, A.; Martínez-Santos, R. In-season training periodization of professional soccer players. Biol. Sport. 2017, 34, 149–155. [Google Scholar] [CrossRef]
- Owen, A.L.; Lago-Peñas, C.; Gómez, M.-A.; Mendes, B.; Dellal, A. Analysis of a training mesocycle and positional quantification in elite European soccer players. Int. J. Sports Sci. Coaching. 2017, 12, 665–676. [Google Scholar] [CrossRef]
- Haddad, M.; Chaouachi, A.; Wong, D.P.; Castagna, C.; Hambli, M.; Hue, O.; Chamari, K. Influence of fatigue, stress, muscle soreness and sleep on perceived exertion during submaximal effort. Physiol. Behav. 2013, 119, 185–189. [Google Scholar] [CrossRef]
- Malone, S.; Owen, A.; Newton, M.; Mendes, B.; Tiernan, L.; Hughes, B.; Collins, K. Wellbeing perception and the impact on external training output among elite soccer players. J. Sci. Med. Sport. 2018, 21, 29–34. [Google Scholar] [CrossRef] [PubMed]
- Nobari, H.; Oliveira, R.; Clemente, F.M.; Adsuar, J.C.; Pérez-Gómez, J.; Carlos-Vivas, J.; Brito, J.P. Comparisons of Accelerometer Variables Training Monotony and Strain of Starters and Non-Starters: A Full-Season Study in Professional Soccer Players. Int. J. Environ. Res. Public. Health. 2020, 17, 6547. [Google Scholar] [CrossRef] [PubMed]
- Nobari, H.; Praça, G.M.; Clemente, F.M.; Pérez-Gómez, J.; Carlos Vivas, J.; Ahmadi, M. Comparisons of new body load and metabolic power average workload indices between starters and non-starters: A full-season study in professional soccer players. Proceed. Inst. Mech. Eng. Part. P J. Sports Eng. Technol. 2020, 175433712097487. [Google Scholar] [CrossRef]
- Rossi, A.; Perri, E.; Trecroci, A.; Savino, M.; Alberti, G.; Iaia, M.F. GPS Data Reflect Players’ Internal Load in Soccer. In Proceedings of the IEEE 17th International Conference on Data Mining Workshops (ICDMW), New Orleans, LA, USA, 18–21 November 2017. [Google Scholar] [CrossRef]
- Ferraz, R.; Gonçalves, B.; Van Den Tillaar, R.; Jimenez, S.; Sampaio, J.; Marques, M. Effects of knowing the task duration on players’ pacing patterns during soccer small-sided games. J. Sport Sci. 2017, 1–7. [Google Scholar] [CrossRef] [PubMed]
- Fowler, P.; Duffield, R.; Vaile, J. Effects of domestic air travel on technical and tactical performance and recovery in soccer. Int. J. Sports Physiol. Perform. 2014, 9, 378–386. [Google Scholar] [CrossRef] [PubMed]
- Waters, A.; Lovell, G. An examination of the homefield advantage in a professional English soccer team from a psychological standpoint. Football Stud. 2002, 5, 46–59. [Google Scholar]
- Nedelec, M.; Halson, S.; Abaidia, A.E.; Ahmaidi, S.; Dupont, G. Stress, sleep and recovery in elite soccer: A critical review of the literature. Sports Med. 2015, 45, 1387–1400. [Google Scholar] [CrossRef] [PubMed]
- Barrett, S.; McLaren, S.; Spears, I.; Ward, P.; Weston, M. The Influence of Playing Position and Contextual Factors on Soccer Players’ Match Differential Ratings of Perceived Exertion: A Preliminary Investigation. Sports 2018, 6, 13. [Google Scholar] [CrossRef] [Green Version]
- Gaudino, P.; Iaia, F.M.; Alberti, G.; Strudwick, A.J.; Atkinson, G.; Gregson, W. Monitoring training in elite soccer players: Systematic bias between running speed and metabolic power data. Int. J. Sports Med. 2013, 34, 963–968. [Google Scholar] [CrossRef]
- Owen, A.L.; Wong, P.; Dunlop, G.; Groussard, C.; Kebsi, W.; Dellal, A.; Morgans, R.; Zouhal, H. High intensity training and salivary immunoglobulin—A responses in professional toplevel soccer players: Effect of training intensity. J. Strength Cond. Res. 2016, 30, 2460–2469. [Google Scholar] [CrossRef]
- Anderson, L.; Orme, P.; Di Michele, R.; Close, G.L.; Morgans, R.; Drust, B.; Morton, J.P. Quantification of training load during one-, two- and three-game week schedules in professional soccer players from the English Premier League: Implications for carbohydrate periodisation. J. Sports Sci. 2016, 34, 1250–1259. [Google Scholar] [CrossRef] [PubMed] [Green Version]


| Home | Away | ES (Home vs. Away) | |
|---|---|---|---|
| MD-5 (n = 24) | n = 12 | n = 12 | |
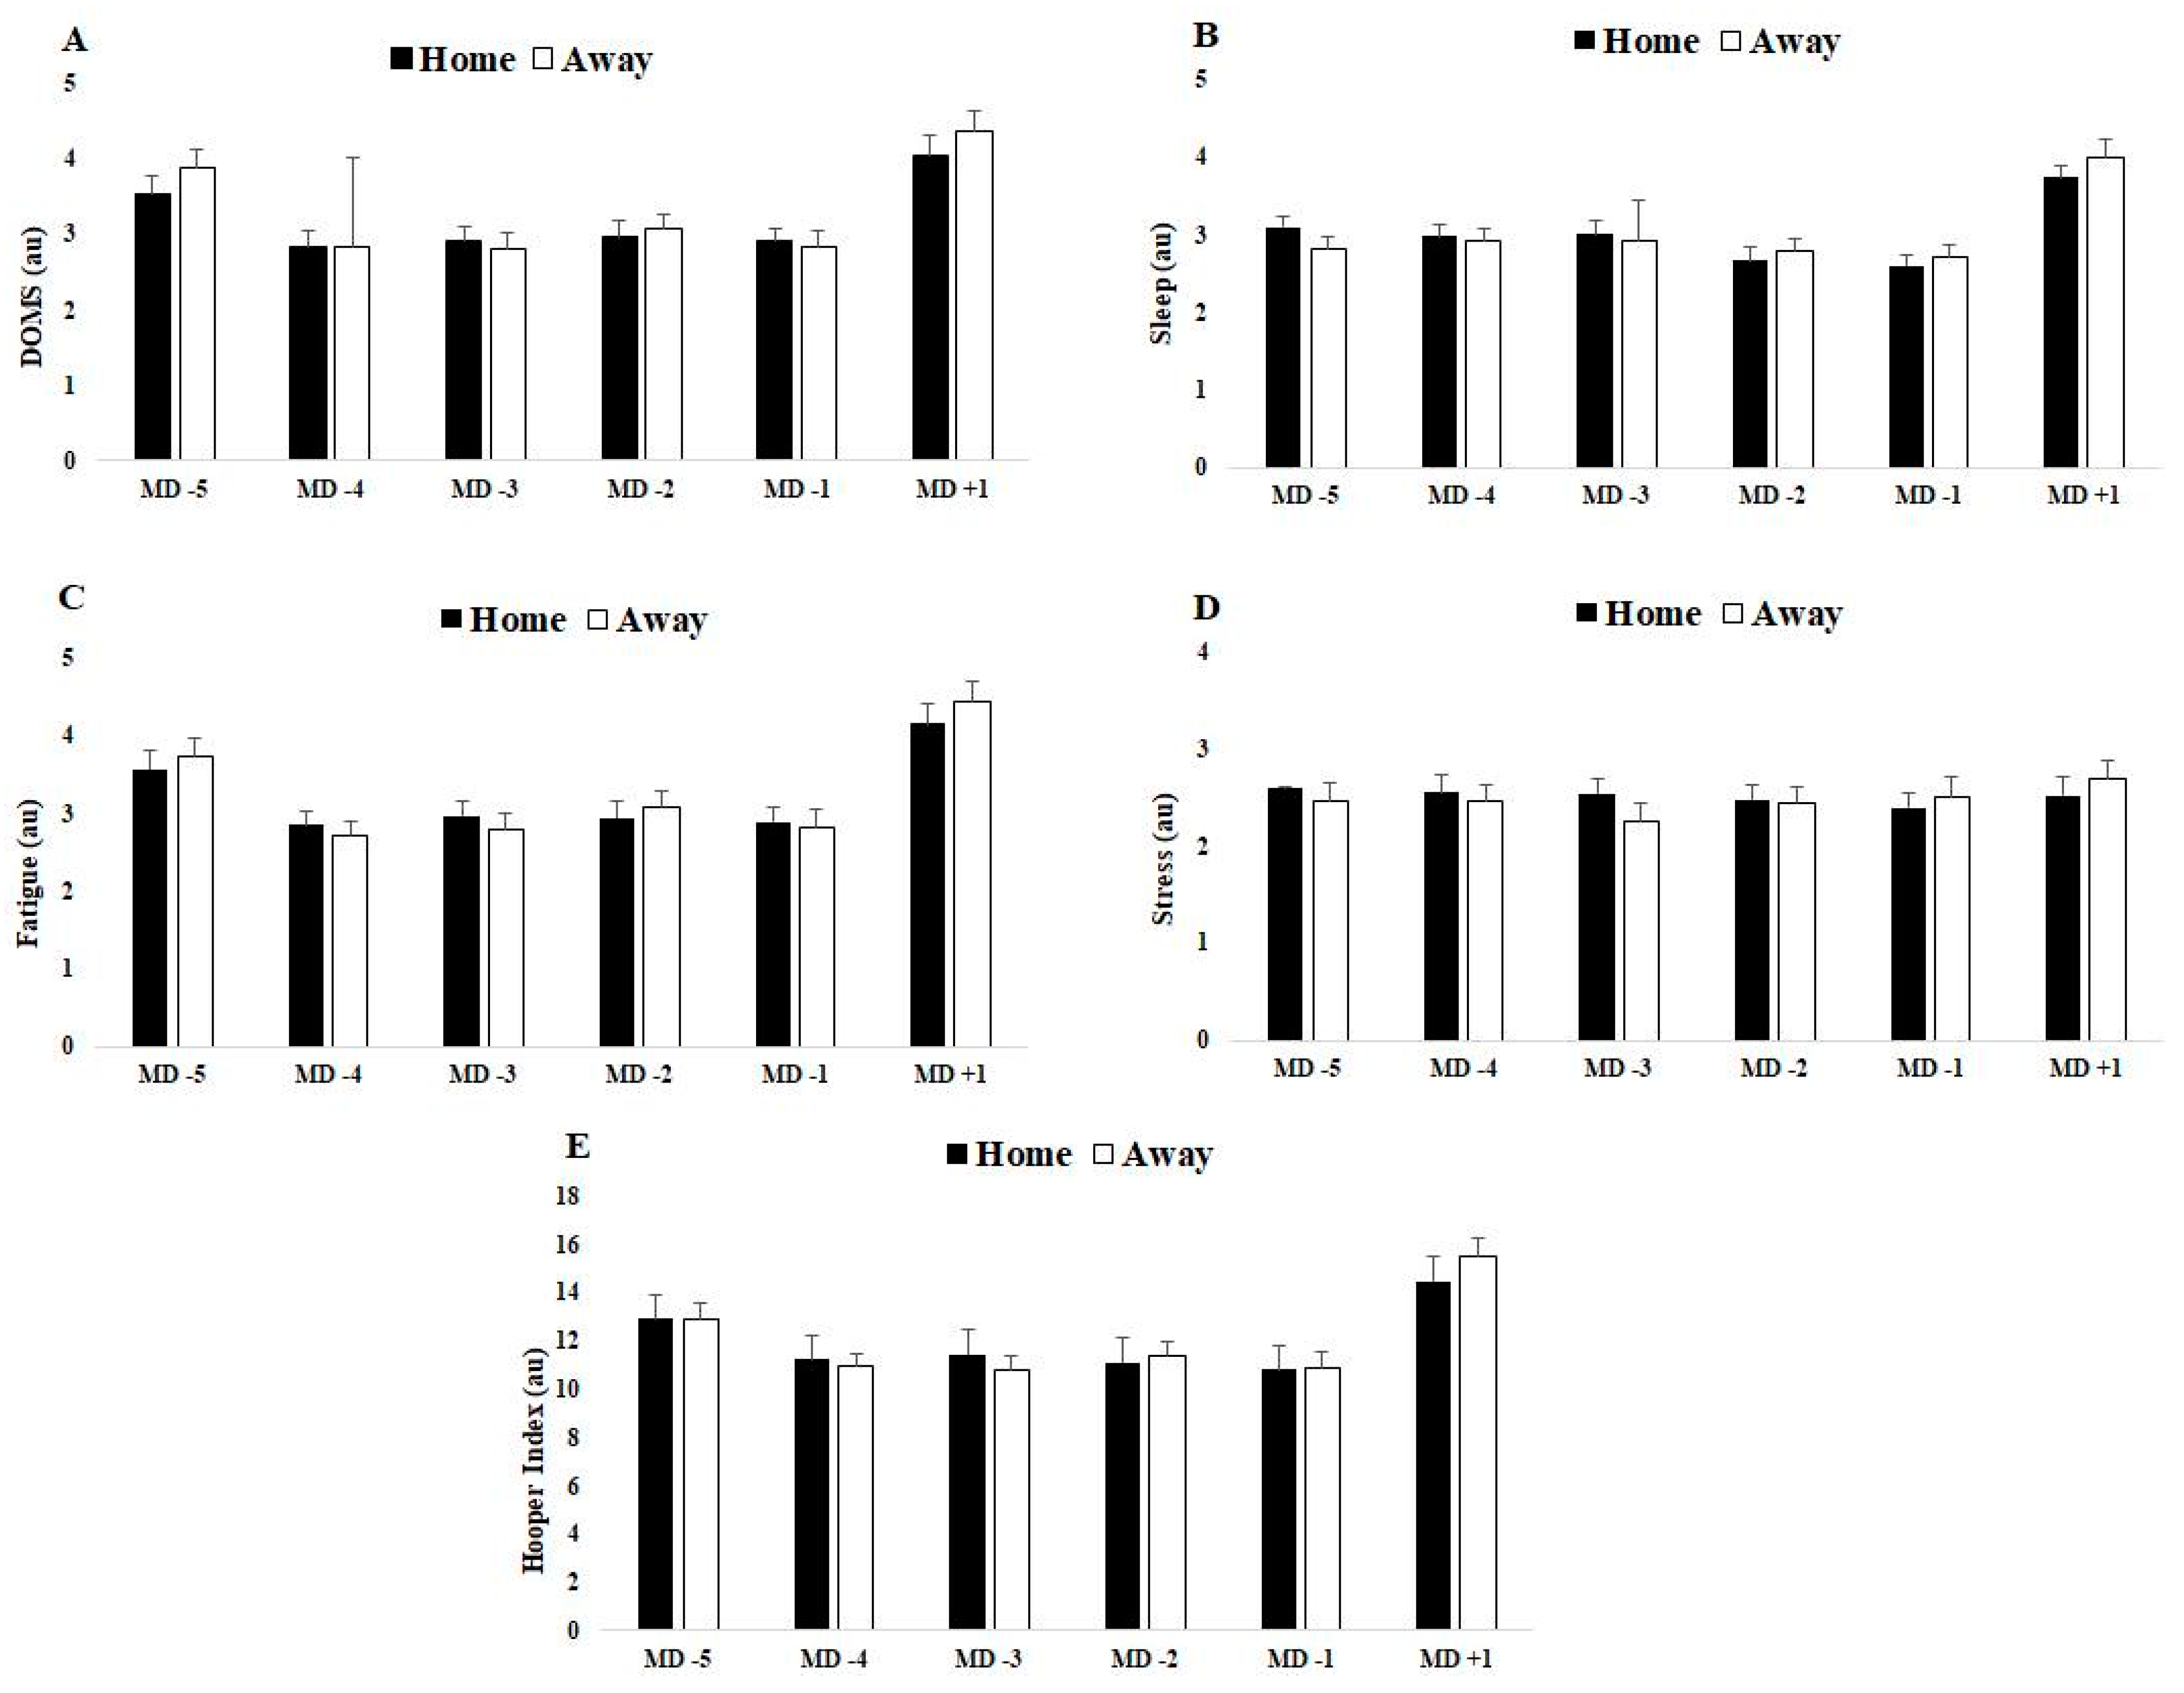
| DOMS (au) | 3.530 ± 0.239 a,b,c,d | 3.878 ± 0.256 a,b,c,d | −1.41 (−2.07, −0.69) * |
| Sleep (au) | 3.093 ± 0.142 c,d,e | 2.820 ± 0.166 e | 1.77 (1.01, 2.46) |
| Fatigue (au) | 3.577 ± 0.245 a,c,d | 3.722 ± 0.246 a,b,c,d,e | −0.59 (−1.21, 0.05) |
| Stress (au) | 2.599 ± 0.0136 | 2.466 ± 0.181 | 0.83 (0.17, 1.46) |
| HI (au) | 12.893 ± 0.557 c,d,e | 12.886 ± 0.651 a,b,c,d,e | 0.01 (−0.61, 0.63) |
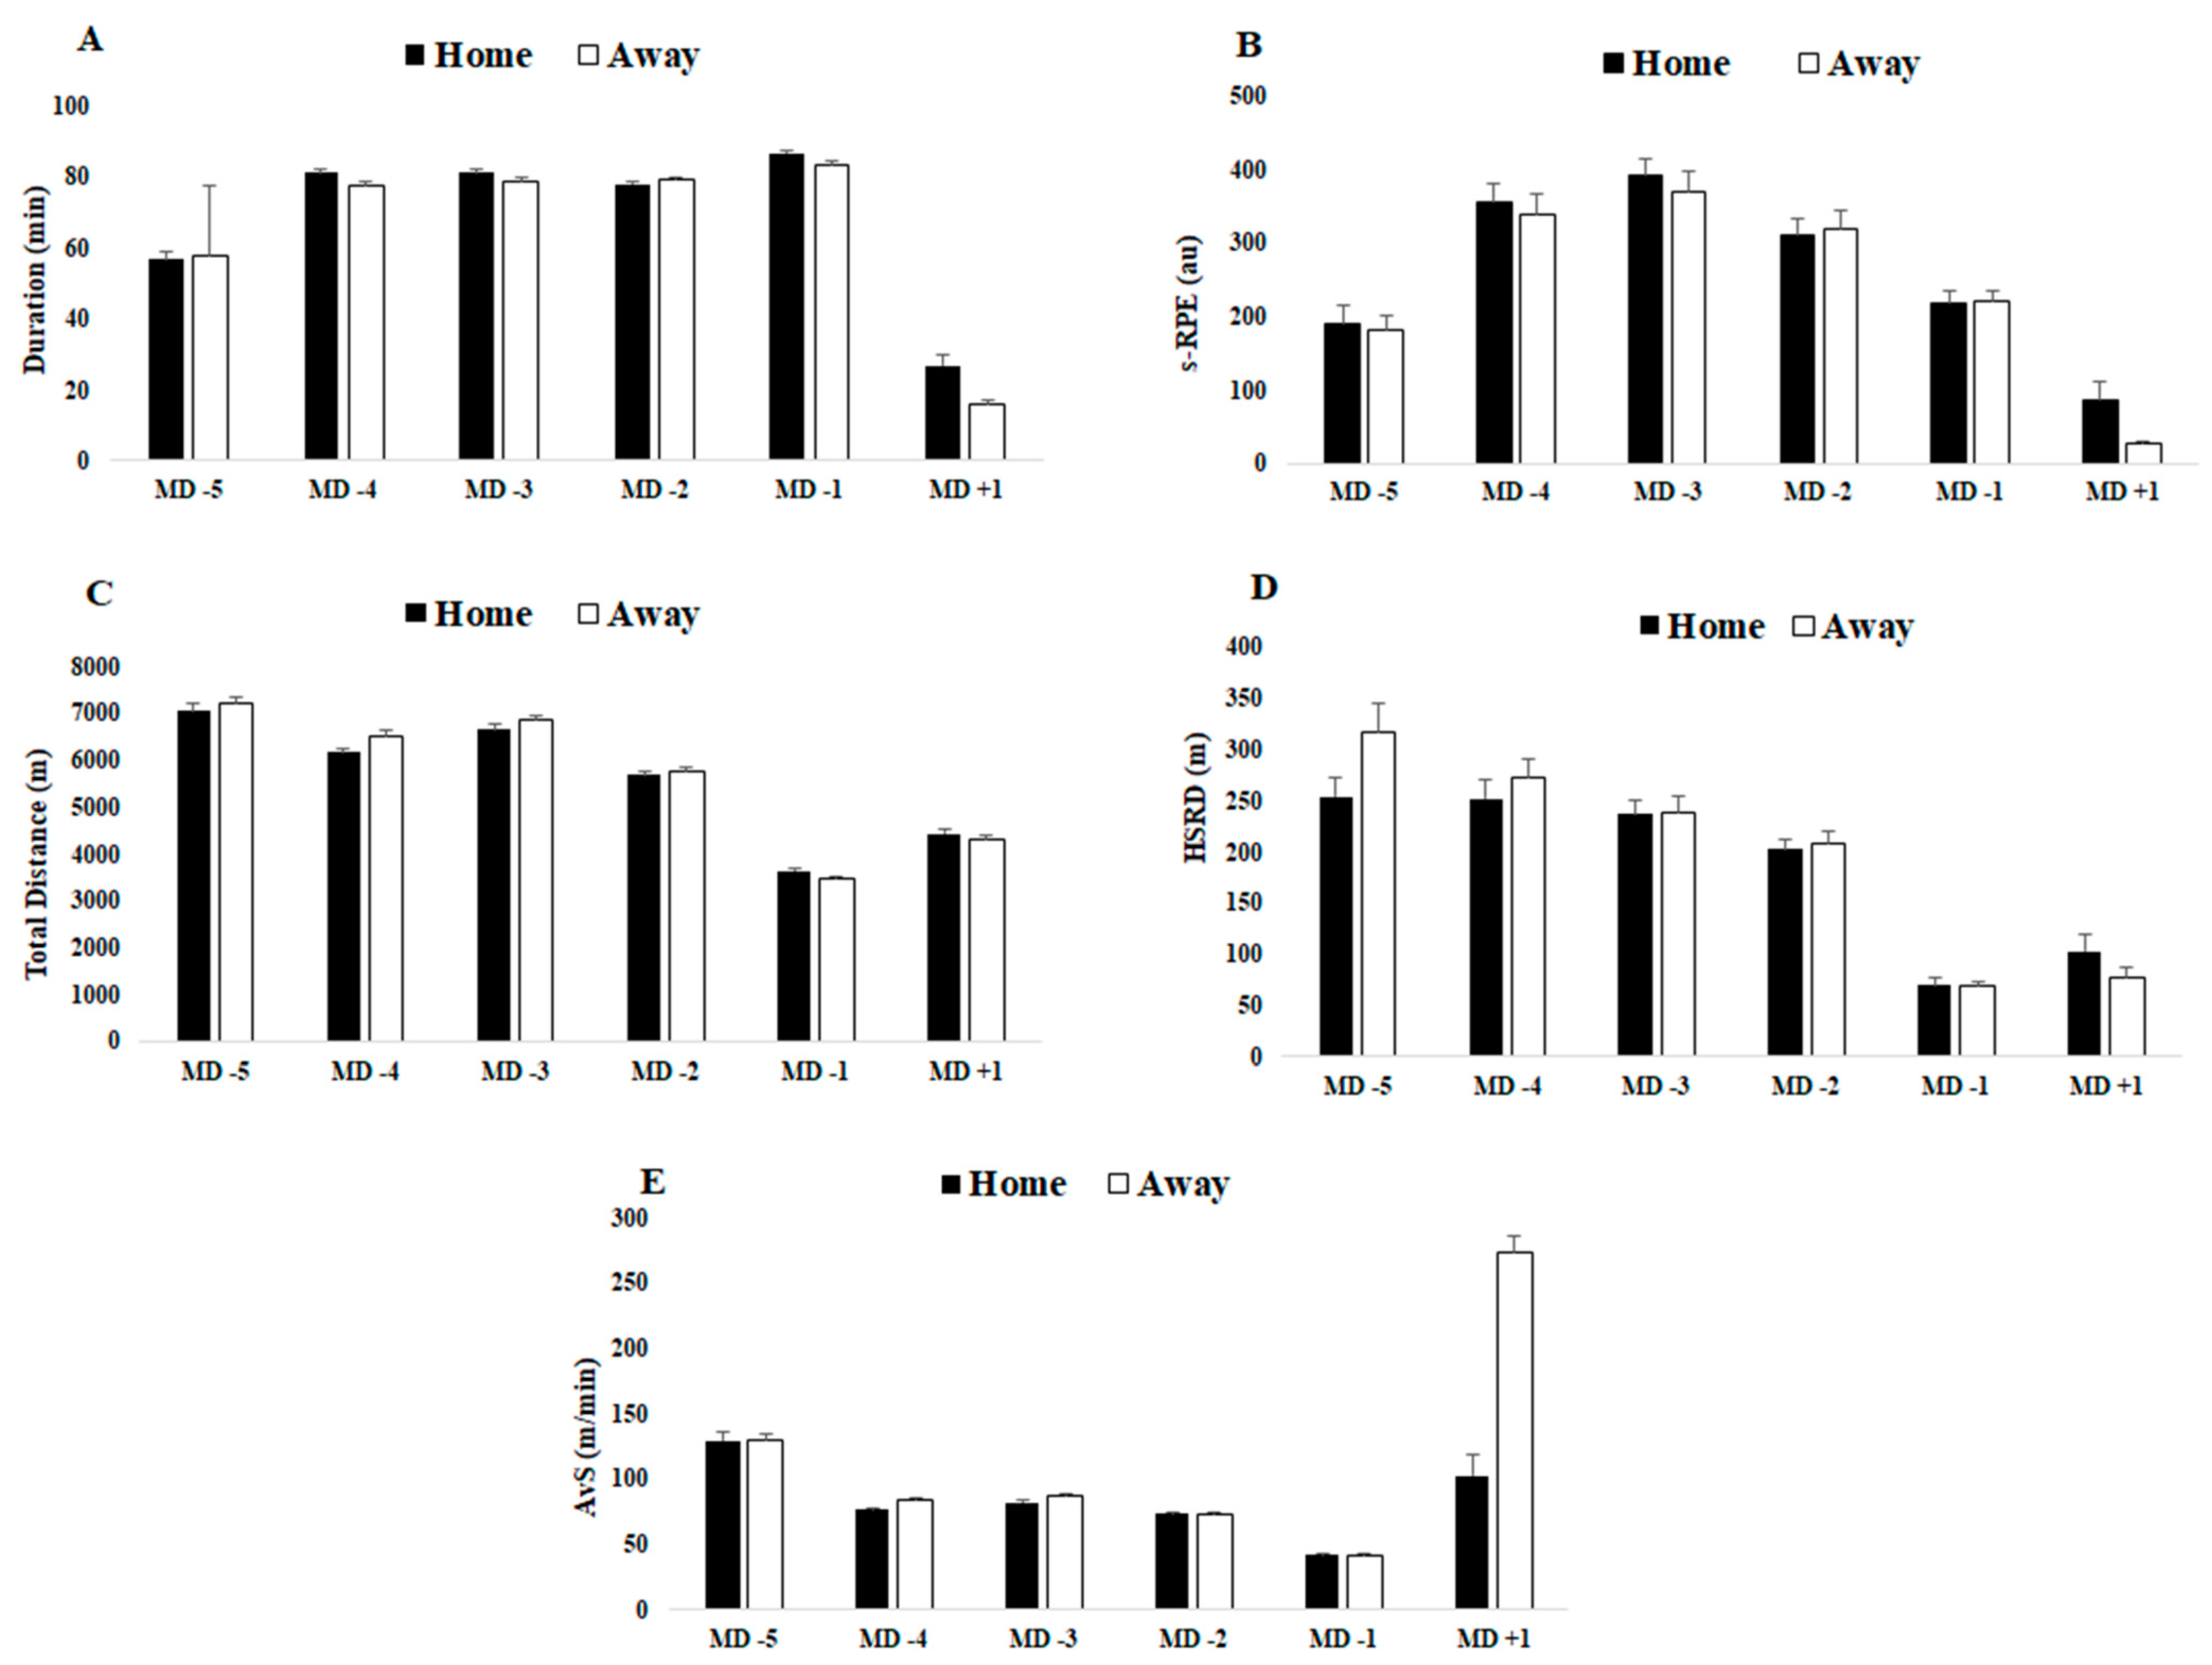
| Duration (min) | 56.642 ± 2.296 a,b,c,d,e | 57.807 ± 2.275 a,b,c,d,e | −0.51 (−1.13, 0.13) |
| s-RPE (au) | 190.658 ± 24.086 a,b,c | 180.746 ± 19.385 a,b,c,e | 0.45 (−0.18, 1.07) |
| Total Distance (m) | 7050.871 ± 168.175 a,c,d,e | 7210.571 ± 120.153 a,c,d,e | −1.09 (−1.73, −0.41) |
| HSRD (m) | 254.122 ± 19.128 d,e | 316.044 ± 27.984 b,c,d,e | −2.58 (−3.36, −1.70) * |
| AvS (m/min) | 129.597 ± 6.448 a,b,c,d,e | 129.416 ± 5.051 a,b,c,d,e | 0.03 (−0.59, 0.65) |
| MD−4 (n = 20) | n = 10 | n = 10 | |
| DOMS (au) | 2.848 ± 0.196 e | 2.824 ± 0.194 e | 0.12 (−0.50, 0.74) |
| Sleep (au) | 2.984 ± 0.141 e | 2.927 ± 0.154 e | 0.39 (−0.25, 1.00) |
| Fatigue (au) | 2.854 ± 0.185 e | 2.710 ± 0.193 c,e | 0.76 (0.11, 1.39) |
| Stress (au) | 2.552 ± 0.176 | 2.471 ± 0.169 | 0.47 (−0.17, 1.09) |
| HI (au) | 11.238 ± 0.530 c,d | 10.928 ± 0.575 e | 0.56 (−0.08, 1.18) |
| Duration (min) | 81.083 ± 1.020 d,e | 77.346 ± 1.078 e | 3.56 (2.51, 4.47) * |
| s-RPE (au) | 355.150 ± 25.845 d,e | 338.452 ± 27.881 d,e | 0.62 (−0.03, 1.24) |
| Total Distance (m) | 6156.369 ± 94.723 b,c,d,e | 6519.533 ± 123.547 c,d,e | −3.30 (−4.17, −2.29) * |
| HSRD (m) | 252.113 ± 18.286 d,e | 273.032 ± 17.485 c,d,e | −1.17 (−1.81, −0.48) |
| AvS (m/min) | 76.034 ± 1.209 b,d | 84.475 ± 1.783 c,d,e | −5.54 (−6.77, −4.09) ** |
| MD-3 (n = 24) | n = 12 | n >= 12 | |
| DOMS (au) | 2.929 ± 0.181 e | 2.822 ± 0.194 e | 0.57 (−0.07, 1.19) |
| Sleep (au) | 3.011 ± 0.167 e | 2.919 ± 0.529 e | 0.23 (−0.39, 0.85) |
| Fatigue (au) | 2.975 ± 0.191 e | 2.793 ± 0.208 e | 0.91 (0.24, 1.54) |
| Stress (au) | 2.546 ± 0.144 | 2.253 ± 0.187 c | 1.76 (1.00, 2.45) ** |
| HI (au) | 11.461 ± 0.547 e | 10.786 ± 0.621 e | 1.15 (0.46, 1.80) |
| Duration (min) | 80.978 ± 1.126 d,e | 78.534 ± 0.928 e | 2.37 (1.52, 3.12) * |
| s-RPE (au) | 392.009 ± 22.746 c,d,e | 368.139 ± 30.510 d,e | 0.89 (0.22, 1.52) |
| Total Distance (m) | 6643.648 ± 112.012 c,d,e | 6864.267 ± 65.982 c,d,e | −2.40 (−3.16, −1.55) * |
| HSRD (m) | 236.208 ± 13.133 d,e | 238.649 ± 15.622 d,e | −0.17 (−0.79, 0.46) |
| AvS (m/min) | 82.181 ± 1.287 d | 87.575 ± 1.169 c,d,e | −4.39 (−5.43, −3.17) ** |
| MD-2 (n = 24) | n = 12 | n = 12 | |
| DOMS (au) | 2.980 ± 0.203 e | 3.079 ± 0.191 e | −0.50 (−1.12, 0.14) |
| Sleep (au) | 2.672 ± 0.163 e | 2.787 ± 0.149 e | −0.74 (−1.36, −0.08) * |
| Fatigue (au) | 2.942 ± 0.217 e | 3.090 ± 0.193 e | −0.72 (−1.35, −0.07) * |
| Stress (au) | 2.475 ± 0.160 | 2.438 ± 0.165 | 0.23 (−0.40, 0.84) |
| HI (au) | 11.111 ± 0.608 e | 11.393 ± 0.553 e | −0.49 (−1.10, 0.15) |
| Duration (min) | 77.704 ± 0.684 d,e | 78.933 ± 0.477 e | −2.08 (−2.81, −1.28) |
| s-RPE (au) | 309.385 ± 22.746 c,d,e | 319.927 ± 23.016 d,e | −0.46 (−1.08, 0.18) |
| Total Distance (m) | 5672.056 ± 66.924 d,e | 5772.040 ± 57.580 d,e | −1.60 (−2.28, −0.86) |
| HSRD (m) | 202.866 ± 9.509 d,e | 208.496 ± 12.475 d,e | −0.51 (−1.13, 0.13) |
| AvS (m/min) | 73.035 ± 1.041 d | 73.167 ± 0.841 d,e | −0.14 (−0.76, 0.48) |
| MD-1 (n = 24) | n = 12 | n = 12 | |
| DOMS (au) | 2.914 ± 0.170 e | 2.834 ± 0.220 e | 0.41 (−0.23, 1.02) |
| Sleep (au) | 2.601 ± 0.148 e | 2.713 ± 0.164 e | −0.72 (−1.34, −0.06) |
| Fatigue (au) | 2.887 ± 0.185 e | 2.828 ± 0.222 e | 0.29 (−0.34, 0.91) |
| Stress (au) | 2.398 ± 0.150 | 2.515 ± 0.197 | −0.67 (−1.29, −0.02) |
| HI (au) | 10.801 ± 0.512 e | 10.889 ± 0.619 e | −0.15 (−0.77, 0.47) |
| Duration (min) | 86.379 ± 0.651 e | 82.954 ± 1.303 e | 3.33 (2.31, 4.20) * |
| s-RPE (au) | 218.543 ± 15.538 e | 221.074 ± 13.389 e | −0.17 (−0.79, 0.45) |
| Total Distance (m) | 3644.602 ± 62.053 e | 3452.107 ± 66.846 e | 2.98 (2.03, 3.82) ** |
| HSRD (m) | 69.503 ± 6.994 | 68.431 ± 5.338 | 0.17 (−0.45, 0.79) |
| AvS (m/min) | 42.245 ± 0.775 e | 41.877 ± 1.044 e | 0.40 (−0.23, 1.02) |
| MD + 1 (n = 20) | n = 10 | n = 10 | |
| DOMS (au) | 4.048 ± 0.265 | 4.377 ± 0.267 | −1.24 (−1.89, −0.54) * |
| Sleep (au) | 3.737 ± 0.156 | 4.005 ± 0.230 | −1.36 (−2.02, −0.65) |
| Fatigue (au) | 4.158 ± 0.250 | 4.444 ± 0.250 | −1.14 (−1.79, −0.45) * |
| Stress (au) | 2.526 ± 0.179 | 2.687 ± 0.201 | −0.85 (−1.47, −0.18) |
| HI (au) | 14.469 ± 0.684 | 15.513 ± 0.699 | −1.51 (−2.18, −0.78) * |
| Duration (min) | 26.687 ± 3.098 | 16.179 ± 0.769 | 4.66 (3.39, 5.74) ** |
| s-RPE (au) | 86.238 ± 23.532 | 25.922 ± 2.432 | 3.61 (2.54, 4.53) * |
| Total Distance (m) | 4421.407 ± 114.412 | 4308.190 ± 82.567 | 1.13 (0.45, 1.78) |
| HSRD (m) | 103.066 ± 16.503 | 77.741 ± 8.651 | 1.92 (1.14, 2.63) |
| AvS (m/min) | 102.210 ± 16.029 | 273.645 ± 11.738 | −12.20 (−14.65, −9.27) ** |
| MD-5 | Home (Starter, n = 10) | Home (Non-Starter, n = 10) | Away (Starter, n = 10) | Away (Non-Starter, n = 10) |
|---|---|---|---|---|
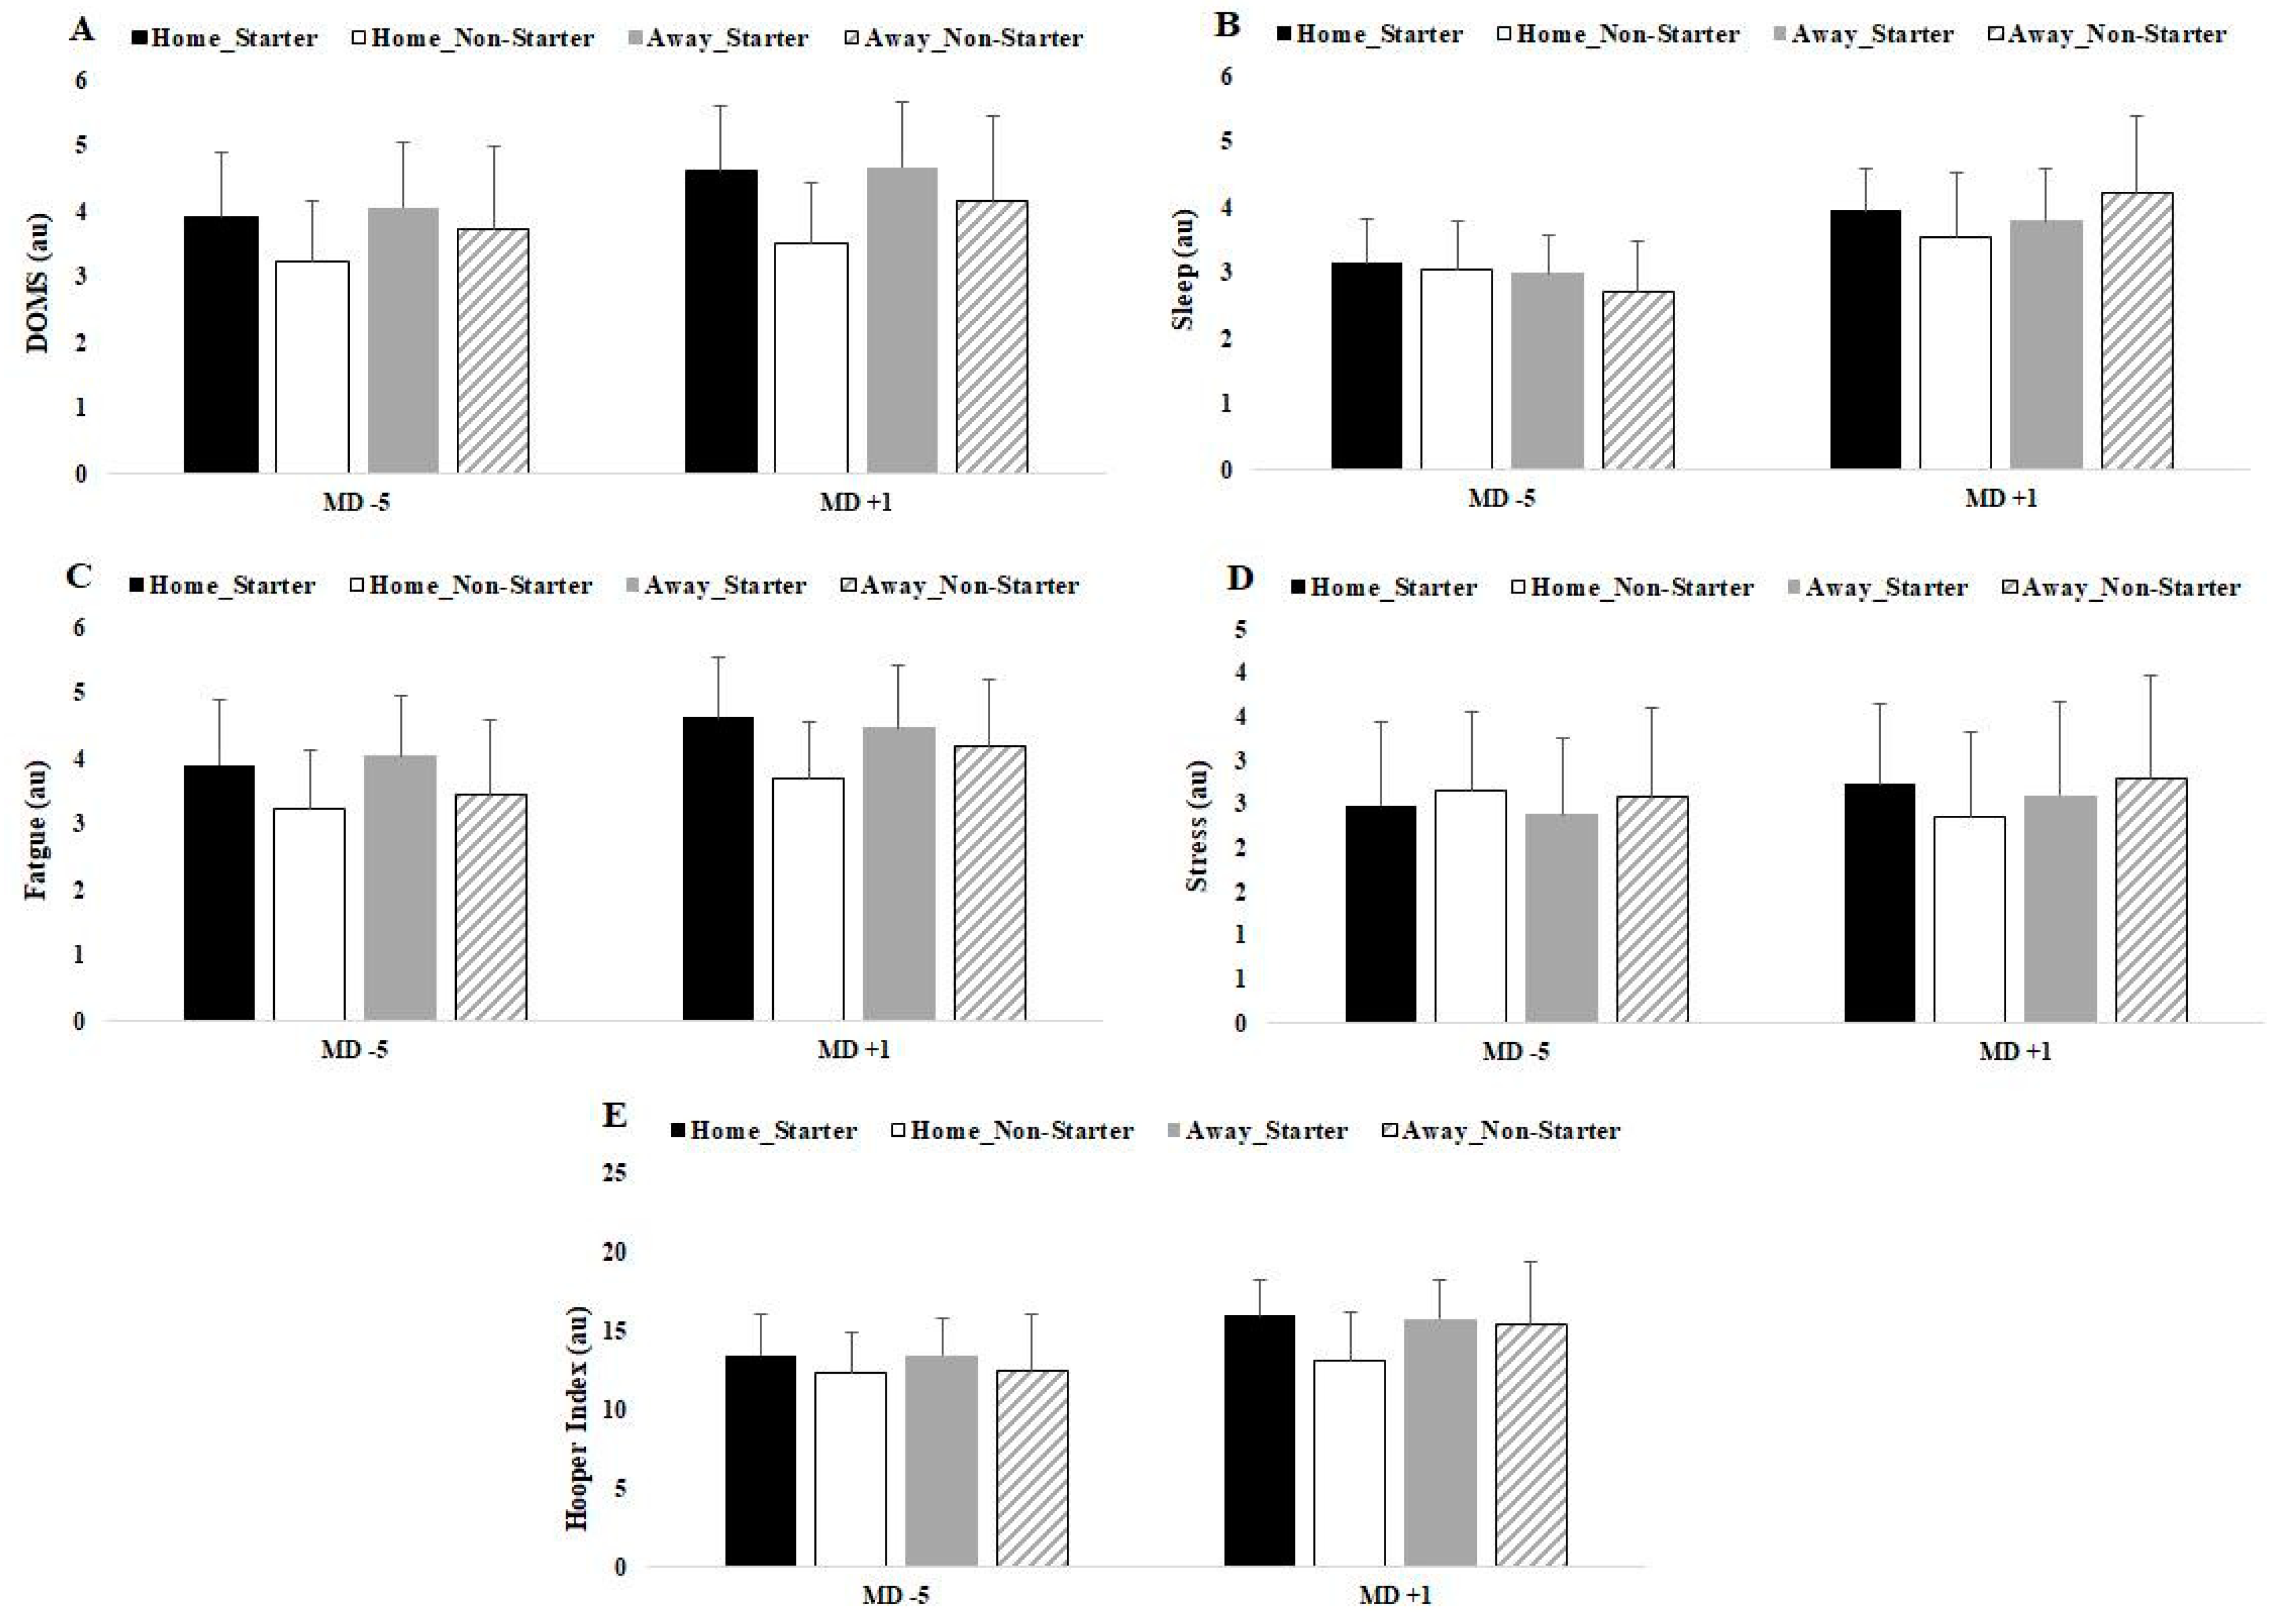
| DOMS (au) | 3.907 ± 0.990 | 3.236 ± 0.934 | 4.052 ± 0.997 | 3.739 ± 1.248 |
| Sleep (au) | 3.148 ± 0.666 | 3.035 ± 0.751 | 2.991 ± 0.578 | 2.701 ± 0.778 |
| Fatigue (au) | 3.909 ± 0.988 | 3.227 ± 0.903 | 4.038 ± 0.918 | 3.448 ± 1.129 |
| Stress (au) | 2.485 ± 0.966 | 2.666 ± 0.879 | 2.387 ± 0.873 | 2.577 ± 1.035 |
| HI (au) | 13.449 ± 2.552 | 12.308 ± 2.594 | 13.468 ± 2.351 | 12.465 ± 3.526 |
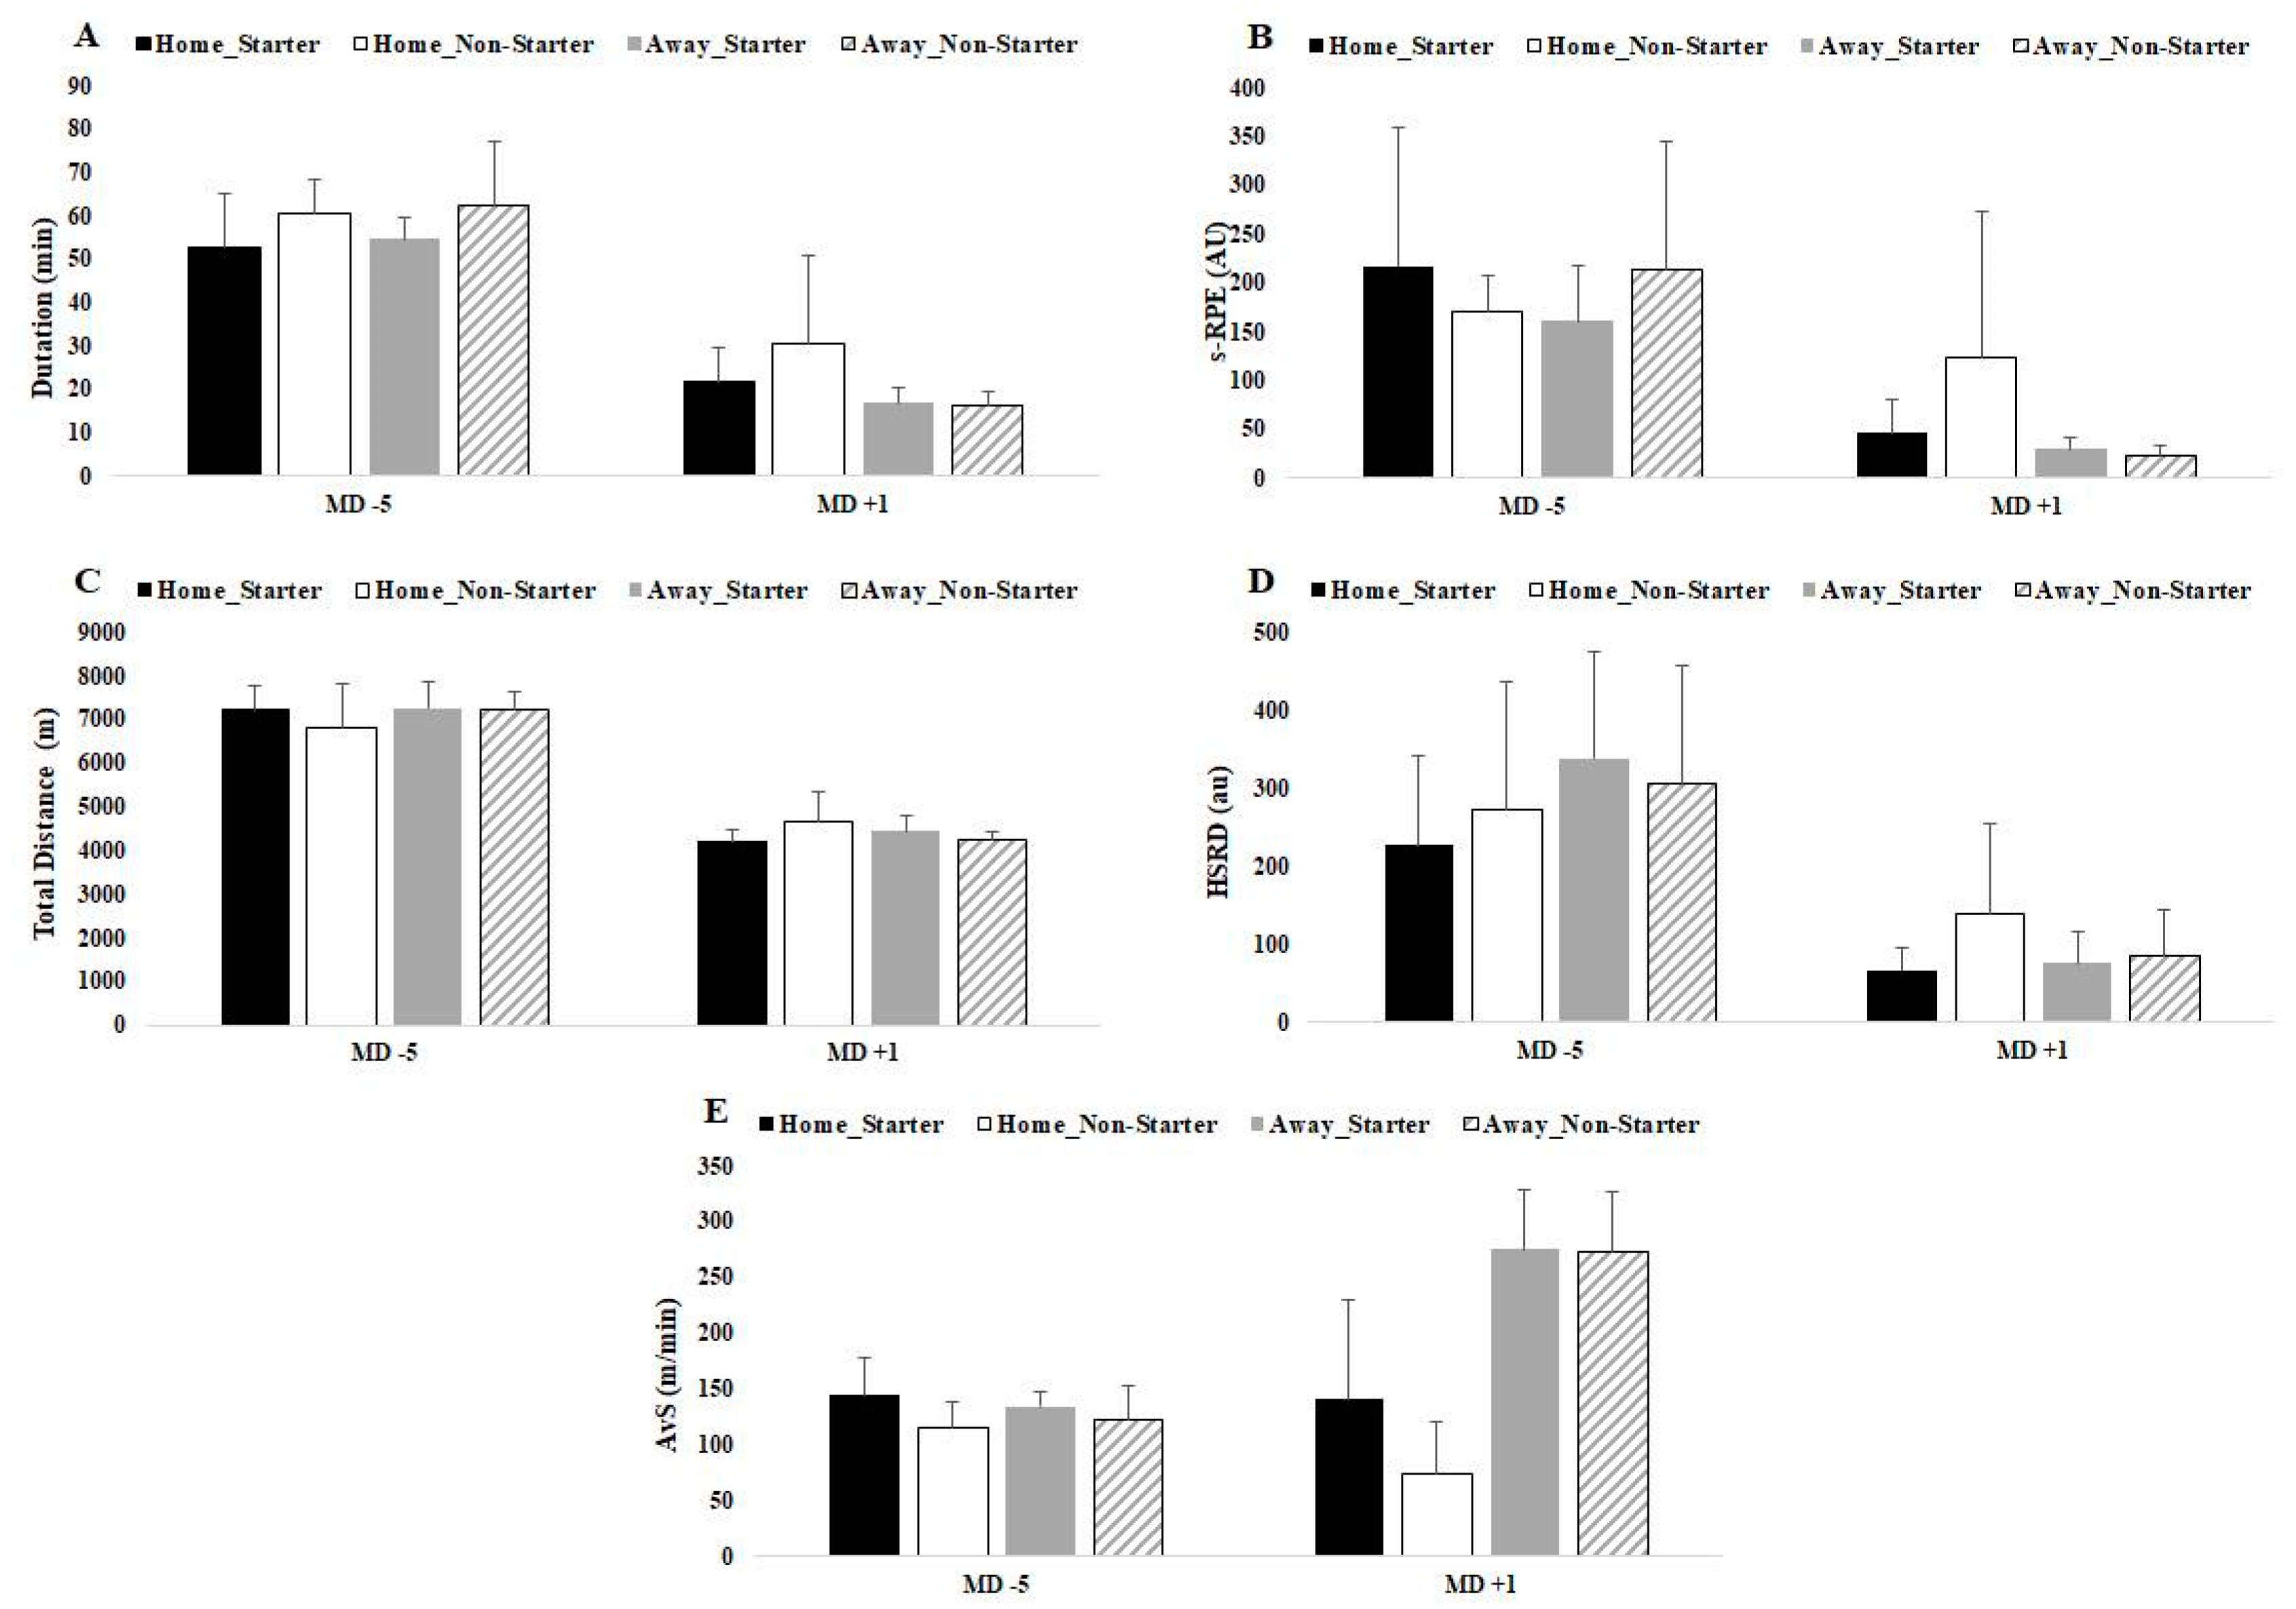
| Duration (min) | 52.599 ± 12.598 | 60.536 ± 7.727 | 54.550 ± 4.946 | 62.228 ± 14.944 |
| s-RPE (au) | 216.723 ± 143.317 | 171.020 ± 36.071 | 161.122 ± 55.633 | 212.840 ± 132.008 |
| Total Distance (m) | 7242.072 ± 526.893 | 6811.405 ± 997.150 | 7258.627 ± 619.855 | 7203.919 ± 411.725 |
| HSRD (m) | 226.664 ± 114.584 | 271.157 ± 165.186 | 338.507 ± 136.427 | 306.065 ± 149.409 |
| AvS (m/min) | 144.588 ± 33.356 | 114.324 ± 23.714 | 134.108 ± 14.039 | 122.215 ± 31.009 |
| MD + 1 | ||||
| DOMS (au) | 4.621 ± 0.991 a | 3.513 ± 0.911 | 4.664 ± 1.013 | 4.145 ± 1.313 |
| Sleep (au) | 3.950 ± 0.652 | 3.539 ± 0.971 | 3.800 ± 0.788 | 4.207 ± 1.174 |
| Fatigue (au) | 4.625 ± 0.917 a | 3.685 ± 0.868 | 4.469 ± 0.962 | 4.193 ± 1.012 |
| Stress (au) | 2.733 ± 0.919 | 2.354 ± 0.967 | 2.602 ± 1.065 | 2.798 ± 1.180 |
| HI (au) | 15.930 ± 2.242 a | 13.087 ± 3.089 | 15.753 ± 2.487 | 15.343 ± 4.009 |
| Duration (min) | 21.685 ± 8.076 | 30.543 ± 20.128 | 16.725 ± 3.854 | 16.075 ± 3.399 |
| s-RPE (au) | 46.111 ± 34.241 | 122.407 ± 151.091 | 29.309 ± 12.157 | 23.254 ± 10.022 |
| Total Distance (m) | 4215.586 ± 258.536 | 4649.747 ± 678.602 | 4435.604 ± 341.846 | 4260.829 ± 144.671 |
| HSRD (m) | 66.486 ± 29.941 | 139.718 ± 113.176 | 75.039 ± 40.146 | 84.345 ± 58.732 |
| AvS (m/min) | 140.265 ± 89.796 | 74.532 ± 46.093 | 275.079 ± 53.178 | 272.742 ± 54.309 |
Publisher’s Note: MDPI stays neutral with regard to jurisdictional claims in published maps and institutional affiliations. |
© 2021 by the authors. Licensee MDPI, Basel, Switzerland. This article is an open access article distributed under the terms and conditions of the Creative Commons Attribution (CC BY) license (https://creativecommons.org/licenses/by/4.0/).
Share and Cite
Oliveira, R.; Brito, J.P.; Loureiro, N.; Padinha, V.; Nobari, H.; Mendes, B. Will Next Match Location Influence External and Internal Training Load of a Top-Class Elite Professional European Soccer Team? Int. J. Environ. Res. Public Health 2021, 18, 5229. https://0-doi-org.brum.beds.ac.uk/10.3390/ijerph18105229
Oliveira R, Brito JP, Loureiro N, Padinha V, Nobari H, Mendes B. Will Next Match Location Influence External and Internal Training Load of a Top-Class Elite Professional European Soccer Team? International Journal of Environmental Research and Public Health. 2021; 18(10):5229. https://0-doi-org.brum.beds.ac.uk/10.3390/ijerph18105229
Chicago/Turabian StyleOliveira, Rafael, João Paulo Brito, Nuno Loureiro, Vítor Padinha, Hadi Nobari, and Bruno Mendes. 2021. "Will Next Match Location Influence External and Internal Training Load of a Top-Class Elite Professional European Soccer Team?" International Journal of Environmental Research and Public Health 18, no. 10: 5229. https://0-doi-org.brum.beds.ac.uk/10.3390/ijerph18105229