
Trajectories of Body Height, Body Weight, BMI, and Nutrition Status from 1979 to 1987: A Measurement-Based Analysis of 8740 Montenegrin Male Adolescents from the Municipality of Berane


 , and
, and 
Abstract
:1. Introduction
2. Materials and Methods
3. Results
4. Discussion
5. Conclusions
Author Contributions
Funding
Institutional Review Board Statement
Informed Consent Statement
Data Availability Statement
Conflicts of Interest
References
- Cole, T. The development of growth references and growth charts. Ann. Hum. Biol. 2012, 39, 382–394. [Google Scholar] [CrossRef] [Green Version]
- Hu, Y.; Lin, W.; Tan, X.; Liu, Y.; Wen, Y.; Xing, Y.; Ma, Y.; Liu, H.; Song, Y.; Liang, J.; et al. Trends in urban/rural inequalities in physical growth among Chinese children over three decades of urbanization in Guangzhou: 1985–2015. BMC Public Health 2020, 20. [Google Scholar] [CrossRef] [PubMed]
- Rezaeipour, M.; Apanasenko, G.L.; Raghi, Z. Efficacy of the WATERinMOTION Aquatics Exercise Programme on the Body Weight and Composition of Sedentary Older Women with Overweight/Obesity. Montenegrin J. Sports Sci. Med. 2021, 10. [Google Scholar] [CrossRef]
- Albertsson-Wikland, K.; Niklasson, A.; Gelander, L.; Holmgren, A.; Sjöberg, A.; Aronson, A.S.; Nierop, A.F.M. Swedish references for weight, weight-for-height and body mass index; the GrowUp 1990 Gothenburg study. Acta Paediatr. 2020, 2020, 1–12. [Google Scholar] [CrossRef] [PubMed]
- Hauspie, R.C.; Vercauteren, M.; Susanne, C. Secular Changes in Growth. Horm. Res. 1996, 45, 8–17. [Google Scholar] [CrossRef] [PubMed]
- Bielecki, E.M.; Haas, J.D.; Hulanicka, B. Secular changes in the height of Polish schoolboys from 1955 to 1988. Econ. Hum. Biol. 2012, 10, 310–317. [Google Scholar] [CrossRef] [PubMed] [Green Version]
- Grasgruber, P.; Prce, S.; Stračárová, N.; Hrazdíra, E.; Cacek, J.; Popović, S.; Hřebíčková, S.; Potpara, P.; Davidovič, I.; Kalina, T. The coast of giants: An anthropometric survey of high schoolers on the Adriatic coast of Croatia. PeerJ 2019, 7, e6598. [Google Scholar] [CrossRef]
- Popovic, S.; Banjevic, B.; Masanovic, B.; Bjelica, D. Body Mass Index and Measures of Body Fat for Defining Obesity and Underweight: A Cross-Sectional of Various Specialties in Montenegrin Army Soldiers. Iran. J. Public Health 2020, 49, 2376–2383. [Google Scholar] [CrossRef]
- NCD Risk Factor Collaboration. A century of trends in adult human height. eLife 2016, 5, e13410. [Google Scholar]
- Ferreira-Hermosillo, A.; Roy-García, I.; Rivas-Ruiz, R.; Palacios-Butchard, J.J.; Mercado, M.; Talavera, J.O. Height and weight progression patterns in Mexican children aged between 6 and 12 years and differences with Ramos-Galván growth charts 40 years later. Gac. Med. Mex. 2020, 156, 117–123. [Google Scholar] [CrossRef] [Green Version]
- Popovic, S. Local Geographical Differences in Adult Body Height in Montenegro. Montenegrin J. Sports Sci. Med. 2017, 6, 81–87. [Google Scholar]
- Aslan, A.; Salci, Y.; Guvenc, A. The Effects of Weekly Recreational Soccer Intervention on the Physical Fitness Level of Sedentary Young Men. Montenegrin J. Sports Sci. Med. 2019, 8, 51–59. [Google Scholar] [CrossRef]
- Banjevic, B.; Popovic, S.; Masanovic, B. Body Mass Index and Body Fat Percentage of Armed Forces Personnel in Mon-tenegro among Different Age Groups. Iran. J. Public Health 2020, 49, 1010–1011. [Google Scholar]
- Zaniqueli, D.; Oliosa, P.R.; Neves, F.S.; Pani, V.O.; Martins, C.R.; Peçanha, M.A.D.S.; Barbosa, M.C.R.; De Faria, E.R.; Alvim, R.D.O.; Mill, J.G. Ponderal index classifies obesity in children and adolescents more accurately than body mass index z-scores. Pediatr. Res. 2019, 86, 128–133. [Google Scholar] [CrossRef] [PubMed]
- Masanovic, B.; Arifi, F.; Gardasevic, J. Relationship between sitting height measurements and standing height: A pro-spective regional study among adolescents in the southern region of Kosovo. Int. J. Morphol. 2020, 38, 1681–1685. [Google Scholar] [CrossRef]
- Popović, S. Arm-span measurement as an alternative estimation of true height in Montenegrin young adults of both sex-es: A national survey. Anthropol. Noteb. 2018, 24, 53–67. [Google Scholar]
- Starc, G.; Popović, S.; Đordić, V.; Ostojić, S.; Musić Milanović, S.; Kujundžić, E.; Spiroski, I.; Đurić, S.; Mašanović, B.; Sember, V.; et al. Differences in body height between the contemporary Western Balkan children and the WHO growth references core sample. Anthropol. Noteb. 2019, 25, 55–67. [Google Scholar]
- Masanovic, B. Comparative Study of Morphological Characteristics and Body Composition between Different Team Players from Serbian Junior National League: Soccer, Handball, Basketball and Volleyball. Int. J. Morphol. 2019, 37, 612–619. [Google Scholar] [CrossRef] [Green Version]
- Gardasevic, J.; Vasiljevic, I.; Bjelica, D.; Popovic, S. Analysis of nutrition of boys and girls, adolescents from Montenegro. J. Phys. Educ. Sport 2015, 15, 702–704. [Google Scholar]
- Zovko, I.C.; Mitrovic, M.; Corluka, M. Comparative Analysis of Anthropometric Parameters as Obesity Indicators for Sixth Grade Boys from Different Regions in Montenegro. J. Anthropol. Sport Phys. Educ. 2020, 4, 27–31. [Google Scholar]
- Gardasevic, J.; Martinovic, S.; Vasiljevic, I.; Bubanja, M.; Malovic, P.; Vrevic, E. Analysis of Trends in Anthropometric Characteristics of Montenegrin Young Men from Niksic from 1957 to 1969. Sport Mont 2020, 18, 55–59. [Google Scholar] [CrossRef]
- Masanovic, B.; Martinovic, S.; Zoric, G.; Bacovic, D.; Mitrovic, M.; Vukotic, M.; Defence, P.M.O. Trends in Body Height, Body Weight, and Body Mass Index from 1979 to 1987: An Analysis of the Young Male Population from the Municipality of Cetinje. J. Anthr. Sport Phys. Educ. 2020, 4, 3–7. [Google Scholar] [CrossRef]
- Popovic, S.; Masanovic, B.; Martinovic, S.; Bjelica, D.; Gardasevic, J. Trajectories in Body Height, Body Weight, BMI, and Nutrition Status from 1979 to 1987: A Measurement-Based Analysis of 15,717 Male Adolescents from the Capital City of Montenegro. Front. Public Health 2020, 8. [Google Scholar] [CrossRef] [PubMed]
- Vasiljevic, I.; Martinovic, S.; Gardasevic, J.; Bubanja, M.; Malovic, P.; Vrevic, E.; Redzepagic, S. Analysis of Trends in Anthropometric Characteristics of Montenegrin Recruits from Bar in Period from 1979 to 1987. J. Anthr. Sport Phys. Educ. 2020, 4, 3–7. [Google Scholar] [CrossRef]
- American College of Sports Medicine. ACSM’s Health-Related Physical Fitness Assessment Manual; Wolters Kluwer: Boston, MA, USA, 2013. [Google Scholar]
- Cole, T.J.; Lobstein, T. Extended international (IOTF) body mass index cut-offs for thinness, overweight and obesity. Pediatr. Obes. 2012, 7, 284–294. [Google Scholar] [CrossRef] [PubMed]
- World Health Organization. Nutrition Landscape Information System (NLIS) Country Profile Indicators: Interpretation Guide; WHO: Geneva, Switzerland, 2010. [Google Scholar]
- Cole, T. The secular trend in human physical growth: A biological view. Econ. Hum. Biol. 2003, 1, 161–168. [Google Scholar] [CrossRef]
- Kolodziej, H.; Lopuszańska, M.; Lipowicz, A.; Szklarska, A.; Bielicki, T. Secular trends in body height and body mass in 19-year-old polish men based on six national surveys from 1965 to 2010. Am. J. Hum. Biol. 2015, 27, 704–709. [Google Scholar] [CrossRef]
- Lopuszanska-Dawid, M.; Kołodziej, H.; Lipowicz, A.; Szklarska, A.; Kopiczko, A.; Bielicki, T. Social class-specific secu-lar trends in height among 19-year old Polish men: 6th national surveys from 1965 till 2010. Econ. Hum. Biol. 2020, 37, 100832. [Google Scholar] [CrossRef]
- Kalka, E.; Pastuszak, A.; Busko, K. Secular trends in body height, body weight, BMI and fat percentage in Polish uni-versity students in a period of 50 years. PLoS ONE 2019, 14, e0220514. [Google Scholar] [CrossRef] [Green Version]
- Coon, C. The Races of Europe; Macmillan Publishers: New York, NY, USA, 1939. [Google Scholar]
- Bjelica, D.; Popovic, S.; Kezunovic, M.; Petkovic, J.; Jurak, G.; Grasgruber, P. Body Height and Its Estimation Utilizing Arm Span Measurements in Montenegrin Adults. Anthropol. Noteb. 2012, 18, 69–83. [Google Scholar]
- Bešlin, M.; Duda, I.; Gligorov, V.; Goldstein, I.; Jakovina, T.; Jančeva, L.; Kamberović, H.; Limani, M.; Litovski, A.; Ma-kuljević, N.; et al. Jugoslavija u Istorijskoj Perspektivi; Helsinški Odbor za Ljudska Prava u Srbiji: Belgrade, Serbia, 2017. [Google Scholar]
- NCD Risk Factor Collaboration. Worldwide trends in body-mass index, underweight, overweight, and obesity from 1975 to 2016: A pooled analysis of 2416 population-based measurement studies in 128•9 million children, adolescents, and adults. Lancet 2017, 390, 2627–2642. [Google Scholar] [CrossRef] [Green Version]
- Marinsek, M.; Blazevic, I.; Liposek, S. Factors Affecting Critical Features of Fundamental Movement Skills in Young Children. Montenegrin J. Sports Sci. Med. 2019, 8, 27–32. [Google Scholar] [CrossRef]
- Mitrovic, M.; Dragutinovic, K. Comparative Analysis of Anthropometric Parameters as Obesity Indicators for 7-8 Years-old Children of Different Resident Status. J. Anthropol. Sport Phys. Educ. 2020, 4, 43–46. [Google Scholar] [CrossRef]
- Popovic, S.; Bjelica, D.; Molnar, S.; Jaksic, D.; Akpinar, S. Body Height and Its Estimation Utilizing Arm Span Meas-urements in Serbian Adults. Int. J. Morphol. 2013, 31, 271–279. [Google Scholar] [CrossRef] [Green Version]
- Masanovic, B.; Bavcevic, T.; Prskalo, I. Regional Differences in Adult Body Height in Kosovo. Montenegrin J. Sports Sci. Med. 2019, 8, 69–76. [Google Scholar] [CrossRef]


| Mean ± SD | ||||
|---|---|---|---|---|
| Year of Birth | Age (years) | Body Height (cm) | Body Weight (kg) | Body Mass Index (kg/m2) |
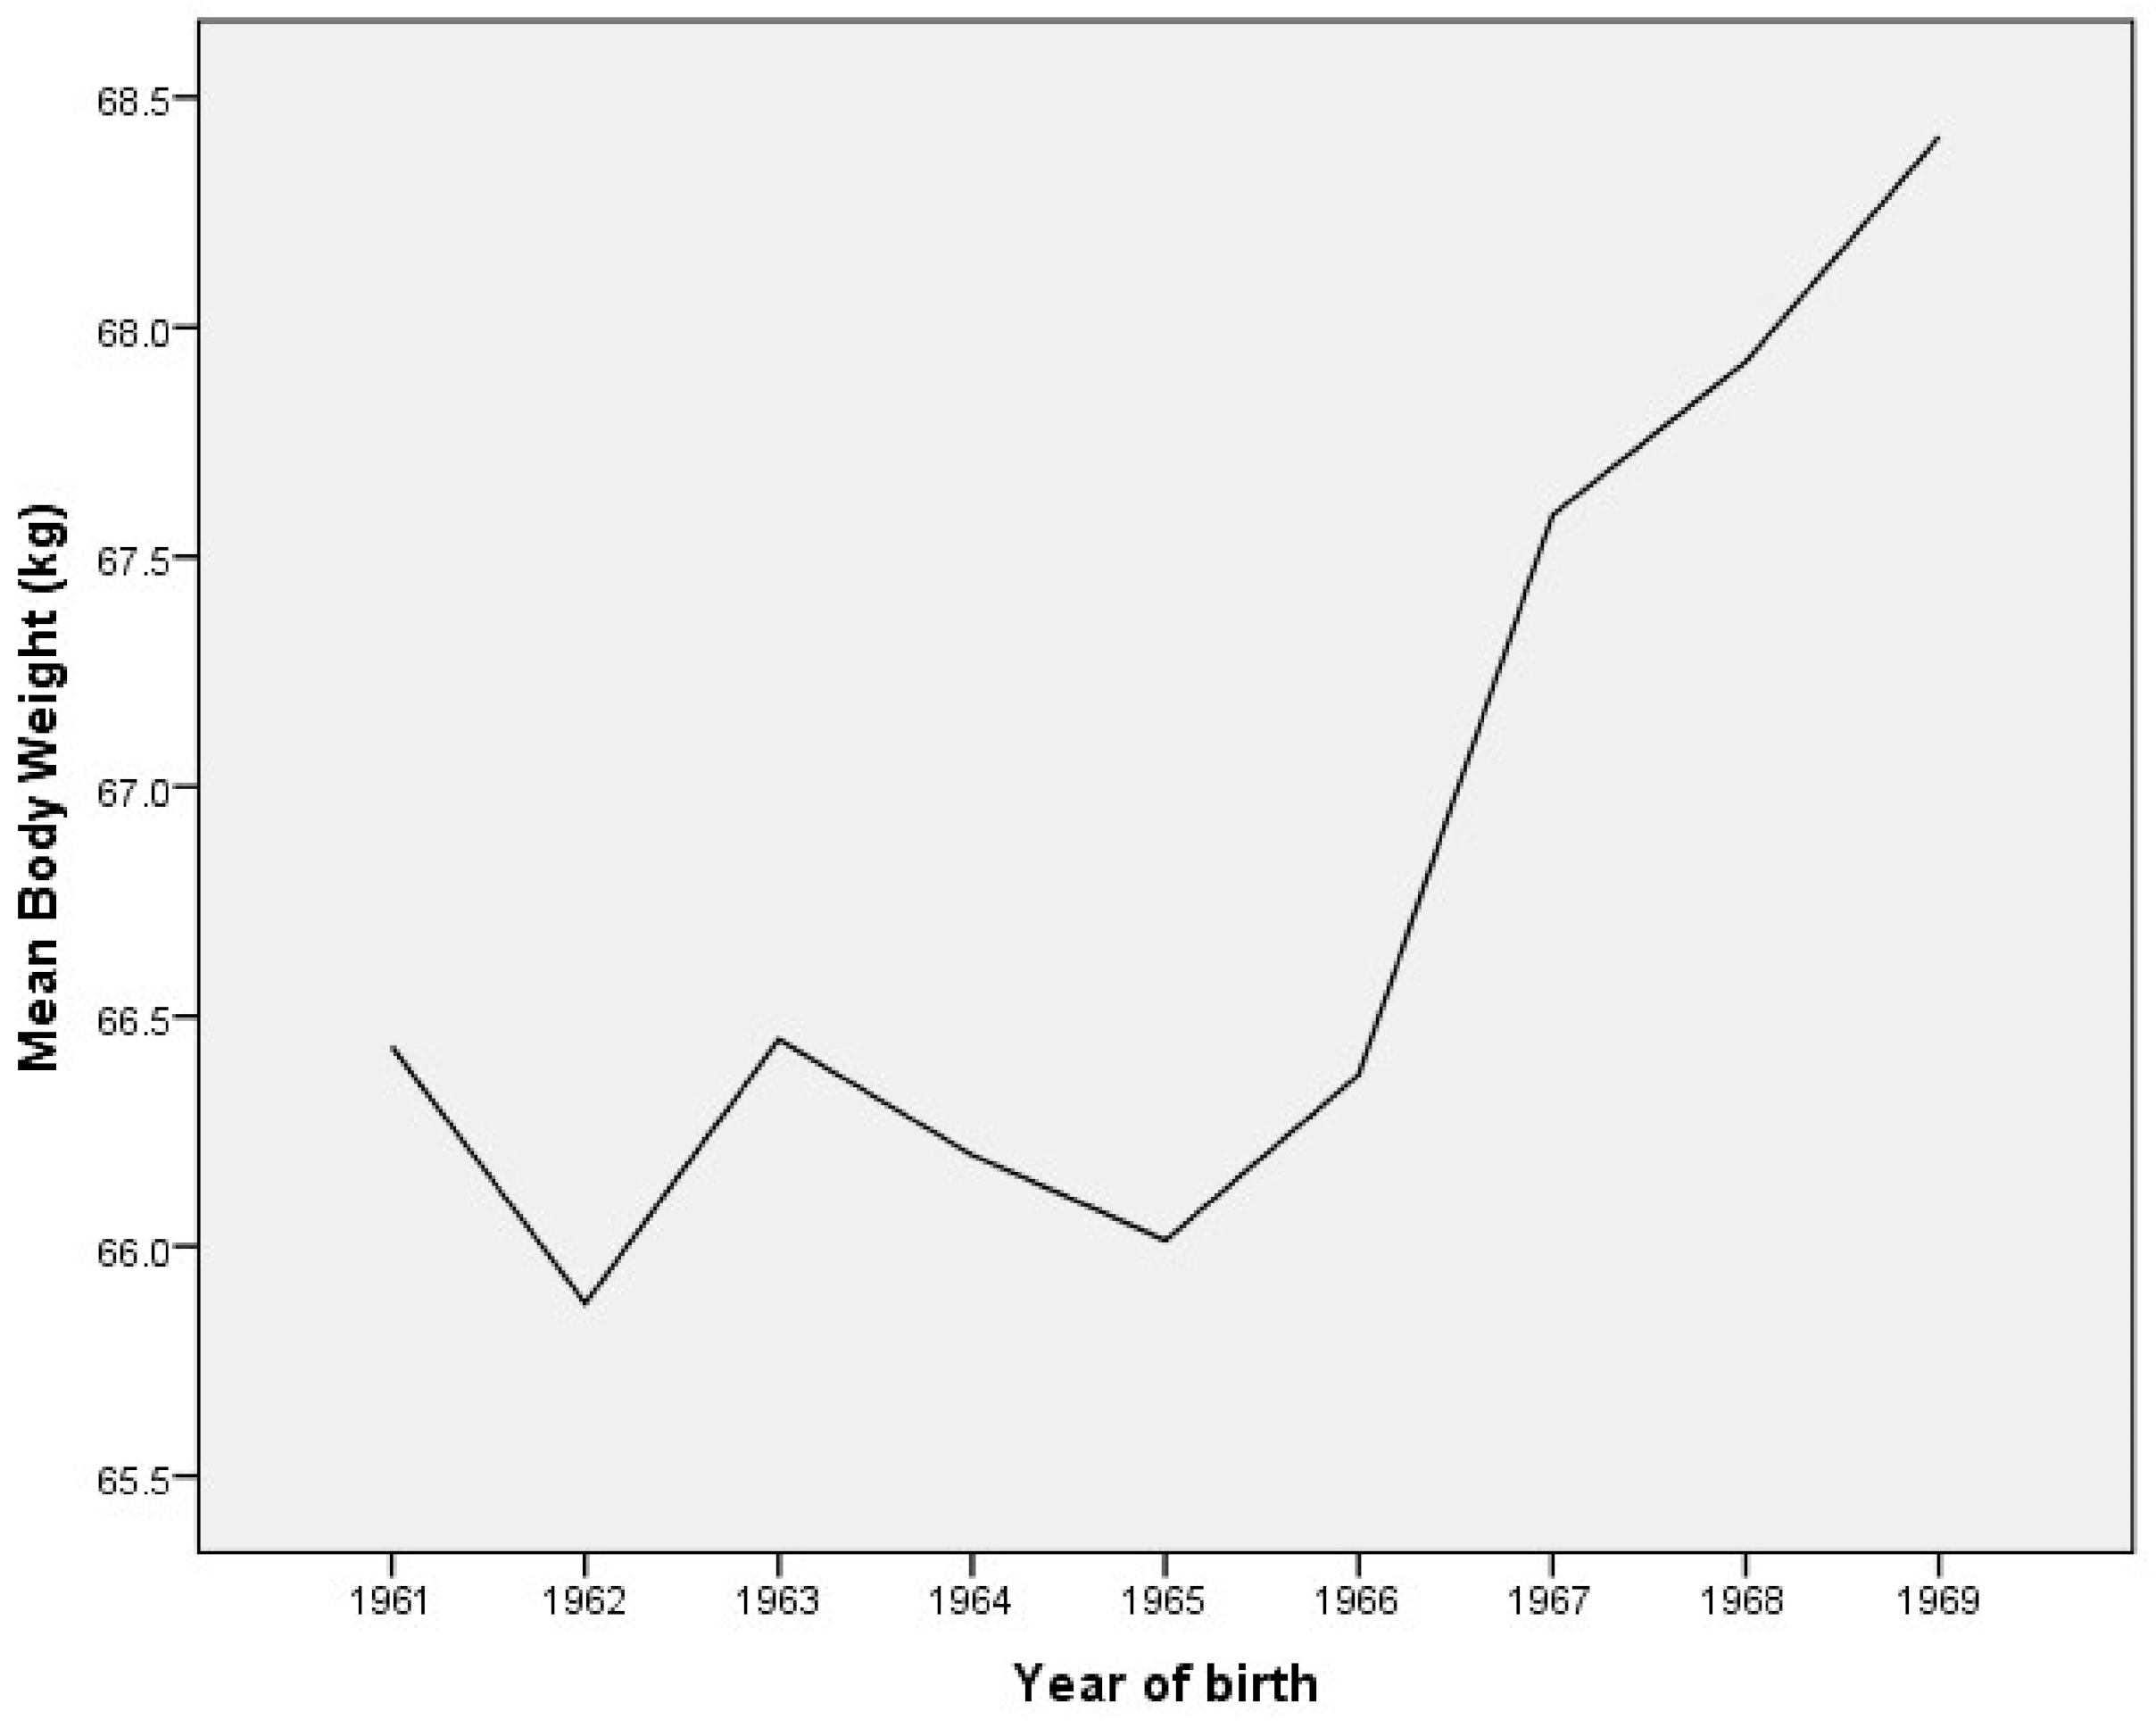
| 1961 (n = 585) | 18.13 ± 0.68 | 175.14 ± 6.72 | 66.43 ± 8.26 | 21.62 ± 2.12 |
| 1962 (n = 1148) | 17.89 ± 0.44 | 174.95 ± 6.61 | 65.88 ± 7.65 | 21.50 ± 2.04 |
| 1963 (n = 1178) | 18.46 ± 0.92 | 175.82 ± 6.79 | 66.45 ± 8.16 | 21.47 ± 2.06 |
| 1964 (n = 630) | 17.85 ± 0.42 | 176.52 ± 7.17 | 66.20 ± 8.13 | 21.24 ± 2.26 |
| 1965 (n = 1168) | 17.86 ± 0.37 | 174.79 ± 6.61 | 66.01 ± 8.20 | 21.59 ± 2.26 |
| 1966 (n = 993) | 18.05 ± 0.38 | 175.51 ± 6.83 | 66.37 ± 8.37 | 21.52 ± 2.18 |
| 1967 (n = 1073) | 18.22 ± 0.37 | 176.22 ± 6.27 | 67.59 ± 8.33 | 21.75 ± 2.28 |
| 1968 (n = 1052) | 18.21 ± 0.22 | 176.54 ± 6.83 | 67.92 ± 8.37 | 21.79 ± 2.36 |
| 1969 (n = 913) | 18.38 ± 0.21 | 178.90 ± 6.51 | 68.41 ± 8.75 | 21.37 ± 2.44 |
| 1961–1969 (n = 8740) | 18.12 ± 0.54 | 175.99 ± 6.78 | 66.81 ± 8.28 | 21.55 ± 2.23 |
| Year of Birth | 1961 | 1962 | 1963 | 1964 | 1965 | 1966 | 1967 | 1968 |
|---|---|---|---|---|---|---|---|---|
| 1962 | 0.578 | |||||||
| 1963 | 0.046 | 0.002 | ||||||
| 1964 | 0.000 | 0.000 | 0.033 | |||||
| 1965 | 0.291 | 0.544 | 0.000 | 0.000 | ||||
| 1966 | 0.296 | 0.056 | 0.281 | 0.003 | 0.012 | |||
| 1967 | 0.002 | 0.000 | 0.156 | 0.367 | 0.000 | 0.016 | ||
| 1968 | 0.000 | 0.000 | 0.011 | 0.957 | 0.000 | 0.000 | 0.269 | |
| 1969 | 0.000 | 0.000 | 0.000 | 0.000 | 0.000 | 0.000 | 0.000 | 0.000 |
| F = 33.267; p = 0.000 | ||||||||
| Year of Birth | 1961 | 1962 | 1963 | 1964 | 1965 | 1966 | 1967 | 1968 |
|---|---|---|---|---|---|---|---|---|
| 1962 | 0.182 | |||||||
| 1963 | 0.970 | 0.093 | ||||||
| 1964 | 0.618 | 0.429 | 0.536 | |||||
| 1965 | 0.313 | 0.688 | 0.199 | 0.649 | ||||
| 1966 | 0.888 | 0.163 | 0.830 | 0.676 | 0.310 | |||
| 1967 | 0.006 | 0.000 | 0.001 | 0.001 | 0.000 | 0.001 | ||
| 1968 | 0.000 | 0.000 | 0.000 | 0.000 | 0.000 | 0.000 | 0.350 | |
| 1969 | 0.000 | 0.000 | 0.000 | 0.000 | 0.000 | 0.000 | 0.027 | 0.189 |
| F = 12.365; p = 0.000 | ||||||||
| Year of Birth | 1961 | 1962 | 1963 | 1964 | 1965 | 1966 | 1967 | 1968 |
|---|---|---|---|---|---|---|---|---|
| 1962 | 0.288 | |||||||
| 1963 | 0.164 | 0.693 | ||||||
| 1964 | 0.002 | 0.016 | 0.036 | |||||
| 1965 | 0.748 | 0.365 | 0.190 | 0.001 | ||||
| 1966 | 0.376 | 0.857 | 0.574 | 0.012 | 0.489 | |||
| 1967 | 0.272 | 0.009 | 0.003 | 0.000 | 0.086 | 0.020 | ||
| 1968 | 0.156 | 0.003 | 0.001 | 0.000 | 0.036 | 0.007 | 0.701 | |
| 1969 | 0.030 | 0.171 | 0.315 | 0.255 | 0.026 | 0.135 | 0.000 | 0.000 |
| F = 5.282; p = 0.000 | ||||||||
| Year of Birth | Total | Underweight | Normal Weight | Pre-Obese | Obese | ||||
|---|---|---|---|---|---|---|---|---|---|
| n | n | % | n | % | n | % | n | % | |
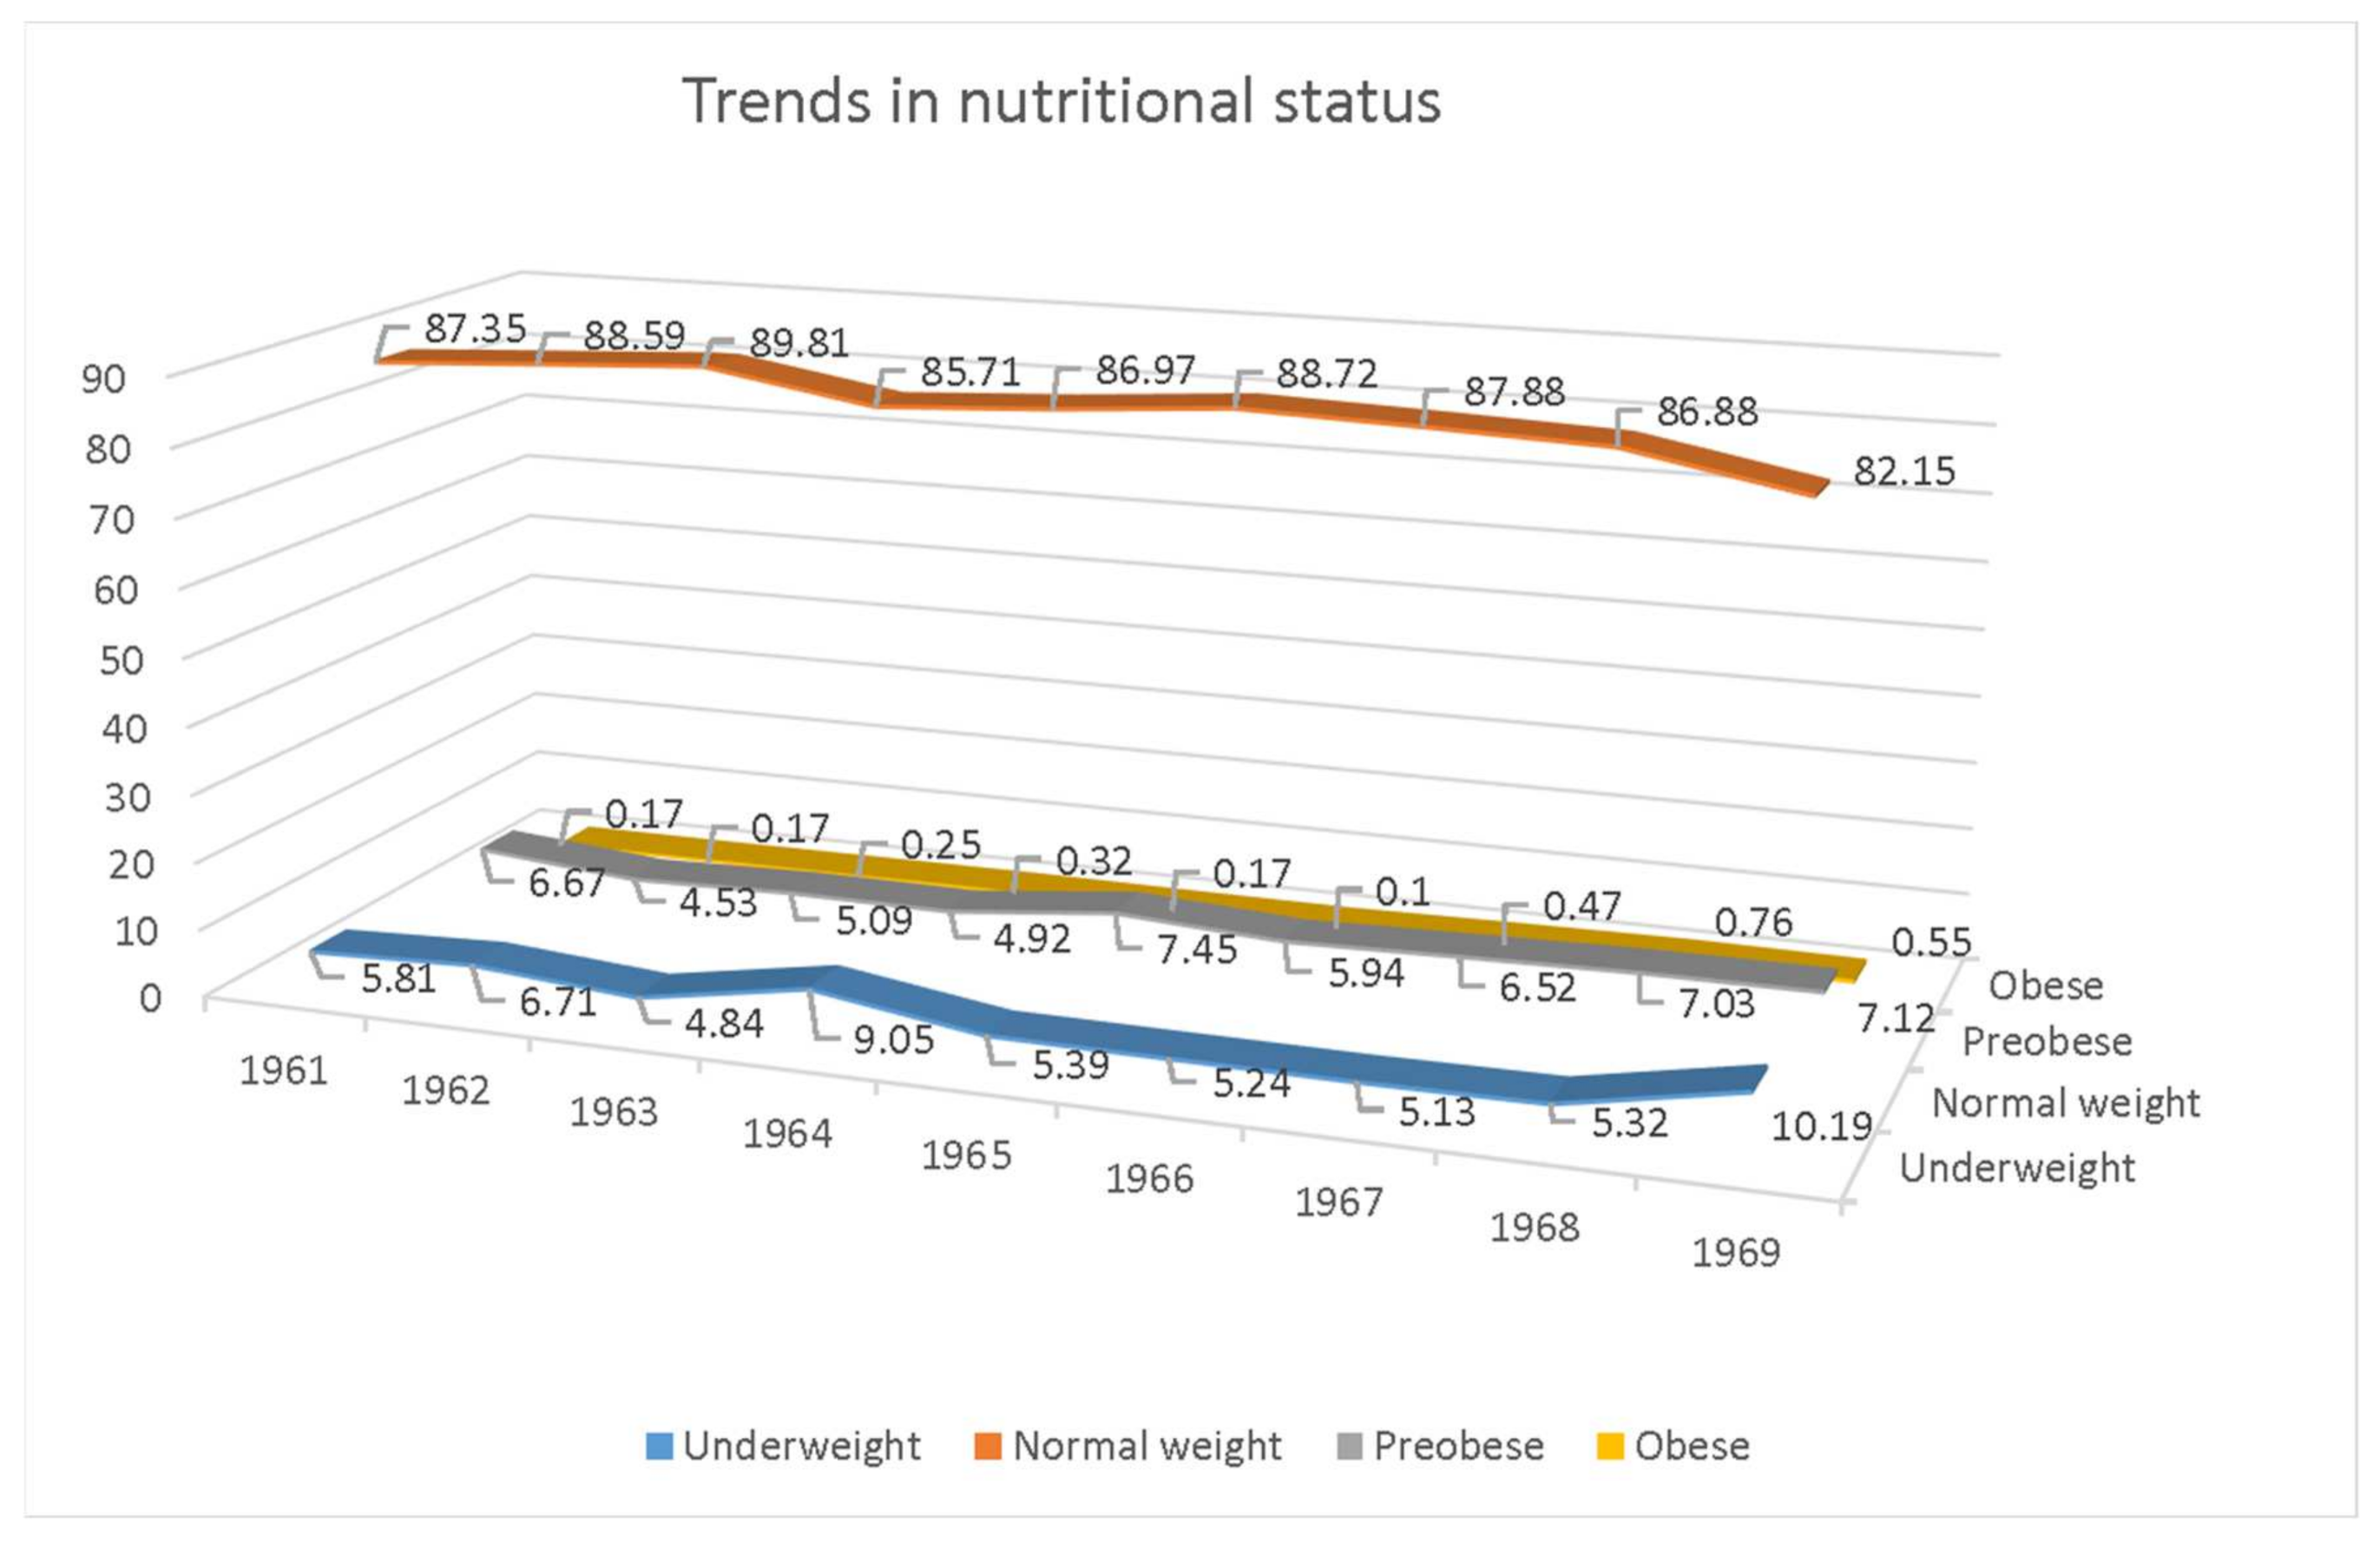
| 1961 | (n = 585) | 34 | 5.81 | 511 | 87.35 | 39 | 6.67 | 1 | 0.17 |
| 1962 | (n = 1148) | 77 | 6.71 | 1017 | 88.59 | 52 | 4.53 | 2 | 0.17 |
| 1963 | (n = 1178) | 57 | 4.84 | 1058 | 89.81 | 60 | 5.09 | 3 | 0.25 |
| 1964 | (n = 630) | 57 | 9.05 | 540 | 85.71 | 31 | 4.92 | 2 | 0.32 |
| 1965 | (n = 1168) | 63 | 5.39 | 1016 | 86.97 | 87 | 7.45 | 2 | 0.17 |
| 1966 | (n = 993) | 52 | 5.24 | 881 | 88.72 | 59 | 5.94 | 1 | 0.10 |
| 1967 | (n = 1073) | 55 | 5.13 | 943 | 87.88 | 70 | 6.52 | 5 | 0.47 |
| 1968 | (n = 1052) | 56 | 5.32 | 914 | 86.88 | 74 | 7.03 | 8 | 0.76 |
| 1969 | (n = 913) | 93 | 10.19 | 750 | 82.15 | 65 | 7.12 | 5 | 0.55 |
| 1961–1969 | (n = 8740) | 544 | 6.22 | 7630 | 87.30 | 537 | 6.14 | 29 | 0.33 |
Publisher’s Note: MDPI stays neutral with regard to jurisdictional claims in published maps and institutional affiliations. |
© 2021 by the authors. Licensee MDPI, Basel, Switzerland. This article is an open access article distributed under the terms and conditions of the Creative Commons Attribution (CC BY) license (https://creativecommons.org/licenses/by/4.0/).
Share and Cite
Bjelica, D.; Gardasevic, J.; Milosevic, Z.; Bozic, P.R.; Masanovic, B. Trajectories of Body Height, Body Weight, BMI, and Nutrition Status from 1979 to 1987: A Measurement-Based Analysis of 8740 Montenegrin Male Adolescents from the Municipality of Berane. Int. J. Environ. Res. Public Health 2021, 18, 5490. https://0-doi-org.brum.beds.ac.uk/10.3390/ijerph18105490
Bjelica D, Gardasevic J, Milosevic Z, Bozic PR, Masanovic B. Trajectories of Body Height, Body Weight, BMI, and Nutrition Status from 1979 to 1987: A Measurement-Based Analysis of 8740 Montenegrin Male Adolescents from the Municipality of Berane. International Journal of Environmental Research and Public Health. 2021; 18(10):5490. https://0-doi-org.brum.beds.ac.uk/10.3390/ijerph18105490
Chicago/Turabian StyleBjelica, Dusko, Jovan Gardasevic, Zoran Milosevic, Predrag R. Bozic, and Bojan Masanovic. 2021. "Trajectories of Body Height, Body Weight, BMI, and Nutrition Status from 1979 to 1987: A Measurement-Based Analysis of 8740 Montenegrin Male Adolescents from the Municipality of Berane" International Journal of Environmental Research and Public Health 18, no. 10: 5490. https://0-doi-org.brum.beds.ac.uk/10.3390/ijerph18105490