Article

Oncogenic Role of miR-200c-3p in High-Grade Serous Ovarian Cancer Progression via Targeting the 3′-Untranslated Region of DLC1

by
Sheril June Ankasha
1,
Mohamad Nasir Shafiee
2,
Norhazlina Abdul Wahab
1,
Raja Affendi Raja Ali
3 and
Norfilza Mohd Mokhtar
1,*
1
Department of Physiology, Faculty of Medicine, Universiti Kebangsaan Malaysia, Jalan Yaacob Latif, Bandar Tun Razak, Cheras, Kuala Lumpur 56000, Malaysia
2
Department of Obstetrics and Gynaecology, Faculty of Medicine, Universiti Kebangsaan Malaysia, Jalan Yaacob Latif, Bandar Tun Razak, Cheras, Kuala Lumpur 56000, Malaysia
3
Gastroenterology Unit, Department of Medicine, Faculty of Medicine, Universiti Kebangsaan Malaysia, Jalan Yaacob Latif, Bandar Tun Razak, Cheras, Kuala Lumpur 56000, Malaysia
*
Author to whom correspondence should be addressed.
Int. J. Environ. Res. Public Health 2021, 18(11), 5741; https://0-doi-org.brum.beds.ac.uk/10.3390/ijerph18115741
Submission received: 31 March 2021 / Revised: 18 May 2021 / Accepted: 19 May 2021 / Published: 27 May 2021
(This article belongs to the Special Issue Ovarian Cancer and Female Health)

Abstract

:
High-grade serous ovarian cancer (HGSC) is the most common ovarian cancer with highly metastatic properties. A small non-coding RNA, microRNA (miRNA) was discovered to be a major regulator in many types of cancers through binding at the 3′-untranslated region (3′UTR), leading to degradation of the mRNA. In this study, we sought to investigate the underlying mechanisms involved in the dysregulation of miR-200c-3p in HGSC progression and metastasis. We identified the upregulation of miR-200c-3p expression in different stages of HGSC clinical samples and the downregulation of the tumor suppressor gene, Deleted in Liver Cancer 1 (DLC1), expression. Over expression of miR-200c-3p in HGSC cell lines downregulated DLC1 but upregulated the epithelial marker, E-cadherin (CDH1). Based on in silico analysis, two putative binding sites were found within the 3′UTR of DLC1, and we confirmed the direct binding of miR-200c-3p to the target binding motif at position 1488–1495 bp of 3′UTR of DLC1 by luciferase reporter assay in a SKOV3 cell line co-transfected with vectors and miR-200c-3p mimic. These data showed that miR-200c-3p regulated the progression of HGSC by regulating DLC1 expression post-transcription and can be considered as a promising target for therapeutic purposes.

1. Introduction

Ovarian cancer is the fifth most common cancer in women, and is the leading cause of death for patients with gynecological cancer. High levels of genetic and molecular heterogeneity are reported for epithelial ovarian cancer (EOC), and these epithelial cells can be transformed into different histological subtypes, either resembling the fallopian tube layer (serous, 52%), endometrium (endometrioid, 10%), endocervix glands (mucinous, 6%), or other vaginal cells (6%); the rest are rare histotypes [1,2].
Serous ovarian cancer (SOC) is classified into two categories, namely low-grade serous carcinoma (LGSC), which is a prototype for type I ovarian cancer and comprises less than five percent of EOC cases, and high-grade serous carcinoma (HGSC), which is a prototype for type II ovarian cancer. LGSC patients are often diagnosed at an early stage (stage I or II) with low mortality rates and tumor growth. Hence, the prognosis for this category is better, compared to HGSC [3,4,5]. About 70% to 80% of the total EOC subtypes are HGSC and are frequently associated with TP53 mutation [6]. Patients are often diagnosed at a late stage, either stage III or IV, in which the tumor growth rate is aggressive and has spread to omentum and mesenteric areas. The condition leads to a low patient survival rate, with a 10-year mortality rate of 70% [2,4,5,7]. Therefore, extensive research and a better understanding of the molecular changes in the progression and metastatic process in HGSC are crucial, in order to develop a more effective therapeutic approach to overcoming this life-threatening disease [8,9].
MicroRNAs (miRNAs) are small non-coding RNA, approximately 20–22 nucleotides in length. They recognize and bind to partial complementary sequences of the messenger RNA (mRNA), commonly at the 3′ untranslated region (3′UTR) of the targeted gene, resulting in gene silencing through either mRNA cleavage or translation inhibition [10]. MiRNA plays an essential role in biological processes by negatively regulating gene expression of its targeted genes in normal and pathological cellular processes. In cancer, it can act either as oncogenic miRNAs (oncomiR) or tumor-suppressive miRNAs, based on their functional activities [11]. Growing evidence has indicated that the unique expression profiles for various cancer types could help in identifying tumor-specific miRNAs and their targeted genes for the development of novel molecular diagnostic and prognostic markers, especially in HGSC.
In order to predict miRNA targets, scientists frequently use in silico tools. This provides informative clues about miRNA biological targets, based on a number of criteria, such as complementary base-pairing, the thermodynamic stability of miRNA–mRNA duplex, conservation of target sites, and co-operative translation control and multiplicity of miRNA binding sites [12]. These in silico tools have enabled several predicted targets, with the assumptions that the sequences were functional sites [13].
Our previous miRNA profiling study identified a list of up and downregulated miRNAs in SOC and metastatic SOC (90% of samples were HGSC), where miR-200c-3p was significantly upregulated in SOC. DLC1 is one of the target genes of miR-200c-3p, since miRNAs can have several distinct targets in the same context [14,15]. We also found that Deleted in Liver Cancer 1 (DLC1) is the target gene, according to the in silico analysis [14]. In this current study, we decided to continue researching the role of miR-200c-3p regarding its targeted gene, DLC1, and tried to elucidate the underlying molecular mechanisms involved in the progression and metastasis of HGSC. An understanding of the interactions between miRNA–mRNA, and the validation of the targeted sites involved could potentially assist in miRNA-based drug development in the future.

2. Materials and Methods

2.1. Ethics Statement

The institutional ethics committee approved this study involving human tissue collection (reference no: UKM PPI/111/8/JEP-2017-268). All patients involved provided signed informed consent.

2.2. Human Tissues and Cell Lines

Twenty-nine specimens of early (stage I and II) and late (stage III and IV) stages of HGSC taken from primary ovarian tumor, and 21 unmatched normal ovarian surface tissues obtained from the Department of Obstetrics and Gynecology, Faculty of Medicine, Universiti Kebangsaan Malaysia Medical Centre (UKMMC), Malaysia, were snap frozen and stored at −80 °C. Written consent for tissue donation was obtained from every patient before surgery. The unmatched normal tissues were obtained from patients with a benign gynecological disorder who underwent total abdominal hysterectomy with bilateral salpingo-oophorectomy. Patients who underwent chemotherapy or those with secondary tumors were excluded from this study. All the cancer samples were then histologically verified by a pathologist using hematoxylin and eosin (H&E) staining to contain more than 80% malignant cells, while no cancer or inflammatory cells were detected in normal tissues.
Two human HGSC cell lines, primary tumor CAOV3 (ovarian adenocarcinoma) and metastatic SKOV3 (ovarian adenocarcinoma, ascites), were cultured in Dulbecco’s modified Eagle’s media in 4.5 g/L glucose (Invitrogen, Carlsbad, CA, USA) and McCoy’s 5A media (Invitrogen, Carlsbad, CA, USA) respectively, supplemented with 10% of fetal bovine serum (FBS) (Invitrogen, Carlsbad, CA, USA). Both cell lines were purchased from UKM Medical Molecular Biology Institute, Malaysia. All cell lines were maintained at 37 °C and 5% CO2 in a humidified incubator.

2.3. RNA isolation and quantitative Real Time-PCR (qRT-PCR)

Total RNA containing miRNA was isolated by using a miRNeasy kit (Qiagen, Germantown, CA, USA) according to the manufacturer’s protocol. The purity of the total RNA was assessed using a NanoDrop spectrophotometer (Thermo Scientific, Waltham, MA, USA) with criteria of purity met by A260/280 ratios of 1.8–2.1. Total RNA was then converted into cDNA and micDNA by using a RT2 First Strand kit and a miScript II RT kit (Qiagen, Germantown, CA, USA), respectively. Quantitative RT-PCR (qRT-PCR) was performed using an RT2 SYBR green PCR kit (Qiagen, Germantown, CA, USA) for mRNA and a miScript SYBR green PCR kit (Qiagen) for miRNA, using a CFX96 Real-Time System (BioRad, Hercules, CA, USA). We purchased primers for miR-200c-3p (catalog no. MS00003752) and the reference gene, RNU6 (catalog no. MS00033740), and primers for mRNA DLC1 (catalog no. PPH00438B), CDH1 (catalog no. PPH00135F), and the reference gene PPIA (catalog no. PPH01319G) from Qiagen. The relative expression was calculated using the 2-ΔΔCT method.

2.4. Transient miR-200c-3p transfection

Each HGSC cell line, CAOV3 and SKOV3, was cultured in 6-well plates with 5 × 10⁵ cells/well with antibiotic-free culture medium until reaching 70% confluence. Cells were then transiently transfected with 150 nM (with transfection efficiency 90%, Supplementary Figure S1) miRCURY LNA™ miR-200c-3p mimic or inhibitors, and their respective negative control (Exiqon, Vedbaek, Denmark), together with Lipofectamine® RNAimax (Invitrogen) and Opti-MEM® I without serum and antibiotic (Invitrogen, Carlsbad, CA, USA) for 48 h. Cells were then collected and we immediately continued with RNA extraction and protein extraction. The DLC1 mRNA and protein expression analyses were made using qRT-PCR and Western blot, respectively. All treatments were tested in biological triplicate.

2.5. Protein Extraction and Western Blot Assay

Each cell line was lysed with RIPA buffer with 0.1 M dithiothreitol, protease, and phosphatase inhibitors (Thermo Scientific, Waltham, MA, USA). The total protein was quantified using a BCA protein assay (Thermo Scientific, Waltham, MA, USA). The protein (25 µg) from each sample was loaded into 10% SDS-PAGE gel, separated by electrophoresis, and transferred onto a PVDF membrane (Biorad, Hercules, CA, USA). The membrane was blocked with 5% skimmed milk and incubated with primary antibody against DLC1 (Santa Cruz, CA, USA) and β-actin (Abcam, Cambridge, MA, USA) at 1:2000 overnight at 4 °C. Incubation with secondary antibody HRP (Abcam, Cambridge, MA, USA) at 1:5000 was performed on the next day for an hour at room temperature and visualized by chemiluminescence (ECL, Abcam, USA) with a gel doc Amersham Imager 6000 (GE Life Sciences, Buckinghamshire, UK). Band intensity on the PVDF membranes was analyzed with Image J software and normalized to β-actin level.

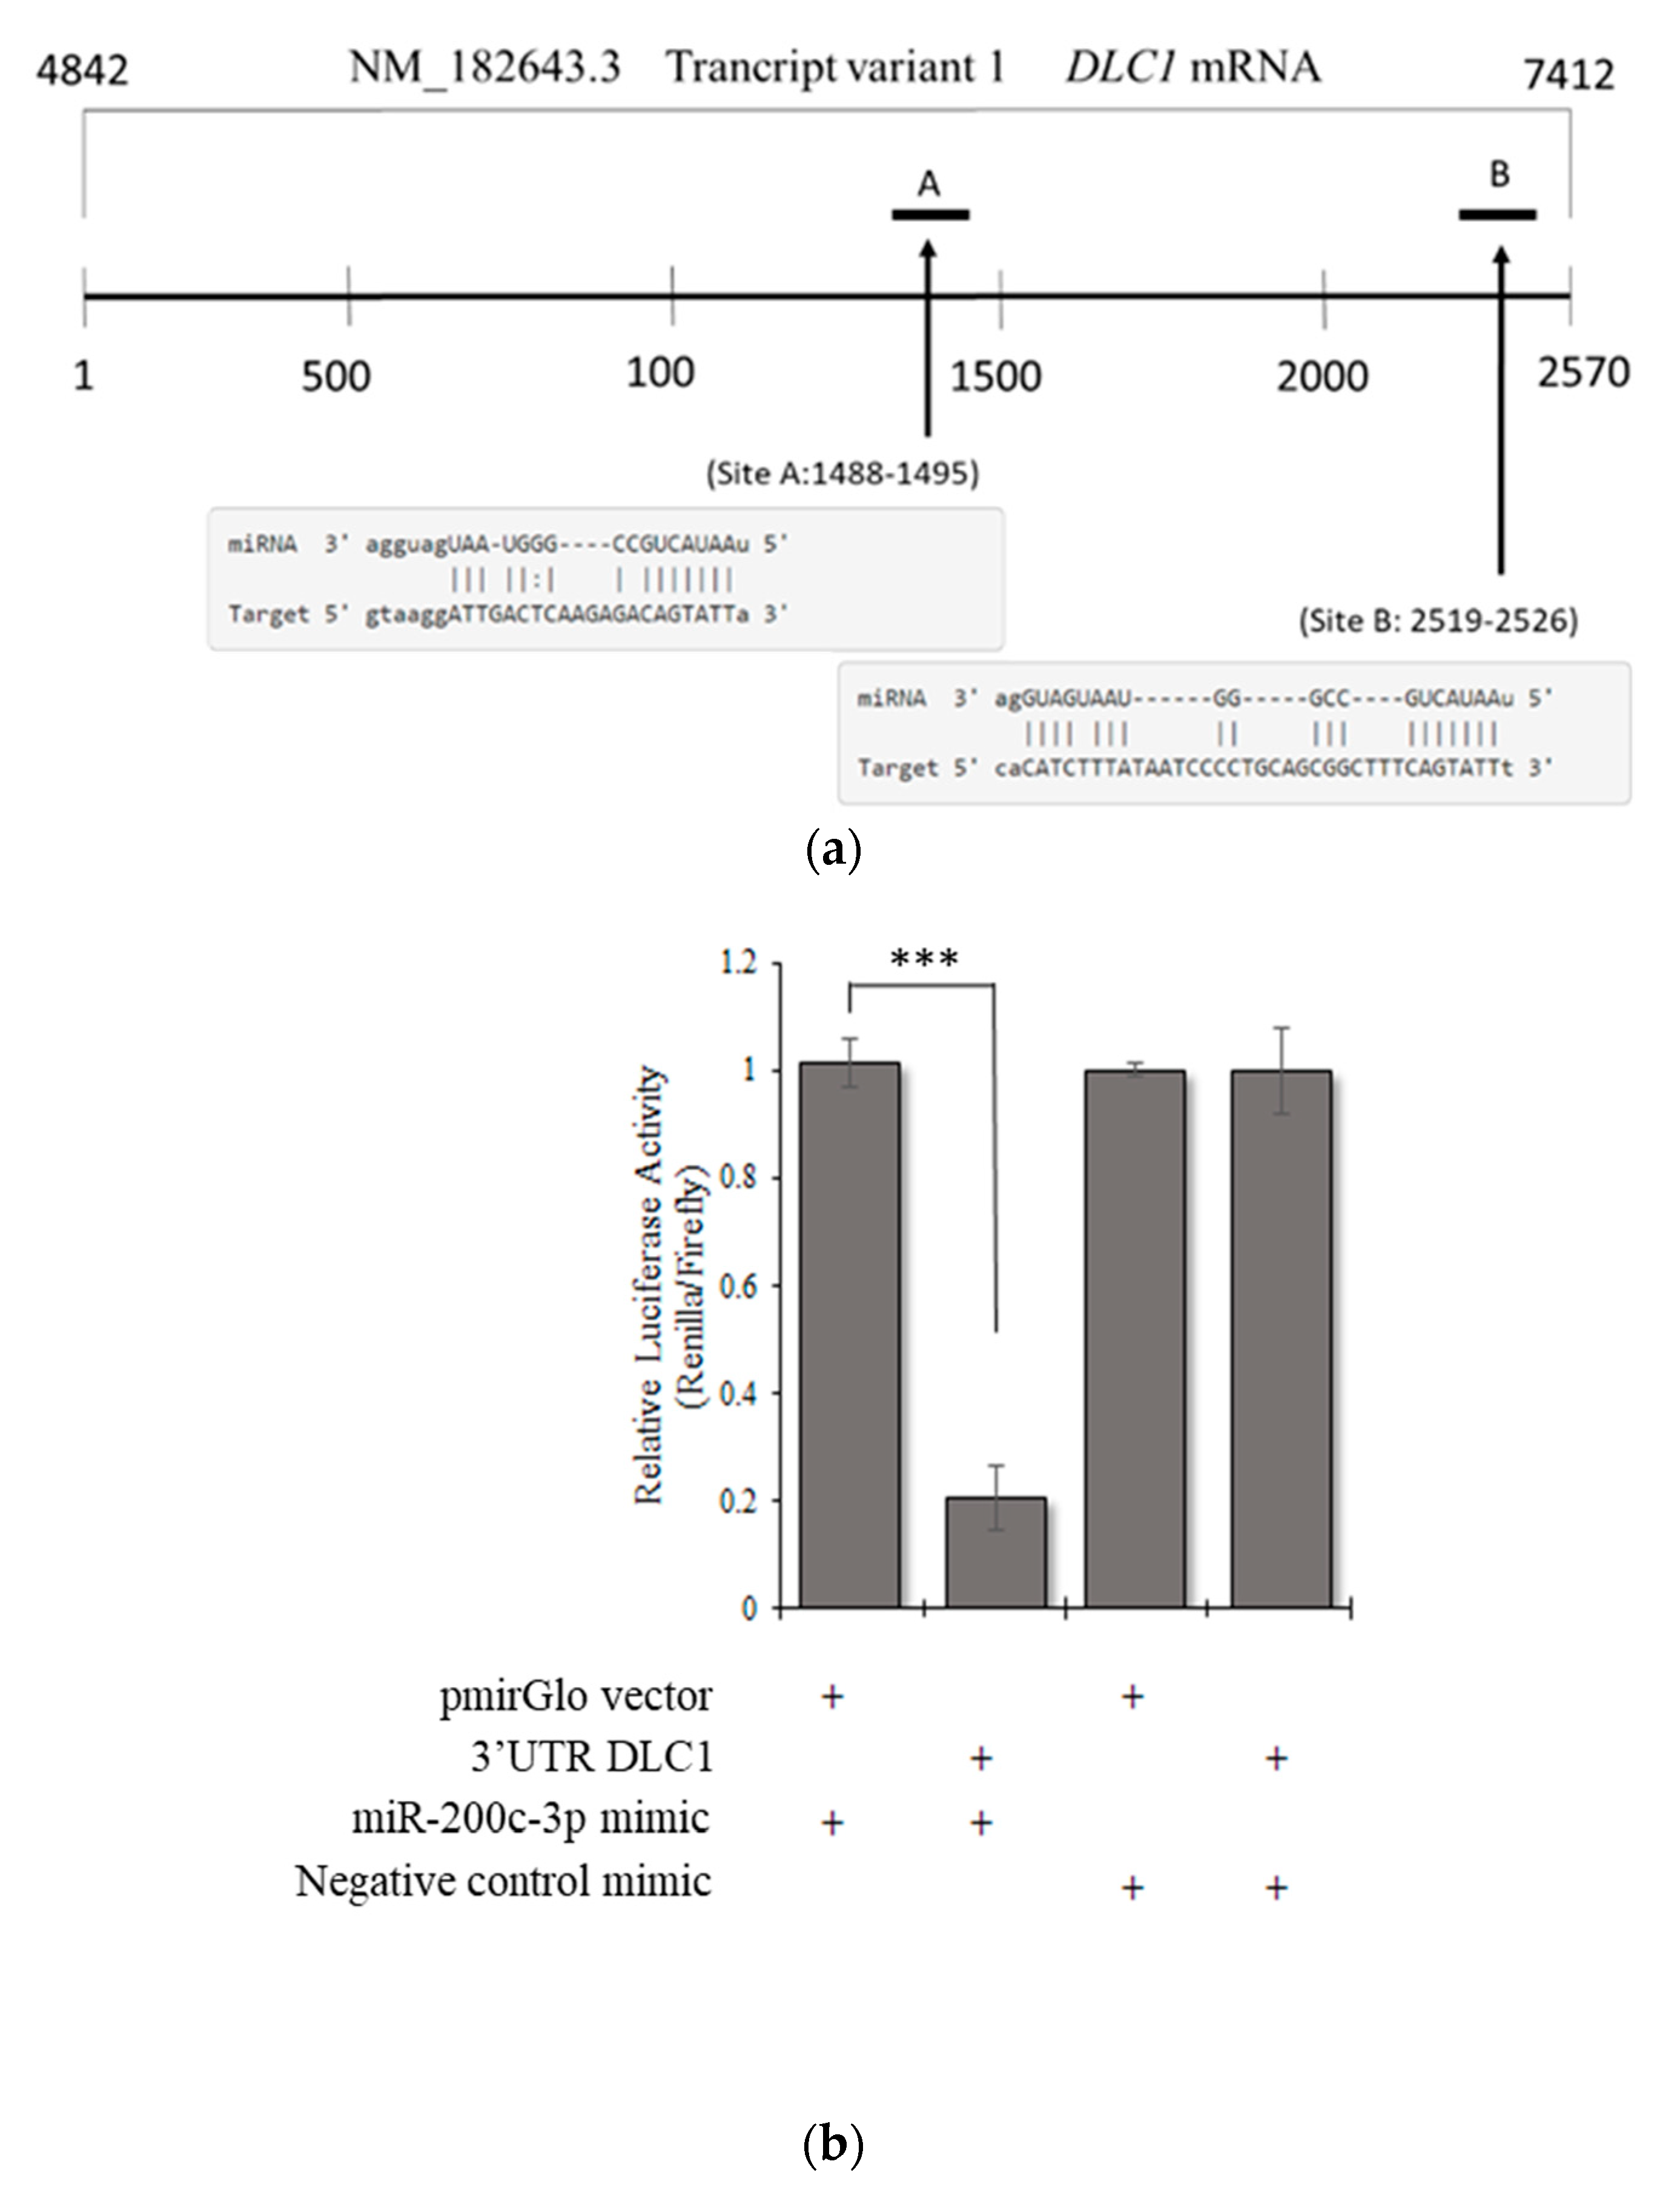
2.6. Prediction of miRNA target sites in the 3′UTR of DLC1

There are many methods and web-based services recently developed for the integrated analysis of miRNA and mRNA expression data. MicroRNA.org [16] and TargetScan [17] were used to find the target prediction of miR-200c-3p on the 3′UTR of DLC1.

2.7. Cloning of the 3′UTR of DLC1

The 3′UTR of DLC1 (nucleotides 4842–7412 of NM_182643.3) containing two putative miR-200c-3p binding sites were amplified from human genomic DNA. Then, reverse complement of 3′UTR of DLC1, and two additional wild-type (WT) sequences containing one of the binding sites were synthesized by PCR with the primers (Table 1). All forward and reverse primers contained SbfI and XbaI restriction enzyme sequence (underlined), respectively, at the 5′ end to produce flanking restriction sites at the end of the PCR products to facilitate cloning into the pmirGLO dual-luciferase miRNA target expression vector (Promega, Madison, WI, USA). All the amplicons and vectors were digested with SbfI and XbaI, ligated, and transformed into 10-beta competent E. coli (New England Biolabs, Ipswich, MA, USA) for cloning purposes.
Three additional sequences of 3′UTR with a mutant type (MT) deletion for both binding sites (MT-AB) and each of the two binding sites (MT-A and MT-B) were synthesized by PCR using a Phusion Site-Directed Mutagenesis Kit (Thermo Fisher Scientific, USA) with the following pair of primers: MT-A forward primer 5′-TTGTGTATGGATCAAAAGTG-3′ and reverse primer ‘5′-GAGTCAATCCTTACCATTAC-3′, MT-B forward primer 5′-TTGTACTTGTAGGCACCTAATAAATTTATTATTTGC-3′ and reverse primer 5′-AAAGCCGCTGCAGGGGAT-3′, and for MT-AB, primers’ MT-A were used with the template from MT-B.
Another four constructs with an isolated sequence containing two small regions of 3′UTR, namely, WT_A (46bp) and WT_B (53bp), and two mutant-type constructs with substitution mutated on the first three nucleotides of the seed sequence, i.e., MT_A (46bp) and MT_B (53 bp) were constructed (Table 2). All four vectors were constructed and validated by Gen Script, USA.

2.8. Luciferase Reporter Assay

SKOV3 cells (4 × 10⁵ cells/well) were cultured in 96-well plate and co-transfected with three pmol miR-200c-3p mimic or negative control, and 100 ng of either wild-type or mutant-type pmirGLO plasmid for 48 h using Lipofectamine 2000 (Invitrogen, Carlsbad, CA, USA). Cells were then assayed with a Dual-Luciferase Reporter Assay System (Promega, Madison, WI, USA) according to the manufacturers protocols. All treatments were tested in biological triplicate.

2.9. Statistical Analysis

All data were expressed as mean ± standard error of mean (SEM). Statistical analyses were performed using GraphPad Prism 5.0 (GraphPad Software, Inc., La Jolla, CA, USA). Student’s t-test analyzed the statistical significance between groups. Pearson’s correlation analysis determined the correlation between miR-200c-3p vs. DLC1.A difference with p < 0.05 was considered to be statistically significant.

3. Results

3.1. Clinical and Pathological Characteristics of Samples

We collected 29 primary ovarian tumor tissues from HGSC patients (17 and 12 samples were at the early and late stage, respectively) who met the inclusion criteria and 21 unmatched normal ovarian surface epithelium tissues from patients with benign gynecological diseases who underwent total abdominal hysterectomy with bilateral salpingo-oophorectomy, as the control. All the tissues obtained were histologically validated using hematoxylin and eosin (H&E) staining by a pathologist to confirm that the normal ovary tissue samples were free from cancer or inflammatory cells and that the cancer tissues contained more than 80% malignant cells. The inclusion criteria included patients with primary epithelial ovarian cancer, and who had not undergone chemotherapy. Table 3 shows a summary of the collected clinical samples.

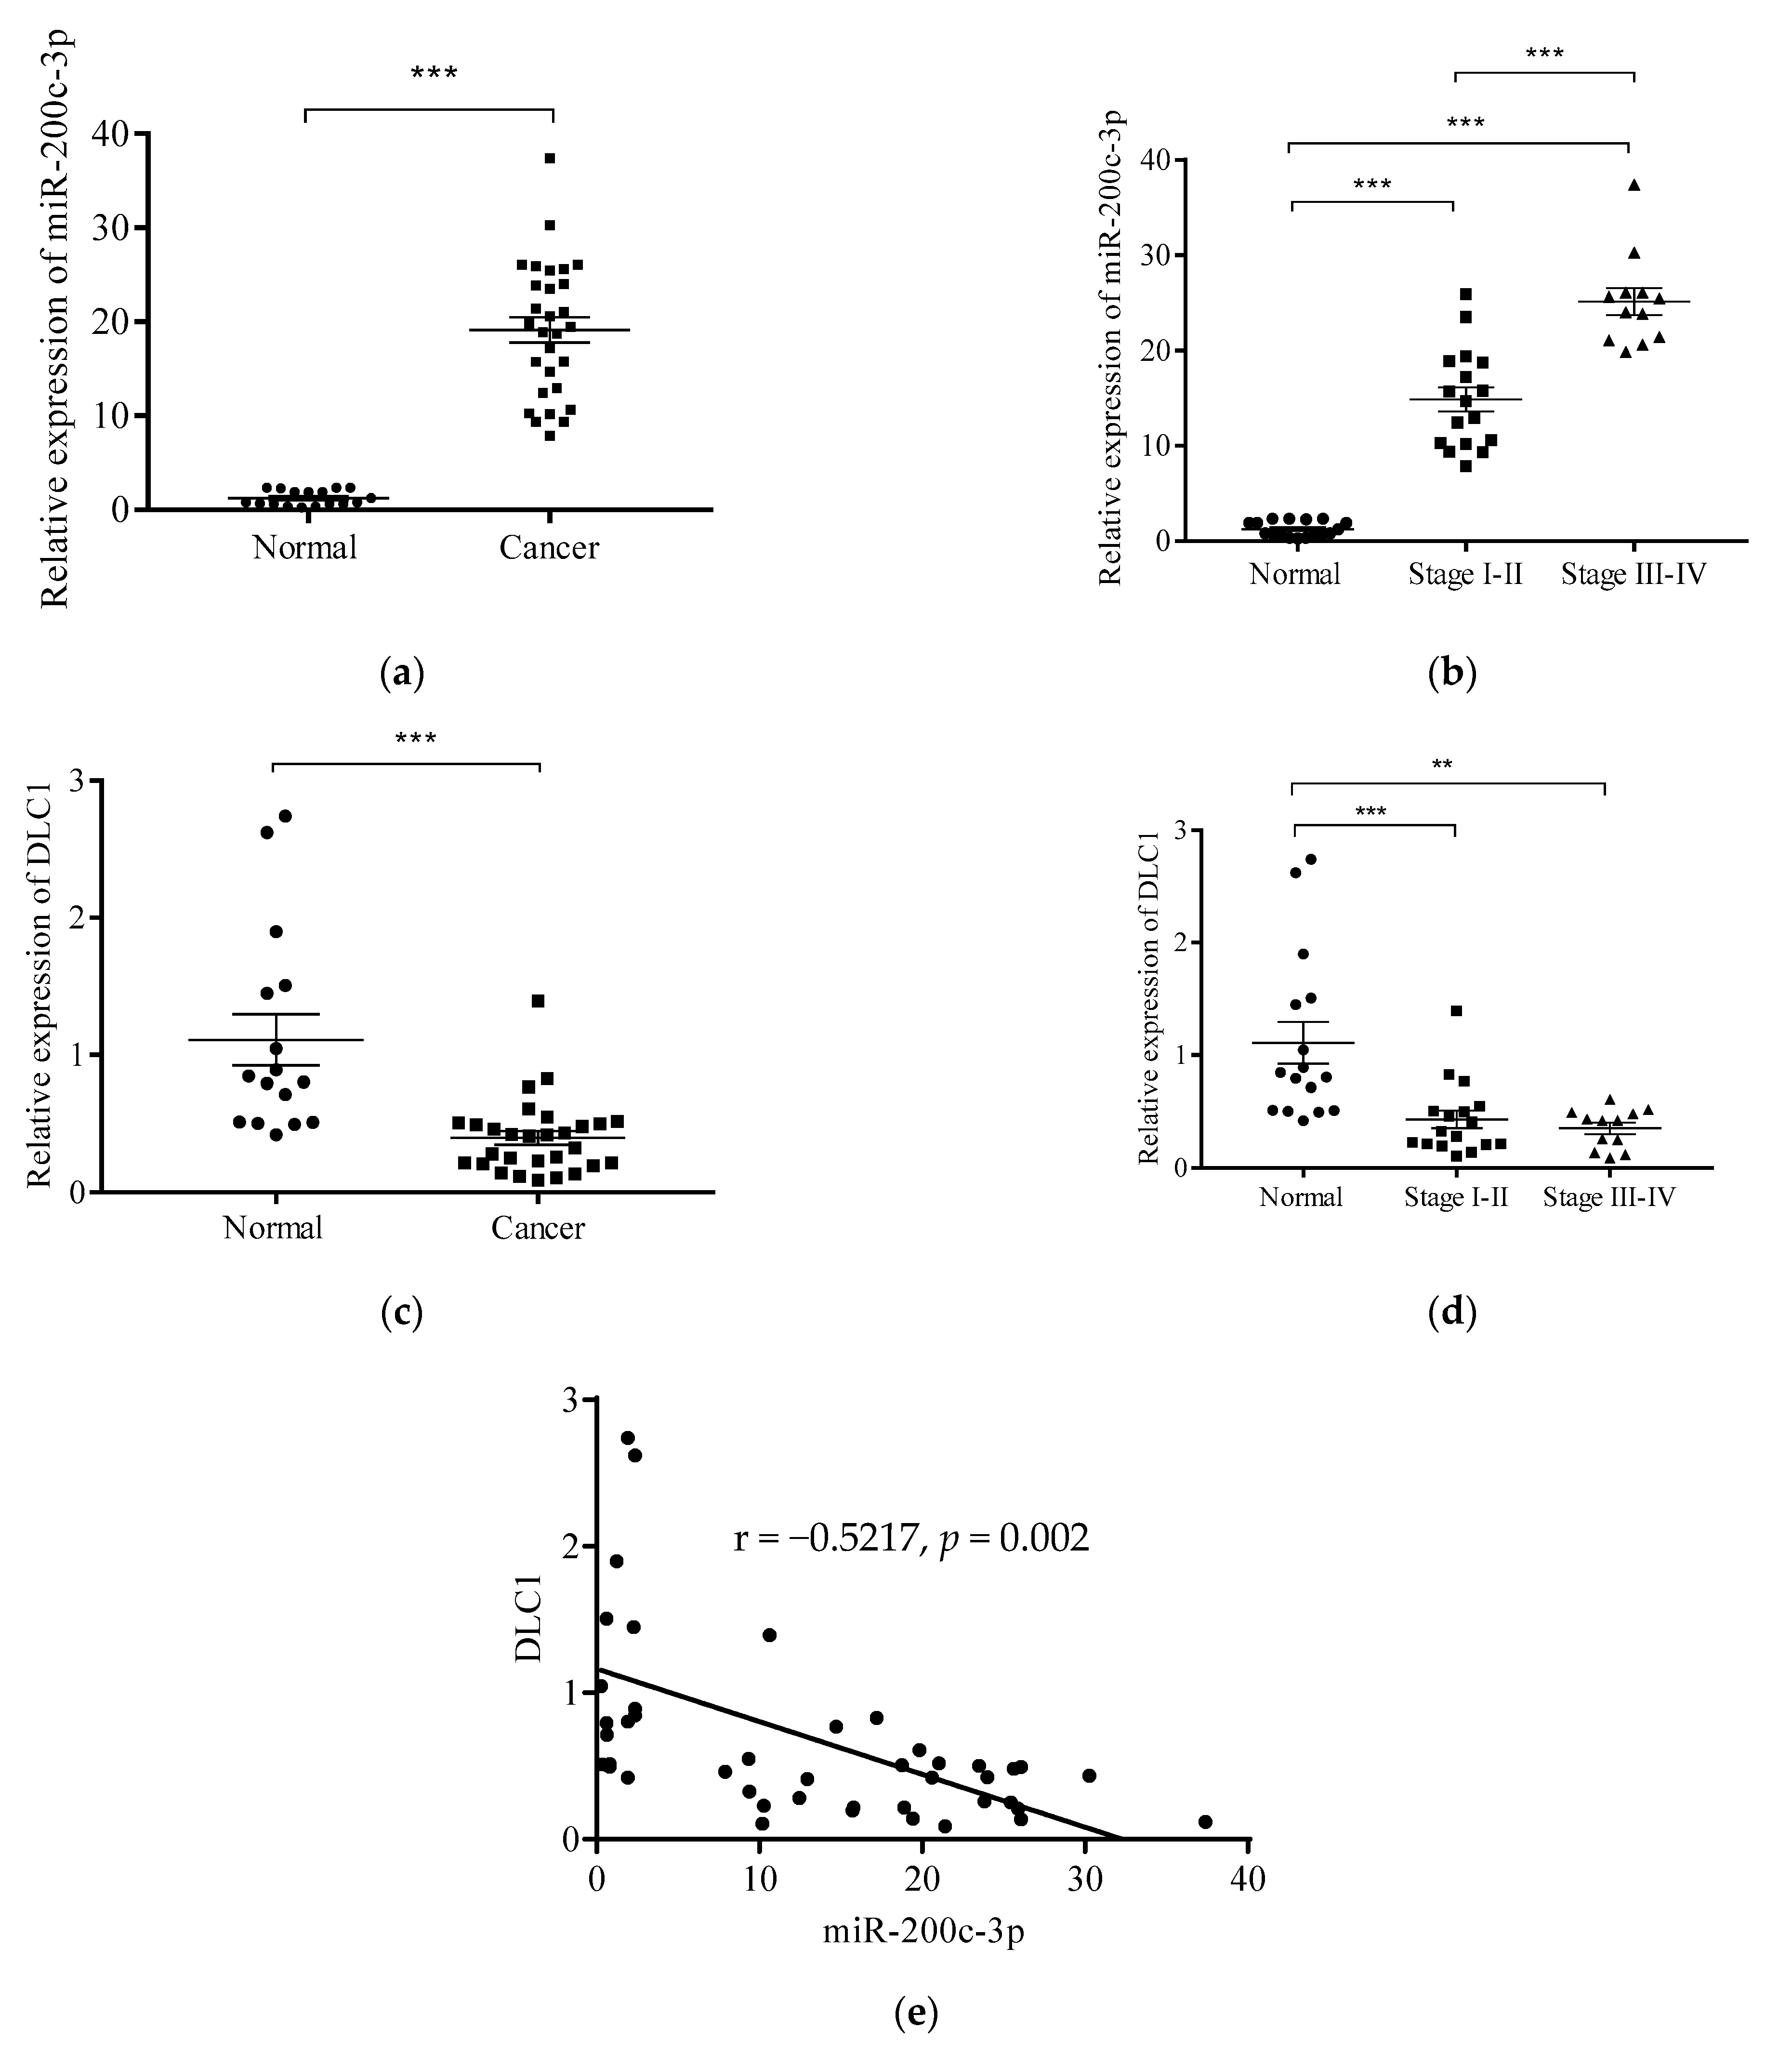
3.2. Expression Levels of miR-200c-3p and DLC1 in Clinical Specimens.

The relative expression level of miR-200c-3p in HGSC tissues was found to be significantly upregulated, by 19.13-fold compared to normal tissues (p < 0.0001) (Figure 1a). The trend of the relative expression level of this miRNA was found to be significantly upregulated in early stage (I and II) by 14.89-fold, and followed by the late stages (III and IV) by 25.14-fold as compared to the normal (p < 0.0001). This showed the expression of miR-200c-3p increased with the progression of the disease (Figure 1b).
On the other hand, the relative expression level of DLC1 in cancer tissues was found to be significantly downregulated, by 0.4-fold compared to the normal tissues (p < 0.0001) (Figure 1c). Similar results were found in different stages of HGSC, where the relative expression level was downregulated significantly in both early, by 0.37-fold (p < 0.001), and late stage, by 0.35-fold (p < 0.01), compared to normal (Figure 1d).
The Pearson correlation coefficient (r) between the relative expression levels of miR-200c-3p and DLC1 was found to have a moderate correlation, with the value of r = −0.5217 and p = 0.002 (Figure 1e). This result showed that there was a negative correlation between miR-200c-3p and DLC1 expression, which suggested DLC1 was a target of miR-200c-3p in the HGSC samples.

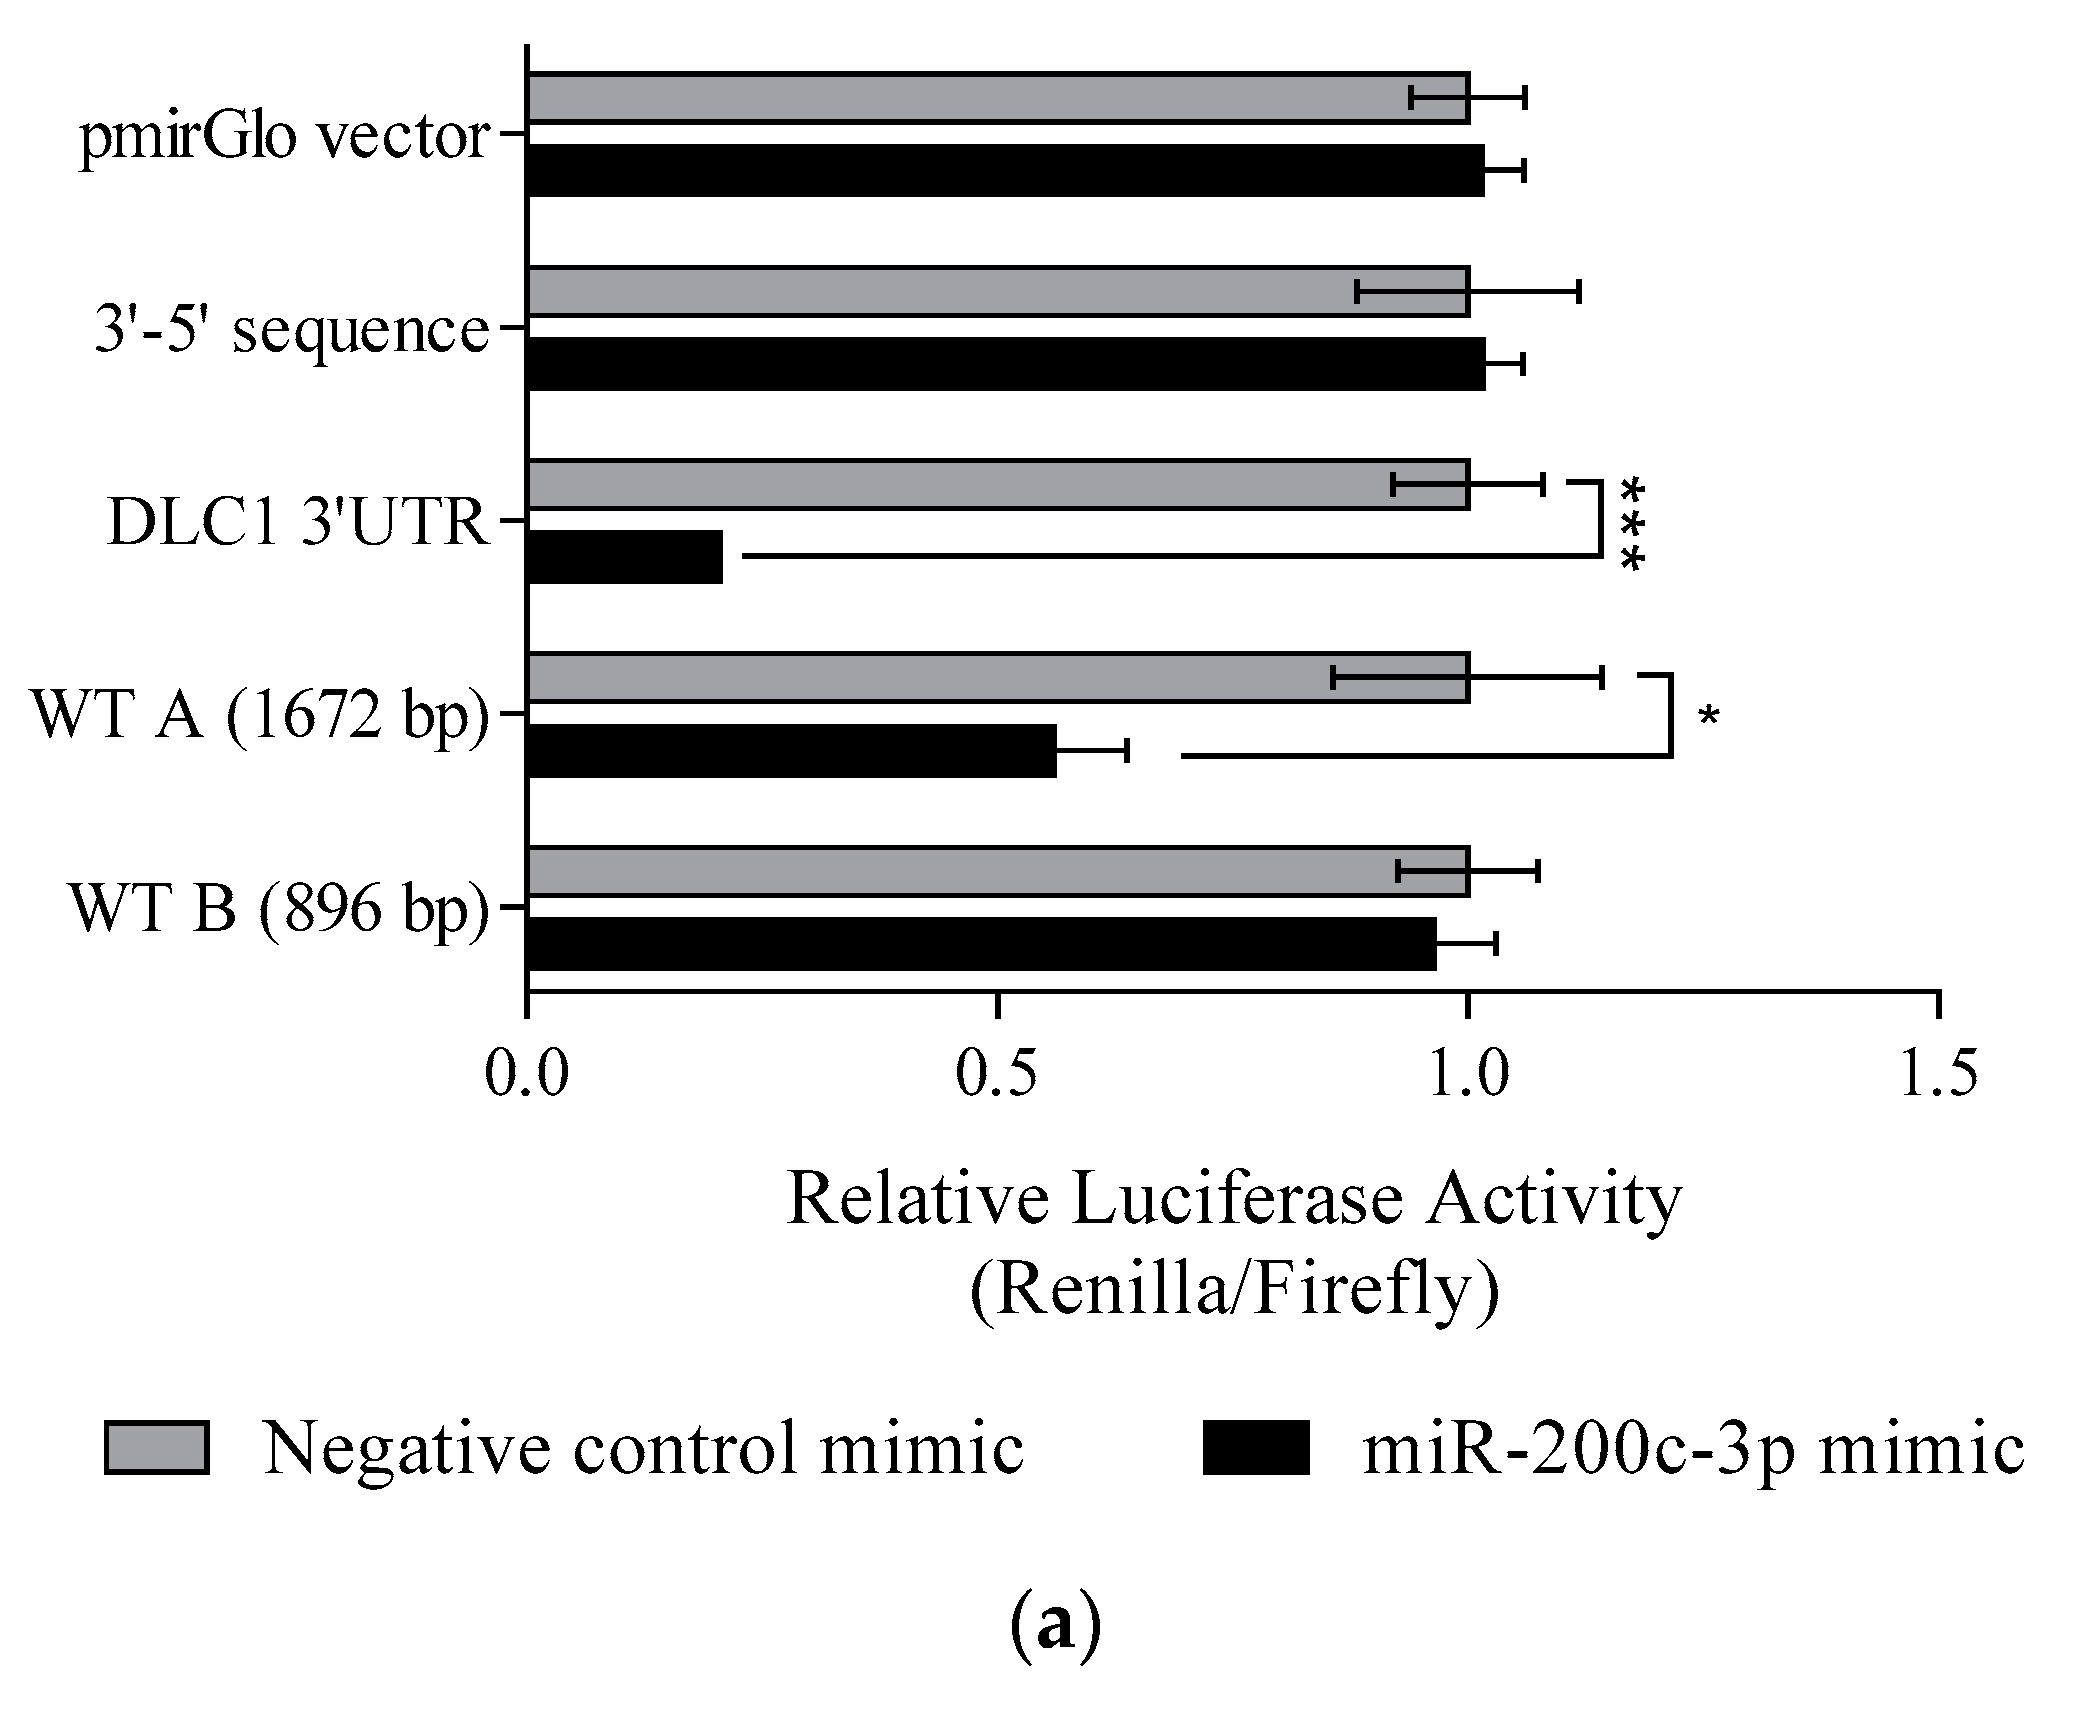
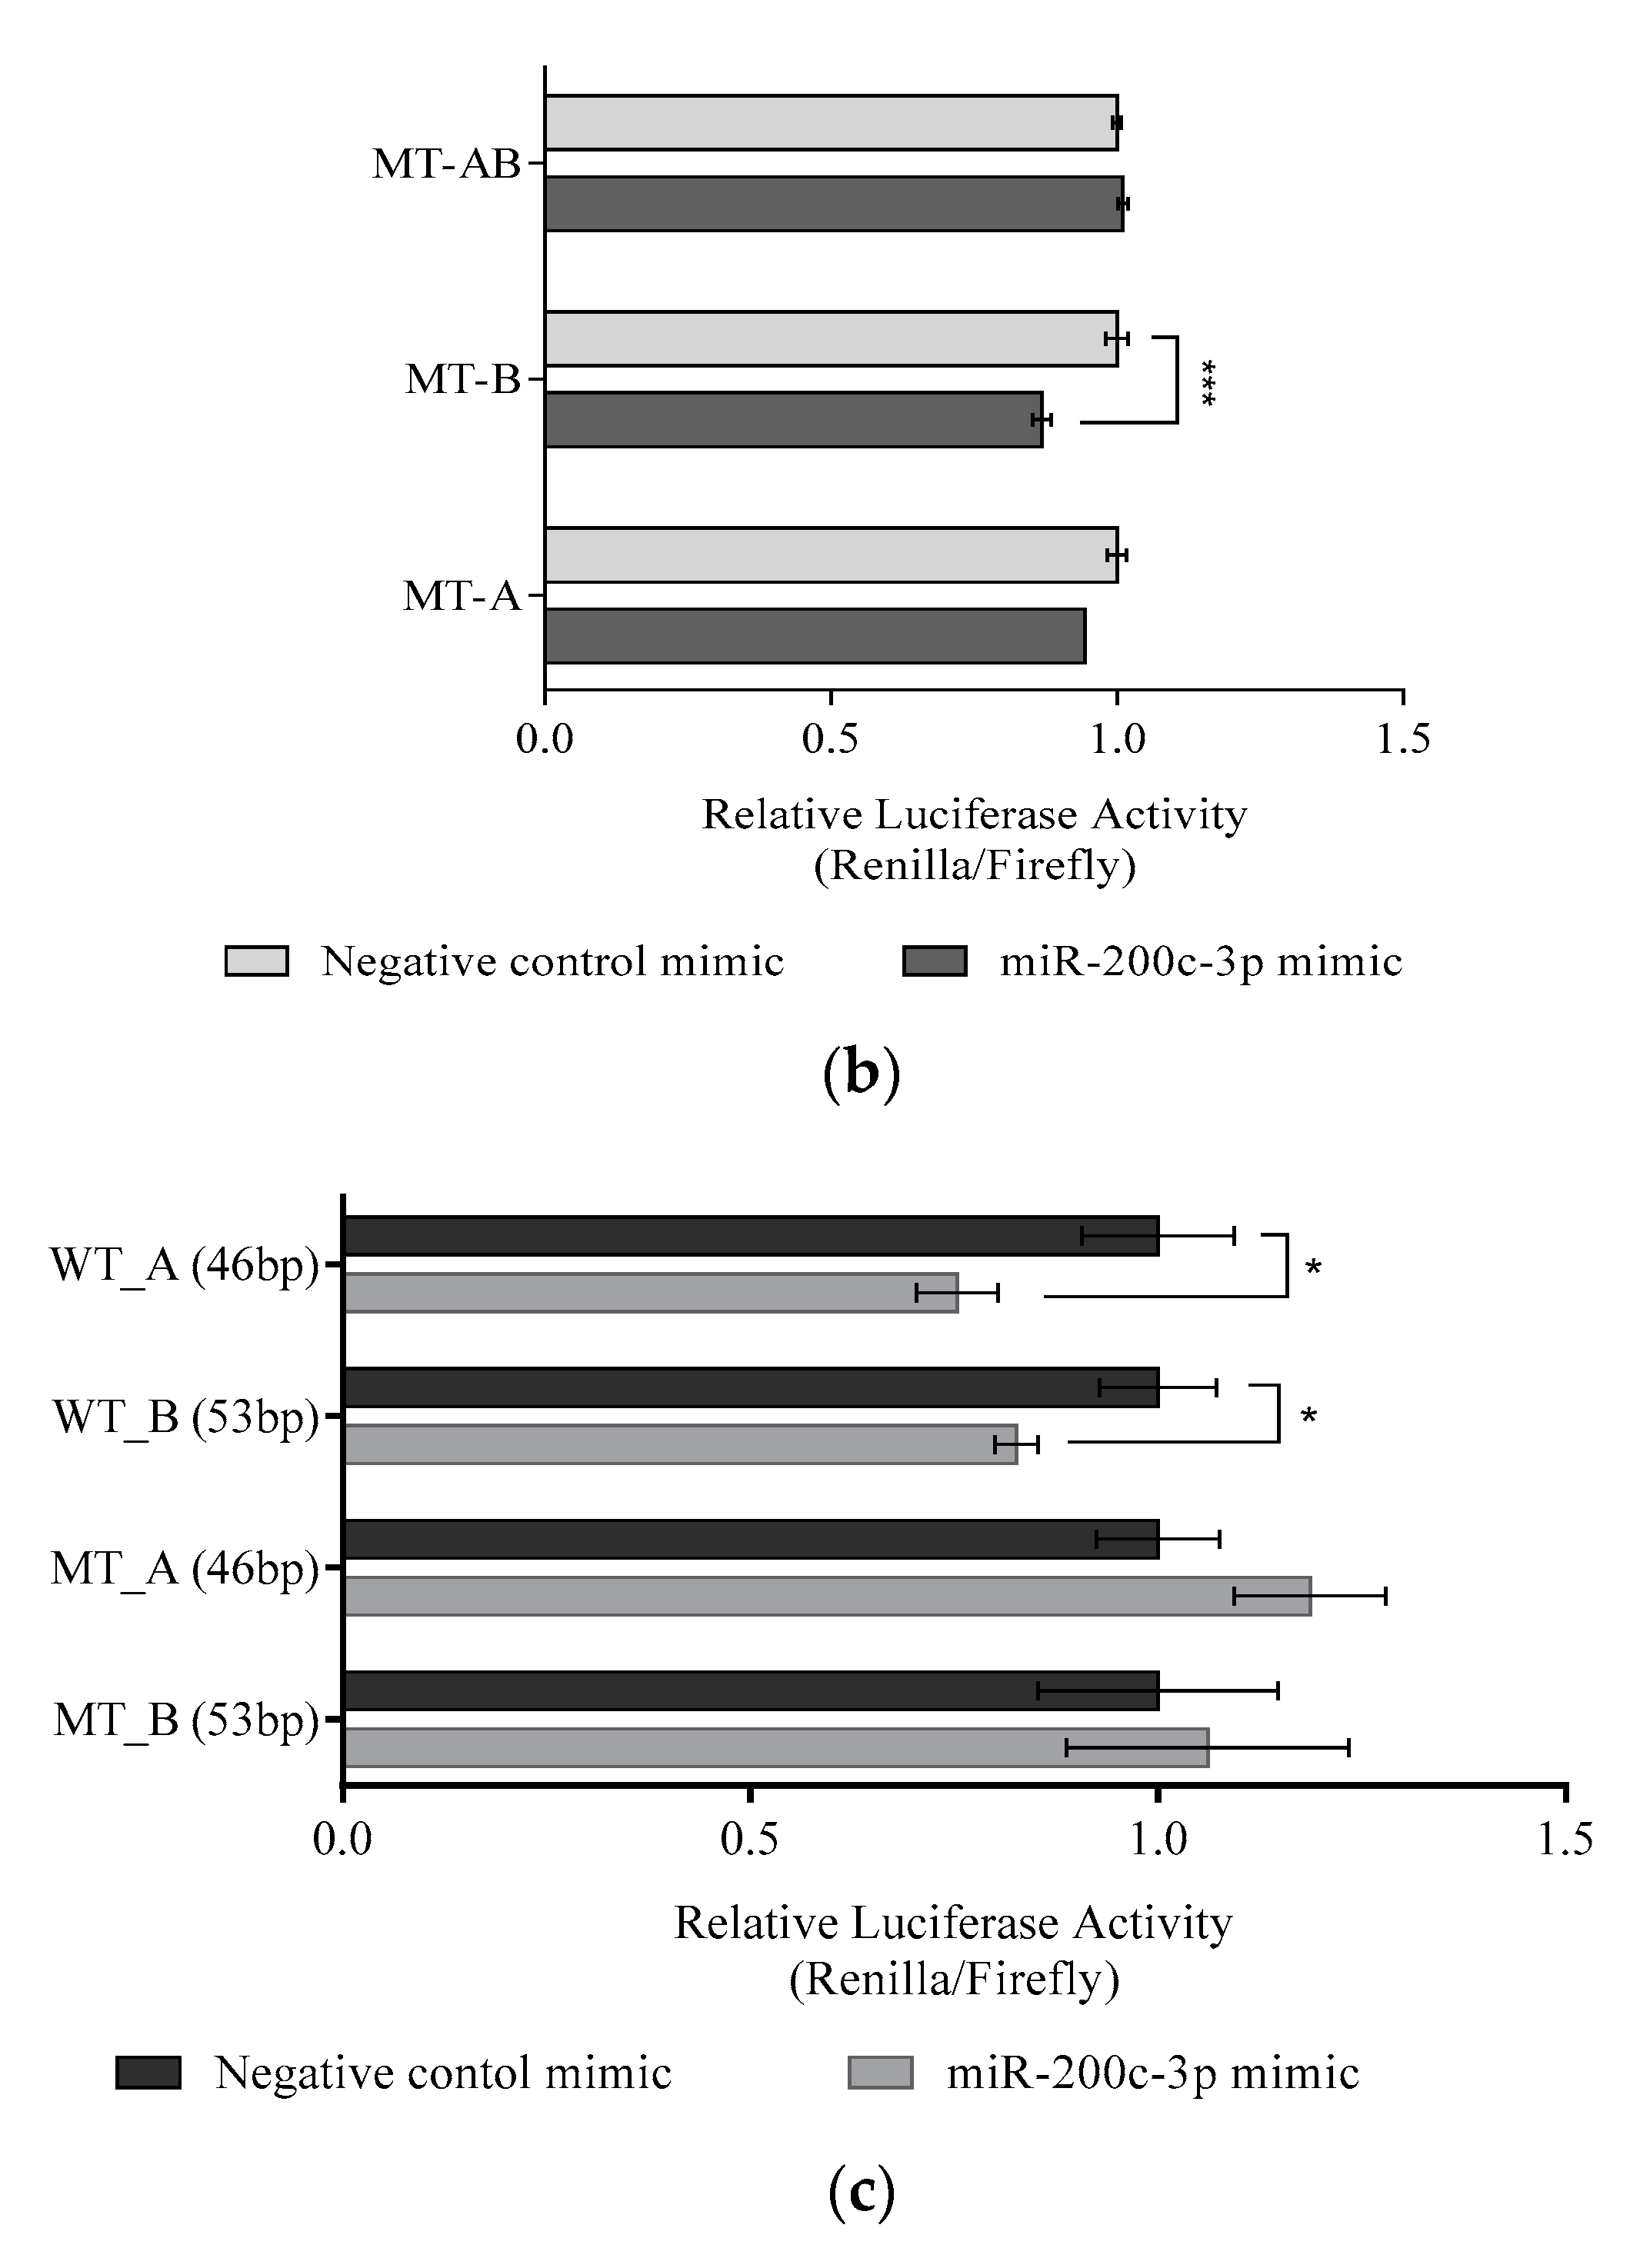
3.3. DLC1 Is a Direct Target of miR-200c-3p in an In Vitro Model of HGSC

The bioinformatic prediction tools, microRNA.org (http://www.microrna.org, accessed on 20 May 2021) and TargetScan (http://www.targetscan.org, accessed on 20 May 2021) were accessed on 6 February 2019 have suggested that there are two putative binding sites for miR-200c-3p in the 3′UTR of DLC1 (Supplementary Figure S2), which are an 8-mer seed CAGTATTA (1488–1495 bp from the start of 3′UTR) and a 7-mer-m8 seed CAGTATT (2519–2526 bp from the start of 3′ UTR) of the transcript variant 1, as shown in Figure 2a. To investigate the relationship between miR-200c-3p and DLC1 expression through miRNA:mRNA binding at the 3′UTR, a firefly luciferase reporter vector was constructed by inserting a wild-type (WT) 3′UTR of DLC1 containing two binding sites in the 3′ end of the luciferase gene and the sequence was confirmed by Sanger sequencing (Supplementary Figure S3). The data indicated that overexpression of miR-200c-3p remarkably reduced the luciferase activity of DLC1 3′UTR by 80% (p < 0.0001) (Figure 2b).
However, in order to identify the specific binding area of miR-200c-3p on DLC1 3′UTR, two firefly luciferase reporter vectors containing site A or site B, namely WT-A or WT-B, respectively, were constructed. Figure 3a shows that overexpression of miR-200c-3p significantly reduced the luciferase activity, by 44%, in WT-A (p < 0.05), but not in WT-B. This showed that the binding area of miR-200c-3p could be within the 1672 bp of WT-A.
We further investigated whether these two binding sites were repressed by miR-200c-3p; three additional luciferase vectors were constructed containing the mutant DLC1 3′UTR sequence with deletions for both binding sites (MT-AB) and either of the two binding sites (MT-A or MT-B). As shown in Figure 3b, MT-A and MT-AB attenuated the inhibitory effects on the luciferase activity in the presence of miR-200c-3p mimic. However, the luciferase activity was significantly inhibited for MT-B construct of the luciferase activity in the presence of miR-200c-3p mimic (p < 0.001). To be more specific, the inhibition of luciferase activity was mainly observed by the first putative binding site, which is site A, since the deletion could result in the loss of over 90% of luciferase inhibitory activity. These results confirmed that miR-200c-3p repressed the DLC1 gene through its binding in the 3′UTR at site A.
To confirm the specific target binding site of miR-200c-3p on 3′UTR, a small region containing 46 bp for site A, and 53 bp for B was isolated into different vectors, namely, WT-A (46bp) and WT-B (53bp), respectively. Additionally, two vectors containing three substitution mutations on the first three nucleotides (5′–3′) of seed sequences were constructed. With the presence of miR-200c-3p, luciferase activities were significantly reduced by 25% and 20% in both WT-A (46bp) and WT-B (53bp), respectively (p < 0.05). However, the inhibitory effects were attenuated in both mutant-type containing vectors (Figure 3f). All the constructed vectors are shown in Supplementary Figure S4.

3.4. Regulation of DLC1 by miR-200c-3p in HGSC Cell Lines

To obtain additional evidence on the role of miR-200c-3p towards DLC1, we investigated further, by transiently transfected miR-200c-3p mimic or inhibitor in HGSC cell lines, which were CAOV3 (primary tumor) and SKOV3 (isolated from ascites), together with their respective negative controls. Figure 4a shows that the relative expression of DLC1 mRNA was significantly downregulated (p < 0.001) in both CAOV3 and SKOV3 cell lines transfected with miR-200c-3p mimic, by 0.06-fold and 0.72-fold, respectively. On the other hand, the relative expression of DLC1 mRNA was shown to be significantly upregulated in both CAOV3 cells, by 1.69-fold (p < 0.01), and SKOV3 cells, by 6.76-fold (p < 0.0001), after transfection with miR-200c-3p inhibitor (Figure 4b). However, there was no significant difference in DLC1 protein level in both cell lines transfected with miR-200c-3p mimic or inhibitor compared to the control (Figure 4c). These results gave a reliable indicator of the role of miR-200c-3p in regulating DLC1 at the mRNA level in HGSC progression.

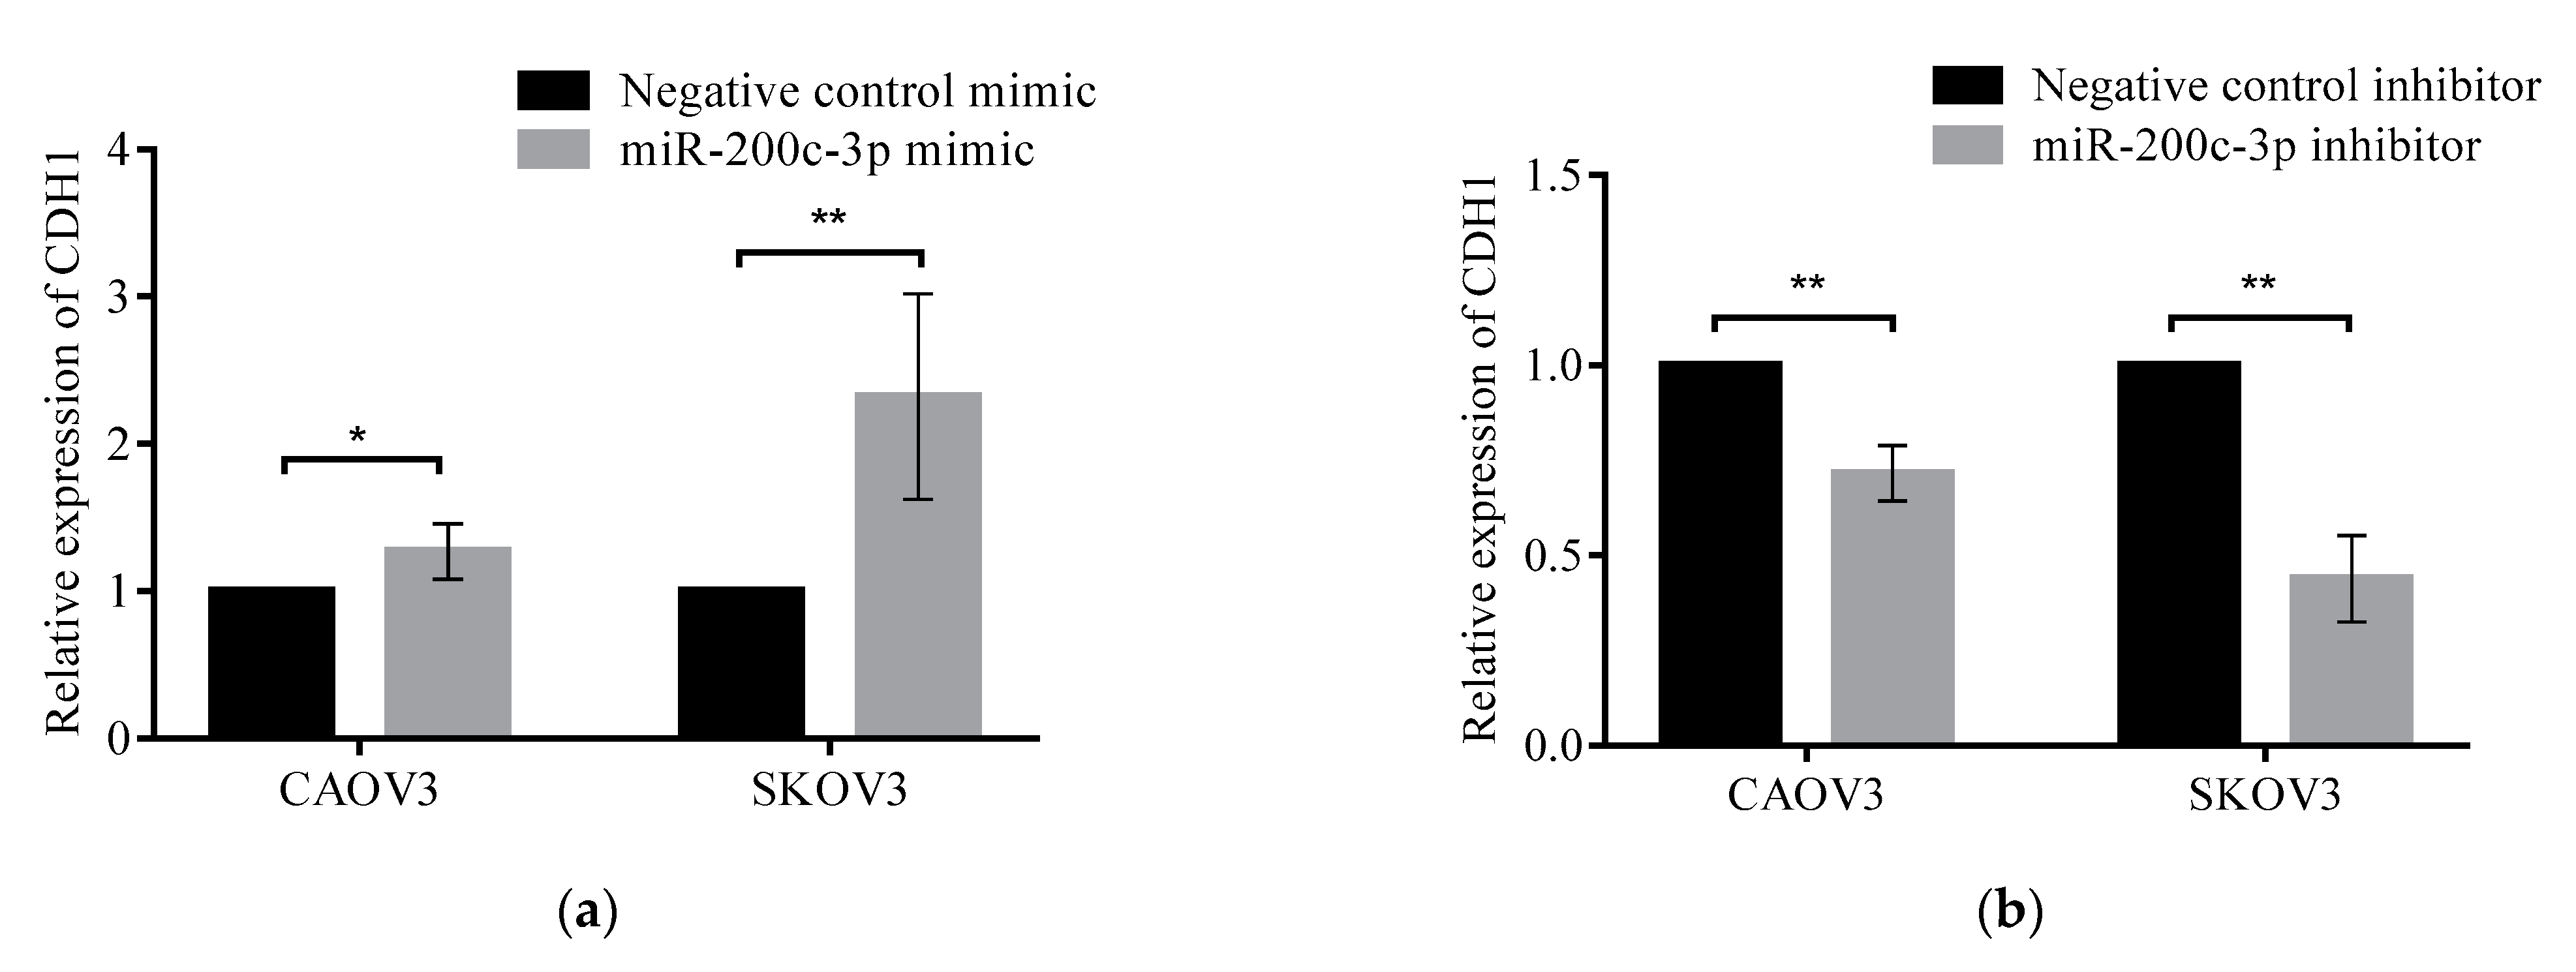
3.5. Regulation of miR-200c-3p in Epithelial-Mesenchymal Transition through Modulation of DLC1 Expression

To explore the association between miR-200c-3p regulation on DLC1 and its effect on the progression and metastasis of HGSC, CAOV3 and SKOV3 cell lines were transiently transfected with miR-200c-3p mimic or inhibitor. The relative expression levels of EMT/MET markers, E-cadherin (CDH1), in addition to DLC1 were assessed in comparison to their respective negative controls. Figure 5a shows that in the presence of miR-200c-3p mimic, the relative expression of CDH1 was significantly upregulated in CAOV3 cells, by 1.27-fold (p < 0.05), and in SKOV3 cells, by 2.32-fold (p < 0.01), in comparison to the controls. However, in Figure 5b, when the cells were transfected with miR-200c-3p inhibitors, there was a significant downregulation in the expression of CDH1 in both CAOV3 and SKOV3 cells, by 0.72-fold and 0.44-fold, respectively (p < 0.01). These results showed that miR-200c-3p could be a regulator for EMT/MET through the modulation of DLC1 expression, which plays an essential role in HGSC progression and metastasis.

4. Discussion

Increasing evidence has shown that aberrant changes in miRNAs, especially the miR-200 family, play critical roles in the progression and carcinogenesis of ovarian cancer [18,19]. Previously, we shortlisted upregulated miRNAs in SOC samples using miRNA microarray analysis, where miR-200c-3p was the most upregulated in SOC compared to normal ovarian tissues. Even though both low-grade and high-grade SOC were used in the study, more than 90% of the samples were high-grade [14]. Thus, in the present study, we further evaluated the expression of miR-200c-3p in different stages of HGSC compared to normal tissues, and identified the binding region at 3′UTR of the targeted gene.
In this study, we clearly proved that the expression pattern of miR-200c-3p in HGSC tissues at different stages was found to parallel the aggressiveness of the cancer cells, where the expression was the highest in the late stages. These results were in concordance with a previous study that showed miR-200c-3p was significantly associated with the advanced stages of HGSC [18], lymph node metastasis, and poor clinical outcome [20]. Simultaneously, there was a downregulation of the tumor suppressor gene, DLC1, a computational prediction gene identified from the bioinformatic analysis.
DLC1 (also known as ARHGAP7 and STARD12 in humans) is a gene that encodes the RhoGAP protein critically involved in cytoskeleton regulation, angiogenesis, and cell migration by inactivating Rho GTPase [21,22]. It is a tumor suppressor gene that could be dysregulated by genetic and epigenetic mechanisms in many types of cancers, such as lung, breast, gastric, liver, and ovarian cancer [23,24,25,26,27]. From a meta-analysis study, it was shown that DLC1 expression was downregulated in the advanced stages compared to the early-stage cancer in 19 eligible studies, including epithelial ovarian cancer (EOC), but those studies did not mention the histological subtypes of EOC [28]. Hence, our findings showed that DLC1 was the most downregulated in the late stage of HGSC and might be associated with high expression of miR-200c-3p through its direct binding at 3′UTR. Furthermore, our findings confirmed that there was a negative correlation between miR-200c-3p and DLC1 expression in HGSC tissues.
From the bioinformatic analysis, it was found that there are two putative miR-200c-3p binding sites within the 3′UTR of DLC1. For the first time, in the present study, we verified and confirmed miR-200c-3p direct binding on 3′UTR of DLC1 in luciferase reporter experiments in SKOV3 cell line. Based on these results, the main binding site was found to be at the first site of 3′UTR, a conserved target site with an 8-mer seed sequence, 5′-CAGTATTA-3′. This was then subsequently verified by mutating the target site, which retracted the binding actions by miR-200c-3p. This study was in an agreement with a previous study, where in an UTR fragment containing two sites, the repression at the 8-mer site was the most favorable. However, the repression at both sites in one UTR fragment was greater than the expected site individually [29]. This could be due to synergistic effects, for which the exact mechanism remains unknown [29,30].
To overcome the ‘off-target’ effects which occur through the same identification based on seed recognition as endogenous miRNA targeting, gain and loss of miRNA function tests are required [29]. Herein, we investigated the expression of miR-200c-3p in HGSC cell lines, and the results confirmed that miR-200c-3p downregulated DLC1, and that when miR-200c-3p expression was inhibited, DLC1 expression increased. However, this in vitro study demonstrated that the downregulation of DLC1 in the presence of over expression of miR-200c-3p only took place at an mRNA level. Hence, the regulation of miR-200c-3p at 3′UTR of DLC1 would cause mRNA degradation instead of translation repression. Nonetheless, this is still unclear, due to the complexity of the underlying mechanisms involved.
EMT and MET, an epithelial to mesenchymal transition and vice versa, are the transdifferentiations between epithelial cells and motile mesenchymal cells, which is a critical process in metastasis. Multiple established markers served as core markers in the assessment of EMT/MET, such as up- or downregulation of CDH1, a hallmark of EMT that disrupts adherens junctions, and which is customarily accompanied by a reduction in the expression of CDH2, VIM, and others [31,32]. A previous study demonstrated that over expression of DLC1 could inhibit EMT by increasing the expression of epithelial markers [33]. According to another report, the inhibitory effects of CDH1 could be attenuated by knocking down DLC1 epigenetically [34]. However, the present study displayed contradictory results, which showed a negative regulation between DLC1 and CDH1 when miR-200c-3p was overexpressed.
In this study, even though the high expression of miR-200c-3p was found to cause downregulation of a tumor suppressor gene DLC1, at the same time it also led to upregulation of CDH1 expression in both primary and metastatic tumor cells. Based on this data, we suggested that over expression of miR-200c-3p could reduce DLC1 mRNA and hence, inhibited EMT and promoted MET in HGSC, as observed by the upregulation of the epithelial marker, E-cadherin. Our previous study confirmed that over expression of miR-200c stimulated cell proliferation and colony formation but attenuated cell migration and invasion [14]. Moreover, MET could also be regulated by miR-200c through a double feedback loop with the two E-cadherin transcriptional regulators, ZEB1 and ZEB2, and influencing TGF-β and EGFR signaling cascades [35,36]. Eventually, this caused cells to re-epithelialize to form metastatic foci at a secondary site.
The use of the SKOV3 cell line might be a possible limitation of our study. The SKOV3 cells was mostly referred as ‘serous’ due to some uncertainties about putative TP53 mutation. However, the genetic analysis showed that SKOV3 not only had a mutation on TP53, but also in ARID1A, where it was most likely to be endometrioid or clear cell carcinoma [37,38]. Therefore, a better-defined system model with valid clinical phenotypes needs to be considered in future studies.
In the future, miR-200c-3p could have a great potential as a diagnostic marker for early detection, as well as a prognostic marker to complement the current cancer staging system in ovarian cancer [39,40]. Furthermore, for therapeutic purposes, with the target sequence known, it could be proposed to form an miRNA sponge containing binding sites of the target gene to compete with the ‘authentic target’ [41]. The use of miRNA as a target in medical therapies demonstrates its role as an alternative in combating debilitating cancers, such as ovarian cancer

5. Conclusions

In conclusion, upregulated miR-200c-3p expression in both early and late stage of HGSC could downregulate DLC1, as a tumor suppressor. At the same time, miR-200c-3p could regulate EMT/MET in HGSC cells. Therefore, we suggest that a combination of miR-200c-3p and the molecular target sites of DLC1 could be a potential regulator in HGSC for therapeutic purposes and to reverse cancer progression in this deadly disease.

Supplementary Materials

The following are available online at https://0-www-mdpi-com.brum.beds.ac.uk/article/10.3390/ijerph18115741/s1, Supplementary Figure S1. Transfection efficiency of miR-200c-3p mimic in CAOV3 (A) and SKOV3 cells (B). Both cells showing more than 90% efficiency in 150 nM. Supplementary Figure S2. Predicted miR-200c-3p binding regions located in human 3′UTR DLC1 derived from TargetScan Release 7.1 (A) and microrna.org (B). Supplementary Figure S3. (A) Cloning of 2.57 kb of DLC1 3′UTR with seed sequences highlighted in green at XbaI-SbfI sites (highlighted in red) in the pmirGlo reporter vector. (B) Sequencing analysis confirmed seed sequences cloned in the vector. Supplementary Figure S4. (A) Representation of vectors with each of the binding sites constructed, namely WT-A and WT-B. (B) The constructs for luciferase activity of vectors containing, DLC1 3′UTR sequence, deletions of both site A (MT-A) and B (MT-B) or either site A or B (MT-AB). (C) Isolation of the binding site sequence (underlined) constructed into different vectors namely WT-A (46 bp) and WT-B (53 bp) together with mutant type vectors contained three substitutional mutation (red sequence) namely MT-A (46 bp) and MT-B (53 bp).

Author Contributions

N.M.M. obtained funding, designed the current study, and provided supervision. S.J.A. conducted the experiments and analyses of the data. M.N.S., N.A.W. and R.A.R.A. provided guidance. Patients were enrolled and tissue were collected by M.N.S. and S.J.A. The manuscript was prepared by S.J.A. with support from N.M.M. and M.N.S., who also provided technical advice. All authors provided critical feedback and edited the manuscript. All authors have read and agreed to the published version of the manuscript.

Funding

This research was funded by University Kebangsaan, Malaysia (project code: FF-2017-192) and the Ministry of Higher Education, Malaysia (FRGS/1/2014/SKK01/UKM/02/2).

Institutional Review Board Statement

The institutional ethics committee approved this study involving human tissue collection (reference no: UKM PPI/111/8/JEP-2017-268).

Informed Consent Statement

All patients involved provided signed informed consent.

Acknowledgments

We would like to acknowledge all operating theatre staff of the Department of Obstetrics and Gynaecology, Faculty of Medicine, Universiti Kebangsaan Malaysia Medical Centre (UKMMC), for their assistance in sample collections. We also would like to thank the pathologist, Reena Rahayu Md Zin from the Department of Pathology, UKMMC for validating our histological slides.

Conflicts of Interest

The authors declare no conflict of interests.

References

  1. Torre, L.A.; Trabert, B.; DeSantis, C.E.; Miller, K.D.; Samimi, G.; Runowicz, C.D.; Gaudet, M.M.; Jemal, A.; Siegel, R.L. Ovarian cancer statistics, 2018. CA Cancer J. Clin. 2018, 68, 284–296. [Google Scholar] [CrossRef]
  2. Koshiyama, M.; Matsumura, N.; Konishi, I. Recent concepts of ovarian carcinogenesis: Type I and type II. BioMed Res. Int. 2014, 2014, 934261. [Google Scholar] [CrossRef] [Green Version]
  3. Jayson, G.C.; Kohn, E.C.; Kitchener, H.C.; Ledermann, J.A. Ovarian cancer. Lancet 2014, 384, 1376–1388. [Google Scholar] [CrossRef]
  4. Kurman, R.J.; Shih, I.-M. The dualistic model of ovarian carcinogenesis revisited, revised, and expanded. Am. J. Pathol. 2016, 186, 733–747. [Google Scholar] [CrossRef] [Green Version]
  5. Stewart, C.; Ralyea, C.; Lockwood, S. Ovarian Cancer: An Integrated Review. Semin. Oncol. Nurs. 2019, 35, 151–156. [Google Scholar] [CrossRef]
  6. Vang, R.; Levine, D.A.; Soslow, R.A.; Zaloudek, C.; Shih, I.-M.; Kurman, R.J. Molecular Alterations of TP53 are a Defining Feature of Ovarian High-Grade Serous Carcinoma: A Rereview of Cases Lacking TP53 Mutations in The Cancer Genome Atlas Ovarian Study Russell. Int. J. Gynecol. Pathol. 2016, 35, 48–55. [Google Scholar] [CrossRef] [PubMed] [Green Version]
  7. Kurman, R.J. Origin and molecular pathogenesis of ovarian high-grade serous carcinoma. Ann. Oncol. 2013, 24, x16–x21. [Google Scholar] [CrossRef]
  8. Motohara, T.; Masuda, K.; Morotti, M.; Zheng, Y.; El-Sahhar, S.; Chong, K.Y.; Wietek, N.; Alsaadi, A.; Karaminejadranjbar, M.; Hu, Z.; et al. An evolving story of the metastatic voyage of ovarian cancer cells: Cellular and molecular orchestration of the adipose-rich metastatic microenvironment. Oncogene 2019, 38, 2885–2898. [Google Scholar] [CrossRef] [Green Version]
  9. Motohara, T.; Fujimoto, K.; Tayama, S.; Narantuya, D.; Sakaguchi, I.; Tashiro, H.; Katabuchi, H. CD44 variant 6 as a predictive biomarker for distant metastasis in patients with epithelial ovarian cancer. Obstet. Gynecol. 2016, 127, 1003–1011. [Google Scholar] [CrossRef]
  10. Bartel, D.P. MicroRNAs: Target Recognition and Regulatory Functions. Cell 2009, 136, 215–233. [Google Scholar] [CrossRef] [Green Version]
  11. Ankasha, S.J.; Shafiee, M.N.; Wahab, N.A.; Ali, R.A.R.; Mokhtar, N.M. Post-transcriptional regulation of microRNAs in cancer: From prediction to validation. Oncol. Rev. 2018, 12, 39–44. [Google Scholar] [CrossRef] [Green Version]
  12. Dweep, H.; Sticht, C.; Gretz, N. In-Silico Algorithms for the Screening of Possible microRNA Binding Sites and Their Interactions. Curr. Genom. 2013, 14, 127–136. [Google Scholar] [CrossRef] [Green Version]
  13. Lai, E.C. Predicting and validating microRNA targets. Genome Biol. 2004, 5, 115. [Google Scholar] [CrossRef] [Green Version]
  14. Ibrahim, F.F.; Jamal, R.; Effendi Syafruddin, S.; Syakima Ab Mutalib, N.; Saidin, S.; Rahayu MdZin, R.; Manir Hossain Mollah, M.; Mohd Mokhtar, N. MicroRNA-200c and microRNA-31 regulate proliferation, colony formation, migration and invasion in serous ovarian cancer. J. Ovarian Res. 2015, 8, 56. [Google Scholar] [CrossRef] [Green Version]
  15. Wahab, N.A.; Othman, Z.; Mohd Nasri, N.W.; Mokhtar, M.H.; Ibrahim, S.F.; Hamid, A.A.; Ali, R.A.R.; Mokhtar, N.M. Inhibition of mir-141 and mir-200a increase dlc-1 and zeb2 expression, enhance migration and invasion in metastatic serous ovarian cancer. Int. J. Environ. Res. Public Health 2020, 17, 2766. [Google Scholar] [CrossRef] [Green Version]
  16. Betel, D.; Wilson, M.; Gabow, A.; Marks, D.S.; Sander, C. The microRNA org resource: Targets and expression. Nucleic Acids Res. 2008, 36, D149–D153. [Google Scholar] [CrossRef] [Green Version]
  17. Agarwal, V.; Bell, G.W.; Nam, J.-W.W.; Bartel, D.P. Predicting effective microRNA target sites in mammalian mRNAs. ELife 2015, 4, e05005. [Google Scholar] [CrossRef] [PubMed]
  18. Vilming Elgaaen, B.; Olstad, O.K.; Haug, K.B.F.; Brusletto, B.; Sandvik, L.; Staff, A.C.; Gautvik, K.M.; Davidson, B. Global miRNA expression analysis of serous and clear cell ovarian carcinomas identifies differentially expressed miRNAs including miR-200c-3p as a prognostic marker. BMC Cancer 2014, 14, 80. [Google Scholar] [CrossRef] [Green Version]
  19. Zhang, S.; Lu, Z.; Unruh, A.K.; Ivan, C.; Baggerly, K.A.; Calin, G.A.; Li, Z.; Bast, R.C.; Le, X.-F. Clinically Relevant microRNAs in Ovarian Cancer. Mol. Cancer Res. 2015, 13, 393–401. [Google Scholar] [CrossRef] [Green Version]
  20. Meng, X.; Müller, V.; Milde-Langosch, K.; Trillsch, F.; Pantel, K.; Schwarzenbach, H. Circulating cell-free miR-373, miR- 200a, miR-200b and miR-200c in patients with epithelial ovarian cancer. Adv. Exp. Med. Biol. 2016, 924, 3–8. [Google Scholar]
  21. Kim, T.Y.; Vigil, D.; Der, C.J.; Juliano, R.L. Role of DLC-1, a tumor suppressor protein with RhoGAP activity, in regulation of the cytoskeleton and cell motility. Cancer Metastasis Rev. 2009, 28, 77–83. [Google Scholar] [CrossRef] [PubMed] [Green Version]
  22. Shih, Y.; Yuan, S.Y.; Hao, S. Down-regulation of DLC1 in endothelial cells compromises the angiogenesis process. Cancer Lett. 2017, 398, 46–51. [Google Scholar] [CrossRef]
  23. Wang, D.; Qian, X.; Rajaram, M.; Durkin, M.E.; Lowy, D.R. DLC1 is the principal biologically-relevant down-regulated DLC family member in several cancers. Oncotarget 2016, 7, 45144–45157. [Google Scholar] [CrossRef] [PubMed] [Green Version]
  24. Park, H.; Cho, S.; Kim, H.; Na, D.; Yun, J.; Chae, J.; Park, C. Genomic alterations in BCL2L1 and DLC1 contribute to drug sensitivity in gastric cancer. Proc. Natl. Acad. Sci. USA 2015, 112, 12492–12497. [Google Scholar] [CrossRef] [PubMed] [Green Version]
  25. Low, J.S.W.; Tao, Q.; Ng, K.M.; Goh, H.K.; Shu, X.; Woo, W.L.; Ambinder, R.F.; Srivastava, G.; Shamay, M.; Chan, A.T.C.; et al. A novel isoform of the 8p22 tumor suppressor gene DLC1 suppresses tumor growth and is frequently silenced in multiple common tumors. Oncogene 2011, 30, 1923–1935. [Google Scholar] [CrossRef] [Green Version]
  26. Hassan, N.Z.A.; Mokhtar, N.M.; Sin, T.K.; Rose, I.M.; Sagap, I.; Harun, R.; Jamal, R. Integrated analysis of copy number variation and genome-wide expression profiling in colorectal cancer tissues. PLoS ONE 2014, 9, e92553. [Google Scholar] [CrossRef]
  27. Fan, D.; Shi, H. Pilot Study: Alteration of Deleted in Liver Cancer1 and Phosphorylated Focal Adhesion Kinase Y397 Cytoplasmic Expression and the Prognostic Value in Advanced Epithelial Ovarian Carcinoma. Int. J. Mol. Sci. 2011, 12, 8489–8501. [Google Scholar] [CrossRef]
  28. Jiang, Y.; Li, J.; Luo, H. Clinicopathological Significance of DLC-1 Expression in Cancer: A Meta-Analysis. Asian Pac. J. Cancer Prev. 2015, 16, 7255–7260. [Google Scholar] [CrossRef]
  29. Grimson, A.; Farh, K.K.H.; Johnston, W.K.; Garrett-Engele, P.; Lim, L.P.; Bartel, D.P. MicroRNA Targeting Specificity in Mammals: Determinants beyond Seed Pairing. Mol. Cell 2007, 27, 91–105. [Google Scholar] [CrossRef] [Green Version]
  30. Saito, T.; Sætrom, P. MicroRNAs—Targeting and target prediction. New Biotechnol. 2010, 27, 243–249. [Google Scholar] [CrossRef] [Green Version]
  31. Lamouille, S.; Xu, J.; Derynck, R. Molecular mechanisms of epithelial-mesenchymal transition. Nat. Rev. Mol. Cell Biol. 2014, 15, 178–196. [Google Scholar] [CrossRef] [Green Version]
  32. Mak, M.P.; Tong, P.; Diao, L.; Cardnell, R.J.; Gibbons, D.L.; William, N.; Skoulidis, F.; Parra, E.R.; Rodriguez-canales, J.; Wistuba, I.I. A patient-derived, pan-cancer EMT signature identifies global molecular alterations and immune target enrichment following epithelial to mesenchymal transition. Clin. Cancer Res. 2015, 22, 609–620. [Google Scholar] [CrossRef] [Green Version]
  33. Huang, W.; Liu, J.; Feng, X.; Chen, H.; Zeng, L.; Huang, G.; Liu, W.; Wang, L.; Jia, W.; Chen, J.; et al. DLC-1 induces mitochondrial apoptosis and epithelial mesenchymal transition arrest in nasopharyngeal carcinoma by targeting EGFR/Akt/NF-κB pathway. Med. Oncol. 2015, 32, 115. [Google Scholar] [CrossRef] [PubMed]
  34. Asnaghi, L.; Vass, W.C.; Quadri, R.; Day, P.M.; Qian, X.; Braverman, R.; Papageorge, A.G.; Lowy, D.R. E-cadherin negatively regulates neoplastic growth in non-small cell lung cancer: Role of Rho GTPases. Oncogene 2010, 29, 2760–2771. [Google Scholar] [CrossRef] [Green Version]
  35. Hur, K.; Toiyama, Y.; Takahashi, M.; Balaguer, F.; Nagasaka, T.; Koike, J.; Hemmi, H.; Koi, M.; Boland, C.R.; Goel, A. MicroRNA-200c modulates epithelial-tomesenchymal transition (EMT) in human colorectal cancer metastasis. Gut 2013, 62, 1315–1326. [Google Scholar] [CrossRef] [Green Version]
  36. Park, S.; Gaur, A.B.; Lengyel, E.; Peter, M.E. The miR-200 family determines the epithelial phenotype of cancer cells by targeting the E-cadherin repressors ZEB1 and ZEB2. Genes Dev. 2008, 22, 894–907. [Google Scholar] [CrossRef] [PubMed] [Green Version]
  37. Tudrej, P.; Olbryt, M.; Zembala-Nożyńska, E.; Kujawa, K.A.; Cortez, A.J.; Fiszer-Kierzkowska, A.; Pigłowski, W.; Nikiel, B.; Głowala-Kosińska, M.; Bartkowska-Chrobok, A.; et al. Establishment and characterization of the novel high-grade serous ovarian cancer cell line OVPA8. Int. J. Mol. Sci. 2018, 19, 2080. [Google Scholar] [CrossRef] [PubMed] [Green Version]
  38. Beaufort, C.M.; Helmijr, J.C.A.; Piskorz, A.M.; Hoogstraat, M.; Ruigrok-Ritstier, K.; Besselink, N.; Murtaza, M.; Van IJcken, W.F.J.; Heine, A.A.J.; Smid, M.; et al. Ovarian cancer cell line panel (OCCP): Clinical importance of in vitro morphological subtypes. PLoS ONE 2014, 9, e103988. [Google Scholar] [CrossRef]
  39. Gao, Y.; Wu, J. MicroRNA-200c and microRNA-141 as potential diagnostic and prognostic biomarkers for ovarian cancer. Tumor Biol. 2015, 36, 4843–4850. [Google Scholar] [CrossRef] [PubMed]
  40. Teng, Y.; Su, X.; Zhang, X.; Zhang, Y.; Li, C.; Niu, W.; Liu, C.; Qu, K. miRNA-200a/c as potential biomarker in epithelial ovarian cancer (EOC): Evidence based on miRNA meta-signature and clinical investigations. Oncotarget 2016, 7, 81621–81633. [Google Scholar] [CrossRef] [Green Version]
  41. Bak, R.O.; Mikkelsen, J.G. miRNA sponges: Soaking up miRNAs for regulation of gene expression. Wiley Interdiscip. Rev. RNA 2014, 5, 317–333. [Google Scholar] [CrossRef] [PubMed]
Figure 1. The expression levels of miR-200c-3p and DLC1 are inversely correlated in high grade serous carcinoma. The miR-200c-3p expression by qRT-PCR showing upregulation in cancer tissues (a), and different stages of HGSC (b). Conversely, the expression level of DLC1, showing downregulation in cancer tissues (c), and different stages (d). A negative correlation was shown between miR-200c-3p and DLC1 in both early and late stage of high grade serous carcinoma samples (e). Significant values are indicated as follows: ** p < 0.01 and *** p < 0.001.
Ijerph 18 05741 g001
Figure 2. (a) Two putative binding sites of 3′UTR DLC1 from in silico analysis. (b) There was a significant reduction in the luciferase activity when 3′UTR DLC1 construct was co-transfected with miR-200c-3p mimic. Significant values are indicated as follows: *** p < 0.001.
Ijerph 18 05741 g002
Figure 3. (a) Luciferase activity showed a significant reduction in vector containing DLC1 3′UTR (p < 0.0001) and WT-A (p < 0.05) but not in WT-B. (b) MT-B showed a significant reduction (p < 0.001) in luciferase activity, whereas there was no significant reduction in MT-A, and in MT-AB with the presence of miR-200c-3p. (c) With the presence of miR-200c-3p, luciferase activity showed a significant reduction in both wild-type vectors, WT-A (46bp) and WT-B (53bp), but not in mutant-types. Significant values are indicated as follows: * p < 0.05 and *** p < 0.001.
Ijerph 18 05741 g003aIjerph 18 05741 g003b
Figure 4. The expression of DLC1 in CAOV3 and SKOV3 cells. (a) After 48 h of miR-200c-3p mimic transfection, DLC1 mRNA levels were significantly reduced compared to negative control mimic. (b) Conversely, DLC1 mRNA expression levels increased with miR-200c-3p inhibitor, compared to negative controls. (c) Western blot assay showed no significant difference in DLC1 protein expression in both CAOV3 and SKOV3 cells. Significant values are indicated as follows: ** p < 0.01 and *** p < 0.001.
Ijerph 18 05741 g004
Figure 5. The expression level of EMT/MET markers detected by quantitative real-time qRT-PCR in HGSC cell lines. (a) The CAOV3 and SKOV3 cells transfected with miR-200c-3p mimic showed a significantly increased expression level of CDH1. (b) Following transfection with miR-200c-3p inhibitor, there was significant downregulation of CDH1 expression. Significant values are indicated as follows: * p < 0.05 and ** p < 0.01.
Ijerph 18 05741 g005
Table 1. The primer sequences for DLC1 3′UTR, WT-A, WT-B, and 3′-5′ inserts. The underlined sequence is the restriction enzyme sequence.
InsertForward Primer with XbaI
(5′ to 3′)
Reverse Primer with SbfI
(5′ to 3′)
Size of
Amplicon
DLC1 3′UTRTAAGCATCTAGAGGCCACATGCCAGAATGTGCTTACCTGCAGGCAGTATAGCAAATAATAAATTTATTAGGTG2582 bp
WT_ATAAGCATCTAGAGGCCACATGCCAGAATGTGCTTACCTGCAGGCACTGATATCCAAAATACTCAAATTTTAA1684 bp
WT_BTAAGCATCTAGATTCCTCATGAAGATATACATGGATGCTTACCTGCAGGCAGTATAGCAAATAATAAATTTATTAGGTG900 bp
3′–5′TAAGCATCTAGACAGTATAGCAAATAATAAATTTATTAGGTGTGCTTACCTGCAGGGGCCACATGCCAGAATG2582 bp
Table 2. The 3′UTR of DLC1 target site isolation and substitutional mutations. The underlined sequence is the miR-200c-3p seed sequence, and the red sequence is the substitution mutation sequence.
ConstructSequenceSize
WT_A (46bp)5′-AAGAGACAGTATTAGTAAA-3′46 bp
MT_A (46bp)5′-ACTCAAGAGAGTCTATTAGTAA-3′46 bp
WT_B (53bp)5′-GCGGCTTTCAGTATTTTGTACT-3′53 bp
MT_B (53bp)5′-CGGCTTTGTCTATTTTGTAC-3′53 bp
Table 3. Summary of clinical samples.
CharacteristicsCancer Samples (n = 29)Normal Samples (n = 21)
Age (year)
Age (median)54 (24,80)55 (35,80)
≤5414 (48.23%)10 (47.62%)
>5415 (51.72%)11 (52.38%)
Race
Malay18 (62.07%)11 (52.38%)
Chinese10 (34.48%)9 (42.86%)
Others1 (3.45%)1 (4.76%)
Stage
I11 (37.93%)
II6 (20.69%)
III8 (27.59%)
IV4 (13.79%)
Publisher’s Note: MDPI stays neutral with regard to jurisdictional claims in published maps and institutional affiliations.

