
Schizophrenia: A Survey of Artificial Intelligence Techniques Applied to Detection and Classification


Abstract
:1. Introduction
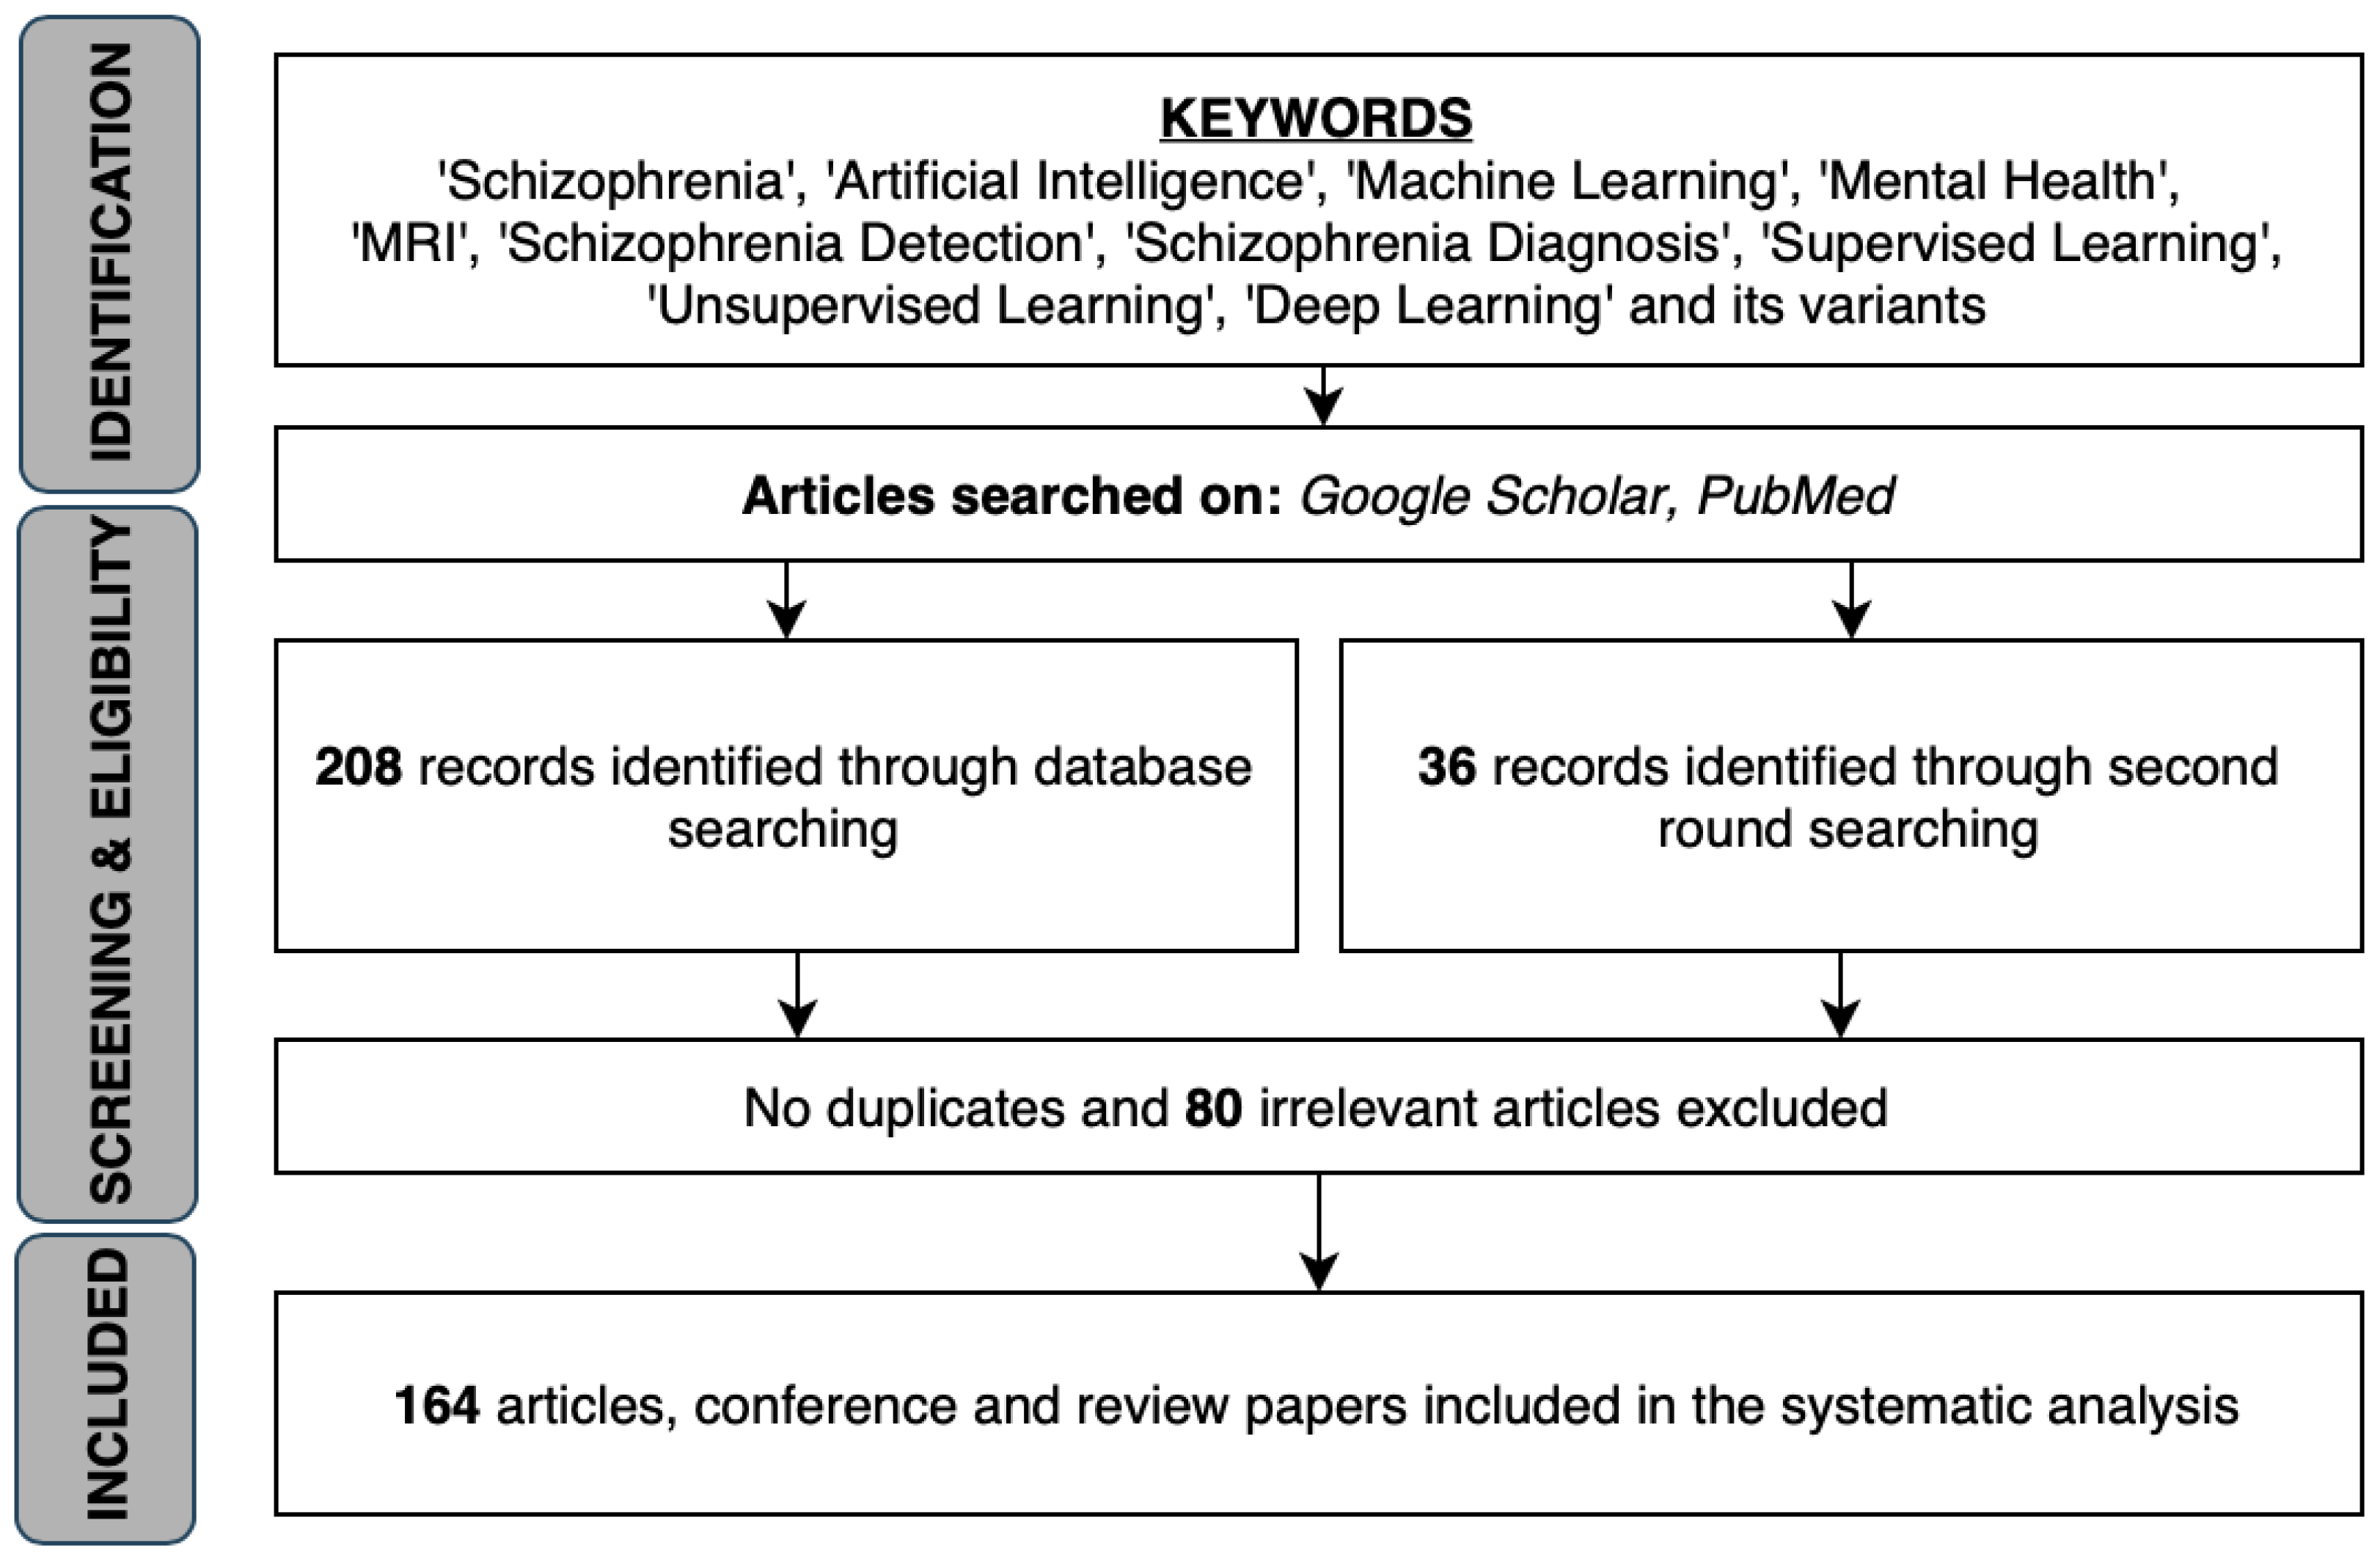
2. Methodology
3. Survey of AI Methods for Classification and Detection of Schizophrenia
3.1. Classification and Detection of SZ by MRI
3.1.1. Structural MRI
3.1.2. Functional MRI
3.1.3. Diffusion Tensor Imaging and Perfusion MRI
3.2. Classification and Detection of SZ through Other Neurological Scans
3.2.1. PET Scans
3.2.2. EEG Signal
3.3. Classification and Detection of SZ through Other Techniques
3.4. Composite Data Types for Classification and Detection
- FEP versus HC: genotype, 67.86%; DTI, 65.79%; fMRI, 65.79% and 68.42%; cognitive data, 73.69%,
- UHR versus HC: sMRI, 68.42%; DTI, 65.79%, and
- FEP versus UHR: sMRI, 76.67%; fMRI, 73.33%; cognitive data, 66.67%.
4. Outlook
5. Conclusions
Supplementary Materials
Author Contributions
Funding
Institutional Review Board Statement
Informed Consent Statement
Data Availability Statement
Conflicts of Interest
References
- Coiera, E. Artificial Intelligence in Medicine: The Challenges Ahead. J. Am. Med. Inform. Assoc. JAMIA 1996, 3, 363–366. [Google Scholar] [CrossRef] [PubMed] [Green Version]
- Jiang, F.; Jiang, Y.; Zhi, H.; Dong, Y.; Li, H.; Ma, S.; Wang, Y.; Dong, Q.; Shen, H.; Wang, Y. Artificial intelligence in healthcare: Past, present and future. Stroke Vasc. Neurol. 2017, 2, 230–243. Available online: https://0-svn-bmj-com.brum.beds.ac.uk/content/2/4/230.full.pdf (accessed on 21 December 2020). [CrossRef]
- Duncan, J.S.; Ayache, N. Medical image analysis: Progress over two decades and the challenges ahead. IEEE Trans. Pattern Anal. Mach. Intell. 2000, 22, 85–106. [Google Scholar] [CrossRef] [Green Version]
- Wang, G.; Zuluaga, M.A.; Li, W.; Pratt, R.; Patel, P.A.; Aertsen, M.; Doel, T.; David, A.L.; Deprest, J.; Ourselin, S.; et al. DeepIGeoS: A deep interactive geodesic framework for medical image segmentation. IEEE Trans. Pattern Anal. Mach. Intell. 2018, 41, 1559–1572. [Google Scholar] [CrossRef] [PubMed]
- Zitnik, M.; Nguyen, F.; Wang, B.; Leskovec, J.; Goldenberg, A.; Hoffman, M.M. Machine learning for integrating data in biology and medicine: Principles, practice, and opportunities. Inf. Fusion 2019, 50, 71–91. [Google Scholar] [CrossRef] [PubMed]
- Kulikowski, C.A. Artificial intelligence methods and systems for medical consultation. IEEE Trans. Pattern Anal. Mach. Intell. 1980, 2, 464–476. [Google Scholar] [CrossRef]
- Clough, J.; Balfour, D.R.; Da Cruz, G.L.; Marsden, P.; Prieto, C.; Reader, A.; King, A. Weighted Manifold Alignment using Wave Kernel Signatures for Aligning Medical Image Datasets. IEEE Trans. Pattern Anal. Mach. Intell. 2019, 988–997. [Google Scholar] [CrossRef]
- Yang, L.; Jin, R.; Mummert, L.; Sukthankar, R.; Goode, A.; Zheng, B.; Hoi, S.C.; Satyanarayanan, M. A boosting framework for visuality-preserving distance metric learning and its application to medical image retrieval. IEEE Trans. Pattern Anal. Mach. Intell. 2008, 32, 30–44. [Google Scholar] [CrossRef] [PubMed] [Green Version]
- Ghesu, F.C.; Georgescu, B.; Zheng, Y.; Grbic, S.; Maier, A.; Hornegger, J.; Comaniciu, D. Multi-scale deep reinforcement learning for real-time 3D-landmark detection in CT scans. IEEE Trans. Pattern Anal. Mach. Intell. 2017, 41, 176–189. [Google Scholar] [CrossRef] [PubMed]
- Panicker, S.S.; Gayathri, P. A survey of machine learning techniques in physiology based mental stress detection systems. Biocybern. Biomed. Eng. 2019, 39, 444–469. [Google Scholar] [CrossRef]
- Li, H.; Zhang, B.; Zhang, Y.; Liu, W.; Mao, Y.; Huang, J.; Wei, L. A semi-automated annotation algorithm based on weakly supervised learning for medical images. Biocybern. Biomed. Eng. 2020, 40, 787–802. [Google Scholar] [CrossRef]
- Luxton, D.D. Artificial Intelligence in Behavioral and Mental Health Care; Academic Press: Cambridge, MA, USA, 2015. [Google Scholar]
- Hamet, P.; Tremblay, J. Artificial intelligence in medicine. Metabolism 2017, 69, S36–S40. [Google Scholar] [CrossRef]
- Liang, Y.; Zheng, X.; Zeng, D.D. A survey on big data-driven digital phenotyping of mental health. Inf. Fusion 2019, 52, 290–307. [Google Scholar] [CrossRef]
- Masri, R.Y.; Jani, H.M. Employing artificial intelligence techniques in mental health diagnostic expert system. In Proceedings of the 2012 International Conference on Computer & Information Science (ICCIS), Kuala Lumpur, Malaysia, 12–14 June 2012; IEEE: Piscataway, NJ, USA, 2012; Volume 1, pp. 495–499. [Google Scholar]
- Hudson, D.L.; Estrin, T. EMERGE-A Data-driven Medical Decision Making Aid. IEEE Trans. Pattern Anal. Mach. Intell. 1984, 6, 87–91. [Google Scholar] [CrossRef] [PubMed]
- McCutcheon, R.A.; Marques, T.R.; Howes, O.D. Schizophrenia—An overview. JAMA Psychiatry 2020, 77, 201–210. [Google Scholar] [CrossRef] [PubMed]
- Gottesman, I.I. Schizophrenia Genesis: The Origins of Madness; WH Freeman/Times Books/Henry Holt & Co: New York, NY, USA, 1991. [Google Scholar]
- Arieti, S. Interpretation of Schizophrenia; Robert Brunner: New Hyde Park, NY, USA, 1955. [Google Scholar]
- National Institute of Mental Health. Schizophrenia; National Institute of Mental Health: Bethesda, MD, USA, 2016.
- Kay, S.R.; Fiszbein, A.; Opler, L.A. The positive and negative syndrome scale (PANSS) for schizophrenia. Schizophr. Bull. 1987, 13, 261–276. [Google Scholar] [CrossRef] [PubMed]
- American Psychiatric Association. Diagnostic and Statistical Manual of Mental Disorders, 5th ed.; American Psychiatric Publishing: Washington, DC, USA, 2013. [Google Scholar]
- Abrams, D.J.; Rojas, D.C.; Arciniegas, D.B. Is schizoaffective disorder a distinct categorical diagnosis? A critical review of the literature. Neuropsychiatr. Dis. Treat. 2008, 4, 1089–1109. [Google Scholar] [CrossRef] [PubMed] [Green Version]
- Li, F.; Lui, S.; Yao, L.; Hu, J.; Lv, P.; Huang, X.; Mechelli, A.; Sweeney, J.A.; Gong, Q. Longitudinal changes in resting-state cerebral activity in patients with first-episode schizophrenia: A 1-year follow-up functional MR imaging study. Radiology 2016, 279, 867–875. [Google Scholar] [CrossRef] [Green Version]
- Wheeler, A.L.; Voineskos, A.N. A review of structural neuroimaging in schizophrenia: From connectivity to connectomics. Front. Hum. Neurosci. 2014, 8, 653. [Google Scholar] [CrossRef] [Green Version]
- Leonard, C.M.; Kuldau, J.M.; Breier, J.I.; Zuffante, P.A.; Gautier, E.R.; Heron, D.C.; Lavery, E.M.; Williams, S.A.; DeBose, C.A. Cumulative effect of anatomical risk factors for schizophrenia: An MRI study. Biol. Psychiatry 1999, 46, 374–382. [Google Scholar] [CrossRef]
- Koutsouleris, N.; Meisenzahl, E.M.; Davatzikos, C.; Bottlender, R.; Frodl, T.; Scheuerecker, J.; Schmitt, G.; Zetzsche, T.; Decker, P.; Reiser, M.; et al. Use of neuroanatomical pattern classification to identify subjects in at-risk mental states of psychosis and predict disease transition. Arch. Gen. Psychiatry 2009, 66, 700–712. [Google Scholar] [CrossRef]
- Ulaş, A.; Castellani, U.; Murino, V.; Bellani, M.; Tansella, M.; Brambilla, P. Biomarker evaluation by multiple Kernel learning for schizophrenia detection. In Proceedings of the 2012 Second International Workshop on Pattern Recognition in NeuroImaging, London, UK, 2–4 July 2012; IEEE: Piscataway, NJ, USA, 2012; pp. 89–92. [Google Scholar]
- Ulaş, A.; Gönen, M.; Castellani, U.; Murino, V.; Bellani, M.; Tansella, M.; Brambilla, P. A localized MKL method for brain classification with known intra-class variability. In International Workshop on Machine Learning in Medical Imaging; Springer: Berlin/Heidelberg, Germany, 2012; pp. 152–159. [Google Scholar]
- Yang, H.; He, H.; Zhong, J. Multimodal MRI characterisation of schizophrenia: A discriminative analysis. Lancet 2016, 388, S36. [Google Scholar] [CrossRef]
- Csernansky, J.G.; Wang, L.; Jones, D.; Rastogi-Cruz, D.; Posener, J.A.; Heydebrand, G.; Miller, J.P.; Miller, M.I. Hippocampal deformities in schizophrenia characterized by high dimensional brain mapping. Am. J. Psychiatry 2002, 159, 2000–2006. [Google Scholar] [CrossRef] [Green Version]
- Davatzikos, C.; Shen, D.; Gur, R.C.; Wu, X.; Liu, D.; Fan, Y.; Hughett, P.; Turetsky, B.I.; Gur, R.E. Whole-brain morphometric study of schizophrenia revealing a spatially complex set of focal abnormalities. Arch. Gen. Psychiatry 2005, 62, 1218–1227. [Google Scholar] [CrossRef] [Green Version]
- Nakamura, K.; Kawasaki, Y.; Suzuki, M.; Hagino, H.; Kurokawa, K.; Takahashi, T.; Niu, L.; Matsui, M.; Seto, H.; Kurachi, M. Multiple structural brain measures obtained by three-dimensional magnetic resonance imaging to distinguish between schizophrenia patients and normal subjects. Schizophr. Bull. 2004, 30, 393–404. [Google Scholar] [CrossRef] [PubMed] [Green Version]
- Yushkevich, P.; Dubb, A.; Xie, Z.; Gur, R.; Gur, R.; Gee, J. Regional Structural Characterization of the Brain of Schizophrenia Patients. Acad. Radiol. 2005, 12, 1250–1261. [Google Scholar] [CrossRef] [PubMed]
- Fan, Y.; Shen, D.; Gur, R.C.; Gur, R.E.; Davatzikos, C. COMPARE: Classification of morphological patterns using adaptive regional elements. IEEE Trans. Med. Imaging 2006, 26, 93–105. [Google Scholar] [CrossRef]
- Yoon, U.; Lee, J.M.; Im, K.; Shin, Y.W.; Cho, B.H.; Kim, I.Y.; Kwon, J.S.; Kim, S.I. Pattern classification using principal components of cortical thickness and its discriminative pattern in schizophrenia. Neuroimage 2007, 34, 1405–1415. [Google Scholar] [CrossRef] [PubMed]
- Kawasaki, Y.; Suzuki, M.; Kherif, F.; Takahashi, T.; Zhou, S.Y.; Nakamura, K.; Matsui, M.; Sumiyoshi, T.; Seto, H.; Kurachi, M. Multivariate voxel-based morphometry successfully differentiates schizophrenia patients from healthy controls. Neuroimage 2007, 34, 235–242. [Google Scholar] [CrossRef] [PubMed]
- Castellani, U.; Rossato, E.; Murino, V.; Bellani, M.; Rambaldelli, G.; Tansella, M.; Brambilla, P. Local Kernel for brains classification in Schizophrenia. In Congress of the Italian Association for Artificial Intelligence; Springer: Berlin/Heidelberg, Germany, 2009; pp. 112–121. [Google Scholar]
- Pohl, K.M.; Sabuncu, M.R. A unified framework for MR based disease classification. In Proceedings of the International Conference on Information Processing in Medical Imaging, Williamsburg, VA, USA, 5–10 July 2009; Springer: Berlin/Heidelberg, Germany, 2009; pp. 300–313. [Google Scholar]
- Sun, D.; van Erp, T.G.; Thompson, P.M.; Bearden, C.E.; Daley, M.; Kushan, L.; Hardt, M.E.; Nuechterlein, K.H.; Toga, A.W.; Cannon, T.D. Elucidating a magnetic resonance imaging-based neuroanatomic biomarker for psychosis: Classification analysis using probabilistic brain atlas and machine learning algorithms. Biol. Psychiatry 2009, 66, 1055–1060. [Google Scholar] [CrossRef] [Green Version]
- Takayanagi, Y.; Kawasaki, Y.; Nakamura, K.; Takahashi, T.; Orikabe, L.; Toyoda, E.; Mozue, Y.; Sato, Y.; Itokawa, M.; Yamasue, H.; et al. Differentiation of first-episode schizophrenia patients from healthy controls using ROI-based multiple structural brain variables. Prog. Neuropsychopharmacol. Biol. Psychiatry 2010, 34, 10–17. [Google Scholar] [CrossRef]
- Castellani, U.; Perina, A.; Murino, V.; Bellani, M.; Rambaldelli, G.; Tansella, M.; Brambilla, P. Brain morphometry by probabilistic latent semantic analysis. In Proceedings of the International Conference on Medical Image Computing and Computer-Assisted Intervention, Beijing, China, 20–24 September 2010; Springer: Berlin/Heidelberg, Germany, 2010; pp. 177–184. [Google Scholar]
- Koutsouleris, N.; Gaser, C.; Bottlender, R.; Davatzikos, C.; Decker, P.; Jäger, M.; Schmitt, G.; Reiser, M.; Möller, H.J.; Meisenzahl, E.M. Use of neuroanatomical pattern regression to predict the structural brain dynamics of vulnerability and transition to psychosis. Schizophr. Res. 2010, 123, 175–187. [Google Scholar] [CrossRef]
- Kasparek, T.; Thomaz, C.E.; Sato, J.R.; Schwarz, D.; Janousova, E.; Marecek, R.; Prikryl, R.; Vanicek, J.; Fujita, A.; Ceskova, E. Maximum-uncertainty linear discrimination analysis of first-episode schizophrenia subjects. Psychiatry Res. Neuroimaging 2011, 191, 174–181. [Google Scholar] [CrossRef] [PubMed]
- Karageorgiou, E.; Schulz, S.C.; Gollub, R.L.; Andreasen, N.C.; Ho, B.C.; Lauriello, J.; Calhoun, V.D.; Bockholt, H.J.; Sponheim, S.R.; Georgopoulos, A.P. Neuropsychological testing and structural magnetic resonance imaging as diagnostic biomarkers early in the course of schizophrenia and related psychoses. Neuroinformatics 2011, 9, 321–333. [Google Scholar] [CrossRef] [PubMed] [Green Version]
- Castellani, U.; Mirtuono, P.; Murino, V.; Bellani, M.; Rambaldelli, G.; Tansella, M.; Brambilla, P. A new shape diffusion descriptor for brain classification. In Proceedings of the International Conference on Medical Image Computing and Computer-Assisted Intervention, Toronto, ON, Canada, 18–22 September 2011; Springer: Berlin/Heidelberg, Germany, 2011; pp. 426–433. [Google Scholar]
- Ulaş, A.; Duin, R.P.; Castellani, U.; Loog, M.; Mirtuono, P.; Bicego, M.; Murino, V.; Bellani, M.; Cerruti, S.; Tansella, M.; et al. Dissimilarity-based detection of schizophrenia. Int. J. Imaging Syst. Technol. 2011, 21, 179–192. [Google Scholar] [CrossRef]
- Koutsouleris, N.; Borgwardt, S.; Meisenzahl, E.M.; Bottlender, R.; Möller, H.J.; Riecher-Rössler, A. Disease prediction in the at-risk mental state for psychosis using neuroanatomical biomarkers: Results from the FePsy study. Schizophr. Bull. 2012, 38, 1234–1246. [Google Scholar] [CrossRef] [PubMed] [Green Version]
- Castellani, U.; Rossato, E.; Murino, V.; Bellani, M.; Rambaldelli, G.; Perlini, C.; Tomelleri, L.; Tansella, M.; Brambilla, P. Classification of schizophrenia using feature-based morphometry. J. Neural Transm. 2012, 119, 395–404. [Google Scholar] [CrossRef] [PubMed]
- Nieuwenhuis, M.; van Haren, N.E.; Pol, H.E.H.; Cahn, W.; Kahn, R.S.; Schnack, H.G. Classification of schizophrenia patients and healthy controls from structural MRI scans in two large independent samples. Neuroimage 2012, 61, 606–612. [Google Scholar] [CrossRef] [PubMed]
- Ota, M.; Sato, N.; Ishikawa, M.; Hori, H.; Sasayama, D.; Hattori, K.; Teraishi, T.; Obu, S.; Nakata, Y.; Nemoto, K.; et al. Discrimination of female schizophrenia patients from healthy women using multiple structural brain measures obtained with voxel-based morphometry. Psychiatry Clin. Neurosci. 2012, 66, 611–617. [Google Scholar] [CrossRef] [PubMed] [Green Version]
- Bansal, R.; Staib, L.H.; Laine, A.F.; Hao, X.; Xu, D.; Liu, J.; Weissman, M.; Peterson, B.S. Anatomical brain images alone can accurately diagnose chronic neuropsychiatric illnesses. PLoS ONE 2012, 7, e50698. [Google Scholar] [CrossRef] [PubMed]
- Greenstein, D.; Weisinger, B.; Malley, J.D.; Clasen, L.; Gogtay, N. Using multivariate machine learning methods and structural MRI to classify childhood onset schizophrenia and healthy controls. Front. Psychiatry 2012, 3, 53. [Google Scholar] [CrossRef] [Green Version]
- Borgwardt, S.; Koutsouleris, N.; Aston, J.; Studerus, E.; Smieskova, R.; Riecher-Rössler, A.; Meisenzahl, E.M. Distinguishing prodromal from first-episode psychosis using neuroanatomical single-subject pattern recognition. Schizophr. Bull. 2013, 39, 1105–1114. [Google Scholar] [CrossRef] [Green Version]
- Iwabuchi, S.; Liddle, P.F.; Palaniyappan, L. Clinical utility of machine-learning approaches in schizophrenia: Improving diagnostic confidence for translational neuroimaging. Front. Psychiatry 2013, 4, 95. [Google Scholar] [CrossRef] [PubMed] [Green Version]
- Zanetti, M.V.; Schaufelberger, M.S.; Doshi, J.; Ou, Y.; Ferreira, L.K.; Menezes, P.R.; Scazufca, M.; Davatzikos, C.; Busatto, G.F. Neuroanatomical pattern classification in a population-based sample of first-episode schizophrenia. Prog. Neuropsychopharmacol. Biol. Psychiatry 2013, 43, 116–125. [Google Scholar] [CrossRef] [PubMed] [Green Version]
- Gould, I.C.; Shepherd, A.M.; Laurens, K.R.; Cairns, M.J.; Carr, V.J.; Green, M.J. Multivariate neuroanatomical classification of cognitive subtypes in schizophrenia: A support vector machine learning approach. Neuroimage Clin. 2014, 6, 229–236. [Google Scholar] [CrossRef] [PubMed] [Green Version]
- Perina, A.; Peruzzo, D.; Kesa, M.; Jojic, N.; Murino, V.; Bellani, M.; Brambilla, P.; Castellani, U. Mapping brains on grids of features for Schizophrenia analysis. In Proceedings of the International Conference on Medical Image Computing and Computer-Assisted Intervention, Boston, MA, USA, 14–18 September 2014; Springer: Berlin/Heidelberg, Germany, 2014; pp. 805–812. [Google Scholar]
- Schnack, H.G.; Nieuwenhuis, M.; van Haren, N.E.; Abramovic, L.; Scheewe, T.W.; Brouwer, R.M.; Pol, H.E.H.; Kahn, R.S. Can structural MRI aid in clinical classification? A machine learning study in two independent samples of patients with schizophrenia, bipolar disorder and healthy subjects. Neuroimage 2014, 84, 299–306. [Google Scholar] [CrossRef] [PubMed]
- Cabral, C.; Kambeitz-Ilankovic, L.; Kambeitz, J.; Calhoun, V.D.; Dwyer, D.B.; Von Saldern, S.; Urquijo, M.F.; Falkai, P.; Koutsouleris, N. Classifying schizophrenia using multimodal multivariate pattern recognition analysis: Evaluating the impact of individual clinical profiles on the neurodiagnostic performance. Schizophr. Bull. 2016, 42, S110–S117. [Google Scholar] [CrossRef] [Green Version]
- Lu, X.; Yang, Y.; Wu, F.; Gao, M.; Xu, Y.; Zhang, Y.; Yao, Y.; Du, X.; Li, C.; Wu, L.; et al. Discriminative analysis of schizophrenia using support vector machine and recursive feature elimination on structural MRI images. Medicine (Baltimore) 2016, 95, e3973. [Google Scholar] [CrossRef] [PubMed]
- Squarcina, L.; Castellani, U.; Bellani, M.; Perlini, C.; Lasalvia, A.; Dusi, N.; Bonetto, C.; Cristofalo, D.; Tosato, S.; Rambaldelli, G.; et al. Classification of first-episode psychosis in a large cohort of patients using support vector machine and multiple kernel learning techniques. Neuroimage 2017, 145, 238–245. [Google Scholar] [CrossRef]
- Rozycki, M.; Satterthwaite, T.D.; Koutsouleris, N.; Erus, G.; Doshi, J.; Wolf, D.H.; Fan, Y.; Gur, R.E.; Gur, R.C.; Meisenzahl, E.M.; et al. Multisite machine learning analysis provides a robust structural imaging signature of schizophrenia detectable across diverse patient populations and within individuals. Schizophr. Bull. 2018, 44, 1035–1044. [Google Scholar] [CrossRef] [PubMed]
- de Moura, A.M.; Pinaya, W.H.L.; Gadelha, A.; Zugman, A.; Noto, C.; Cordeiro, Q.; Belangero, S.I.; Jackowski, A.P.; Bressan, R.A.; Sato, J.R. Investigating brain structural patterns in first episode psychosis and schizophrenia using MRI and a machine learning approach. Psychiatry Res. Neuroimaging 2018, 275, 14–20. [Google Scholar] [CrossRef]
- Liang, S.; Li, Y.; Zhang, Z.; Kong, X.; Wang, Q.; Deng, W.; Li, X.; Zhao, L.; Li, M.; Meng, Y.; et al. Classification of first-episode schizophrenia using multimodal brain features: A combined structural and diffusion imaging study. Schizophr. Bull. 2019, 45, 591–599. [Google Scholar] [CrossRef] [PubMed]
- Deng, Y.; Hung, K.S.; Lui, S.S.; Chui, W.W.; Lee, J.C.; Wang, Y.; Li, Z.; Mak, H.K.; Sham, P.C.; Chan, R.C.; et al. Tractography-based classification in distinguishing patients with first-episode schizophrenia from healthy individuals. Prog. Neuropsychopharmacol. Biol. Psychiatry 2019, 88, 66–73. [Google Scholar] [CrossRef]
- Calhoun, V.D.; Adalı, T.; Kiehl, K.A.; Astur, R.; Pekar, J.J.; Pearlson, G.D. A method for multitask fMRI data fusion applied to schizophrenia. Hum. Brain Mapp. 2006, 27, 598–610. [Google Scholar] [CrossRef] [PubMed] [Green Version]
- Jafri, M.J.; Calhoun, V.D. Functional classification of schizophrenia using feed forward neural networks. In Proceedings of the 2006 International Conference of the IEEE Engineering in Medicine and Biology Society, New York, NY, USA, 30 August–3 September 2006; IEEE: Piscataway, NJ, USA, 2006; pp. 6631–6634. [Google Scholar]
- Calhoun, V.D.; Maciejewski, P.K.; Pearlson, G.D.; Kiehl, K.A. Temporal lobe and “default” hemodynamic brain modes discriminate between schizophrenia and bipolar disorder. Hum. Brain Mapp. 2008, 29, 1265–1275. [Google Scholar] [CrossRef] [Green Version]
- Anderson, A.; Dinov, I.D.; Sherin, J.E.; Quintana, J.; Yuille, A.L.; Cohen, M.S. Classification of spatially unaligned fMRI scans. Neuroimage 2010, 49, 2509–2519. [Google Scholar] [CrossRef] [PubMed] [Green Version]
- Arribas, J.I.; Calhoun, V.D.; Adali, T. Automatic Bayesian classification of healthy controls, bipolar disorder, and schizophrenia using intrinsic connectivity maps from FMRI data. IEEE Trans. Biomed. Eng. 2010, 57, 2850–2860. [Google Scholar] [CrossRef] [PubMed] [Green Version]
- Shen, H.; Wang, L.; Liu, Y.; Hu, D. Discriminative analysis of resting-state functional connectivity patterns of schizophrenia using low dimensional embedding of fMRI. Neuroimage 2010, 49, 3110–3121. [Google Scholar] [CrossRef] [PubMed]
- Yang, H.; Liu, J.; Sui, J.; Pearlson, G.; Calhoun, V.D. A hybrid machine learning method for fusing fMRI and genetic data: Combining both improves classification of schizophrenia. Front. Hum. Neurosci. 2010, 4, 192. [Google Scholar] [CrossRef] [Green Version]
- Castro, E.; Martínez-Ramón, M.; Pearlson, G.; Sui, J.; Calhoun, V.D. Characterization of groups using composite kernels and multi-source fMRI analysis data: Application to schizophrenia. Neuroimage 2011, 58, 526–536. [Google Scholar] [CrossRef] [Green Version]
- Costafreda, S.G.; Fu, C.H.; Picchioni, M.; Toulopoulou, T.; McDonald, C.; Kravariti, E.; Walshe, M.; Prata, D.; Murray, R.M.; McGuire, P.K. Pattern of neural responses to verbal fluency shows diagnostic specificity for schizophrenia and bipolar disorder. BMC Psychiatry 2011, 11, 18. [Google Scholar] [CrossRef] [Green Version]
- Fan, Y.; Liu, Y.; Wu, H.; Hao, Y.; Liu, H.; Liu, Z.; Jiang, T. Discriminant analysis of functional connectivity patterns on Grassmann manifold. Neuroimage 2011, 56, 2058–2067. [Google Scholar] [CrossRef]
- Du, W.; Calhoun, V.D.; Li, H.; Ma, S.; Eichele, T.; Kiehl, K.A.; Pearlson, G.D.; Adali, T. High classification accuracy for schizophrenia with rest and task fMRI data. Front. Hum. Neurosci. 2012, 6, 145. [Google Scholar] [CrossRef] [Green Version]
- Liu, M.; Zeng, L.L.; Shen, H.; Liu, Z.; Hu, D. Potential risk for healthy siblings to develop schizophrenia: Evidence from pattern classification with whole-brain connectivity. Neuroreport 2012, 23, 265–269. [Google Scholar] [CrossRef]
- Venkataraman, A.; Whitford, T.J.; Westin, C.F.; Golland, P.; Kubicki, M. Whole brain resting state functional connectivity abnormalities in schizophrenia. Schizophr. Res. 2012, 139, 7–12. [Google Scholar] [CrossRef] [Green Version]
- Yoon, J.H.; Nguyen, D.V.; McVay, L.M.; Deramo, P.; Minzenberg, M.J.; Ragland, J.D.; Niendham, T.; Solomon, M.; Carter, C.S. Automated classification of fMRI during cognitive control identifies more severely disorganized subjects with schizophrenia. Schizophr. Res. 2012, 135, 28–33. [Google Scholar] [CrossRef] [Green Version]
- Anderson, A.; Cohen, M.S. Decreased small-world functional network connectivity and clustering across resting state networks in schizophrenia: An fMRI classification tutorial. Front. Hum. Neurosci. 2013, 7, 520. [Google Scholar] [CrossRef] [Green Version]
- Arbabshirani, M.R.; Kiehl, K.; Pearlson, G.; Calhoun, V.D. Classification of schizophrenia patients based on resting-state functional network connectivity. Front. Neurosci. 2013, 7, 133. [Google Scholar] [CrossRef] [PubMed] [Green Version]
- Fekete, T.; Wilf, M.; Rubin, D.; Edelman, S.; Malach, R.; Mujica-Parodi, L.R. Combining classification with fMRI-derived complex network measures for potential neurodiagnostics. PLoS ONE 2013, 8, e62867. [Google Scholar] [CrossRef] [PubMed] [Green Version]
- Yu, Y.; Shen, H.; Zeng, L.L.; Ma, Q.; Hu, D. Convergent and divergent functional connectivity patterns in schizophrenia and depression. PLoS ONE 2013, 8, e68250. [Google Scholar] [CrossRef] [PubMed] [Green Version]
- Yu, Y.; Shen, H.; Zhang, H.; Zeng, L.L.; Xue, Z.; Hu, D. Functional connectivity-based signatures of schizophrenia revealed by multiclass pattern analysis of resting-state fMRI from schizophrenic patients and their healthy siblings. Biomed. Eng. Online 2013, 12, 10. [Google Scholar] [CrossRef] [PubMed] [Green Version]
- Anticevic, A.; Cole, M.W.; Repovs, G.; Murray, J.D.; Brumbaugh, M.S.; Winkler, A.M.; Savic, A.; Krystal, J.H.; Pearlson, G.D.; Glahn, D.C. Characterizing thalamo-cortical disturbances in schizophrenia and bipolar illness. Cereb. Cortex 2014, 24, 3116–3130. [Google Scholar] [CrossRef]
- Brodersen, K.H.; Deserno, L.; Schlagenhauf, F.; Lin, Z.; Penny, W.D.; Buhmann, J.M.; Stephan, K.E. Dissecting psychiatric spectrum disorders by generative embedding. Neuroimage Clin. 2014, 4, 98–111. [Google Scholar] [CrossRef] [PubMed]
- Castro, E.; Gómez-Verdejo, V.; Martínez-Ramón, M.; Kiehl, K.A.; Calhoun, V.D. A multiple kernel learning approach to perform classification of groups from complex-valued fMRI data analysis: Application to schizophrenia. Neuroimage 2014, 87, 1–17. [Google Scholar] [CrossRef] [PubMed] [Green Version]
- Guo, S.; Kendrick, K.M.; Yu, R.; Wang, H.L.S.; Feng, J. Key functional circuitry altered in schizophrenia involves parietal regions associated with sense of self. Hum. Brain Mapp. 2014, 35, 123–139. [Google Scholar] [CrossRef]
- Watanabe, T.; Kessler, D.; Scott, C.; Angstadt, M.; Sripada, C. Disease prediction based on functional connectomes using a scalable and spatially-informed support vector machine. Neuroimage 2014, 96, 183–202. [Google Scholar] [CrossRef] [Green Version]
- Cheng, W.; Palaniyappan, L.; Li, M.; Kendrick, K.M.; Zhang, J.; Luo, Q.; Liu, Z.; Yu, R.; Deng, W.; Wang, Q.; et al. Voxel-based, brain-wide association study of aberrant functional connectivity in schizophrenia implicates thalamocortical circuitry. NPJ Schizophr. 2015, 1, 15016. [Google Scholar] [CrossRef] [Green Version]
- Chyzhyk, D.; Graña, M.; Öngür, D.; Shinn, A.K. Discrimination of schizophrenia auditory hallucinators by machine learning of resting-state functional MRI. Int. J. Neural Syst. 2015, 25, 1550007. [Google Scholar] [CrossRef] [Green Version]
- Kaufmann, T.; Skåtun, K.C.; Alnæs, D.; Doan, N.T.; Duff, E.P.; Tønnesen, S.; Roussos, E.; Ueland, T.; Aminoff, S.R.; Lagerberg, T.V.; et al. Disintegration of sensorimotor brain networks in schizophrenia. Schizophr. Bull. 2015, 41, 1326–1335. [Google Scholar] [CrossRef]
- Pouyan, A.A.; Shahamat, H. A texture-based method for classification of schizophrenia using fMRI data. Biocybern. Biomed. Eng. 2015, 35, 45–53. [Google Scholar] [CrossRef]
- Mikolas, P.; Melicher, T.; Skoch, A.; Matejka, M.; Slovakova, A.; Bakstein, E.; Hajek, T.; Spaniel, F. Connectivity of the anterior insula differentiates participants with first-episode schizophrenia spectrum disorders from controls: A machine-learning study. Psychol. Med. 2016, 46, 2695–2704. [Google Scholar] [CrossRef]
- Peters, H.; Shao, J.; Scherr, M.; Schwerthöffer, D.; Zimmer, C.; Förstl, H.; Bäuml, J.; Wohlschläger, A.; Riedl, V.; Koch, K.; et al. More consistently altered connectivity patterns for cerebellum and medial temporal lobes than for amygdala and striatum in schizophrenia. Front. Hum. Neurosci. 2016, 10, 55. [Google Scholar] [CrossRef] [PubMed] [Green Version]
- Skåtun, K.C.; Kaufmann, T.; Doan, N.T.; Alnæs, D.; Córdova-Palomera, A.; Jönsson, E.G.; Fatouros-Bergman, H.; Flyckt, L.; KaSP; Melle, I.; et al. Consistent functional connectivity alterations in schizophrenia spectrum disorder: A multisite study. Schizophr. Bull. 2017, 43, 914–924. [Google Scholar] [CrossRef] [Green Version]
- Chen, X.; Liu, C.; He, H.; Chang, X.; Jiang, Y.; Li, Y.; Duan, M.; Li, J.; Luo, C.; Yao, D. Transdiagnostic differences in the resting-state functional connectivity of the prefrontal cortex in depression and schizophrenia. J. Affect. Disord. 2017, 217, 118–124. [Google Scholar] [CrossRef] [PubMed]
- Kaufmann, T.; Alnæs, D.; Brandt, C.L.; Doan, N.T.; Kauppi, K.; Bettella, F.; Lagerberg, T.V.; Berg, A.O.; Djurovic, S.; Agartz, I.; et al. Task modulations and clinical manifestations in the brain functional connectome in 1615 fMRI datasets. Neuroimage 2017, 147, 243–252. [Google Scholar] [CrossRef]
- Guo, W.; Liu, F.; Chen, J.; Wu, R.; Li, L.; Zhang, Z.; Zhao, J. Family-based case-control study of homotopic connectivity in first-episode, drug-naive schizophrenia at rest. Sci. Rep. 2017, 7, 43312. [Google Scholar] [CrossRef] [Green Version]
- Iwabuchi, S.J.; Palaniyappan, L. Abnormalities in the effective connectivity of visuothalamic circuitry in schizophrenia. Psychol. Med. 2017, 47, 1300–1310. [Google Scholar] [CrossRef]
- Yang, Y.; Cui, Y.; Xu, K.; Liu, B.; Song, M.; Chen, J.; Wang, H.; Chen, Y.; Guo, H.; Li, P.; et al. Distributed functional connectivity impairment in schizophrenia: A multi-site study. In Proceedings of the 2nd IET International Conference on Biomedical Image and Signal Processing (ICBISP 2017), Wuhan, China, 13–14 May 2017; IET: London, UK, 2017; pp. 1–6. [Google Scholar]
- Bae, Y.; Kumarasamy, K.; Ali, I.M.; Korfiatis, P.; Akkus, Z.; Erickson, B.J. Differences between schizophrenic and normal subjects using network properties from fMRI. J. Digit. Imaging 2018, 31, 252–261. [Google Scholar] [CrossRef] [PubMed]
- Li, J.; Sun, Y.; Huang, Y.; Bezerianos, A.; Yu, R. Machine learning technique reveals intrinsic characteristics of schizophrenia: An alternative method. Brain Imaging Behav. 2019, 13, 1386–1396. [Google Scholar] [CrossRef] [PubMed]
- Chatterjee, I.; Kumar, V.; Sharma, S.; Dhingra, D.; Rana, B.; Agarwal, M.; Kumar, N. Identification of brain regions associated with working memory deficit in schizophrenia. F1000Research 2019, 8, 124. [Google Scholar] [CrossRef] [Green Version]
- Kalmady, S.V.; Greiner, R.; Agrawal, R.; Shivakumar, V.; Narayanaswamy, J.C.; Brown, M.R.; Greenshaw, A.J.; Dursun, S.M.; Venkatasubramanian, G. Towards artificial intelligence in mental health by improving schizophrenia prediction with multiple brain parcellation ensemble-learning. NPJ Schizophr. 2019, 5, 1–11. [Google Scholar] [CrossRef] [Green Version]
- Kubicki, M.; McCarley, R.; Westin, C.F.; Park, H.J.; Maier, S.; Kikinis, R.; Jolesz, F.A.; Shenton, M.E. A review of diffusion tensor imaging studies in schizophrenia. J. Psychiatr. Res. 2007, 41, 15–30. [Google Scholar] [CrossRef] [Green Version]
- Kyriakopoulos, M.; Bargiotas, T.; Barker, G.J.; Frangou, S. Diffusion tensor imaging in schizophrenia. Eur. Psychiatry 2008, 23, 255–273. [Google Scholar] [CrossRef]
- Pinkham, A.; Loughead, J.; Ruparel, K.; Wu, W.C.; Overton, E.; Gur, R.; Gur, R. Resting quantitative cerebral blood flow in schizophrenia measured by pulsed arterial spin labeling perfusion MRI. Psychiatry Res. Neuroimaging 2011, 194, 64–72. [Google Scholar] [CrossRef] [PubMed] [Green Version]
- Korfiatis, P.; Erickson, B. The basics of diffusion and perfusion imaging in brain tumors. Appl. Radiol. 2014, 43, 22. [Google Scholar] [PubMed]
- Caan, M.W.; Vermeer, K.A.; van Vliet, L.J.; Majoie, C.B.; Peters, B.; den Heeten, G.; Vos, F.M. Shaving diffusion tensor images in discriminant analysis: A study into schizophrenia. Med. Image Anal. 2006, 10, 841–849. [Google Scholar] [CrossRef] [PubMed]
- Caprihan, A.; Pearlson, G.D.; Calhoun, V.D. Application of principal component analysis to distinguish patients with schizophrenia from healthy controls based on fractional anisotropy measurements. Neuroimage 2008, 42, 675–682. [Google Scholar] [CrossRef] [PubMed] [Green Version]
- Ingalhalikar, M.; Kanterakis, S.; Gur, R.; Roberts, T.P.; Verma, R. DTI based diagnostic prediction of a disease via pattern classification. In Proceedings of the International Conference on Medical Image Computing and Computer-Assisted Intervention, Beijing, China, 20–24 September 2010; Springer: Berlin/Heidelberg, Germany, 2010; pp. 558–565. [Google Scholar]
- Rathi, Y.; Malcolm, J.; Michailovich, O.; Goldstein, J.; Seidman, L.; McCarley, R.W.; Westin, C.F.; Shenton, M.E. Biomarkers for identifying first-episode schizophrenia patients using diffusion weighted imaging. In Proceedings of the International Conference on Medical Image Computing and Computer-Assisted Intervention, Beijing, China, 20–24 September 2010; Springer: Berlin/Heidelberg, Germany, 2010; pp. 657–665. [Google Scholar]
- Ardekani, B.A.; Tabesh, A.; Sevy, S.; Robinson, D.G.; Bilder, R.M.; Szeszko, P.R. Diffusion tensor imaging reliably differentiates patients with schizophrenia from healthy volunteers. Hum. Brain Mapp. 2011, 32, 1–9. [Google Scholar] [CrossRef] [Green Version]
- Squarcina, L.; Perlini, C.; Peruzzo, D.; Castellani, U.; Marinelli, V.; Bellani, M.; Rambaldelli, G.; Lasalvia, A.; Tosato, S.; De Santi, K.; et al. The use of dynamic susceptibility contrast (DSC) MRI to automatically classify patients with first episode psychosis. Schizophr. Res. 2015, 165, 38–44. [Google Scholar] [CrossRef]
- Levy, A.V.; Gomez-Mont, F.; Volkow, N.D.; Corona, J.F.; Brodie, J.D.; Cancro, R. Spatial low frequency pattern analysis in positron emission tomography: A study between normals and schizophrenics. Brain 1991, 33, 35. [Google Scholar]
- Josin, G.; Liddle, P. Neural network analysis of the pattern of functional connectivity between cerebral areas in schizophrenia. Biol. Cybern. 2001, 84, 117–122. [Google Scholar] [CrossRef]
- Bose, S.K.; Turkheimer, F.E.; Howes, O.D.; Mehta, M.A.; Cunliffe, R.; Stokes, P.R.; Grasby, P.M. Classification of schizophrenic patients and healthy controls using [18F] fluorodopa PET imaging. Schizophr. Res. 2008, 106, 148–155. [Google Scholar] [CrossRef] [PubMed]
- Rissling, A.J.; Miyakoshi, M.; Sugar, C.A.; Braff, D.L.; Makeig, S.; Light, G.A. Cortical substrates and functional correlates of auditory deviance processing deficits in schizophrenia. NeuroImage Clin. 2014, 6, 424–437. [Google Scholar] [CrossRef] [Green Version]
- Dvey-Aharon, Z.; Fogelson, N.; Peled, A.; Intrator, N. Schizophrenia detection and classification by advanced analysis of EEG recordings using a single electrode approach. PLoS ONE 2015, 10, e0123033. [Google Scholar] [CrossRef] [PubMed] [Green Version]
- Light, G.A.; Swerdlow, N.R.; Thomas, M.L.; Calkins, M.E.; Green, M.F.; Greenwood, T.A.; Gur, R.E.; Gur, R.C.; Lazzeroni, L.C.; Nuechterlein, K.H.; et al. Validation of mismatch negativity and P3a for use in multi-site studies of schizophrenia: Characterization of demographic, clinical, cognitive, and functional correlates in COGS-2. Schizophr. Res. 2015, 163, 63–72. [Google Scholar] [CrossRef] [PubMed] [Green Version]
- Jahmunah, V.; Oh, S.L.; Rajinikanth, V.; Ciaccio, E.J.; Cheong, K.H.; Arunkumar, N.; Acharya, U.R. Automated detection of schizophrenia using nonlinear signal processing methods. Artif. Intell. Med. 2019, 100, 101698. [Google Scholar] [CrossRef] [PubMed]
- da Cruz, J.R.; Favrod, O.; Roinishvili, M.; Chkonia, E.; Brand, A.; Mohr, C.; Figueiredo, P.; Herzog, M.H. EEG microstates are a candidate endophenotype for schizophrenia. Nat. Commun. 2020, 11, 3089. [Google Scholar] [CrossRef]
- Khosla, A.; Khandnor, P.; Chand, T. A comparative analysis of signal processing and classification methods for different applications based on EEG signals. Biocybern. Biomed. Eng. 2020, 40, 649–690. [Google Scholar] [CrossRef]
- Knott, V.; Mahoney, C.; Labelle, A.; Ripley, C.; Cavazzoni, P.; Jones, B. Event-related potentials in schizophrenic patients during a degraded stimulus version of the visual continuous performance task. Schizophr. Res. 1999, 35, 263–278. [Google Scholar] [CrossRef]
- Neuhaus, A.H.; Popescu, F.C.; Grozea, C.; Hahn, E.; Hahn, C.; Opgen-Rhein, C.; Urbanek, C.; Dettling, M. Single-subject classification of schizophrenia by event-related potentials during selective attention. Neuroimage 2011, 55, 514–521. [Google Scholar] [CrossRef] [PubMed]
- Iyer, D.; Boutros, N.N.; Zouridakis, G. Single-trial analysis of auditory evoked potentials improves separation of normal and schizophrenia subjects. Clin. Neurophysiol. 2012, 123, 1810–1820. [Google Scholar] [CrossRef]
- Laton, J.; Van Schependom, J.; Gielen, J.; Decoster, J.; Moons, T.; De Keyser, J.; De Hert, M.; Nagels, G. Single-subject classification of schizophrenia patients based on a combination of oddball and mismatch evoked potential paradigms. J. Neurol. Sci. 2014, 347, 262–267. [Google Scholar] [CrossRef]
- Neuhaus, A.H.; Popescu, F.C.; Rentzsch, J.; Gallinat, J. Critical evaluation of auditory event-related potential deficits in schizophrenia: Evidence from large-scale single-subject pattern classification. Schizophr. Bull. 2014, 40, 1062–1071. [Google Scholar] [CrossRef] [Green Version]
- Johannesen, J.K.; Bi, J.; Jiang, R.; Kenney, J.G.; Chen, C.M.A. Machine learning identification of EEG features predicting working memory performance in schizophrenia and healthy adults. Neuropsychiatr. Electrophysiol. 2016, 2, 3–21. [Google Scholar] [CrossRef] [Green Version]
- Shim, M.; Hwang, H.J.; Kim, D.W.; Lee, S.H.; Im, C.H. Machine-learning-based diagnosis of schizophrenia using combined sensor-level and source-level EEG features. Schizophr. Res. 2016, 176, 314–319. [Google Scholar] [CrossRef]
- Taylor, J.A.; Matthews, N.; Michie, P.T.; Rosa, M.J.; Garrido, M.I. Auditory prediction errors as individual biomarkers of schizophrenia. NeuroImage Clin. 2017, 15, 264–273. [Google Scholar] [CrossRef] [PubMed]
- Krishnan, P.T.; Raj, A.N.J.; Balasubramanian, P.; Chen, Y. Schizophrenia detection using Multivariate Empirical Mode Decomposition and Entropy Measures from Multichannel EEG Sentropy measures from multichannel EEG signal. Biocybern. Biomed. Eng. 2020, 40, 1124–1139. [Google Scholar] [CrossRef]
- Mealer, R.G.; Williams, S.E.; Daly, M.J.; Scolnick, E.M.; Cummings, R.D.; Smoller, J.W. Glycobiology and schizophrenia: A biological hypothesis emerging from genomic research. Mol. Psychiatry 2020, 25, 3129–3139. [Google Scholar] [CrossRef] [PubMed]
- Arango, C.; Bartko, J.J.; Gold, J.M.; Buchanan, R.W. Prediction of neuropsychological performance by neurological signs in schizophrenia. Am. J. Psychiatry 1999, 156, 1349–1357. [Google Scholar] [PubMed]
- Pina-Camacho, L.; Garcia-Prieto, J.; Parellada, M.; Castro-Fornieles, J.; Gonzalez-Pinto, A.M.; Bombin, I.; Graell, M.; Paya, B.; Rapado-Castro, M.; Janssen, J.; et al. Predictors of schizophrenia spectrum disorders in early-onset first episodes of psychosis: A support vector machine model. Eur. Child Adolesc. Psychiatry 2015, 24, 427–440. [Google Scholar] [CrossRef] [PubMed] [Green Version]
- Liang, S.; Vega, R.; Kong, X.; Deng, W.; Wang, Q.; Ma, X.; Li, M.; Hu, X.; Greenshaw, A.J.; Greiner, R.; et al. Neurocognitive graphs of first-episode schizophrenia and major depression based on cognitive features. Neurosci. Bull. 2018, 34, 312–320. [Google Scholar] [CrossRef] [Green Version]
- Liang, S.; Brown, M.R.; Deng, W.; Wang, Q.; Ma, X.; Li, M.; Hu, X.; Juhas, M.; Li, X.; Greiner, R.; et al. Convergence and divergence of neurocognitive patterns in schizophrenia and depression. Schizophr. Res. 2018, 192, 327–334. [Google Scholar] [CrossRef] [PubMed]
- Brodey, B.; Girgis, R.; Favorov, O.; Bearden, C.; Woods, S.; Addington, J.; Perkins, D.; Walker, E.; Cornblatt, B.; Brucato, G.; et al. The Early Psychosis Screener for Internet (EPSI)-SR: Predicting 12 month psychotic conversion using machine learning. Schizophr. Res. 2019, 208, 390–396. [Google Scholar] [CrossRef]
- Campana, A.; Duci, A.; Gambini, O.; Scarone, S. An artificial neural network that uses eye-tracking performance to identify patients with schizophrenia. Schizophr. Bull. 1999, 25, 789–799. [Google Scholar] [CrossRef] [PubMed] [Green Version]
- Santos, P.E.; Thomaz, C.E.; dos Santos, D.; Freire, R.; Sato, J.R.; Louzã, M.; Sallet, P.; Busatto, G.; Gattaz, W.F. Exploring the knowledge contained in neuroimages: Statistical discriminant analysis and automatic segmentation of the most significant changes. Artif. Intell. Med. 2010, 49, 105–115. [Google Scholar] [CrossRef] [PubMed]
- Tron, T.; Peled, A.; Grinsphoon, A.; Weinshall, D. Automated facial expressions analysis in schizophrenia: A continuous dynamic approach. In Proceedings of the International Symposium on Pervasive Computing Paradigms for Mental Health, Milan, Italy, 24–25 September 2015; Springer: Berlin/Heidelberg, Germany, 2015; pp. 72–81. [Google Scholar]
- Strous, R.D.; Koppel, M.; Fine, J.; Nachliel, S.; Shaked, G.; Zivotofsky, A.Z. Automated characterization and identification of schizophrenia in writing. J. Nerv. Ment. Dis. 2009, 197, 585–588. [Google Scholar] [CrossRef] [Green Version]
- Kliper, R.; Portuguese, S.; Weinshall, D. Prosodic analysis of speech and the underlying mental state. In Proceedings of the International Symposium on Pervasive Computing Paradigms for Mental Health, Milan, Italy, 24–25 September 2015; Springer: Berlin/Heidelberg, Germany, 2015; pp. 52–62. [Google Scholar]
- Gerig, G.; Styner, M.; Shenton, M.E.; Lieberman, J.A. Shape versus size: Improved understanding of the morphology of brain structures. In Proceedings of the International Conference on Medical Image Computing and Computer-Assisted Intervention, Utrecht, The Netherlands, 14–17 October 2001; Springer: Berlin/Heidelberg, Germany, 2001; pp. 24–32. [Google Scholar]
- Gorrell, G.; Roberts, A.; Jackson, R.; Stewart, R. Finding negative symptoms of schizophrenia in patient records. In Proceedings of the Workshop on NLP for Medicine and Biology associated with RANLP 2013, Hissar, Bulgaria, 13 September 2013; pp. 9–17. [Google Scholar]
- Patel, R.; Jayatilleke, N.; Jackson, R.; Stewart, R.; McGuire, P. Investigation of negative symptoms in schizophrenia with a machine learning text-mining approach. Lancet 2014, 383, S16. [Google Scholar] [CrossRef]
- Chakraborty, D.; Tahir, Y.; Yang, Z.; Maszczyk, T.; Dauwels, J.; Thalmann, D.; Thalmann, N.M.; Tan, B.L.; Lee, J. Assessment and prediction of negative symptoms of schizophrenia from RGB + D movement signals. In Proceedings of the 2017 IEEE 19th International Workshop on Multimedia Signal Processing (MMSP), Luton, UK, 16–18 October 2017; IEEE: Piscataway, NJ, USA, 2017; pp. 1–6. [Google Scholar]
- Chakraborty, D.; Xu, S.; Yang, Z.; Chua, Y.H.V.; Tahir, Y.; Dauwels, J.; Thalmann, N.M.; Tan, B.L.; Keong, J.L.C. Prediction of negative symptoms of schizophrenia from objective linguistic, acoustic and non-verbal conversational cues. In Proceedings of the 2018 International Conference on Cyberworlds (CW), Singapore, 3–5 October 2018; IEEE: Piscataway, NJ, USA, 2018; pp. 280–283. [Google Scholar]
- McManus, K.; Mallory, E.K.; Goldfeder, R.L.; Haynes, W.A.; Tatum, J.D. Mining Twitter data to improve detection of schizophrenia. AMIA Summits Transl. Sci. Proc. 2015, 2015, 122. [Google Scholar]
- Mitchell, M.; Hollingshead, K.; Coppersmith, G. Quantifying the language of schizophrenia in social media. In Proceedings of the 2nd Workshop on Computational Linguistics and Clinical Psychology: From Linguistic Signal to Clinical Reality, Denver, CO, USA, 5 June 2015; pp. 11–20. [Google Scholar]
- Birnbaum, M.L.; Ernala, S.K.; Rizvi, A.F.; De Choudhury, M.; Kane, J.M. A collaborative approach to identifying social media markers of schizophrenia by employing machine learning and clinical appraisals. J. Med. Internet Res. 2017, 19, e289. [Google Scholar] [CrossRef]
- Carter, J.; Parnas, J.; Cannon, T.; Schulsinger, F.; Mednick, S. MMPI variables predictive of schizophrenia in the Copenhagen High-Risk Project: A 25-year follow-up. Acta Psychiatr. Scand. 1999, 99, 432–440. [Google Scholar] [CrossRef]
- Fusar-Poli, P.; Meyer-Lindenberg, A. Forty years of structural imaging in psychosis: Promises and truth. Acta Psychiatr. Scand. 2016, 134, 207–224. [Google Scholar] [CrossRef] [Green Version]
- Falkai, P.; Schmitt, A.; Andreasen, N. Forty years of structural brain imaging in mental disorders: Is it clinically useful or not? Dialogues Clin. Neurosci. 2018, 20, 179. [Google Scholar]
- Tandon, N.; Tandon, R. Will machine learning enable us to finally cut the gordian knot of schizophrenia. Schizophr. Bull. 2018, 44, 939–941. [Google Scholar] [CrossRef] [PubMed]
- Hu, X.; Zhu, D.; Lv, P.; Li, K.; Han, J.; Wang, L.; Shen, D.; Guo, L.; Liu, T. Fine-granularity functional interaction signatures for characterization of brain conditions. Neuroinformatics 2013, 11, 301–317. [Google Scholar] [CrossRef] [PubMed] [Green Version]
- Pettersson-Yeo, W.; Benetti, S.; Marquand, A.F.; Dell’Acqua, F.; Williams, S.C.; Allen, P.; Prata, D.; Mcguire, P.; Mechelli, A. Using genetic, cognitive and multi-modal neuroimaging data to identify ultra-high-risk and first-episode psychosis at the individual level. Psychol. Med. 2013, 43, 2547–2562. [Google Scholar] [CrossRef] [Green Version]
- Radanliev, P.; Roure, D.D.; Walton, R.; Kleek, M.V.; Montalvo, R.M.; Maddox, L.; Santos, O.; Burnap, P.; Anthi, E. Artificial intelligence and machine learning in dynamic cyber risk analytics at the edge. SN Appl. Sci. 2020, 2. [Google Scholar] [CrossRef]
- Radanliev, P.; Roure, D.D.; Kleek, M.V.; Santos, O.; Ani, U. Artificial intelligence in cyber physical systems. AI Soc. 2020. [Google Scholar] [CrossRef]
- Coronato, A.; Cuzzocrea, A. An Innovative Risk Assessment Methodology for Medical Information Systems. IEEE Trans. Knowl. Data Eng. 2020, 1. [Google Scholar] [CrossRef]
- Coronato, A.; Naeem, M.; Pietro, G.D.; Paragliola, G. Reinforcement learning for intelligent healthcare applications: A survey. Artif. Intell. Med. 2020, 109, 101964. [Google Scholar] [CrossRef]
- Amato, A.; Coronato, A. Supporting Hypothesis Generation by Machine Learning in Smart Health. In Innovative Mobile and Internet Services in Ubiquitous Computing; Barolli, L., Enokido, T., Eds.; Springer International Publishing: Cham, Switzerland, 2018; pp. 401–410. [Google Scholar] [CrossRef]


| Study | Year | Subjects | Prediction | AI/ML Technique | |
|---|---|---|---|---|---|
| Patients | Control | ||||
| Leonard et al. [26] | 1999 | 37♂ | 33♂ | 77% | Linear Discriminant Function Analysis (DFA) |
| Csernansky et al. [31] | 2002 | 52 | 65 | 75% (sensitivity) 76.9% (specificity) | Logistic Regression Model |
| Nakamura et al. [33] | 2004 | 30♂, 27♀ | 25♂, 22♀ | 80%♂, 81.6%♀ | DFA |
| Yushkevich et al. [34] | 2005 | 46 | 46 | 72% (sensitivity) 70% (specificity) | Support Vector Machine (SVM) |
| Davatzikos et al. [32] | 2005 | 69 | 79 (matched) | 81.1% (mixed) 85%♂, 82%♀ | High-dimensional nonlinear Pattern Classifier |
| Fan et al. [35] | 2006 | 23♀, 46♂ | 38♀, 41♂ | 91.8%♀, 90.8%♂ | Nonlinear SVM, leave-one-out cross-validation |
| Yoon et al. [36] | 2007 | 21♀, 32♂ | 52 (matched) | at least 88.8% | SVM, PCA |
| Kawasaki et al. [37] | 2007 | 30♂, 16♂ | 30♂, 16♂ | 90%, 80%, 75% (Jackknife) | Multivariate Linear DFA, Jackknife approach |
| Castellani et al. [38] | 2009 | 54 | 54 | up to 75% and 85% (sex stratified) | Scale Invariance Feature Transform (SIFT), SVM |
| Pohl and Sabuncu [39] | 2009 | 16 | 17 (age-matched) | up to 90% | Linear SVM, Leave-one-out cross-validataion |
| Sun et al. [40] | 2009 | 36 | 36 (sex- and age-matched) | 86.1% | Pattern Classification Analysis with Sparese Multi-nomial Logistic Regression Classifier, Leave-on-out cross-validation |
| Koutsouleris et al. [27] | 2009 | A1: 20 (ARMS-E), 25 (ARMS-L) A2: 15 (ARMS-T), 18 (ARMS-NT) | A1: 25 (matched) A2: 17 (matched) Cross-validation: 45 | at least 86% (sensitivity) at least 93% (specificity) | SVM, Multivariate Pattern Analysis (MVPA) |
| Takayanagi et al. [41] | 2010 | 17♂, 17♀ | 24♂, 24♀ | 75.6%, 82.9% | Linear DFA |
| Castellani et al. [42] | 2010 | 64 | 60 | up to 86.13% | SVM |
| Koutsouleris et al. [43] | 2010 | 25 | 28 | 83% | SVM with Partial-least-squares Pattern Analysis |
| Kasparek et al. [44] | 2011 | 39 | 39 | 66.7% (sensitivity) 76.9% (specificity) | Maximum-uncertainty Linear Discriminant Analysis (MLDA) |
| Karageorgiou et al. [45] | 2011 | 28 | 47 | 67.9% (sensitivity) 72.3% (specificity) using PCA-LDA (sMRI only) | LDA, Principal Component Analysis (PCA) |
| Castellani et al. [46] | 2011 | 30 | 30 | up to 83.33% | SVM, Leave-one-out cross-validation |
| Ulaş et al. [47] | 2011 | 64 | 60 | 71.93% (SVM) | 1-Nearest Neighbour, Linear SVM |
| Koutsouleris et al. [48] | 2012 | 16/21 | 22 | 92.3% 66.9% 84.2% | SVM |
| Castellani et al. [49] | 2012 | 54 | 54 (matched) | at least 66.38% | SIFT and nonlinear SVM |
| Nieuwenhuis et al. [50] | 2012 | 128, 155 | 111, 122 | 71.4%, 70.4% | SVM, Leave-one-out cross-validation |
| Ulaş et al. [28] | 2012 | 50 | 50 | 84% (MKL) 77% (SVM) | SVM, MKL |
| Ulaş et al. [29] | 2012 | 21♂, 21♀ | 19♂, 21♀ | 90.24% (CLMKL) 71.95% (SVM) | SVM, Clustered Localized MKL (CLMKL) |
| Ota et al. [51] | 2012 | 38♀, 23♀ | 105♀, 23♀ | 74% (sensitivity) 70% (specificity) | DFA |
| Bansal et al. [52] | 2012 | 65 | 40 | 93.1% (sensitivity) 94.5% (specificity) | Hierarchical clustering, Split-half and Leave-one-out cross-validation |
| Greenstein et al. [53] | 2012 | 98 | 99 | 73.3% | Random Forest |
| Borgwardt et al. [54] | 2013 | 16/23 | 22 | 86.7% 80.7% 80.0% | SVM, Nested cross-validation |
| Iwabuchi et al. [55] | 2013 | 19 | 20 | up to 77% | SVM |
| Zanetti et al. [56] | 2013 | 62 | 62 (matched) | 73.4% | SVM |
| Gould et al. [57] | 2014 | 126/74 | 134 | 71% | SVM |
| Perina et al. [58] | 2014 | 21♂, 21♀ | 19♂, 21♀ | 83% (sensitivity) | SVM |
| Schnack et al. [59] | 2014 | 46/47 | 43 | 90% | SVM |
| Cabral et al. [60] | 2016 | 71 | 74 | 69.7% | SVM, MVPA |
| Lu et al. [61] | 2016 | 41 | 42 (sex- and age-matched) | 91.9% (sensitivity) 84.4% (specificity) | SVM, Recursive Feature Elimination (RFE) |
| Yang et al. [30] | 2016 | 40 | 46 | 77.91% | MLDA, SVM |
| Squarcina et al. [62] | 2017 | 127 | 127 | 80% | SVM |
| Rozycki et al. [63] | 2018 | 440 | 501 | 76% | Linear SVM |
| de Moura et al. [64] | 2018 | 143, 32 | 82 | 77.6% (sensitivity) 68.3% (specificity) | MLDA |
| Liang et al. [65] | 2019 | 98, 54 | 106, 48 | 75.05%, 76.54% | Gradient Boosting Decision Tree |
| Deng et al. [66] | 2019 | 65 | 60 | 76.9% (sensitivity) 75.0% (specificity) | Random Forest |
| Study | Year | Subjects | Prediction | AI/ML Technique | |
|---|---|---|---|---|---|
| Patients | Control | ||||
| Jafri and Calhoun [68] | 2006 | 38 | 31 | 75.6% | Neural network |
| Calhoun et al. [69] | 2008 | 21 | 26 | 92% (sensitivity) 95% (specificity) | MVPA |
| Anderson et al. [70] | 2010 | 14 | 6 | up to 90% | Multivariate Random Forest |
| Arribas et al. [71] | 2010 | 21 | 25 | 90% | Stochastic Gradient Learning based on minimization of Kullback-Leibler divergence |
| Shen et al. [72] | 2010 | 32 | 20 | 93.75% (sensitivity) 75% (specificity) | Low-dimensional embedding and self-organized C-means clustering |
| Yang et al. [73] | 2010 | 20 | 20 | at least 82% (using fMRI data) | SVM |
| Castro et al. [74] | 2010 | 52 | 54 | 95% | Composite kernels, Linear and Gaussian SVM, Leave-two-out cross-validation |
| Costafreda et al. [75] | 2011 | 32 | 40 | 92% (seonsitivity) | SVM |
| Fan et al. [76] | 2011 | 31 | 31 | up to 85.5% | SVM, Linear kernel, Radial basis function kernel, Sigmoid kernel |
| Du et al. [77] | 2012 | 28 | 28 | 90% | Fisher’s linear discriminant analysis, Default mode network, Majority vote, Leave-one-out cross-validation |
| Liu et al. [78] | 2012 | 25 | 25 (siblings) 25 (HC) | 80.4% (SZ vs. HC) | Nonlinear SVM with polynomial kernel |
| Venkataraman et al. [79] | 2012 | 18 | 18 | 75% | Multivariate classification |
| Yoon et al. [80] | 2012 | 51 | 51 (age-matched) | 51.0% (sensitivity) 64.7% (specificity) | Linear DFA, Leave-one-out cross-validation |
| Anderson and Cohen [81] | 2013 | 74 | 72 | 65% | SVM |
| Arbabshirani et al. [82] | 2013 | 28 | 28 | up to 96% (KNN) | Various (10 types) linear and nonlinear classifier |
| Fekete et al. [83] | 2013 | 8♂ | 10♂ | 100% | Complex network analysis, Block diagonal optimization. |
| Yu et al. [84] | 2013 | 24 | 25 (siblings) 22 (matched HC) | 62% | SVM, PCA, Leave-one-out cross-validation |
| Yu et al. [85] | 2013 | 32 (SZ) 19 (Depression) | 38 | 80.9% | SVM, Intrinsic DA, Leave-one-out cross-validation |
| Anticevic et al. [86] | 2014 | Sample: 90 Validation: 23 | Sample: 90 (matched) Validation: 23 (matched) | Sample: 75.5% (sensitivity), 72.2% (specificity) Validation: 67.9% (sensitivity), 77.8% (specificity) | Linear SVM, Leave-one-out cross-validation |
| Brodersen et al. [87] | 2014 | 41 | 42 | 78%, 71% | Linear SVM, Variational Bayesian Gaussian mixture |
| Castro et al. [88] | 2014 | 31 | 21 | 90% (L-norm MKL), 85% (Lp-norm MKL) | L-norm and Lp-norm MKL |
| Guo et al. [89] | 2014 | 69 | 62 | 68% | SVM |
| Watanabe et al. [90] | 2014 | 54 | 67 | at least 77.0% | Fused Lasso and GraphNet regularized SVM |
| Cheng et al. [91] | 2015 | 415 | 405 | 73.53–80.92% | SVM |
| Chyzhyk et al. [92] | 2015 | 26/14 | 28 | 97–100% | Linear SVM |
| Kaufmann et al. [93] | 2015 | 71 | 196 | 46.5% (sensitivity) 86.0% (specificity) | Regularized LDA, Leave-one-out cross-validation |
| Pouyan and Shahamat [94] | 2015 | 10 | 10 | up to 100% (sensitivity and specificity) | ICA, PCA, Various, Leave-one-out cross-validation |
| Mikolas et al. [95] | 2016 | 63 | 63 (sex- and age-matched) | 74.6% (sensitivity) 71.4% (specificity) | Linear SVM |
| Peters et al. [96] | 2016 | 18 | 18 | up to 91% | SVM, Leave-one-out cross-validation |
| Yang et al. [30] | 2016 | 40 | 40 | 77.91% | MLDA, SVM |
| Skaatun et al. [97] | 2017 | 182 | 348 | up to 80% | Multivariate regularized LDA |
| Chen et al. [98] | 2017 | 20 (SZ) 20 (depression) | 20 | 60% (sensitivity) 90% (specificity) | Linear SVM, MVPA |
| Kaufmann et al. [99] | 2017 | 90 (SZ) 97 (bipolar) | 137 (HC) | 60% (sensitivity) 90% (specificity) | 5-class regularized LDA, k-fold cross-validation model |
| Guo et al. [100] | 2017 | 28 | 28 family-based control (FBC) 40 (HC) | SVM: 96.43% (sensitivity) 89.29% (specificity, FBC) | SVM, Receiver operating characteristic (ROC) curve |
| Iwabuchi and Palaniyappan [101] | 2017 | 71 | 62 | 80.32% | MKL |
| Yang et al. [102] | 2017 | 446 | 451 | 60–86% | Multi-task classification, 10-fold cross-validation |
| Bae et al. [103] | 2018 | 21 | 54 | 92.1% (SVM) | Various (5 types), 10-fold cross-validation |
| Li et al. [104] | 2019 | 60 | 71 | 76.34% (LDA) | KNN, Liner SVM, Radial basis SVM, LDA |
| Chatterjee et al. [105] | 2019 | 34 | 34 | 94% (SVM) 96% (1-NN) | SVM, k-nearest neighbours |
| Kalmady et al. [106] | 2019 | 81 | 93 (sex- and age-matched) | 87% | L2-regularized Logistic regression |
| Study | Year | Subjects | Prediction | AI/ML Technique | |
|---|---|---|---|---|---|
| Patients | Control | ||||
| Caan et al. [111] | 2006 | 34♂ | 24 | (not reported) | LDA, PCA |
| Caprihan et al. [112] | 2008 | 45 | 45 (age-matched) | 100% | DPCA |
| Ingalhalikar et al. [113] | 2010 | 27♀ | 37♀ | 90.62% | Nonlinear SVM |
| Rathi et al. [114] | 2010 | 21 (FEP) | 20 (age-matched) | SH: 78% (sensitivity) 80% (specificity) F2T: 86% (sensitivity) 85% (specificity) | K-nearest neighbours, Parzen window classifier, SVM |
| Ardekani et al. [115] | 2011 | 50 | 50 (age- and sex-matched) | FA: 96% (sensitivity) 92% (specificity) MD: 96% (sensitivity) 100% (specificity) | Fisher’s LDA |
| Squarcina et al. [116] | 2015 | 35 (FEP) | 35 | 83% | SVM |
| Study | Year | Subjects | Prediction | AI/ML Technique | |
|---|---|---|---|---|---|
| Patients | Control | ||||
| Knott et al. [126] | 1999 | 14 | 14 | at least 89.3% | DFA, Jackknife classification |
| Neuhaus et al. [127] | 2011 | 40 | 40 (matched) | 79.9% (balanced) | SVM (linear, quadratic and radial basis kernels), LDA, Quadratic discriminant analysis (QDA), KNN, naïve Bayes with equal and unequal variances and Mahalanobis classification |
| Iyer et al. [128] | 2012 | 13 | 20 | max 76% (ensemble averaging) 100% (single-trial) | Random Forest, 10-fold stratified cross-validation |
| Laton et al. [129] | 2014 | 54 | 54 (sex- and age-matched) | up to 84.7% | Naïve Bayes, SVM and decision tree, with two of its improvements: adaboost and Random Forest |
| Neuhaus et al. [130] | 2014 | 144 | 144 (matched) | 74% (balanced) | LDA and QDA (with their diagonal variants), SVM (linear, polynomial, radial basis and multilayer perceptron kernels), Naïve Bayes, KNN (Euclidean and cosine distance measures) and Mahalanobis classification |
| Johannesen et al. [131] | 2016 | 40 | 12 | up to 87% | 1-norm SVM |
| Shim et al. [132] | 2016 | 34 | 34 | Maximum: 88.24% (combined) 80.88% (sensor-level) 85.29% (source-level) | SVM, Leave-one-out cross-validation |
| Taylor et al. [133] | 2017 | 21 | 22 | 80.84% | SVM, Gaussian processes classifiers, MVPA |
| Krishnan et al. [134] | 2020 | 14 | 14 (sex- and age-matched) | up to 93% | Various, SVM (Radial Basis Function) |
Publisher’s Note: MDPI stays neutral with regard to jurisdictional claims in published maps and institutional affiliations. |
© 2021 by the authors. Licensee MDPI, Basel, Switzerland. This article is an open access article distributed under the terms and conditions of the Creative Commons Attribution (CC BY) license (https://creativecommons.org/licenses/by/4.0/).
Share and Cite
Lai, J.W.; Ang, C.K.E.; Acharya, U.R.; Cheong, K.H. Schizophrenia: A Survey of Artificial Intelligence Techniques Applied to Detection and Classification. Int. J. Environ. Res. Public Health 2021, 18, 6099. https://0-doi-org.brum.beds.ac.uk/10.3390/ijerph18116099
Lai JW, Ang CKE, Acharya UR, Cheong KH. Schizophrenia: A Survey of Artificial Intelligence Techniques Applied to Detection and Classification. International Journal of Environmental Research and Public Health. 2021; 18(11):6099. https://0-doi-org.brum.beds.ac.uk/10.3390/ijerph18116099
Chicago/Turabian StyleLai, Joel Weijia, Candice Ke En Ang, U. Rajendra Acharya, and Kang Hao Cheong. 2021. "Schizophrenia: A Survey of Artificial Intelligence Techniques Applied to Detection and Classification" International Journal of Environmental Research and Public Health 18, no. 11: 6099. https://0-doi-org.brum.beds.ac.uk/10.3390/ijerph18116099