
Sleep Duration and Waking Activities in Relation to the National Sleep Foundation’s Recommendations: An Analysis of US Population Sleep Patterns from 2015 to 2017


Abstract
:1. Introduction
2. Materials and Methods
2.1. American Time Use Survey (ATUS) Participants
2.2. ATUS Variables and Coding
2.3. Data Processing
2.4. Data Analysis
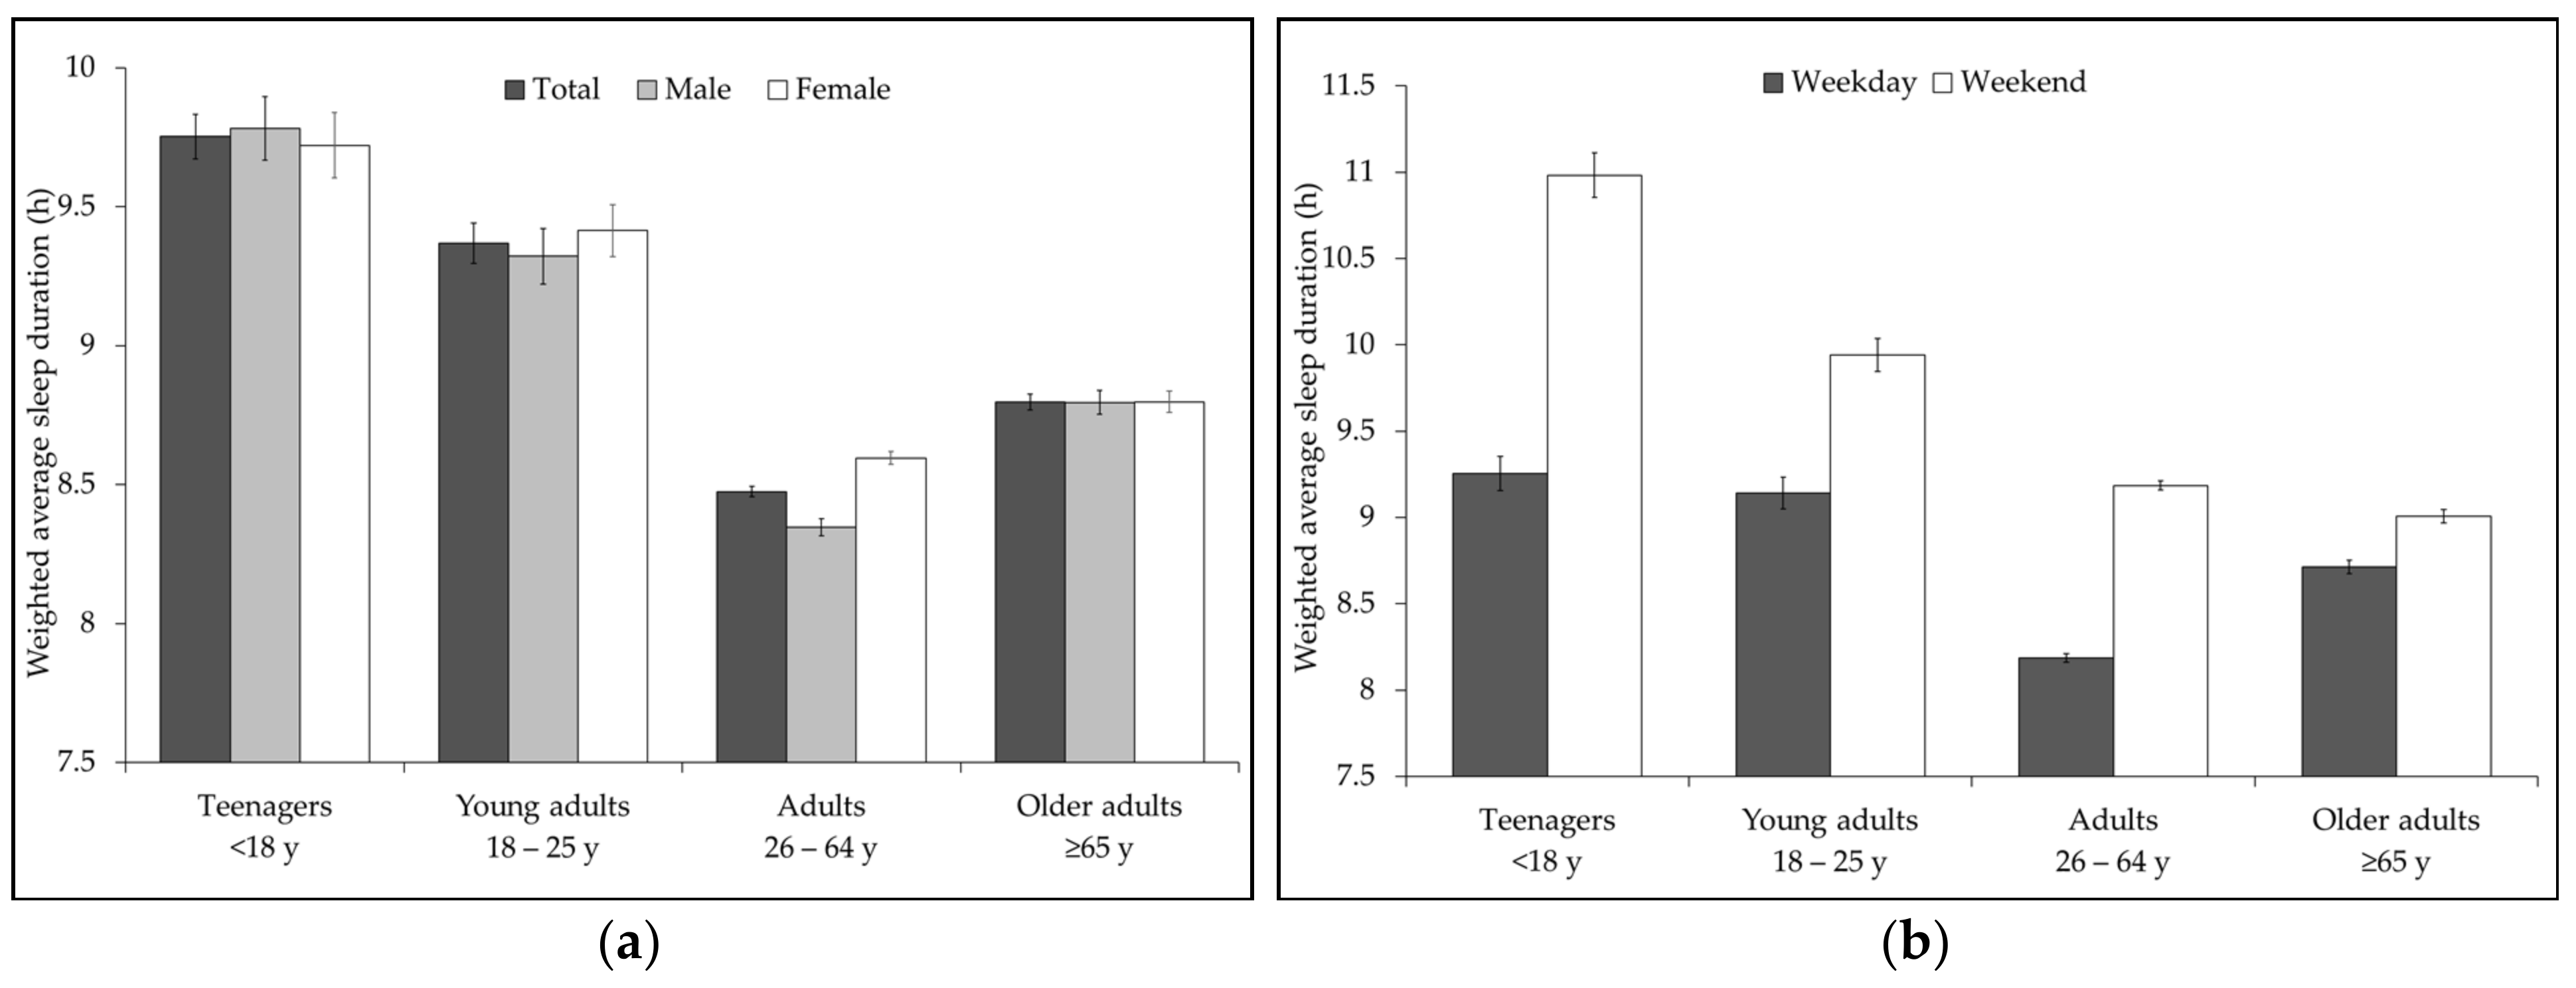
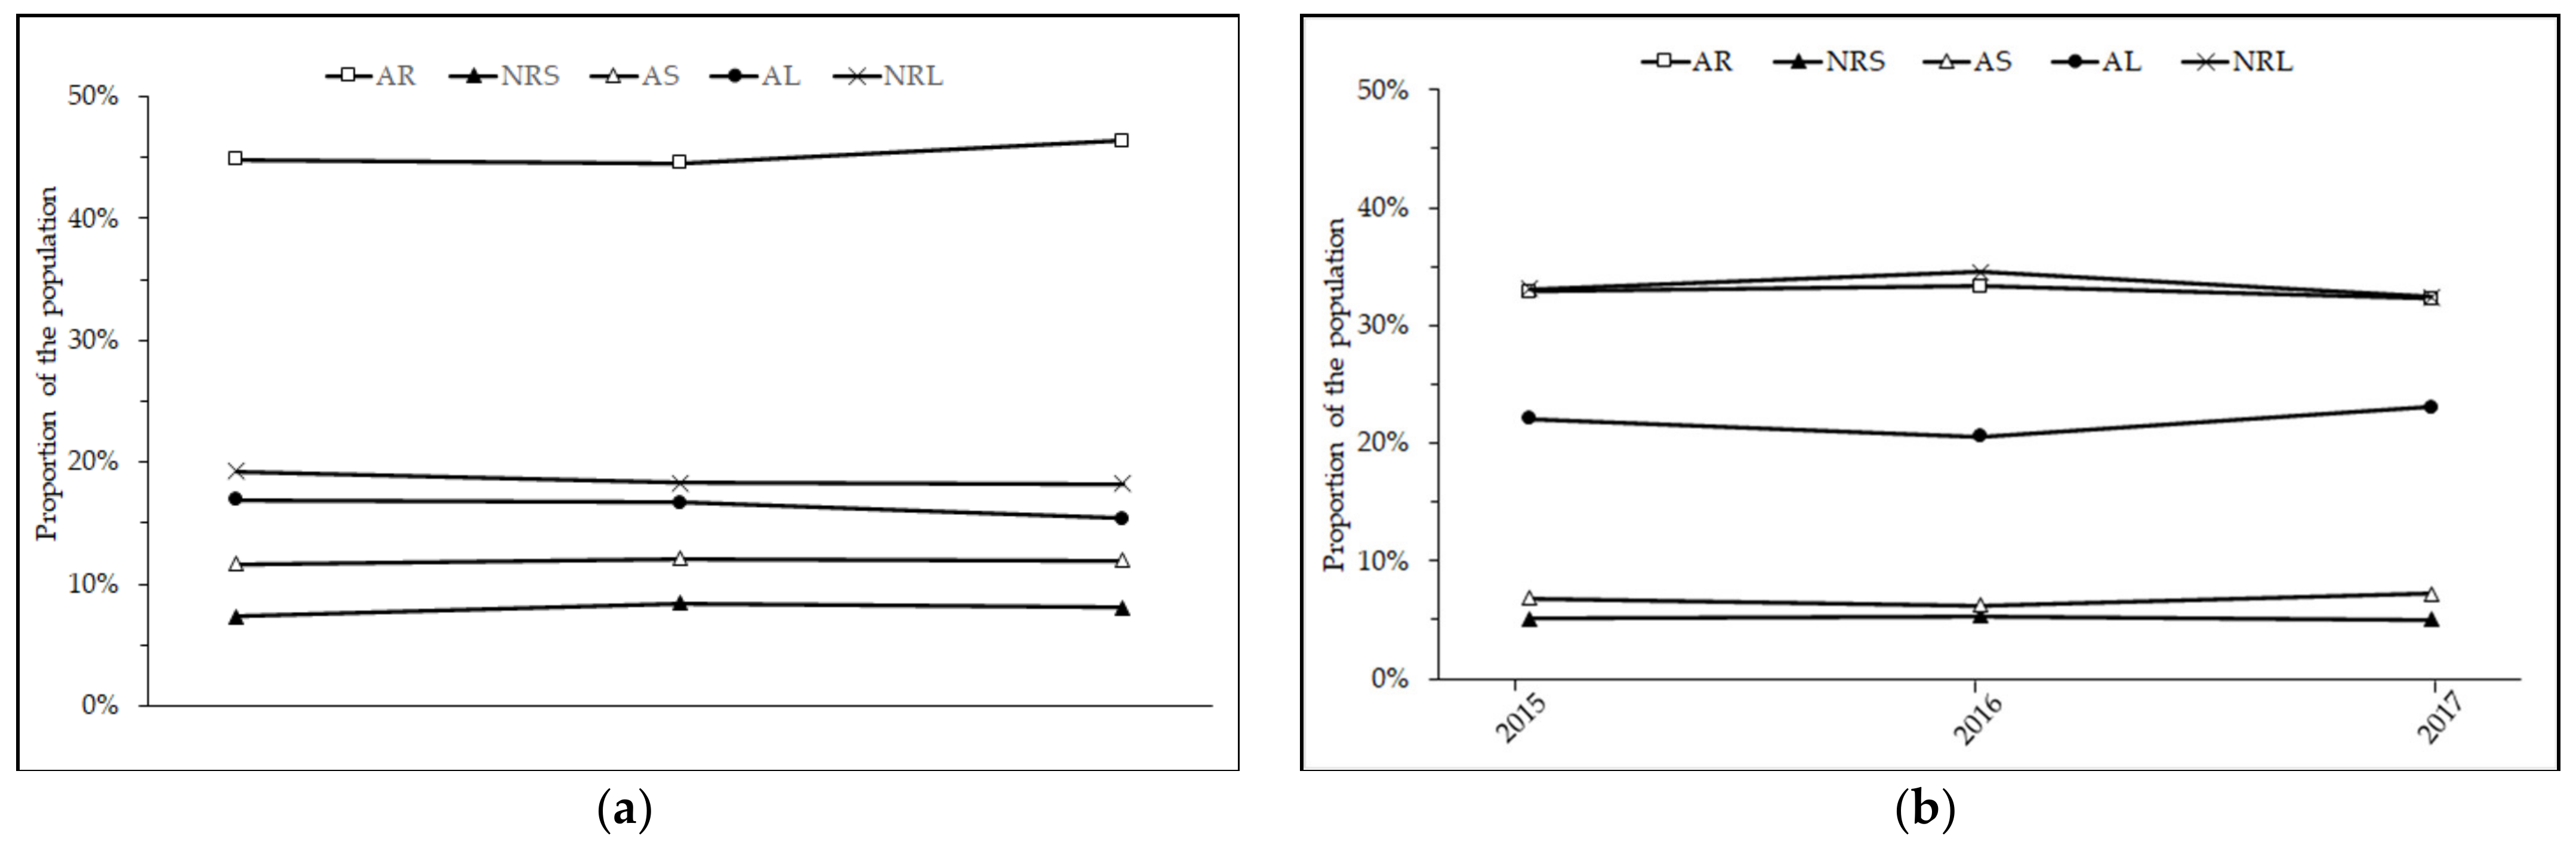
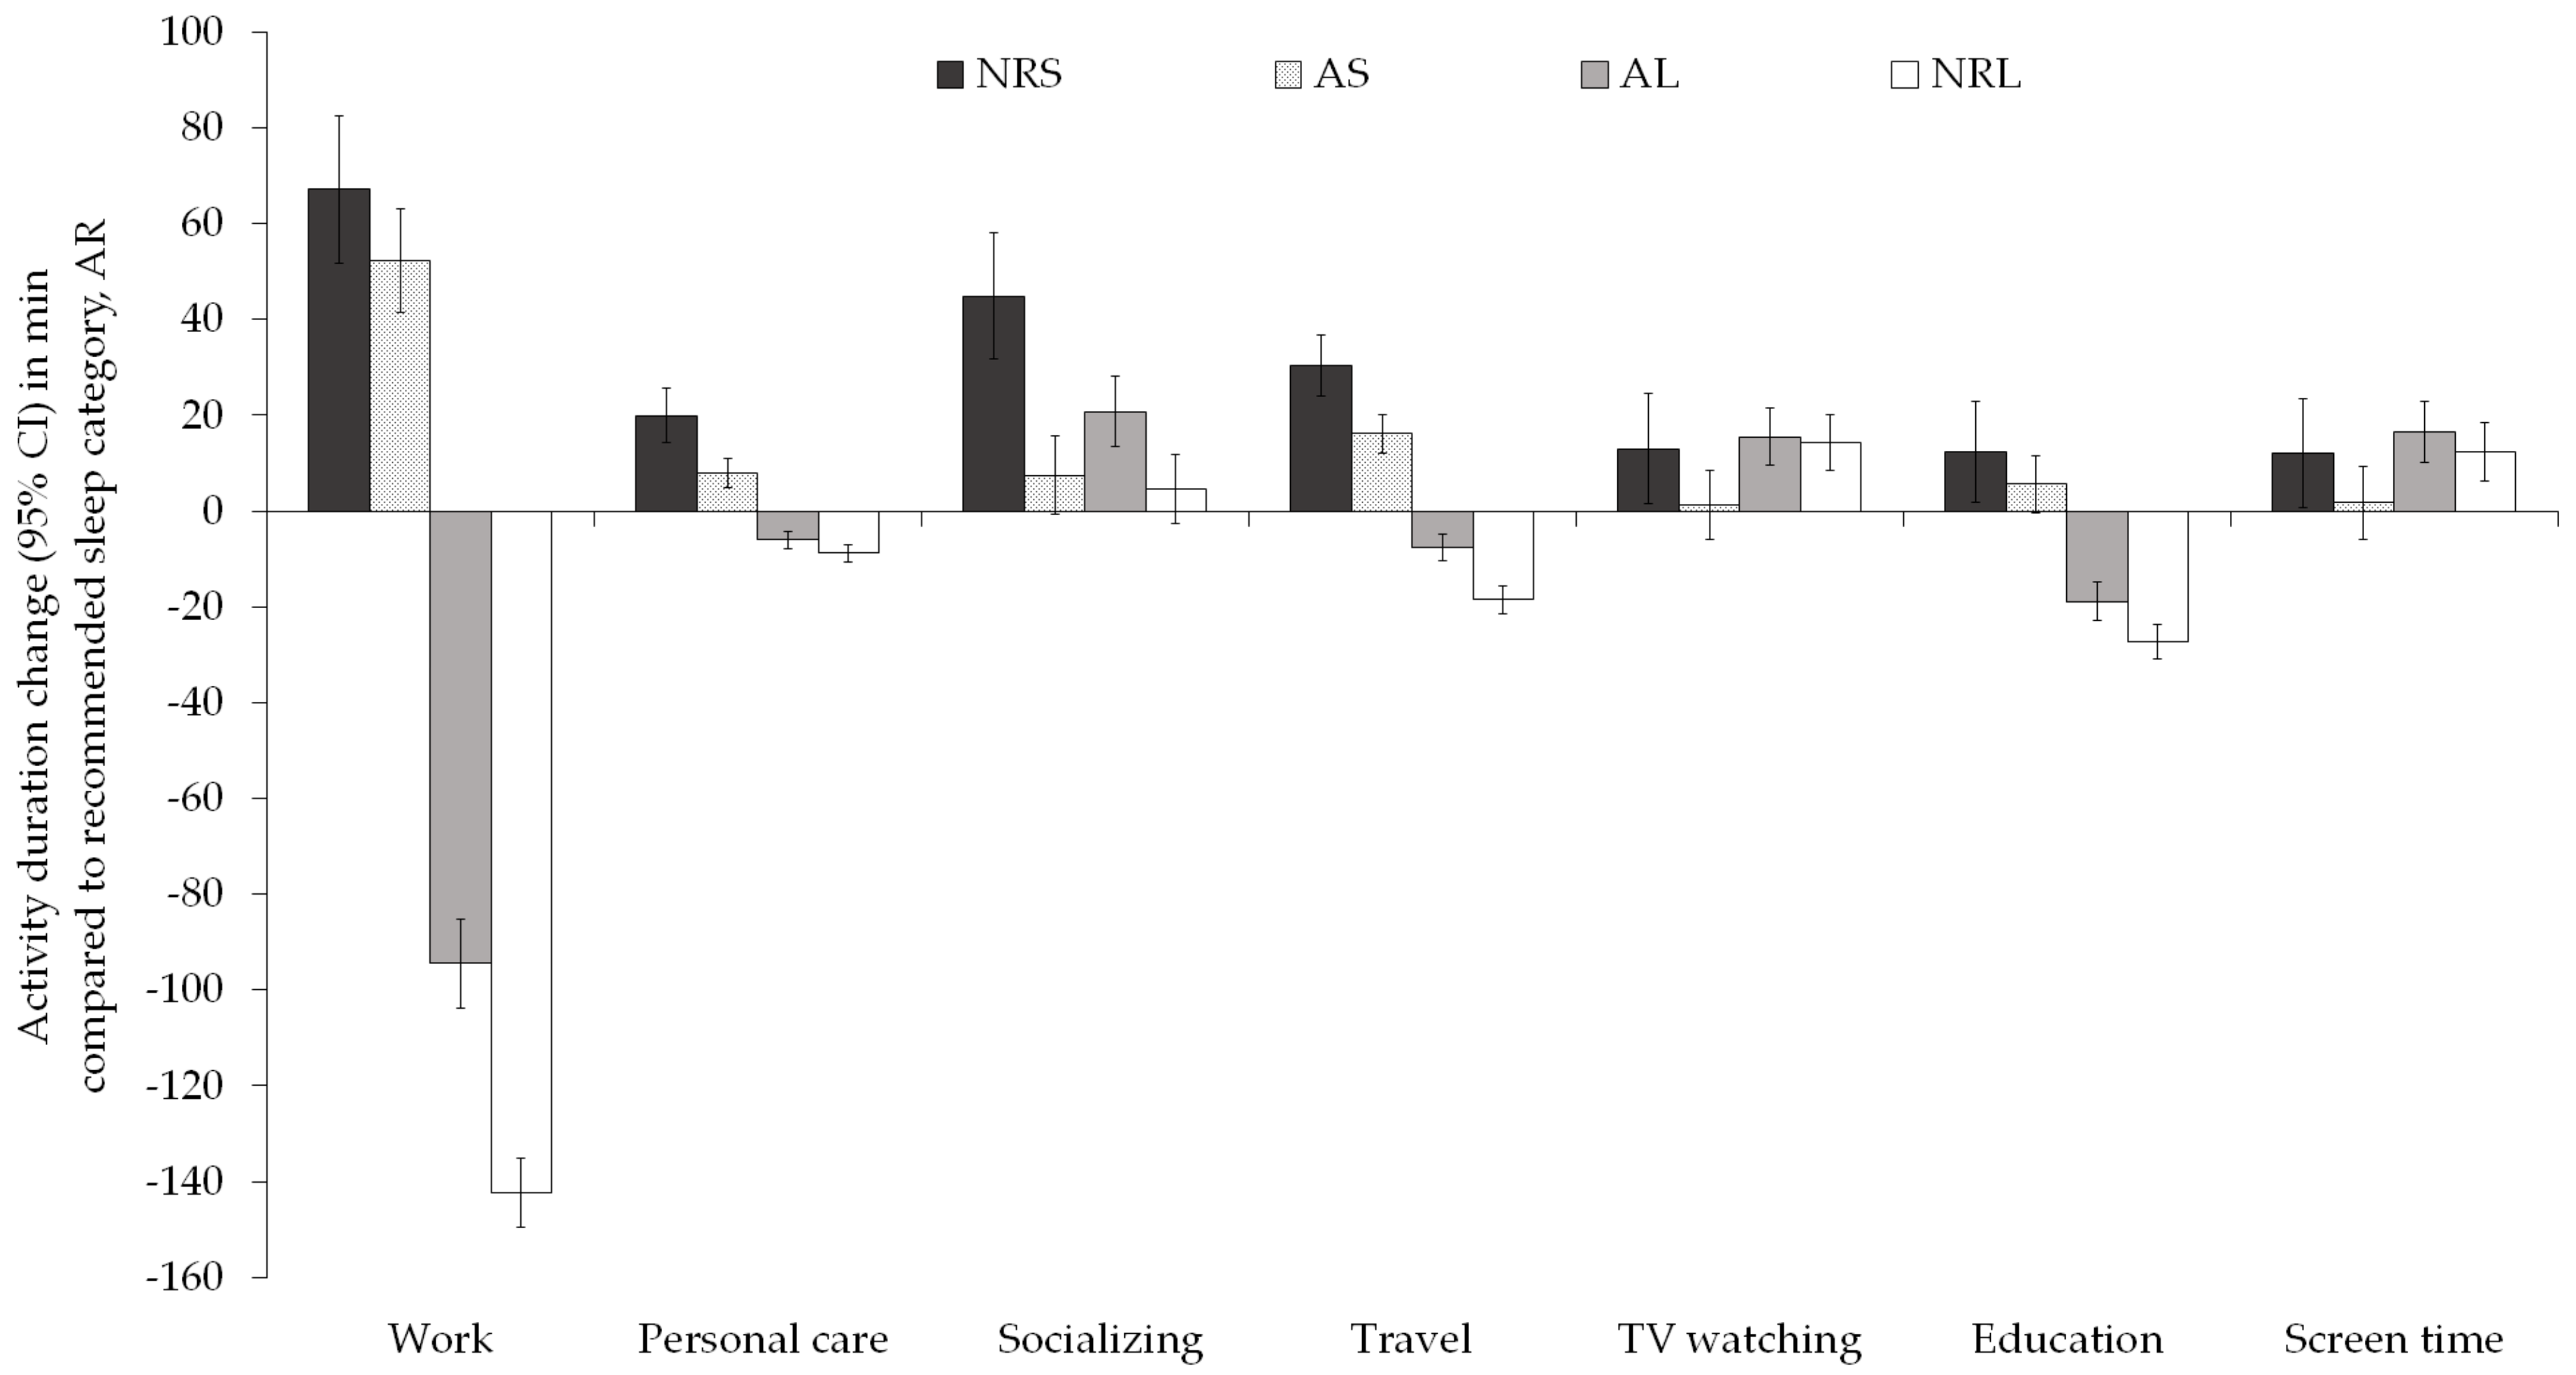
3. Results
4. Discussion
5. Conclusions
Supplementary Materials
Author Contributions
Funding
Institutional Review Board Statement
Informed Consent Statement
Data Availability Statement
Acknowledgments
Conflicts of Interest
References
- Luyster, F.S.; Strollo, P.J.; Zee, P.C.; Walsh, J.K. Sleep: A Health Imperative. Sleep 2012, 35, 727–734. [Google Scholar] [CrossRef]
- Tao, F.; Cao, Z.; Jiang, Y.; Fan, N.; Xu, F.; Yang, H.; Li, S.; Zhang, Y.; Zhang, X.; Sun, L.; et al. Associations of Sleep Duration and Quality with Incident Cardiovascular Disease, Cancer, and Mortality: A Prospective Cohort Study of 407,500 UK Biobank Participants. Sleep Med. 2021, 81, 401–409. [Google Scholar] [CrossRef] [PubMed]
- Baglioni, C.; Nanovska, S.; Regen, W.; Spiegelhalder, K.; Feige, B.; Nissen, C.; Reynolds, C.F.; Riemann, D. Sleep and Mental Disorders: A Meta-Analysis of Polysomnographic Research. Psychol. Bull. 2016, 142, 969–990. [Google Scholar] [CrossRef] [PubMed]
- Ogilvie, R.P.; Redline, S.; Bertoni, A.G.; Chen, X.; Ouyang, P.; Szklo, M.; Lutsey, P.L. Actigraphy Measured Sleep Indices and Adiposity: The Multi-Ethnic Study of Atherosclerosis (MESA). Sleep 2016, 39, 1701–1708. [Google Scholar] [CrossRef] [Green Version]
- Krističević, T.; Štefan, L.; Sporiš, G. The Associations between Sleep Duration and Sleep Quality with Body-Mass Index in a Large Sample of Young Adults. Int. J. Environ. Res. Public. Health 2018, 15, 758. [Google Scholar] [CrossRef] [Green Version]
- Knutson, K.L.; Van Cauter, E.; Rathouz, P.J.; Yan, L.L.; Hulley, S.B.; Liu, K.; Lauderdale, D.S. Association between Sleep and Blood Pressure in Mid Life: The CARDIA Sleep Study. Arch. Intern. Med. 2009, 169, 1055–1061. [Google Scholar] [CrossRef] [PubMed] [Green Version]
- Bertisch, S.M.; Pollock, B.D.; Mittleman, M.A.; Buysse, D.J.; Bazzano, L.A.; Gottlieb, D.J.; Redline, S. Insomnia with Objective Short Sleep Duration and Risk of Incident Cardiovascular Disease and All-Cause Mortality: Sleep Heart Health Study. Sleep 2018, 41. [Google Scholar] [CrossRef]
- Lou, P.; Chen, P.; Zhang, L.; Zhang, P.; Yu, J.; Zhang, N.; Wu, H.; Zhao, J. Relation of Sleep Quality and Sleep Duration to Type 2 Diabetes: A Population-Based Cross-Sectional Survey. BMJ Open 2012, 2, e000956. [Google Scholar] [CrossRef]
- Marques, D.R.; Meia-Via, A.M.S.; da Silva, C.F.; Gomes, A.A. Associations between Sleep Quality and Domains of Quality of Life in a Non-Clinical Sample: Results from Higher Education Students. Sleep Health J. Natl. Sleep Found. 2017, 3, 348–356. [Google Scholar] [CrossRef] [Green Version]
- Patel, S.R.; Malhotra, A.; Gottlieb, D.J.; White, D.P.; Hu, F.B. Correlates of Long Sleep Duration. Sleep 2006, 29, 881–889. [Google Scholar] [CrossRef]
- Jike, M.; Itani, O.; Watanabe, N.; Buysse, D.J.; Kaneita, Y. Long Sleep Duration and Health Outcomes: A Systematic Review, Meta-Analysis and Meta-Regression. Sleep Med. Rev. 2018, 39, 25–36. [Google Scholar] [CrossRef] [PubMed]
- Gangwisch, J.E.; Heymsfield, S.B.; Boden-Albala, B.; Buijs, R.M.; Kreier, F.; Pickering, T.G.; Rundle, A.G.; Zammit, G.K.; Malaspina, D. Sleep Duration as a Risk Factor for Diabetes Incidence in a Large US Sample. Sleep 2007, 30, 1667–1673. [Google Scholar] [CrossRef] [PubMed]
- Consensus Conference Panel; Watson, N.F.; Badr, M.S.; Belenky, G.; Bliwise, D.L.; Buxton, O.M.; Buysse, D.; Dinges, D.F.; Gangwisch, J.; Grandner, M.A.; et al. Joint Consensus Statement of the American Academy of Sleep Medicine and Sleep Research Society on the Recommended Amount of Sleep for a Healthy Adult: Methodology and Discussion. Sleep 2015, 38, 1161–1183. [Google Scholar] [CrossRef] [PubMed]
- Edwards, B.A.; O’Driscoll, D.M.; Ali, A.; Jordan, A.S.; Trinder, J.; Malhotra, A. Aging and Sleep: Physiology and Pathophysiology. Semin. Respir. Crit. Care Med. 2010, 31, 618–633. [Google Scholar] [CrossRef] [PubMed] [Green Version]
- Hirshkowitz, M.; Whiton, K.; Albert, S.M.; Alessi, C.; Bruni, O.; DonCarlos, L.; Hazen, N.; Herman, J.; Adams Hillard, P.J.; Katz, E.S.; et al. National Sleep Foundation’s Updated Sleep Duration Recommendations: Final Report. Sleep Health 2015, 1, 233–243. [Google Scholar] [CrossRef]
- U.S. Bureau of Labor Statistics & Census Bureau. American Time Use Survey User’s Guide: Understanding ATUS 2003 to 2017; Bureau of Labor Statistics: Washington, DC, USA, 2018.
- Basner, M.; Fomberstein, K.M.; Razavi, F.M.; Banks, S.; William, J.H.; Rosa, R.R.; Dinges, D.F. American Time Use Survey: Sleep Time and Its Relationship to Waking Activities. Sleep 2007, 30, 1085–1095. [Google Scholar] [CrossRef] [Green Version]
- Åkerstedt, T.; Knutsson, A.; Westerholm, P.; Theorell, T.; Alfredsson, L.; Kecklund, G. Sleep Disturbances, Work Stress and Work Hours: A Cross-Sectional Study. J. Psychosom. Res. 2002, 53, 741–748. [Google Scholar] [CrossRef]
- Ezati, M.; Keshavarz, M.; Barandouzi, Z.A.; Montazeri, A. The Effect of Regular Aerobic Exercise on Sleep Quality and Fatigue among Female Student Dormitory Residents. BMC Sports Sci. Med. Rehabil. 2020, 12, 44. [Google Scholar] [CrossRef]
- St-Onge, M.-P.; Mikic, A.; Pietrolungo, C.E. Effects of Diet on Sleep Quality12. Adv. Nutr. 2016, 7, 938–949. [Google Scholar] [CrossRef]
- Mireku, M.O. Waking Activities and Sleep: Analysis of United Kingdom Adolescents’ Daily Time-Use Diaries. J. Adolesc. Health 2021, 68, 385–393. [Google Scholar] [CrossRef]
- Coveney, C.M. Managing Sleep and Wakefulness in a 24-Hour World. Sociol. Health Illn. 2014, 36, 123–136. [Google Scholar] [CrossRef] [Green Version]
- Youngstedt, S.D.; Goff, E.E.; Reynolds, A.M.; Kripke, D.F.; Irwin, M.R.; Bootzin, R.R.; Khan, N.; Jean-Louis, G. Has Adult Sleep Duration Declined Over the Last 50+ Years? Sleep Med. Rev. 2016, 28, 69–85. [Google Scholar] [CrossRef] [Green Version]
- Basner, M.; Dinges, D.F. Sleep Duration in the United States 2003–2016: First Signs of Success in the Fight against Sleep Deficiency? Sleep 2018, 41. [Google Scholar] [CrossRef] [Green Version]
- Hashizaki, M.; Nakajima, H.; Kume, K. Monitoring of Weekly Sleep Pattern Variations at Home with a Contactless Biomotion Sensor. Sensors 2015, 15, 18950–18964. [Google Scholar] [CrossRef] [Green Version]
- Hasler, B.P.; Dahl, R.E.; Holm, S.M.; Jakubcak, J.L.; Ryan, N.D.; Silk, J.S.; Phillips, M.L.; Forbes, E.E. Weekend-Weekday Advances in Sleep Timing Are Associated with Altered Reward-Related Brain Function in Healthy Adolescents. Biol. Psychol. 2012, 91, 334–341. [Google Scholar] [CrossRef] [PubMed] [Green Version]
- Roepke, S.E.; Duffy, J.F. Differential Impact of Chronotype on Weekday and Weekend Sleep Timing and Duration. Nat. Sci. Sleep 2010, 2, 213–220. [Google Scholar] [CrossRef] [Green Version]
- Oh, Y.H.; Kim, H.; Kong, M.; Oh, B.; Moon, J.H. Association between Weekend Catch-up Sleep and Health-Related Quality of Life of Korean Adults. Medicine 2019, 98, e14966. [Google Scholar] [CrossRef] [PubMed]
- Mota, M.C.; Silva, C.M.; Balieiro, L.C.T.; Gonçalves, B.F.; Fahmy, W.M.; Crispim, C.A. Association between Social Jetlag Food Consumption and Meal Times in Patients with Obesity-Related Chronic Diseases. PLOS ONE 2019, 14, e0212126. [Google Scholar] [CrossRef] [PubMed] [Green Version]
- Mota, M.C.; Silva, C.M.; Balieiro, L.C.T.; Fahmy, W.M.; Crispim, C.A. Social Jetlag and Metabolic Control in Non-Communicable Chronic Diseases: A Study Addressing Different Obesity Statuses. Sci. Rep. 2017, 7, 1–8. [Google Scholar] [CrossRef] [Green Version]
- Fárková, E.; Šmotek, M.; Bendová, Z.; Manková, D.; Kopřivová, J. Chronotype and Social Jet-Lag in Relation to Body Weight, Apetite, Sleep Quality and Fatigue. Biol. Rhythm Res. 2019, 0, 1–12. [Google Scholar] [CrossRef]
- Koopman, A.D.M.; Rauh, S.P.; van ’t Riet, E.; Groeneveld, L.; van der Heijden, A.A.; Elders, P.J.; Dekker, J.M.; Nijpels, G.; Beulens, J.W.; Rutters, F. The Association between Social Jetlag, the Metabolic Syndrome, and Type 2 Diabetes Mellitus in the General Population: The New Hoorn Study. J. Biol. Rhythms 2017, 32, 359–368. [Google Scholar] [CrossRef] [PubMed]
- Abraham, K.G.; Maitland, A.; Bianchi, S.M. Nonresponse in the American Time Use Survey: Who Is Missing from the Data and How Much Does It Matter? Public Opin. Q. 2006, 70, 676–703. [Google Scholar] [CrossRef]
- Fricker, S.; Tourangeau, R. Examining the Relationship Between Nonresponse Propensity and Data Quality in Two National Household Surveys. Public Opin. Q. 2010, 74, 934–955. [Google Scholar] [CrossRef] [Green Version]
- Mireku, M.O.; Barker, M.M.; Mutz, J.; Dumontheil, I.; Thomas, M.S.C.; Röösli, M.; Elliott, P.; Toledano, M.B. Night-Time Screen-Based Media Device Use and Adolescents’ Sleep and Health-Related Quality of Life. Environ. Int. 2019, 124, 66–78. [Google Scholar] [CrossRef] [PubMed]
- Mireku, M.O.; Barker, M.M.; Mutz, J.; Shen, C.; Dumontheil, I.; Thomas, M.S.C.; Roosli, M.; Elliott, P.; Toledano, M.B. Processed Data on the Night-Time Use of Screen-Based Media Devices and Adolescents’ Sleep Quality and Health-Related Quality of Life. Data Brief 2019, 23, 103761. [Google Scholar] [CrossRef]
- Rüger, M.; Gordijn, M.C.M.; Beersma, D.G.M.; de Vries, B.; Daan, S. Time-of-Day-Dependent Effects of Bright Light Exposure on Human Psychophysiology: Comparison of Daytime and Nighttime Exposure. Am. J. Physiol.-Regul. Integr. Comp. Physiol. 2006, 290, R1413–R1420. [Google Scholar] [CrossRef] [Green Version]
- Te Kulve, M.; Schlangen, L.J.M.; van Marken Lichtenbelt, W.D. Early Evening Light Mitigates Sleep Compromising Physiological and Alerting Responses to Subsequent Late Evening Light. Sci. Rep. 2019, 9, 16064. [Google Scholar] [CrossRef] [PubMed]
- Blume, C.; Garbazza, C.; Spitschan, M. Effects of Light on Human Circadian Rhythms, Sleep and Mood. Somnologie 2019, 23, 147–156. [Google Scholar] [CrossRef] [PubMed] [Green Version]
- Swinnerton, L.; Moldovan, A.A.; Mann, C.M.; Durrant, S.J.; Mireku, M.O. Lecture Start Time and Sleep Characteristics: Analysis of Daily Diaries of Undergraduate Students from the LoST-Sleep Project. Sleep Health J. Natl. Sleep Found. 2021, in press. [Google Scholar]
- Williams, S.J. Sleep and Health: Sociological Reflections on the Dormant Society. Health 2002, 6, 173–200. [Google Scholar] [CrossRef]


| Age | Appropriate, Recommended Duration (AR) | Appropriate But Short (AS) | Appropriate But Long (AL) | Not Recommended: Too Short (NRS) | Not Recommended: Too Long (NRL) |
|---|---|---|---|---|---|
| New-borns | |||||
| 0–3 month | 14–17 | 11–<14 | >17–19 | <11 | >19 |
| Infants | |||||
| 4–11 month | 12–15 | 10–<12 | >15–18 | <10 | >18 |
| Toddlers | |||||
| 1–2 years | 11–14 | 9–<11 | >14–16 | <9 | >16 |
| Pre-schoolers | |||||
| 3–5 years | 10–13 | 8–<10 | >13–14 | <8 | >14 |
| School-aged children | |||||
| 6–13 years | 9–11 | 7–<9 | >11–12 | <7 | >12 |
| Teens | |||||
| 14–17 years | 8–10 | 7–<8 | >10–11 | <7 | >11 |
| Young adults | |||||
| 18–25 years | 7–9 | 6–<7 | >9–11 | <6 | >11 |
| Adults | |||||
| 26–64 years | 7–9 | 6–<7 | >9–10 | <6 | >10 |
| Older adults | |||||
| ≥65 years | 7–8 | 5–<7 | >8–9 | <5 | >9 |
| Year | Designated Sample, N | ATUS Respondents N (%) | Men N (%) | Weekdays 1 N | Weekends N |
|---|---|---|---|---|---|
| 2015 | 23,281 | 10,905 (46.8) | 4778 (43.8) | 5475 | 5430 |
| 2016 | 23,254 | 10,493 (45.5) | 4670 (44.5) | 5327 | 5166 |
| 2017 | 23,303 | 10,223 (43.9) | 4642 (45.4) | 5059 | 5144 |
| Total | 69,838 | 31,621 (45.3) | 14,090 (44.6) | 15,881 | 15,740 |
| Characteristics | Respondents, N | Weighted Percentage (95% CI) |
|---|---|---|
| Age (years) | ||
| 17–20 | 1515 | 8.1 (8.1; 8.1) |
| 20–34 | 5889 | 25.2 (25.1; 25.3) |
| 35–49 | 8368 | 23.6 (23.5; 23.6) |
| 50–64 | 8106 | 24.4 (24.4; 24.5) |
| ≥65 | 7287 | 18.7 (18.6; 18.7) |
| Sex, Male | 13,893 | 48.3 (48.2; 48.4) |
| Race/ethnicity | ||
| White | 20,138 | 65.7 (65.3; 66.1) |
| Black | 4471 | 11.9 (11.9; 12.0) |
| Hispanic | 4757 | 16.1 (16.1; 16.2) |
| Asian | 1246 | 4.4 (4.1; 4.8) |
| Other | 553 | 1.9 (1.7; 2.0) |
| Highest level of education | ||
| Less than high school | 3966 | 15.6 (15.2; 16.0) |
| High school graduate | 12,889 | 44.1 (43.5; 44.7) |
| College graduate | 9892 | 28.6 (28.1; 29.2) |
| Masters or higher | 4418 | 11.7 (11.3; 12.1) |
| Children in Household | ||
| No child | 18,407 | 61.9 (61.7; 62.1) |
| One or more children | 12,758 | 38.1 (37.9; 38.3) |
| Marital status | ||
| Married | 15,197 | 52.2 (51.6; 52.7) |
| Divorced/Separated | 5392 | 11.5 (11.1; 11.9) |
| Widowed | 2886 | 5.5 (5.2; 5.7) |
| Never married | 7690 | 30.9 (30.4; 31.4) |
| Family income | ||
| <USD 50,000 | 14,626 | 42.9 (42.2; 43.6) |
| USD 50,000 to <100,000 | 9441 | 31.9 (31.2; 32.7) |
| ≥USD 100,000 | 7098 | 25.2 (24.5; 25.8) |
| Employment | ||
| Full-time student | 1674 | 9.0 (8.5; 9.4) |
| Employed | 17,978 | 57.3 (56.7; 58.0) |
| Unemployed | 736 | 2.4 (2.2; 2.7) |
| Not in Labour Force/Retired | 10,777 | 31.3 (30.8; 31.8) |
| Year of Survey | |||||
|---|---|---|---|---|---|
| 2015 | 2016 | 2017 | Total | ||
| Weekday | Men | 8.46 (0.06) | 8.30 (0.06) | 8.34 (0.06) | 8.36 (0.03) |
| Women | 8.58 (0.05) | 8.55 (0.05) | 8.55 (0.05) | 8.56 (0.03) | |
| All | 8.52 (0.04) | 8.43 (0.04) | 8.45 (0.04) | 8.46 (0.02) | |
| Weekend | Men | 9.27 (0.06) | 9.39 (0.06) | 9.26 (0.05) | 9.31 (0.03) |
| Women | 9.36 (0.05) | 9.39 (0.05) | 9.38 (0.05) | 9.38 (0.03) | |
| All | 9.31 (0.04) | 9.39 (0.04) | 9.32 (0.03) | 9.34 (0.02) | |
| AR | AS | AL | NRS | NRL | ||
|---|---|---|---|---|---|---|
| Weekday | Men | 3186 (45.8) | 989 (13.2) | 968 (15.0) | 629 (9.0) | 1181 (17.2) |
| Women | 3841 (44.8) | 975 (10.7) | 1460 (17.6) | 605 (7.0) | 1797 (19.9) | |
| All | 7027 (45.3) | 1964 (11.9) | 2428 (16.3) | 1234 (8.0) | 2978 (18.6) | |
| Weekend | Men | 2363 (33.5) | 514 (7.2) | 1436 (21.4) | 397 (5.7) | 2230 (32.2) |
| Women | 2744 (32.2) | 616 (6.4) | 1902 (22.4) | 392 (4.6) | 2940 (34.4) | |
| All | 5107 (32.8) | 1130 (6.8) | 3338 (21.9) | 789 (5.2) | 5170 (33.3) |
| Weighted Proportion, % | ||||||
|---|---|---|---|---|---|---|
| Variables | AR | AS | AL | NRS | NRL | p |
| Age (years) | ||||||
| 17–20 | 39.0 | 10.0 | 17.2 | 7.1 | 26.7 | <0.0001 |
| 20–34 | 42.2 | 8.1 | 21.1 | 7.3 | 21.3 | |
| 35–49 | 48.5 | 11.5 | 14.7 | 8.3 | 17.0 | |
| 50–64 | 49.7 | 11.9 | 13.2 | 9.0 | 16.3 | |
| ≥65 | 23.2 | 10.4 | 24.2 | 3.0 | 39.2 | |
| Sex | ||||||
| Male | 42.2 | 11.5 | 16.8 | 8.0 | 21.5 | <0.0001 |
| Female | 41.2 | 9.5 | 19.0 | 6.3 | 24.1 | |
| Race/ethnicity | ||||||
| White | 43.8 | 10.1 | 18.5 | 6.7 | 20.8 | <0.0001 |
| Black | 31.1 | 12.8 | 15.2 | 11.3 | 29.5 | |
| Hispanic | 41.0 | 9.8 | 17.1 | 6.2 | 26.0 | |
| Asian | 42.6 | 10.2 | 19.4 | 5.2 | 22.6 | |
| Other | 37.0 | 11.3 | 18.2 | 10.4 | 23.1 | |
| Educational attainment | ||||||
| Less than high school | 35.7 | 9.6 | 16.9 | 6.9 | 30.9 | <0.0001 |
| High school graduate | 38.8 | 10.0 | 19.2 | 7.2 | 24.7 | |
| College graduate | 45.8 | 11.0 | 17.1 | 7.5 | 18.6 | |
| Masters or higher | 50.5 | 11.8 | 16.3 | 6.2 | 15.2 | |
| Children in Household | ||||||
| No child | 39.6 | 9.9 | 19.0 | 6.6 | 24.9 | <0.0001 |
| One or more children | 45.0 | 11.2 | 16.2 | 8.1 | 19.5 | |
| Marital status | ||||||
| Married | 44.7 | 11.0 | 17.4 | 6.9 | 20.1 | <0.0001 |
| Divorced/Separated | 40.3 | 10.8 | 15.9 | 7.9 | 25.1 | |
| Widowed | 26.4 | 11.8 | 19.0 | 4.3 | 38.4 | |
| Never married | 39.9 | 9.1 | 19.4 | 7.7 | 23.9 | |
| Family income | ||||||
| <USD 50,000 | 35.6 | 9.5 | 18.7 | 7.0 | 29.1 | <0.0001 |
| USD 50,000–<100,000 | 42.7 | 11.0 | 18.7 | 7.0 | 20.6 | |
| ≥USD 100,000 | 50.7 | 11.3 | 15.5 | 7.5 | 15.0 | |
| Employment | ||||||
| Full-time student | 38.7 | 7.9 | 22.8 | 7.4 | 23.2 | <0.0001 |
| Employed | 48.0 | 12.0 | 15.2 | 8.0 | 16.8 | |
| Unemployed | 36.1 | 8.2 | 18.9 | 9.5 | 27.2 | |
| Not in Labour Force/Retired | 31.4 | 8.5 | 21.5 | 5.3 | 33.3 | |
| NSF Sleep Recommendation Categories | |||||
|---|---|---|---|---|---|
| Duration (95% CI) | Change in Waking Activity Compared to Reference Category (AR) in min (95% CI) | ||||
| Waking Activity | AR | NRS | AS | AL | NRL |
| Work and work-related activities | 450.6 (435.3; 465.8) | +53.7 (37.3; 69.7) # | +41.3 (29.1; 53.5) # | −73.0 (−84.6; −61.3) # | −124.3 (−134.7; −113.9) # |
| Socialising, relaxing, and leisure | 218.9 (206.1; 231.6) | +47.7 (32.9; 62.6) # | +7.9 (−1.5; 17.4) | +10.8 (0.9; 20.7) * | −8.4 (−18.7; 1.8) |
| TV watching | 142.7 (131.6; 153.9) | +17.1 (4.2; 29.9) ‡ | +4.2 (−4.1; 12.4) | +9.3 (1.2; 17.4) * | +4.4 (−4.4; 13.3) |
| Screen time | 152.6 (141.2; 164.0) | +16.6 (4.0; 29.3) * | +4.4 (−4.4; 13.1) | +12.1 (3.1; 21.1) ‡ | +2.3 (−7.1; 11.6) |
| Travel | 73.9 (69.1; 78.7) | +26.8 (20.0; 33.5) # | +16.2 (11.5; 20.8) # | −7.8 (−11.5; −4.2) # | −15.9 (−20.4; −11.5) # |
| Personal care (excluding sleep) | 33.6 (29.5; 37.7) | +19.5 (12.7; 26.4) # | +7.8 (14.1; 11.5) # | −7.3 (−9.7; −4.9) # | −9.4 (−11.9; −6.9) # |
| Household activities | 71.2 (61.9; 80.5) | + 8.2 (0.4; 16.1) * | −2.1 (−8.5; 4.4) | +10.0 (2.1; 17.8) * | −10.1 (−17.2; −2.9) ‡ |
| Eating and drinking | 60.7 (57.5; 63.9) | +1.5 (−2.8; 5.9) | −1.0 (−3.4; 1.5) | −0.8 (−3.6; 2.0) | −3.8 (−6.0; −1.6) ‡ |
| Sport, exercise and recreation | 15.7 (12.5; 18.9) | +2.8 (−1.2; 6.8) | +1.1 (−2.2; 4.4) | +1.1 (−1.9; 4.1) | −1.6 (−4.0; 0.8) |
| Consumer purchases | 11.8 (9.0; 14.6) | +0.7 (−2.1; 3.5) | +0.6 (−1.6; 2.8) | +2.0 (−0.6; 4.6) | −1.0 (−3.6; 1.3) |
| Education | −3.9 (−9.9; 2.2) | +15.6 (3.2; 28.0) * | +5.9 (−0.6; 12.3) | −21.8 (−27.5; −16.0) # | −31.6 (−37.4; −25.7) # |
| Care for household members | −2.3 (−6.8; 2.1) | +2.6 (−1.8; 7.0) | +3.4 (−0.2; 6.9) | −1.7 (−5.3; 1.9) | −6.6 (−9.5; −3.8) # |
| Care for nonhousehold members | 8.7 (5.8; 11.5) | −0.2 (−2.8;2.4) | +1.5 (−1.1; 4.0) | −0.6 (−2.9; 1.7) | −1.8 (−4.2; 0.6) |
| Religious and spiritual activities | 2.1 (−0.2; 4.4) | −0.1 (−2.2; 1.9) | +0.3 (−1.4; 2.0) | −0.9 (−2.2; 0.5) | −1.8 (−3.2; −0.5) ‡ |
| Volunteer activities | 4.4 (1.5; 7.3) | +3.5 (−0.3; 7.3) | +2.4 (−0.4; 5.1) | −0.5 (−3.2; 2.3) | −4.1 (−6.0; −2.1) # |
| Telephone calls | 0.5 (−1.0; 2.0) | +0.1 (−2.0; 2.3) | +1.0 (−0.6; 2.7) | −1.8 (−2.9; −0.7) ‡ | −1.9 (−3.2; −0.7) ‡ |
| Household services | 1.4 (0.5; 2.3) | −0.2 (−0.9; 0.5) | −0.4 (−1.2; 0.5) | −0.2 (−0.8; 0.3) | −0.4 (−1.0; 0.2) |
| Professional/personal care services | 2.2 (0.7; 3.7) | +2.1 (−0.4; 4.7) | +0.8 (−1.0; 2.5) | +0.3 (−1.1; 1.7) | +1.6 (0.1; 3.1) * |
| Government service and civic duties | 0.1 (0.0; 0.2) | 0.0 (−0.3; 0.3) | −0.1 (−0.2; 0.1) | 0.0 (−0.2; 0.1) | 0.1 (−0.2; 0.3) |
| NSF Sleep Recommendation Categories | |||||
|---|---|---|---|---|---|
| Duration (95% CI) | Change in waking activity compared to reference category (AR) in min (95% CI) | ||||
| Waking Activity | AR | NRS | AS | AL | NRL |
| Work and work-related activities | 140.2 (126.6; 153.8) | +97.4 (72.2; 122.7) # | +46.3 (28.7; 63.9) # | −40.2 (−48.8; −31.5) # | −60.5 (−67.1; −53.9) # |
| Socialising, relaxing, and leisure | 356.6 (341.7; 371.6) | +43.8 (15.1; 72.4) ‡ | +29.7 (11.9; 47.5) ‡ | −8.0 (−18.1; 2.0) | −35.3 (−45.2; −25.4) # |
| TV watching | 218.4 (203.9; 232.9) | +3.7 (−19.5; 27.0) | +1.9 (−15.3; 19.1) | +2.8 (−6.3; 11.9) | −0.5 (−8.9; 7.9) |
| Screen time | 228.3 (213.9; 242.8) | +1.5 (−22.4; 25.4) | +4.5 (−13.7; 22.7) | +0.2 (−9.0; 9.4) | −2.7 (−11.2; 5.8) |
| Travel | 79.1 (73.1; 85.1) | +44.3 (28,7; 60.0) # | +17.1 (8.5; 25.7) # | −8.9 (−13.0; −4.9) # | −24.0 (−27.7; −20.2) # |
| Personal care (excluding sleep) | 30.2 (26.7; 33.6) | +21.5 (12.3; 30.7) # | +8.0 (1.8; 14.2) * | −2.5 (−5.0; 0.0) # | −6.6 (−8.9; −4.3) # |
| Household activities | 141.7 (130.8; 152.6) | −9.7 (−23.3; 3.9) | −9.6 (−21.1; 1.9) | −5.0 (−13.0; 3.0) | −26.9 (−33.1; −20.7) # |
| Eating and drinking | 71.7 (67.7; 75.7) | −0.4 (−6.8; 6.1) | −0.7 (−4.9; 3.4) | 0.0 (−2.6; 2.6) | −4.5 (−6.9; 2.1) # |
| Sport, exercise and recreation | 32.3 (27.0; 37.5) | +7.2 (−2.6; 17.1) | +10.1 (1.5; 18.8) * | −5.9 (−9.2; −2.6) ‡ | −7.4 (−10.9; −3.9) # |
| Consumer purchases | 30.7 (26.9; 34.6) | −3.8 (−9.0; 1.4) | −0.9 (−5.4; 3.6) | −1.4 (−4.4; 1.6) | −5.3 (−7.8; −2.8) # |
| Education | 4.3 (−0.5; 9.1) | −0.7 (−10.4; 0.1) | −1.3 (−7.0; 4.2) | −5.8 (−9.9; −1.7) ‡ | −8.2 (−11.9;−4.4) # |
| Care for household members | 9.5 (5.8; 13.2) | +6.5 (−1.9; 14.9) | −2.4 (−6.8; 2.0) | −3.7 (−6.6; −0.7) * | −11.6 (−14.0; −9.2) # |
| Care for nonhousehold members | 12.1 (8.5; 15.7) | −1.8 (−6.0; 2.4) | −0.2 (−3.7; 3.2) | −1.9 (−4.4; 0.7) | −4.1 (−6.6; −1.6) ‡ |
| Religious and spiritual activities | 15.3 (11.1; 19.6) | −5.0 (−9.8; −0.2) * | −4.1 (−8.4; 0.1) | −0.7 (−3.5; 2.1) | −5.1 (−7.4; −2.8) # |
| Volunteer activities | 9.4 (6.2; 12.6) | 5.0 (−1.5; 11.4) | 2.3 (−1.6; 6.3) | −2.9 (−5.4; −0.3) * | −6.7 (−8.6; −4.9) # |
| Telephone calls | 0.7 (−0.8; 2.1) | +4.6 (−2.0; 11.1) | +1.6 (−0.5; 3.6) | −0.8 (−2.0; 0.4) | −2.0 (−3.1; −0.8) ‡ |
| Household services | 0.4 (0.0; 0.8) | 0.0 (−0.7; 0.6) | −0.1 (−0.6; 0.4) | −0.3 (−0.6; 0.1) | −0.2 (−0.6; 0.1) |
| Professional/personal care services | 1.9 (0.8; 3.0) | +2.1 (−0.2; 4.5) | −0.5 (−1.6; 0.7) | −0.5 (−1.5; 0.5) | −0.9 (−1.7; −0.1) * |
| Government service and civic duties | 0.0 (−0.2; 0.2) | 0.0 (−0.3; 0.3) | −0.1 (−0.2; 0.1) | 0.0 (−0.2; 0.1) | 0.1 (−0.2; 0.3) |
Publisher’s Note: MDPI stays neutral with regard to jurisdictional claims in published maps and institutional affiliations. |
© 2021 by the authors. Licensee MDPI, Basel, Switzerland. This article is an open access article distributed under the terms and conditions of the Creative Commons Attribution (CC BY) license (https://creativecommons.org/licenses/by/4.0/).
Share and Cite
Mireku, M.O.; Rodriguez, A. Sleep Duration and Waking Activities in Relation to the National Sleep Foundation’s Recommendations: An Analysis of US Population Sleep Patterns from 2015 to 2017. Int. J. Environ. Res. Public Health 2021, 18, 6154. https://0-doi-org.brum.beds.ac.uk/10.3390/ijerph18116154
Mireku MO, Rodriguez A. Sleep Duration and Waking Activities in Relation to the National Sleep Foundation’s Recommendations: An Analysis of US Population Sleep Patterns from 2015 to 2017. International Journal of Environmental Research and Public Health. 2021; 18(11):6154. https://0-doi-org.brum.beds.ac.uk/10.3390/ijerph18116154
Chicago/Turabian StyleMireku, Michael Osei, and Alina Rodriguez. 2021. "Sleep Duration and Waking Activities in Relation to the National Sleep Foundation’s Recommendations: An Analysis of US Population Sleep Patterns from 2015 to 2017" International Journal of Environmental Research and Public Health 18, no. 11: 6154. https://0-doi-org.brum.beds.ac.uk/10.3390/ijerph18116154