
Effect of Strength vs. Plyometric Training upon Change of Direction Performance in Young Female Handball Players

 ,
,
Abstract
:1. Introduction
2. Materials and Methods
2.1. Subjects
2.2. Procedures
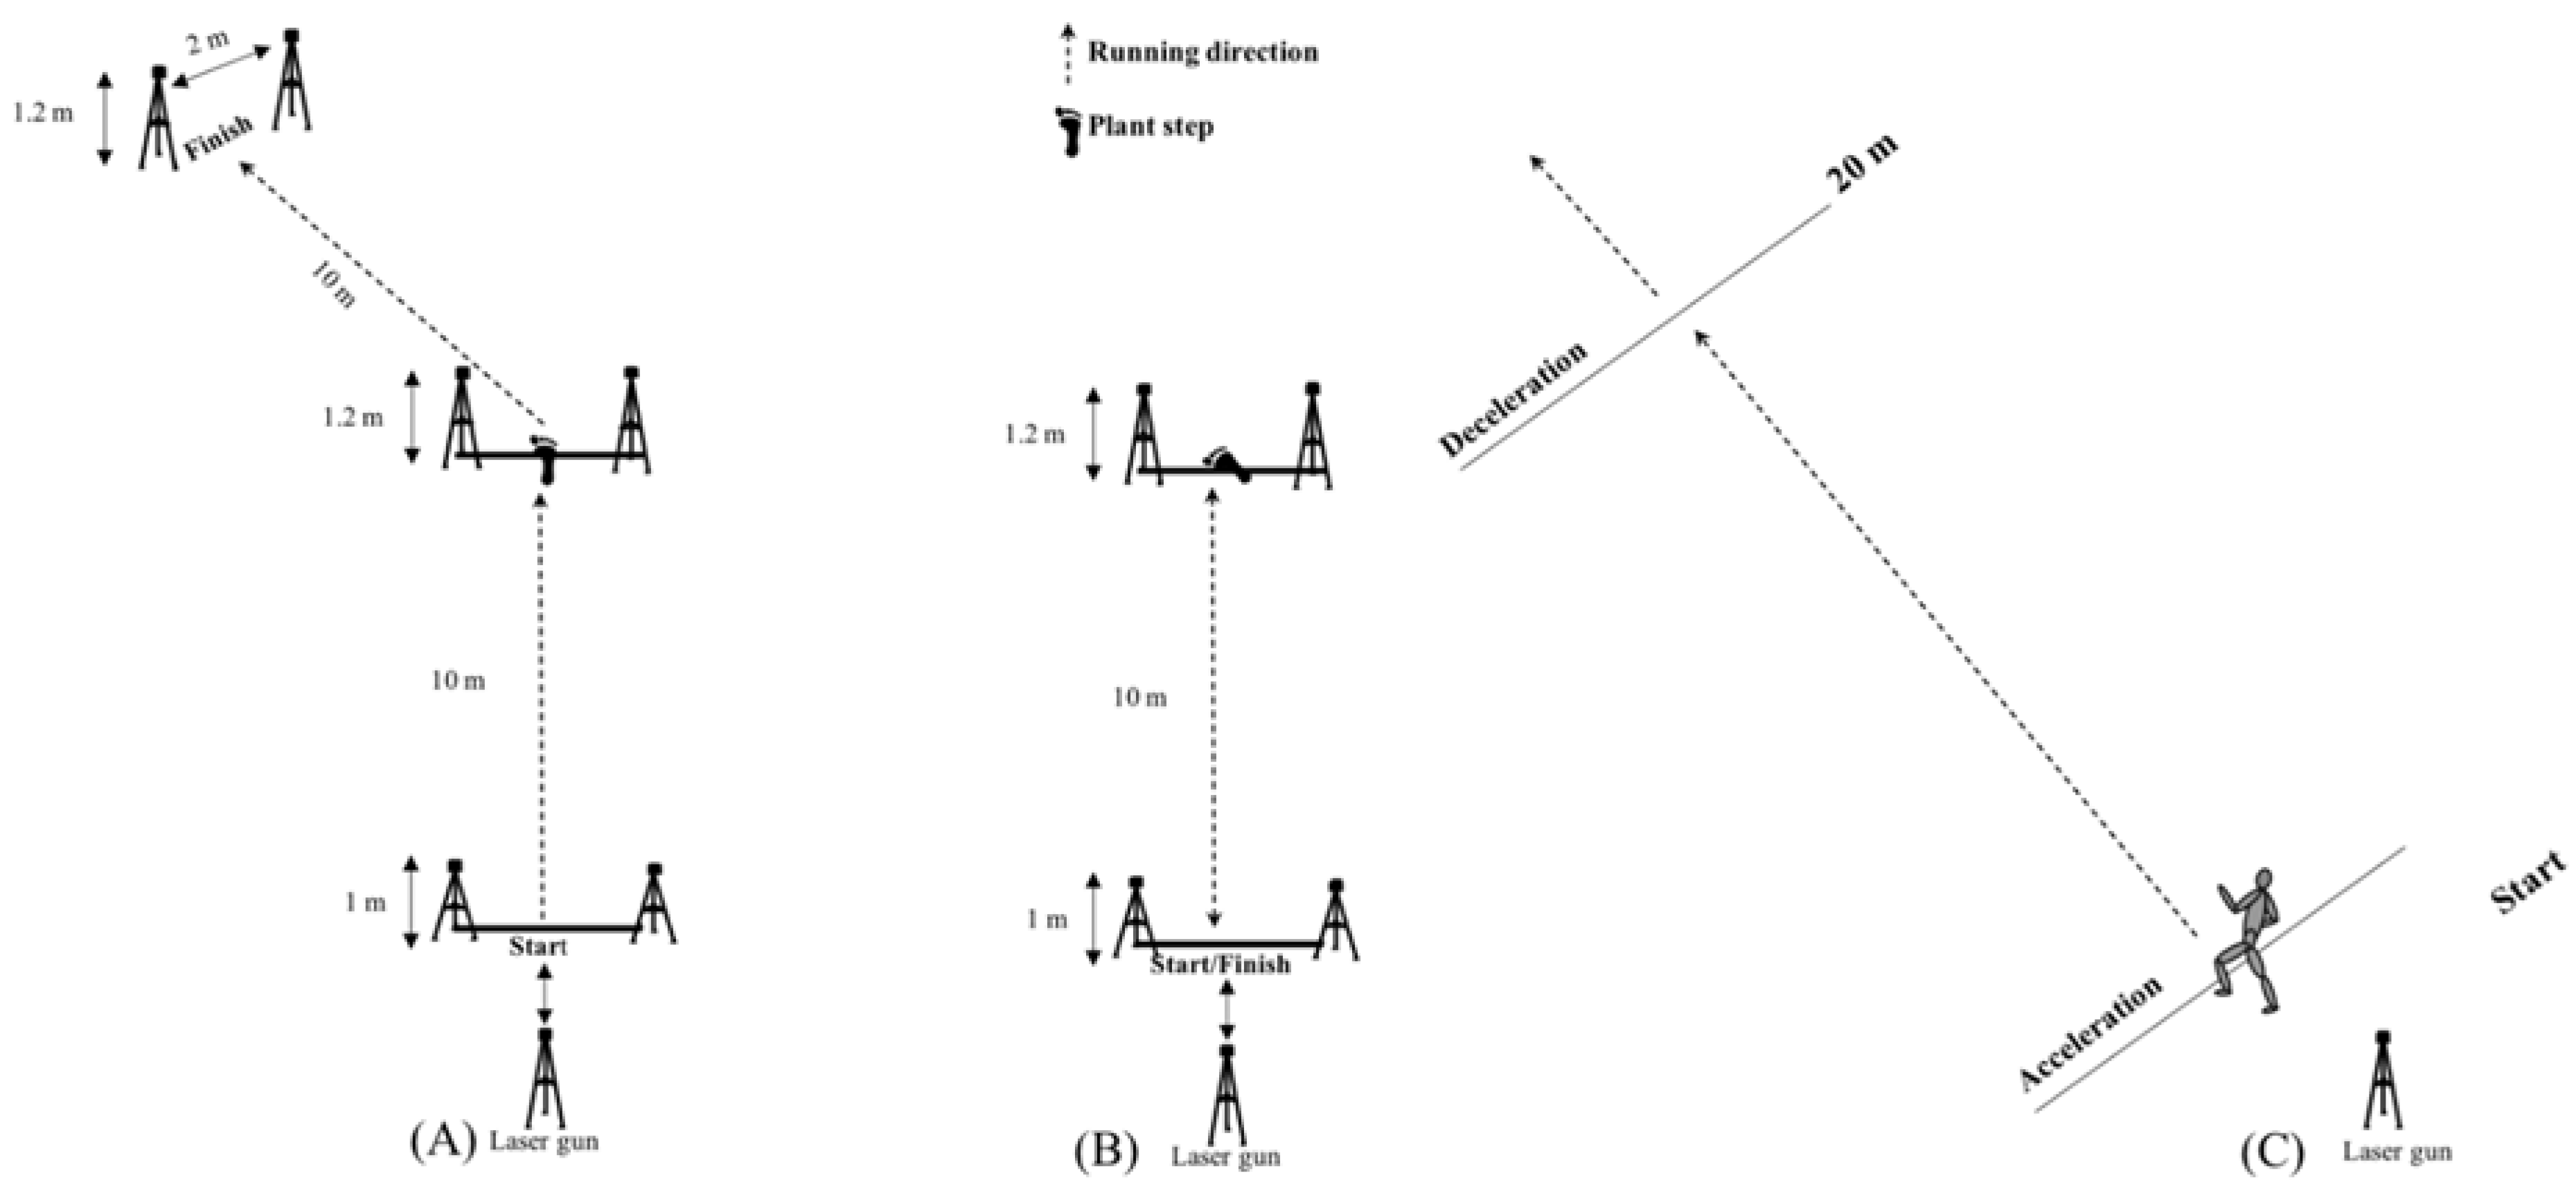
2.2.1. Running Test
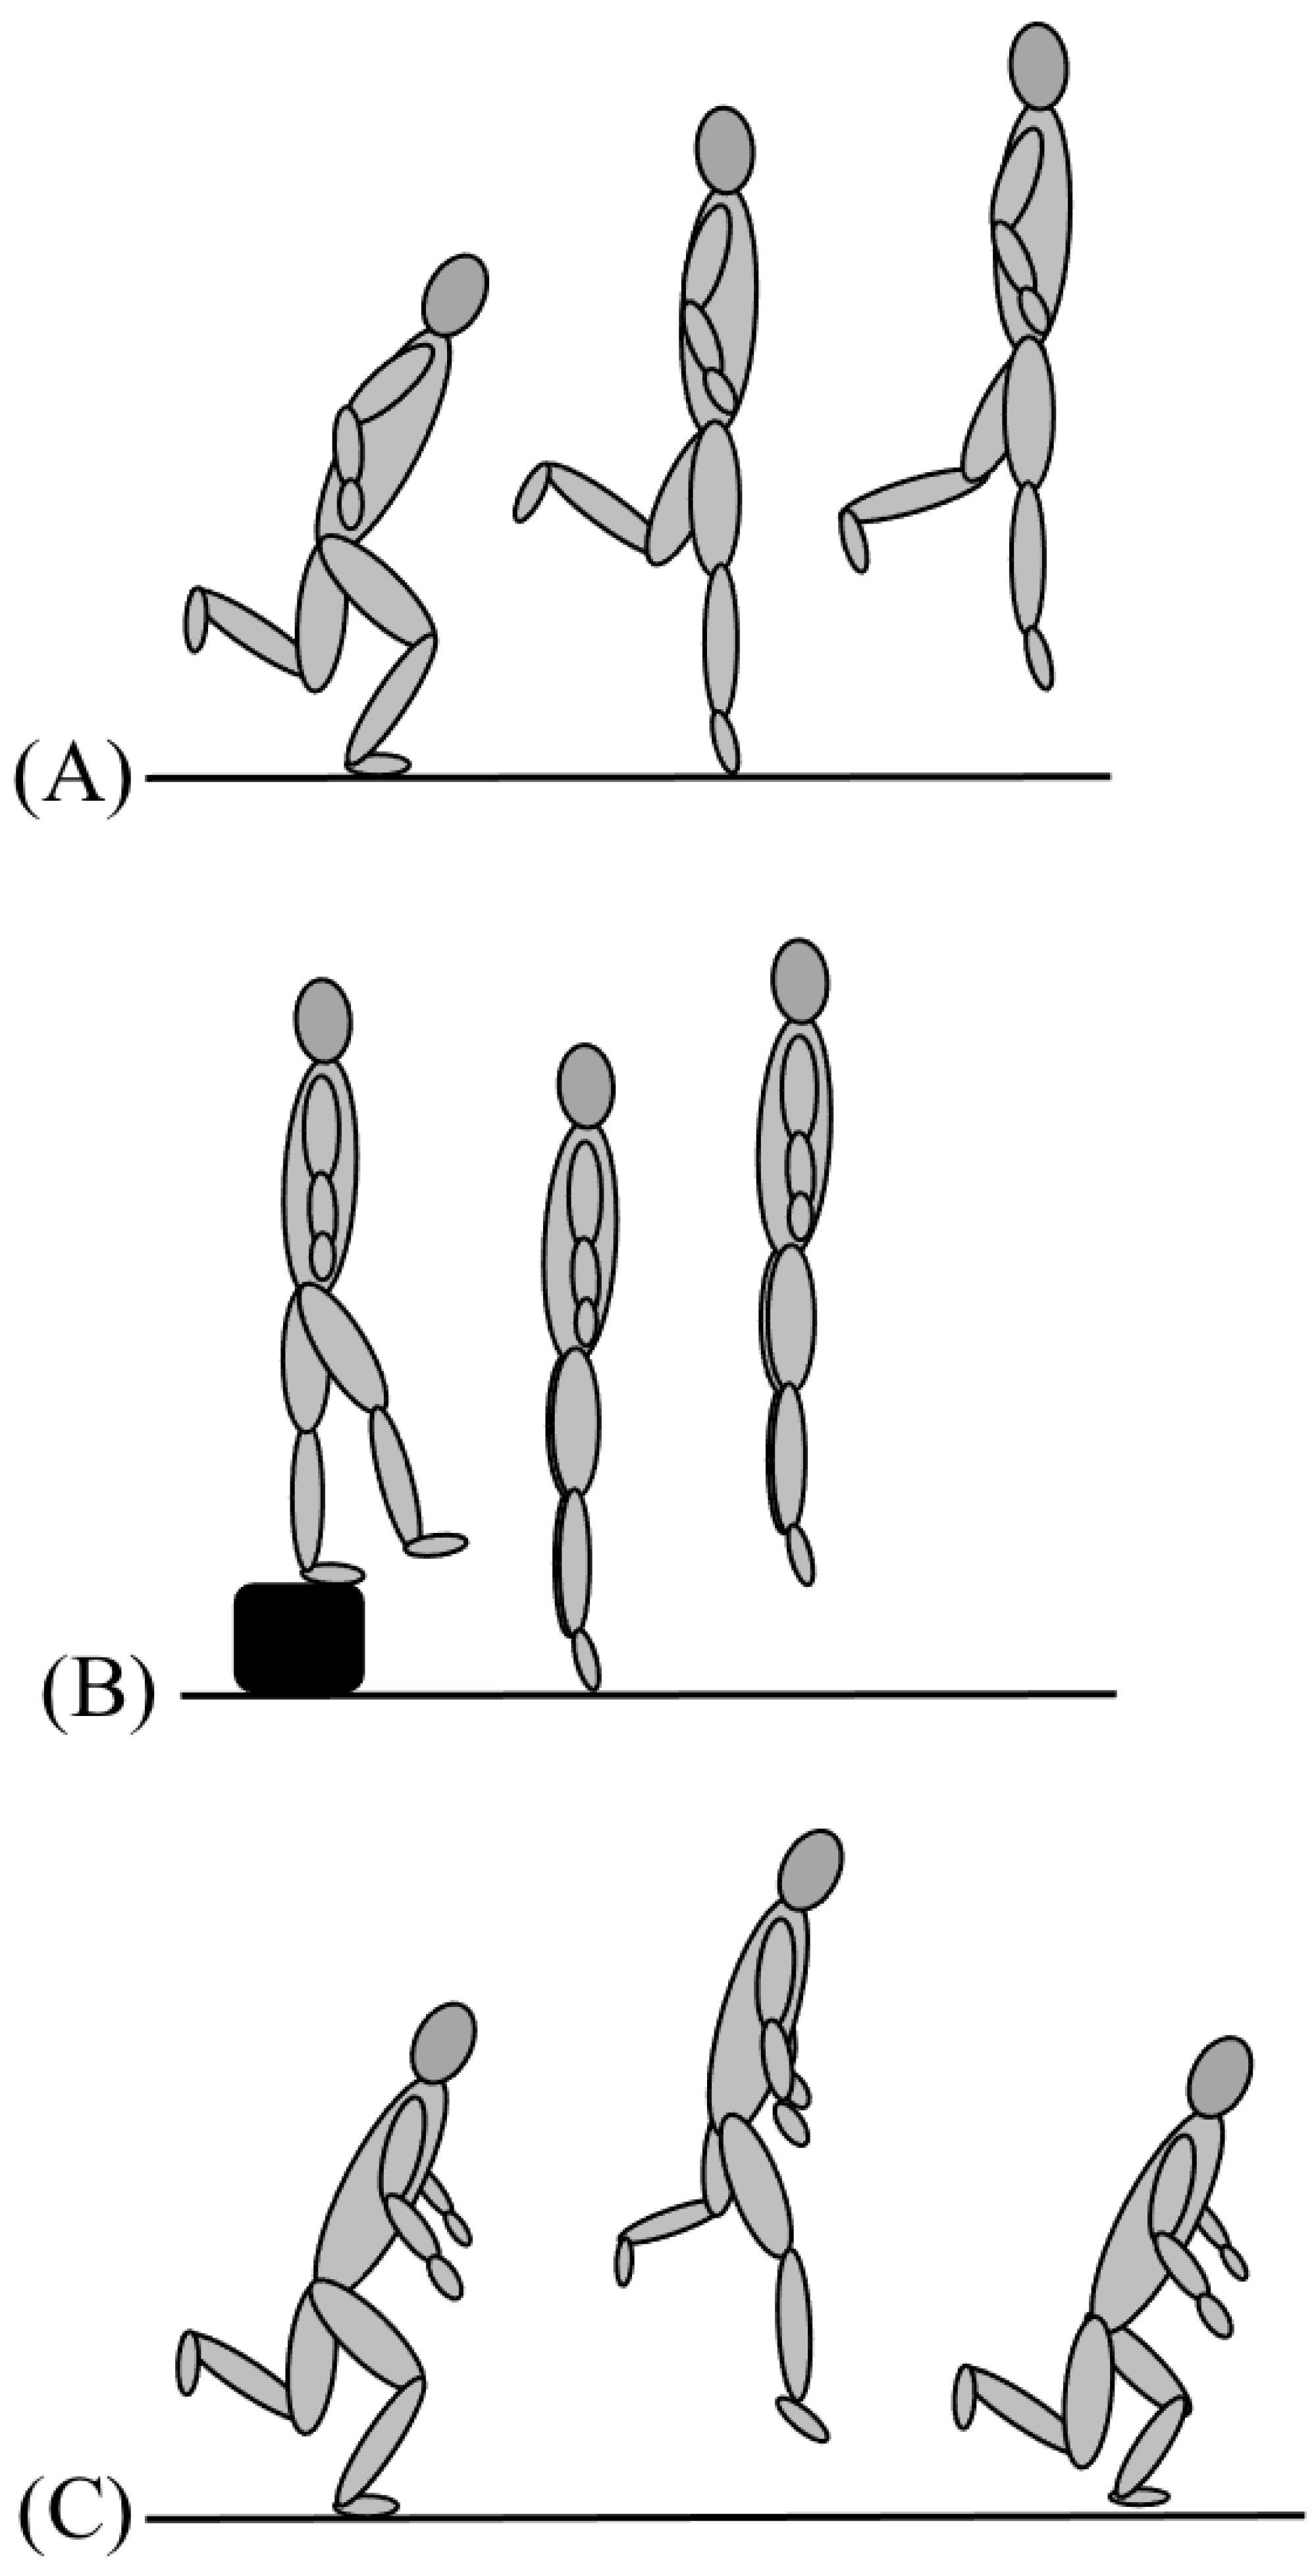
2.2.2. Strength Performance
2.2.3. Plyometric Performance
2.2.4. Training
2.3. Statistical Analysis
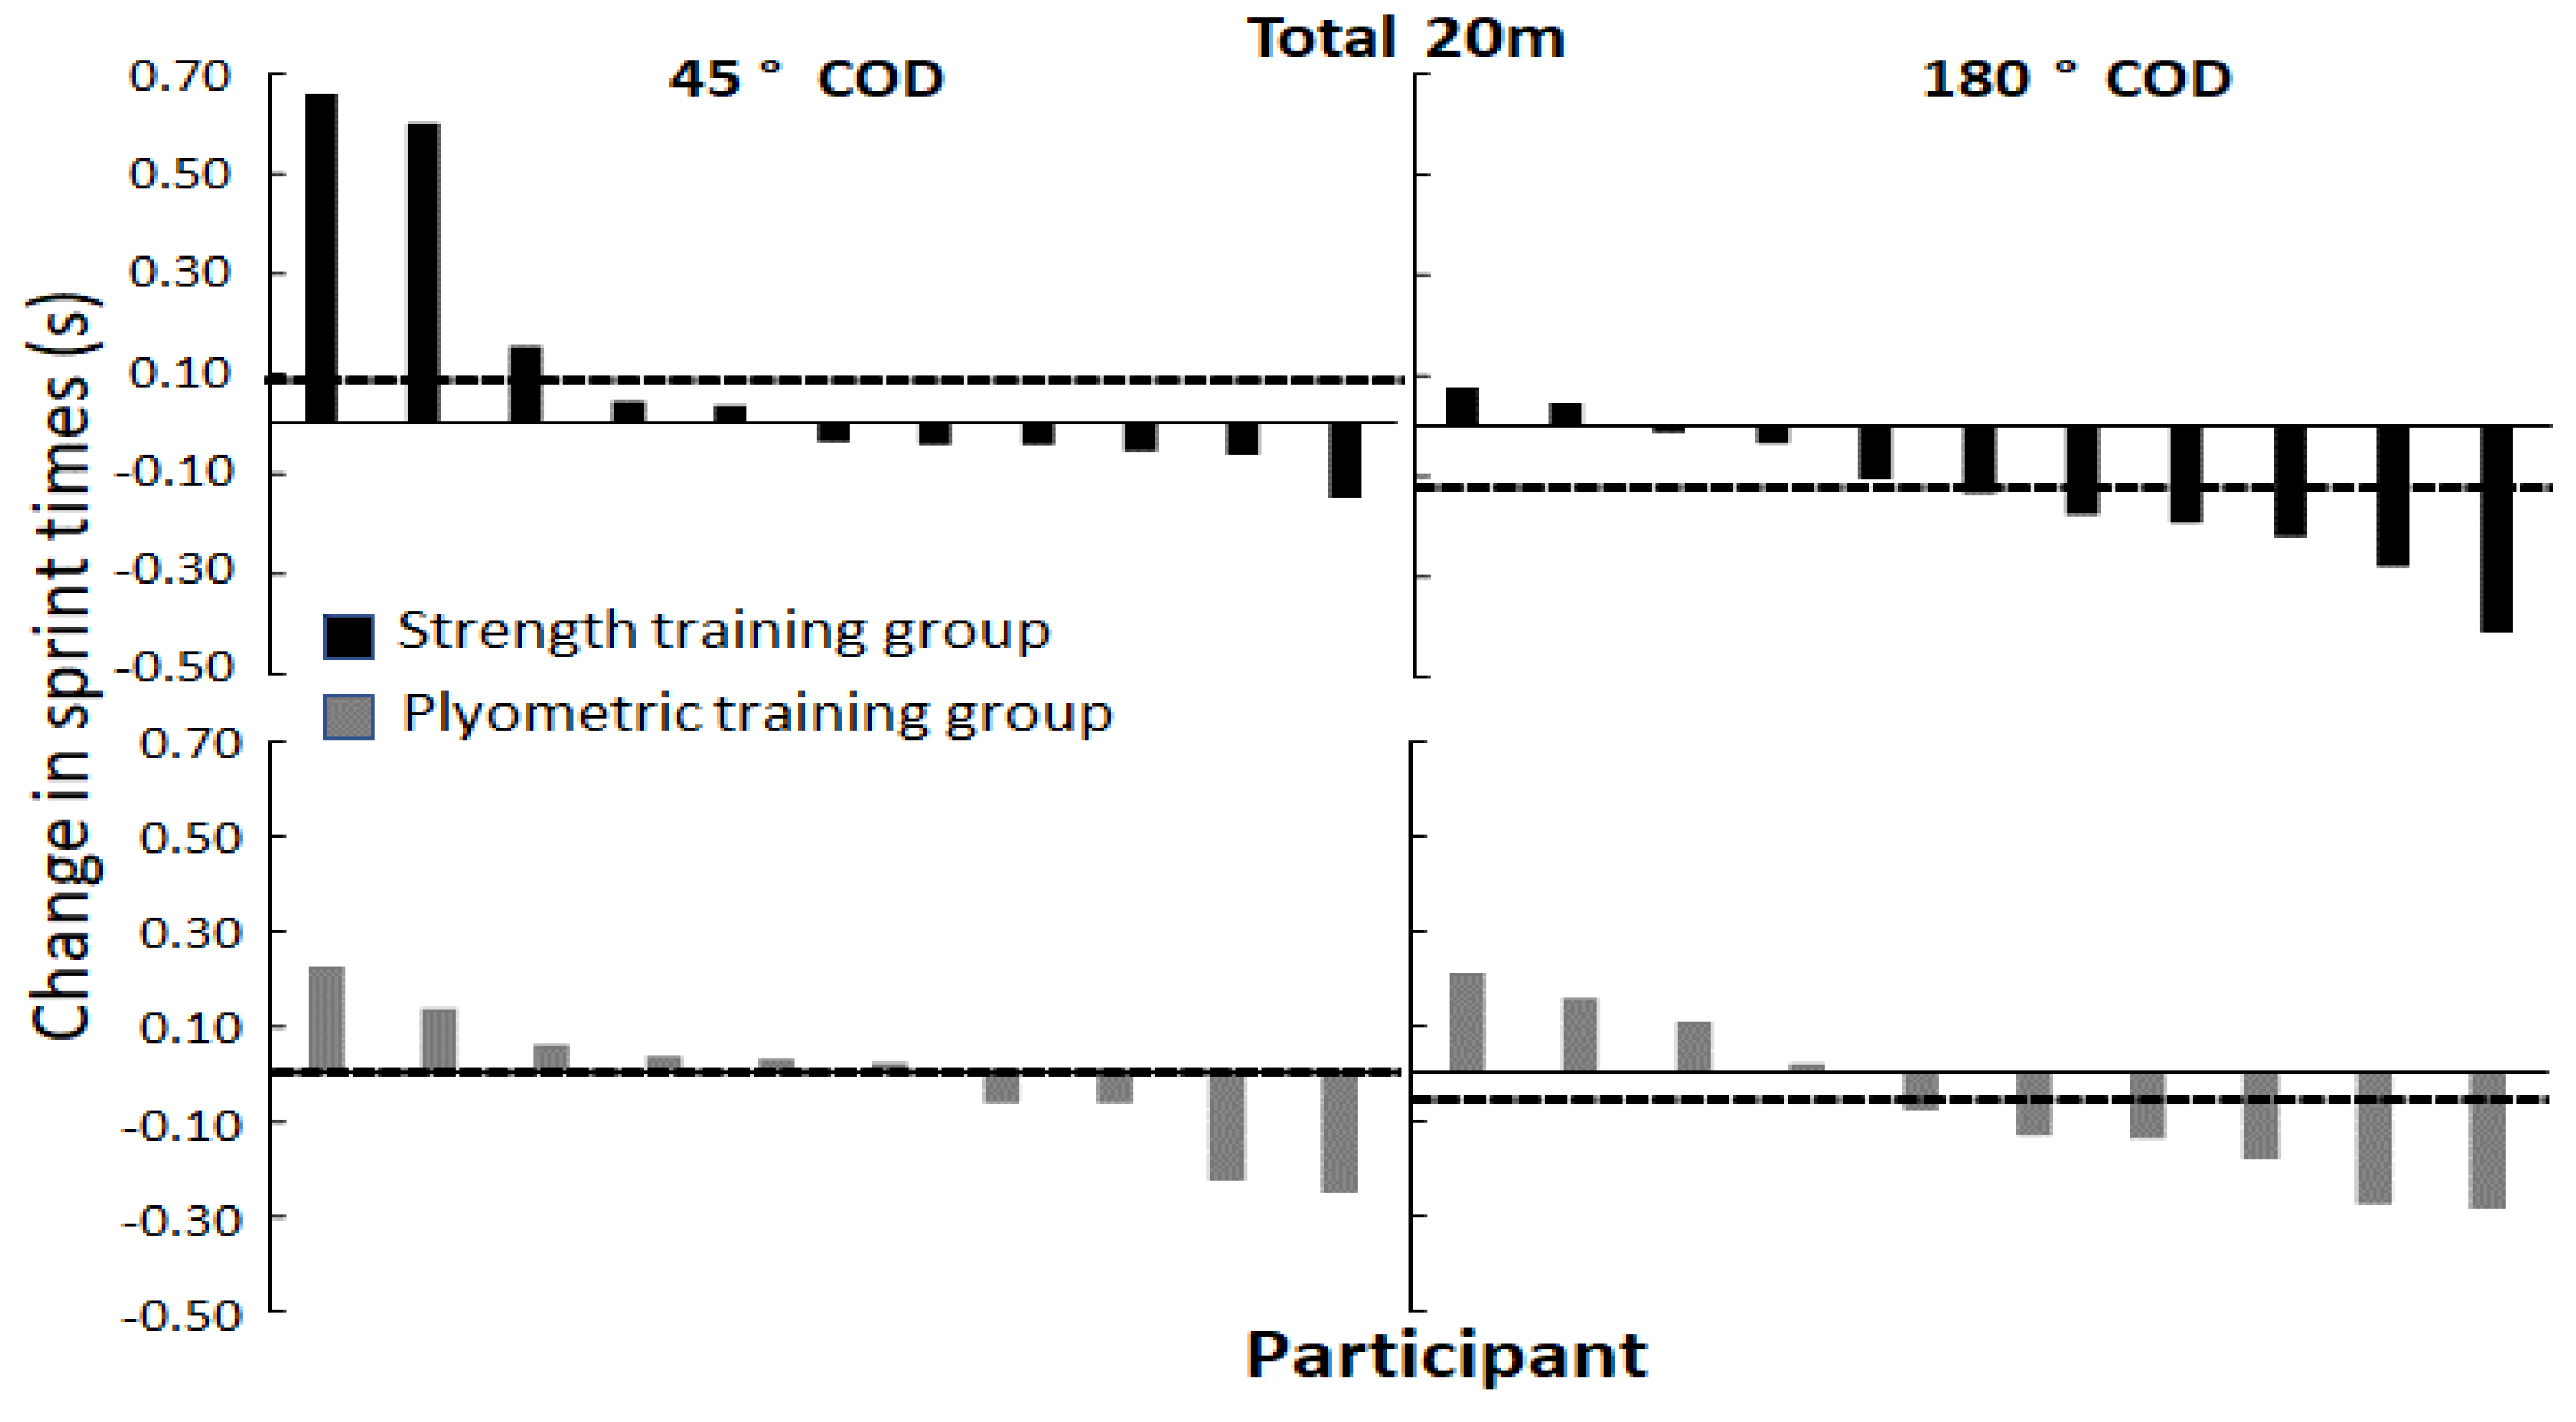
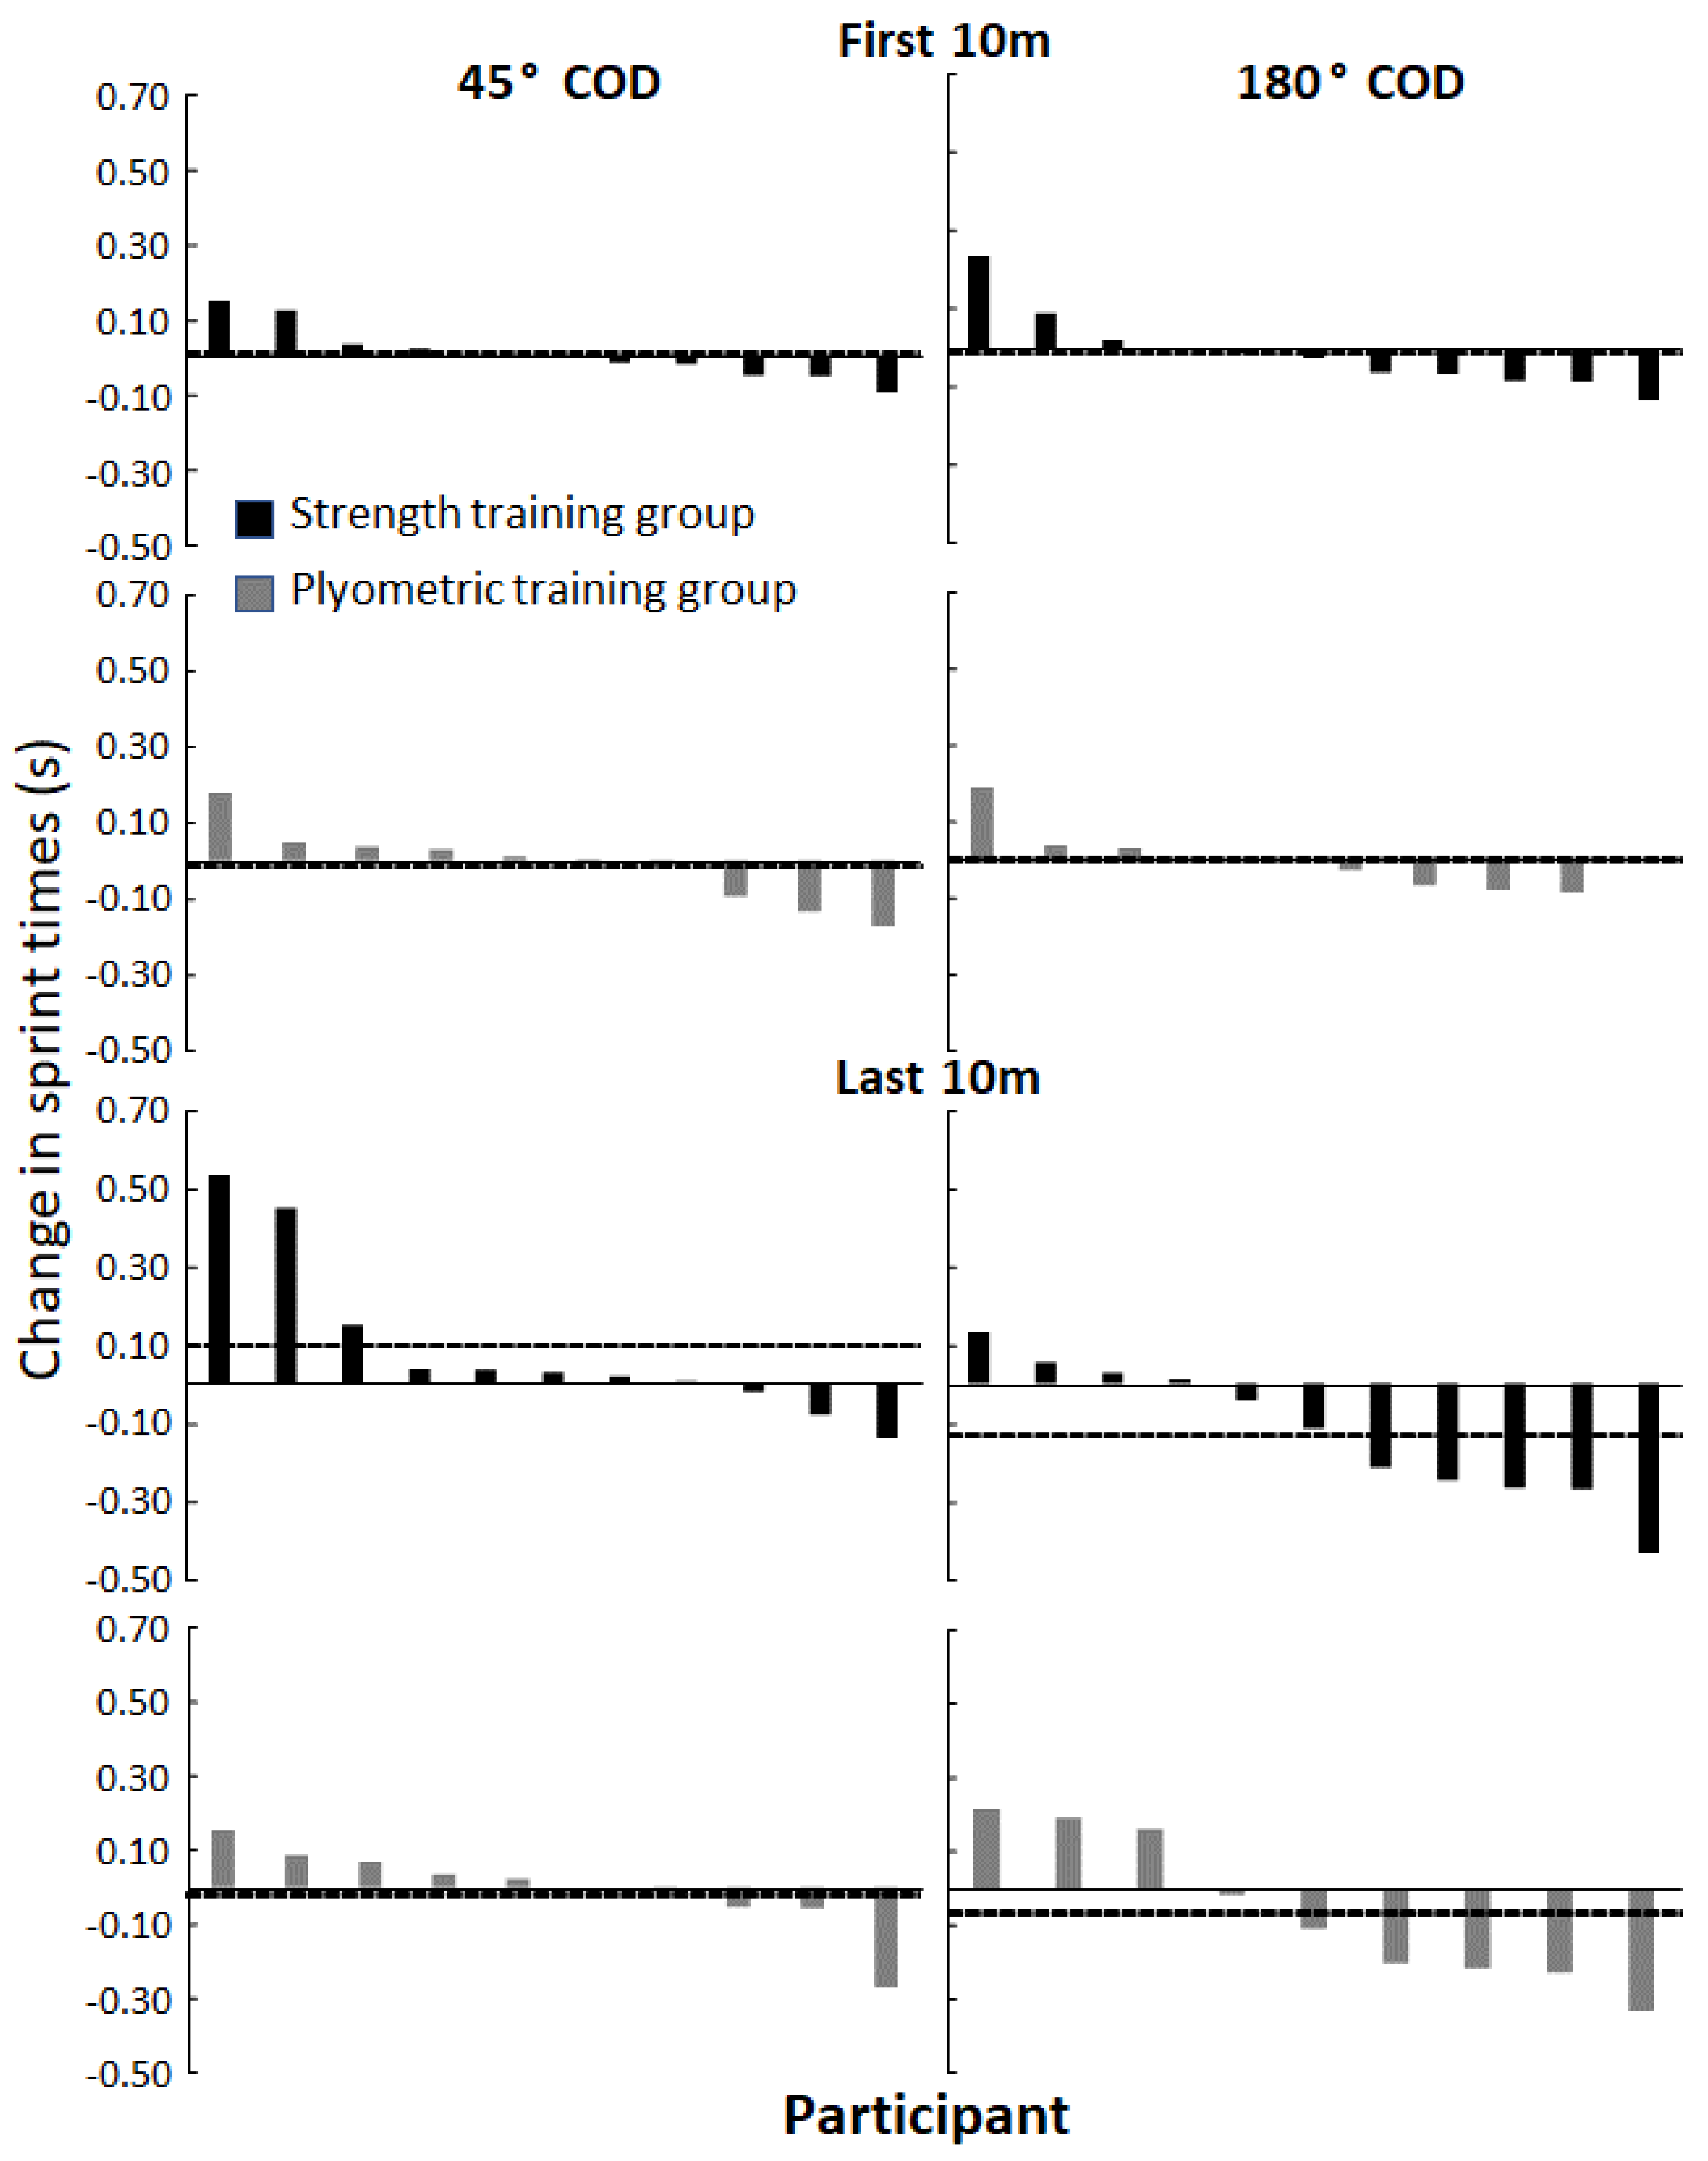
3. Results
4. Discussion
5. Conclusions
Author Contributions
Funding
Institutional Review Board Statement
Informed Consent Statement
Data Availability Statement
Conflicts of Interest
References
- Bloomfield, J.; Polman, P.; O’Donoghue, P. O-007 Deceleration movements performed during FA Premier League soccer matches. J. Sports Sci. Med. 2007, 6, 9–10. [Google Scholar]
- Dalen, T.; Jørgen, I.; Gertjan, E.; Havard, H.G.; Ulrik, W. Player load, acceleration, and deceleration during forty-five competitive matches of elite soccer. J. Strength Cond. Res. 2016, 30, 351–359. [Google Scholar] [CrossRef]
- Conte, D.; Favero, T.G.; Lupo, C.; Francioni, F.M.; Capranica, L.; Tessitore, A. Time-motion analysis of Italian elite women’s basketball games: Individual and team analyses. J. Strength Cond. Res. 2015, 29, 144–150. [Google Scholar] [CrossRef]
- Duthie, G.M.; Pyne, D.B.; Marsh, D.J.; Hooper, S.L. Sprint patterns in rugby union players during competition. J. Strength Cond. Res. 2006, 20, 208. [Google Scholar]
- Young, W.; James, R.; Montgomery, I. Is muscle power related to running speed with changes of direction? J. Sports Med. Phys. Fit. 2002, 42, 282–288. [Google Scholar]
- Falch, H.N.; Rædergård, H.G.; van den Tillaar, R. Effect of Approach Distance and Change of Direction Angles Upon Step and Joint Kinematics, Peak Muscle Activation, and Change of Direction Performance. Front. Sports Act. 2020, 2, 173. [Google Scholar] [CrossRef]
- Sheppard, J.M.; Young, W. Agility literature review: Classifications, training and testing. J. Sports Sci. 2006, 24, 919–932. [Google Scholar] [CrossRef] [Green Version]
- DeWeese, B.; Nimphius, S. Essentials of Strength training and conditioning. J. Hum. Kinet. 2016, 521–558. [Google Scholar]
- Falch, H.N.; Rædergård, H.G.; van den Tillaar, R. Effect of different physical training forms on change of direction ability: A systematic review and meta-analysis. Sports Med.-Open 2019, 5, 1–37. [Google Scholar]
- Chaouachi, A.; Manzi, V.; Chaalali, A.; Wong, D.P.; Chamari, K.; Castagna, C. Determinants analysis of change-of-direction ability in elite soccer players. J. Strength Cond. Res. 2012, 26, 2667–2676. [Google Scholar] [CrossRef]
- Young, W.; Farrow, D. A review of agility: Practical applications for strength and conditioning. Strength Cond. J. 2006, 28, 24. [Google Scholar] [CrossRef]
- Hader, K.; Mendez-Villanueva, A.; Palazzi, D.; Ahmaidi, S.; Buchheit, M. Metabolic power requirement of change of direction speed in young soccer players: Not all is what it seems. PLoS ONE 2016, 11, e0149839. [Google Scholar] [CrossRef]
- Haff, G.G.; Stone, M.H. Methods of developing power with special reference to football players. Strength Cond. J. 2015, 37, 2–16. [Google Scholar] [CrossRef]
- Bourgeois, F.; McGuigan, M.; Gill, N.; Gamble, G. Physical characteristics and performance in change of direction tasks: A brief review and training considerations. J. Strength Cond. Res. 2017, 25, 104–117. [Google Scholar]
- Schreurs, M.J.; Benjaminse, A.; Lemmink, K.A. Sharper angle, higher risk? The effect of cutting angle on knee mechanics in invasion sport athletes. J. Biomech. 2017, 63, 144–150. [Google Scholar] [CrossRef] [Green Version]
- Dos’Santos, T.; Thomas, C.; Comfort, P.; Jones, P.A. The effect of angle and velocity on change of direction biomechanics: An angle-velocity trade-off. Sports Med. 2018, 48, 2235–2253. [Google Scholar] [CrossRef] [Green Version]
- Hewit, J.; Cronin, J.; Button, C.; Hume, P. Understanding deceleration in sport. Strength Cond. J. 2011, 33, 47–52. [Google Scholar] [CrossRef] [Green Version]
- Dos’ Santos, T.; Thomas, C.; Jones, P.A.; Comfort, P. Mechanical determinants of faster change of direction speed performance in male athletes. J. Strength Cond. Res. 2017, 31, 696–705. [Google Scholar] [CrossRef] [Green Version]
- Peterson, M.D.; Alvar, B.A.; Rhea, M.R. The contribution of maximal force production to explosive movement among young collegiate athletes. J. Strength Cond. Res. 2006, 20, 867–873. [Google Scholar]
- Chaouachi, A.; Brughelli, M.; Chamari, K.; Levin, G.T.; Abdelkrim, N.B.; Laurencelle, L.; Castagna, C. Lower limb maximal dynamic strength and agility determinants in elite basketball players. J. Strength Cond. Res. 2009, 23, 1570–1577. [Google Scholar] [CrossRef] [PubMed]
- Kawamori, N.; Newton, R.U. Velocity specificity of resistance training: Actual movement velocity versus intention to move explosively. Strength Cond. J. 2006, 28, 86. [Google Scholar] [CrossRef]
- Falch, H.N.; Rædergård, H.G.; van den Tillaar, R. Association of strength and plyometric exercises with change of direction performances. PLoS ONE 2020, 15, e0238580. [Google Scholar] [CrossRef] [PubMed]
- Falch, H.N.; Kristiansen, E.L.; Haugen, M.E.; van den Tillaar, R. Association of Performance in Strength and Plyometric Tests with Change of Direction Performance in Young Female Team-Sport Athletes. J. Funct. Morphol. Kinesiol. 2021, 6, 83. [Google Scholar] [CrossRef]
- Ramírez-Campillo, R.; Meylan, C.; Álvarez, C.; Henríquez-Olguín, C.; Martínez, C.; Cañas-Jamett, R.; Andrade, D.C.; Izquierdo, M. Effects of in-season low-volume high-intensity plyometric training on explosive actions and endurance of young soccer players. J. Strength Cond. Res. 2014, 28, 1335–1342. [Google Scholar] [CrossRef] [Green Version]
- Thomas, G.A.; Kraemer, W.J.; Spiering, B.A.; Volek, J.S. Maximal power at different percentages of one repetition maximum: Influence of resistance and gender. J. Strength Cond. Res. 2007, 21, 336. [Google Scholar] [CrossRef]
- Asadi, A.; Ramírez-Campillo, R. Effects of cluster vs. traditional plyometric training sets on maximal-intensity exercise performance. Medicina 2016, 52, 41–45. [Google Scholar] [CrossRef] [PubMed]
- Bouteraa, I.; Negra, Y.; Shephard, R.J.; Chelly, M.S. Effects of combined balance and plyometric training on athletic performance in female basketball players. J. Strength Cond. Res. 2020, 34, 1967–1973. [Google Scholar] [CrossRef] [PubMed]
- Ramirez-Campillo, R.; Alvarez, C.; García-Pinillos, F.; Sanchez-Sanchez, J.; Yanci, J.; Castillo, D.; Loturco, I.; Chaabene, H.; Moran, J.; Izquierdo, M. Optimal reactive strength index: Is it an accurate variable to optimize plyometric training effects on measures of physical fitness in young soccer players? J. Strength Cond. Res. 2018, 32, 885–893. [Google Scholar] [CrossRef] [Green Version]
- Rædergård, H.G.; Falch, H.N.; Tillaar, R.v.d. Effects of Strength vs. Plyometric Training on Change of Direction Performance in Experienced Soccer Players. Sports 2020, 8, 144. [Google Scholar] [CrossRef]
- van den Tillaar, R.; Lerberg, E.; von Heimburg, E. Comparison of three types of warm-up upon sprint ability in experienced soccer players. J. Sport Health Sci. 2019, 8, 574–578. [Google Scholar] [CrossRef] [Green Version]
- Harper, D.J.; Morin, J.-B.; Carling, C.; Kiely, J. Measuring maximal horizontal deceleration ability using radar technology: Reliability and sensitivity of kinematic and kinetic variables. Sports Biomech. 2020, 1–17, Online ahead of print. [Google Scholar] [CrossRef] [PubMed]
- Jovanović, M.; Flanagan, E.P. Researched applications of velocity based strength training. J. Aust. Strength Cond. 2014, 22, 58–69. [Google Scholar]
- Rivière, J.R.; Rossi, J.; Jimenez-Reyes, P.; Morin, J.-B.; Samozino, P. Where does the one-repetition maximum exist on the force-velocity relationship in squat? Int. J. Sports Med. 2017, 38, 1035–1043. [Google Scholar] [CrossRef] [Green Version]
- Ettema, G.; Gløsen, T.; van den Tillaar, R. Effect of specific resistance training on overarm throwing performance. Int. J. Physiol Perf 2008, 3, 164–175. [Google Scholar] [CrossRef] [PubMed] [Green Version]
- Cohen, J. In Statistical Power Analysis for the Behaviour Sciences (Revised Edition). Biometr 1988, 73, 19–74. [Google Scholar]
- Little, T.; Williams, A. Specificity of Acceleration, Maximum Speed and Agility in Professional Soccer Players; Routledge: London, UK, 2003. [Google Scholar]
- Green, B.S.; Blake, C.; Caulfield, B.M. A comparison of cutting technique performance in rugby union players. J. Strength Cond. Res. 2011, 25, 2668–2680. [Google Scholar] [CrossRef] [Green Version]
- Jones, P.; Bampouras, T.; Marrin, K. An investigation into the physical determinants of change of direction speed. J. Sports Med. Phys. Fit. 2009, 49, 97–104. [Google Scholar]
- Lloyd, R.S.; Meyers, R.W.; Oliver, J.L. The natural development and trainability of plyometric ability during childhood. Strength Cond. J. 2011, 33, 23–32. [Google Scholar] [CrossRef] [Green Version]
- Falch, H.N.; Guldteig Rædergård, H.; Van den Tillaar, R. Relationship of performance measures and muscle activity between a 180 change of direction task and different countermovement jumps. Sports 2020, 8, 47. [Google Scholar]
- McLean, S.G.; Huang, X.; Su, A.; Van Den Bogert, A.J. Sagittal plane biomechanics cannot injure the ACL during sidestep cutting. Clin. Biomech. 2004, 19, 828–838. [Google Scholar] [CrossRef] [PubMed] [Green Version]
- McLean, S.G.; Huang, X.; Van Den Bogert, A.J. Association between lower extremity posture at contact and peak knee valgus moment during sidestepping: Implications for ACL injury. Clin. Biomech. 2005, 20, 863–870. [Google Scholar] [CrossRef] [PubMed] [Green Version]
- Besier, T.; Lloyd, D.G.; Ackland, T.R. Muscle activation strategies at the knee during running and cutting maneuvers. Med. Sci. Sports Exerc. 2003, 35, 119–127. [Google Scholar] [CrossRef] [PubMed]
- Bencke, J.; Curtis, D.; Krogshede, C.; Jensen, L.K.; Bandholm, T.; Zebis, M.K. Biomechanical evaluation of the side-cutting manoeuvre associated with ACL injury in young female handball players. Knee Surg. Sports Traumatol. Arthrosc. 2013, 21, 1876–1881. [Google Scholar] [CrossRef] [PubMed]
- Neptune, R.R.; Wright, I.C.; Van Den Bogert, A.J. Muscle coordination and function during cutting movements. Med. Sci. Sports Exerc. 1999, 31, 294–302. [Google Scholar] [CrossRef] [PubMed]
- Rhea, M.R.; Kenn, J.G.; Peterson, M.D.; Massey, D.; Simão, R.; Marin, P.J.; Favero, M.; Cardozo, D.; Krein, D. Joint-angle specific strength adaptations influence improvements in power in highly trained athletes. Hum. Mov. 2016, 17, 43–49. [Google Scholar] [CrossRef] [Green Version]


| Age (Years) | Height (cm) | Body Mass (Kg) | |
|---|---|---|---|
| Strength training (n = 11) | 17.5 ± 2.3 | 169.2 ± 5.4 | 65.8 ± 5.9 |
| Plyometric training (n = 10) | 17.1 ± 2.4 | 173.1 ± 6.6 | 67.1 ± 9.3 |
| Training Day | Strength Training Group | Plyometric Training Group | Repetitions/Ground Contacts × Sets | Training Impulse (Ns) per Session | Rest between Sets |
|---|---|---|---|---|---|
| 1 and 2 | Bilateral Squat | Drop jump | 4 × 2/1 × 6 | ≈4550 | 3–5 min/>2 min |
| Unilateral Squat | Unilateral CMJ | 4 × 2/1 × 5 | 3–5 min/>2 min | ||
| Lateral Squat | Skate-jump | 4 × 2/6 × 2 | 3–5 min/>2 min | ||
| 3 and 4 | Bilateral Squat | Drop jump | 5 × 2/1 × 8 | ≈5700 | 3–5 min/>2 min |
| Unilateral Squat | Unilateral CMJ | 5 × 2/1 × 5 | 3–5 min/>2 min | ||
| Lateral Squat | Skate-jump | 5 × 2/6 × 3 | 3–5 min/>2 min | ||
| 5 and 6 | Bilateral Squat | Drop jump | 6 × 2/1 × 8 | ≈6880 | 3–5 min/>2 min |
| Unilateral Squat | Unilateral CMJ | 6 × 2/1 × 8 | 3–5 min/>2 min | ||
| Lateral Squat | Skate-jump | 6 × 2/6 × 3 | 3–5 min/>2 min | ||
| 7 and 8 | Bilateral Squat | Drop jump | 5 × 3/1 × 10 | ≈8500 | 3–5 min/>2 min |
| Unilateral Squat | Unilateral CMJ | 5 × 3/1 × 9 | 3–5 min/>2 min | ||
| Lateral Squat | Skate-jump | 5 × 3/6 × 4 | 3–5 min/>2 min | ||
| 9 and 10 | Bilateral Squat | Drop jump | 6 × 3/1 × 12 | ≈10300 | 3–5 min/>2 min |
| Unilateral Squat | Unilateral CMJ | 6 × 3/1 × 11 | 3–5 min/>2 min | ||
| Lateral Squat | Skate-jump | 6 × 3/6 × 5 | 3–5 min/>2 min | ||
| 11 | Bilateral Squat | Drop jump | 4 × 3/1 × 8 | ≈6880 | 3–5 min/>2 min |
| Unilateral Squat | Unilateral CMJ | 4 × 3/1 × 8 | 3–5 min/>2 min | ||
| Lateral Squat | Skate-jump | 4 × 3/6 × 3 | 3–5 min/>2 min | ||
| 12 | Bilateral Squat | Drop jump | 3 × 2/1 × 5 | ≈3430 | 3–5 min/>2 min |
| Unilateral Squat | Unilateral CMJ | 3 × 2/1 × 4 | 3–5 min/>2 min | ||
| Lateral Squat | Skate-jump | 3 × 2/1 × 4 | 3–5 min/>2 min |
| Strength Training Group | Plyometric Training Group | |||||||
|---|---|---|---|---|---|---|---|---|
| Pre | Post | Change (%) | Effect Size (η2) | Pre | Post | Change (%) | Effect Size (η2) | |
| Strength tests | ||||||||
| Bilateral squat (Kg/BM) | 0.98 ± 0.29 | 1.21 ± 0.34 | 20.07 * | 0.52 ‡ | 0.98 ± 0.32 | 0.99 ± 0.26 | 2.35 | <0.01 |
| Quarter squat (Kg/BM) | 0.58 ± 0.37 | 0.83 ± 0.31 | 40.39 | 0.57 | 0.43 ± 0.11 | 0.64 ± 0.14 | 49.88 * | 0.57 |
| Lateral squat (Kg/BM) | 0.51 ± 0.11 | 0.59 ± 0.23 | 12.56 | 0.13 | 0.59 ± 0.23 | 0.51 ± 0.14 | 10.12 | 0.11 |
| Plyometric tests | ||||||||
| Drop jump (RSI) | 0.82 ± 0.22 | 0.92 ± 0.24 | 11.87 * | 0.48 ‡ | 0.80 ±0.25 | 1.27 ± 0.30 | 57.9 * | 0.68 |
| Countermovement jump (cm) | 9.3 ± 2.2 | 10.4 ± 2 | 11.28 * | 0.46 | 10.0 ± 2.3 | 12 ± 3.1 | 20.48 * | 0.60 |
| Skate jump (cm) | 159.1 ± 15.3 | 164 ± 22.6 | 3.07 | 0.08 | 157 ± 10.4 | 171.7 ± 5.7 | 9.36 * | 0.67 |
| Strength Training Group | ||||
|---|---|---|---|---|
| Pre (Mean ± STD) | Post (Mean ± STD) | Change (%) | Effect Size (η2) | |
| First 10 m 45° (s) | 2.22 ± 0.09 | 2.23 ± 0.1 | 0.45 | 0.02 |
| 20 m total 45° (s) | 3.95± 0.02 | 4.04 ± 0.36 | 2.23 | 0.13 |
| Last 10 m 45° (s) | 1.73 ± 0.11 | 1.82 ± 0.24 | 4.95 | 0.18 |
| First 10 m 180° (s) | 2.42 ± 0.14 | 2.41 ± 0.14 | −0.41 | 0.02 |
| 20 m total 180° (s) | 5.30 ± 0.27 | 5.16 ± 0.27 | −2.71 * | 0.49 |
| Last 10 m 180° (s) | 2.90 ± 0.24 | 2.77 ± 0.23 | −4.69 * | 0.36 |
| 5 m sprint (s) | 1.36 ± 0.08 | 1.33 ± 0.09 | −2.21 | 0.32 |
| 10 m sprint (s) | 2.24 ± 0.11 | 2.21 ± 0.13 | −1.34 | 0.23 |
| 20 m sprint (s) | 3.80 ± 0.2 | 3.72 ± 0.2 | −2.11 * | 0.51 |
| 30 m sprint (s) | 5.31 ± 0.33 | 5.19 ± 0.27 | −2.26 * | 0.56 |
| Braking power (W/Kg) | −10.29 ± 1.98 | −10.25 ± 2.03 | 0.39 | <0.01 |
| Braking Force (N/Kg) | −2.9 ± 0.76 | −2.74 ± 0.86 | −5.52 | 0.01 |
| Plyometric Training Group | ||||
| Pre (Mean ± STD) | Post (Mean ± STD) | Change (%) | Effect Size (η2) | |
| First 10 m 45° (s) | 2.24 ± 0.10 | 2.23 ± 0.07 | −0.45 | 0.02 |
| 20 m total 45° (s) | 3.99 ± 0.19 | 3.97 ± 0.15 | −0.5 | 0.01 |
| Last 10 m 45° (s) | 1.75 ± 0.12 | 1.75 ± 0.11 | 0 | <0.01 |
| First 10 m 180° (s) | 2.41 ± 0.09 | 2.41 ± 0.12 | 0 | 0.01 |
| 20 m total 180° (s) | 5.31 ± 0.25 | 5.24 ± 0.23 | −1.34 | 0.06 |
| Last 10 m 180° (s) | 2.91 ± 0.27 | 2.85 ±0.17 | −2.11 | 0.30 |
| 5 m sprint (s) | 1.37 ± 0.06 | 1.35 ± 0.08 | −1.46 | 0.19 |
| 10 m sprint (s) | 2.27 ± 0.11 | 2.21 ± 0.10 | −2.64 | 0.30 |
| 20 m sprint (s) | 3.79 ± 0.15 | 3.74 ± 0.17 | −1.32 | 0.29 |
| 30 m sprint (s) | 5.32 ± 0.22 | 5.21 ± 0.23 | −2.07 * | 0.57 |
| Braking power (W/Kg) | −9.65 ± 2.46 | −10.49 ± 1.53 | 8.7 | 0.24 |
| Braking Force (N/Kg) | −3.01 ± 0.65 | −3.23 ± 0.42 | 7.3 | 0.22 |
| Strength Training Group | Plyometric Training Group | |||||||
|---|---|---|---|---|---|---|---|---|
| Pre | Post | Change (%) | Effect Size (η2) | Pre | Post | Change (%) | Effect Size (η2) | |
| Peak velocities (m/s) | ||||||||
| 30 m print | 6.79 ± 0.5 | 6.9 ± 0.4 | 1.62 * | 0.44 | 6.75 ± 0.32 | 6.89 ± 31.7 | 2.07 * | 0.45 |
| 180° | 5.26 ± 0.3 | 5.4 ± 0.32 | 2.66 * | 0.70 | 5.23 ± 0.17 | 5.29 ± 0.27 | 1.15 | 0.11 |
| Contact time (ms) | ||||||||
| 30 m sprint | 169.7 ± 17.8 | 167.5 ± 19.4 | −0.89 | 0.07 | 175.6 ± 10.7 | 168.3 ± 13.2 | −4.16 * | 0.49 |
| 180° | 197.5 ± 22.2 | 195.8 ± 21 | −0.86 | 0.02 | 201.3 ± 14.14 | 201.25 ± 11 | −0.02 | <0.01 |
| Flight time (ms) | ||||||||
| 30 m sprint | 100.7 ± 13.2 | 99.6 ± 12.6 | −1.09 | 0.01 | 102 ± 9.18 | 101.9 ± 107.9 | −0.15 | <0.01 |
| 180° | 67.8 ± 15.1 | 66.2 ± 15 | −2.36 | 0.03 | 65.42 ± 70.63 | 70.63 ± 14.69 | 7.96 | 0.15 |
| Step length (m) | ||||||||
| 30 m sprint | 1.56 ± 0.11 | 1.58 ± 0.13 | 1.28 | 0.02 | 1.65 ± 0.11 | 1.59 ± 0.08 | −3.64 | 0.27 |
| 180° | 1.22 ± 0.11 | 1.22 ± 0.05 | 0 | 0.01 | 1.21 ± 0.06 | 1.23 ± 0.09 | 1.79 | 0.04 |
| Step frequency (n/time) | ||||||||
| 30 m sprint | 3.78 ± 0.31 | 3.81 ± 0.33 | 0.79 | 0.05 | 3.67 ± 0.11 | 3.78 ± 0.24 | 3 | 0.28 |
| 180° | 3.79 ± 0.32 | 3.87 ± 0.3 | 2.11 | 0.16 | 3.75 ± 0.17 | 3.73 ± 0.23 | −0.53 | 0.03 |
| Time to pivot (ms) | ||||||||
| 180° | 1116.5 ± 191.9 | 1005.4 ± 100.4 | −9.95 | 0.23 | 1131.5 ± 187.5 | 9995.2 ± 142.3 | −12.05 | 0.10 |
Publisher’s Note: MDPI stays neutral with regard to jurisdictional claims in published maps and institutional affiliations. |
© 2022 by the authors. Licensee MDPI, Basel, Switzerland. This article is an open access article distributed under the terms and conditions of the Creative Commons Attribution (CC BY) license (https://creativecommons.org/licenses/by/4.0/).
Share and Cite
Falch, H.N.; Haugen, M.E.; Kristiansen, E.L.; van den Tillaar, R. Effect of Strength vs. Plyometric Training upon Change of Direction Performance in Young Female Handball Players. Int. J. Environ. Res. Public Health 2022, 19, 6946. https://0-doi-org.brum.beds.ac.uk/10.3390/ijerph19116946
Falch HN, Haugen ME, Kristiansen EL, van den Tillaar R. Effect of Strength vs. Plyometric Training upon Change of Direction Performance in Young Female Handball Players. International Journal of Environmental Research and Public Health. 2022; 19(11):6946. https://0-doi-org.brum.beds.ac.uk/10.3390/ijerph19116946
Chicago/Turabian StyleFalch, Hallvard Nygaard, Markus Estifanos Haugen, Eirik Lindset Kristiansen, and Roland van den Tillaar. 2022. "Effect of Strength vs. Plyometric Training upon Change of Direction Performance in Young Female Handball Players" International Journal of Environmental Research and Public Health 19, no. 11: 6946. https://0-doi-org.brum.beds.ac.uk/10.3390/ijerph19116946