
Consequences of Social and Environmental Corporate Responsibility Practices: Managers’ Perception in Mozambique


Abstract
:1. Introduction
2. Theoretical Framework
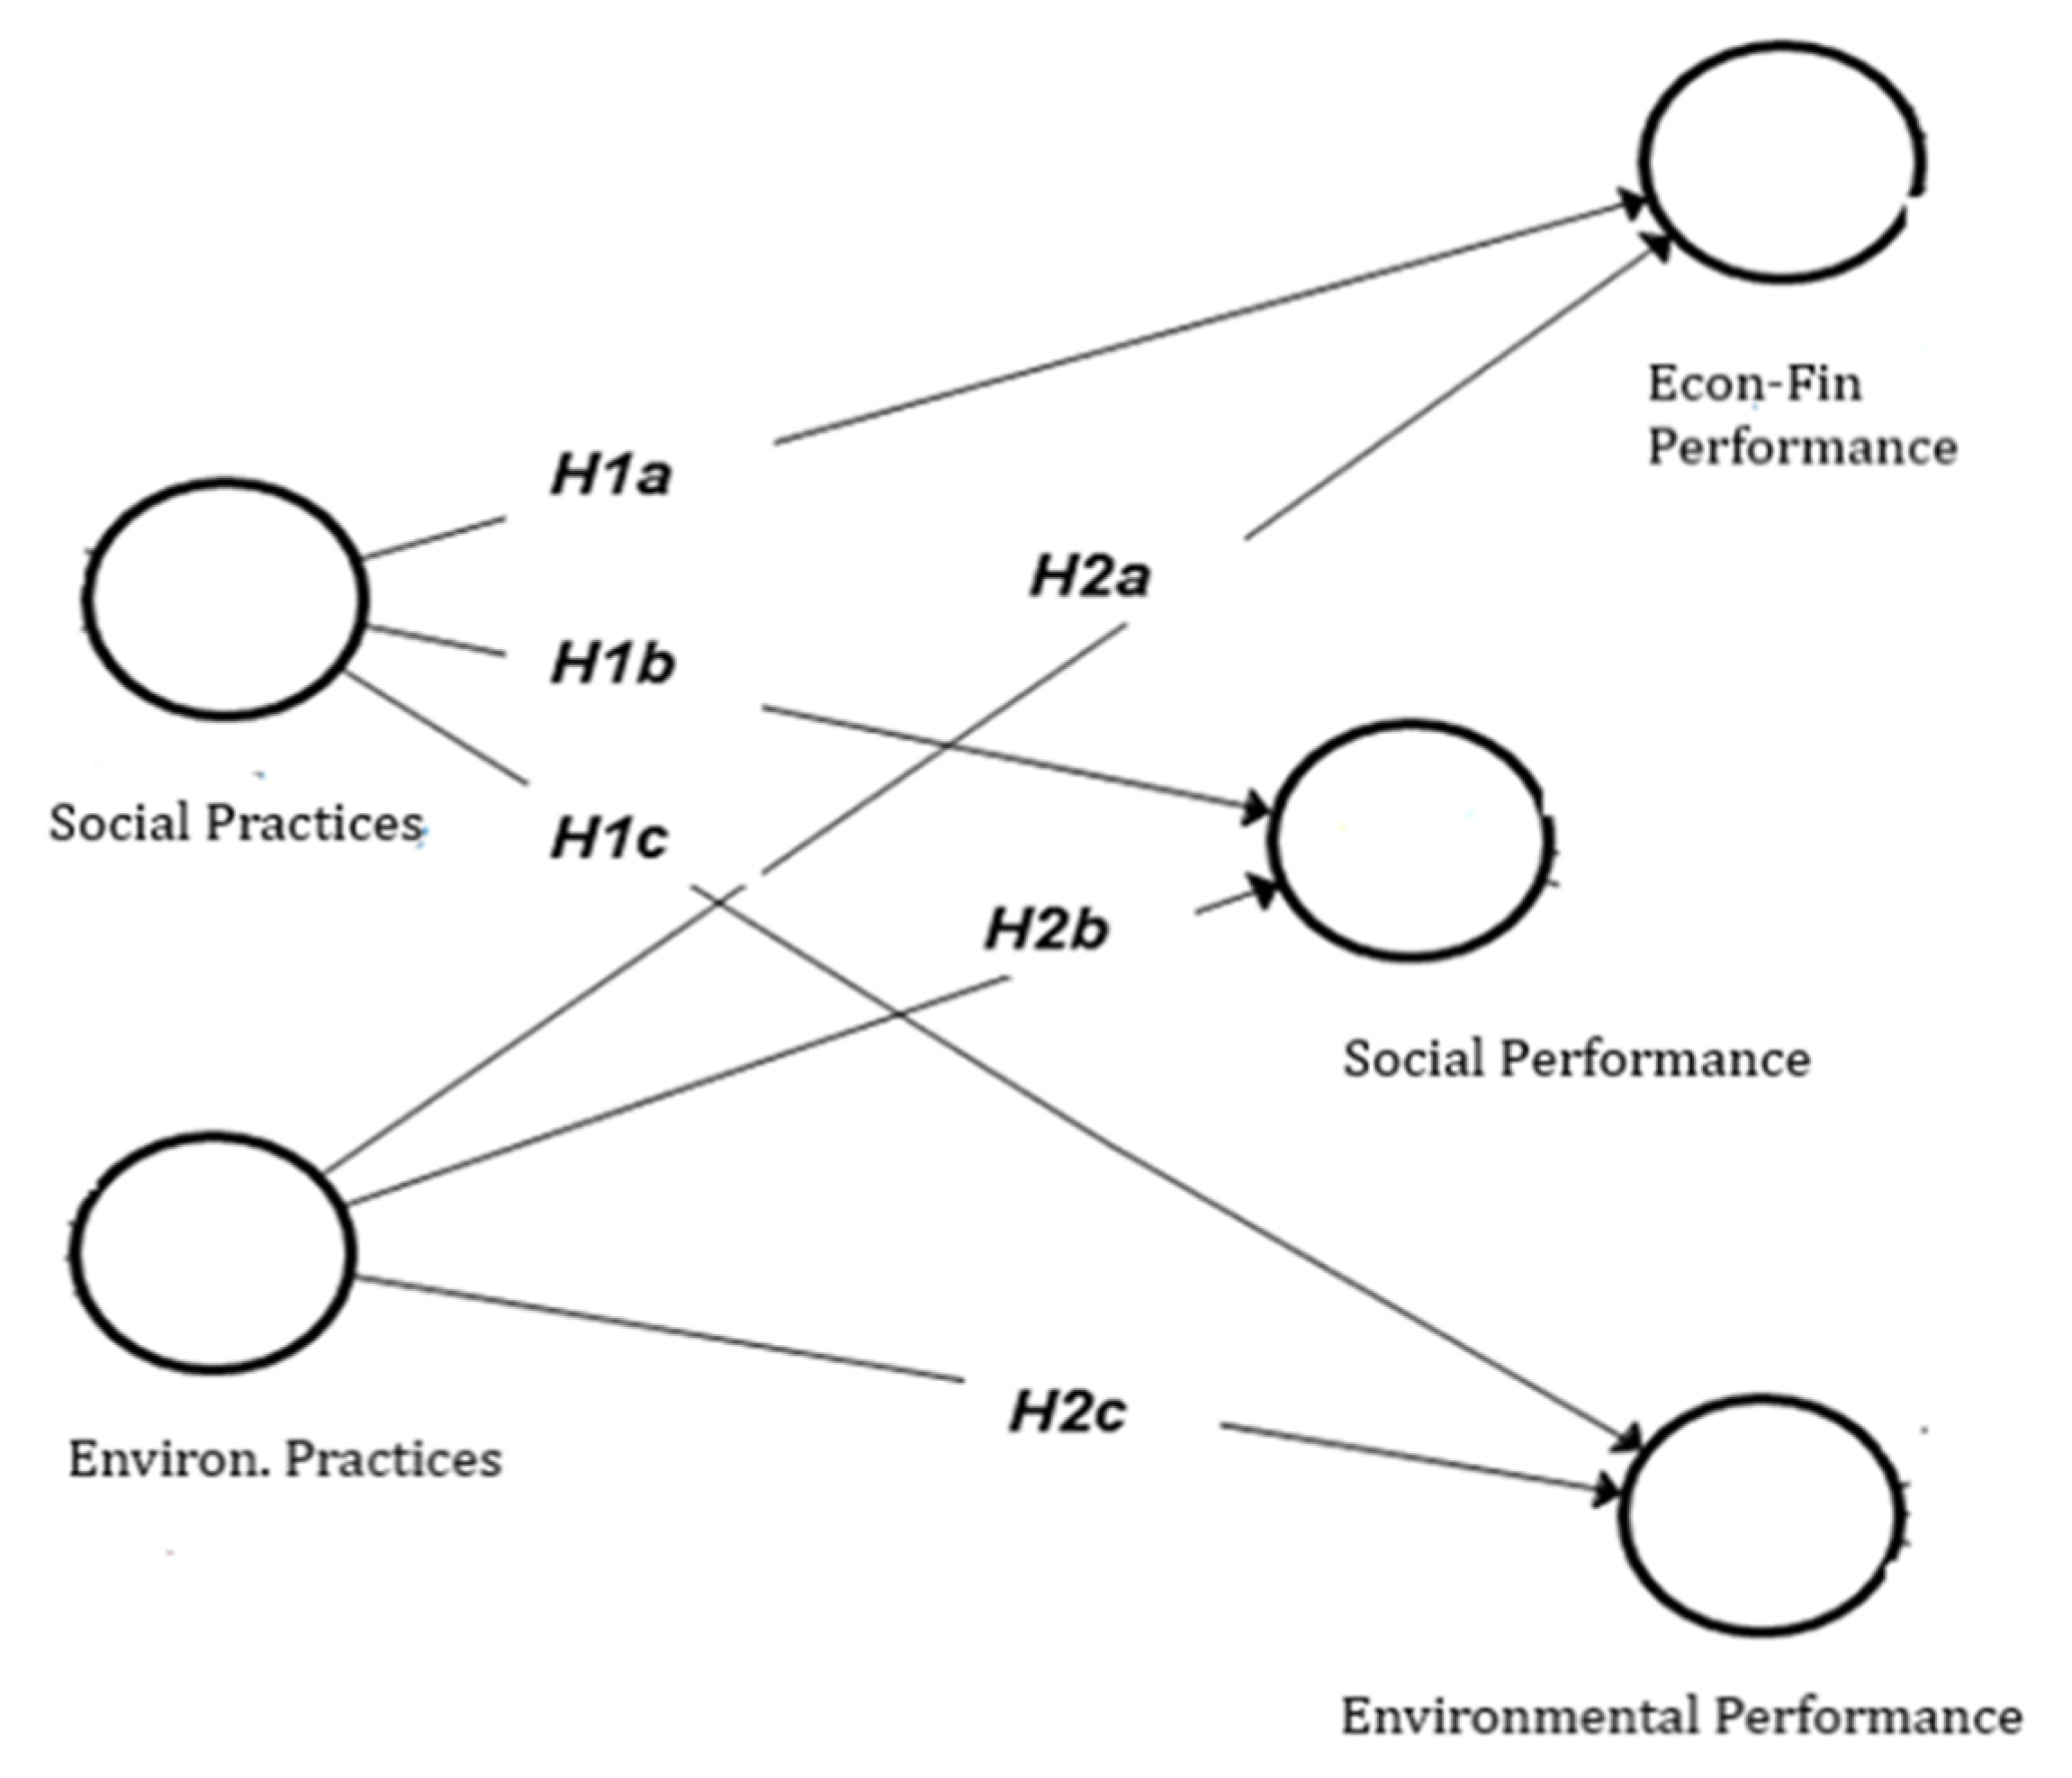
3. Literature Review and Hypothesis Development
4. Methodological Framework
- What do you think the company should gather as an indicator for compliance with CSR?
- 2.
- In your opinion, what benefit can a company derive from practicing social and environmental responsibility actions?
5. Results
5.1. Descriptive Analysis and Internal Consistency
- The company must develop employee skills;
- The company must recruit employees with different socio-demographic characteristics (i.e., gender, age, race, disabled);
- The company must ensure the employees’ quality of life item;
- The company should promote actions to ensure employee satisfaction at work.
- The company should spend time and money on community projects and charities;
- The company should have family support policies.
5.2. Factor Analysis: Principal Components
5.3. Structural Equation Modelling
5.3.1. Validity of Model Convergence
5.3.2. Discriminant Validity
5.3.3. Discriminant Validity
6. Conclusions
Author Contributions
Funding
Informed Consent Statement
Data Availability Statement
Acknowledgments
Conflicts of Interest
Appendix A

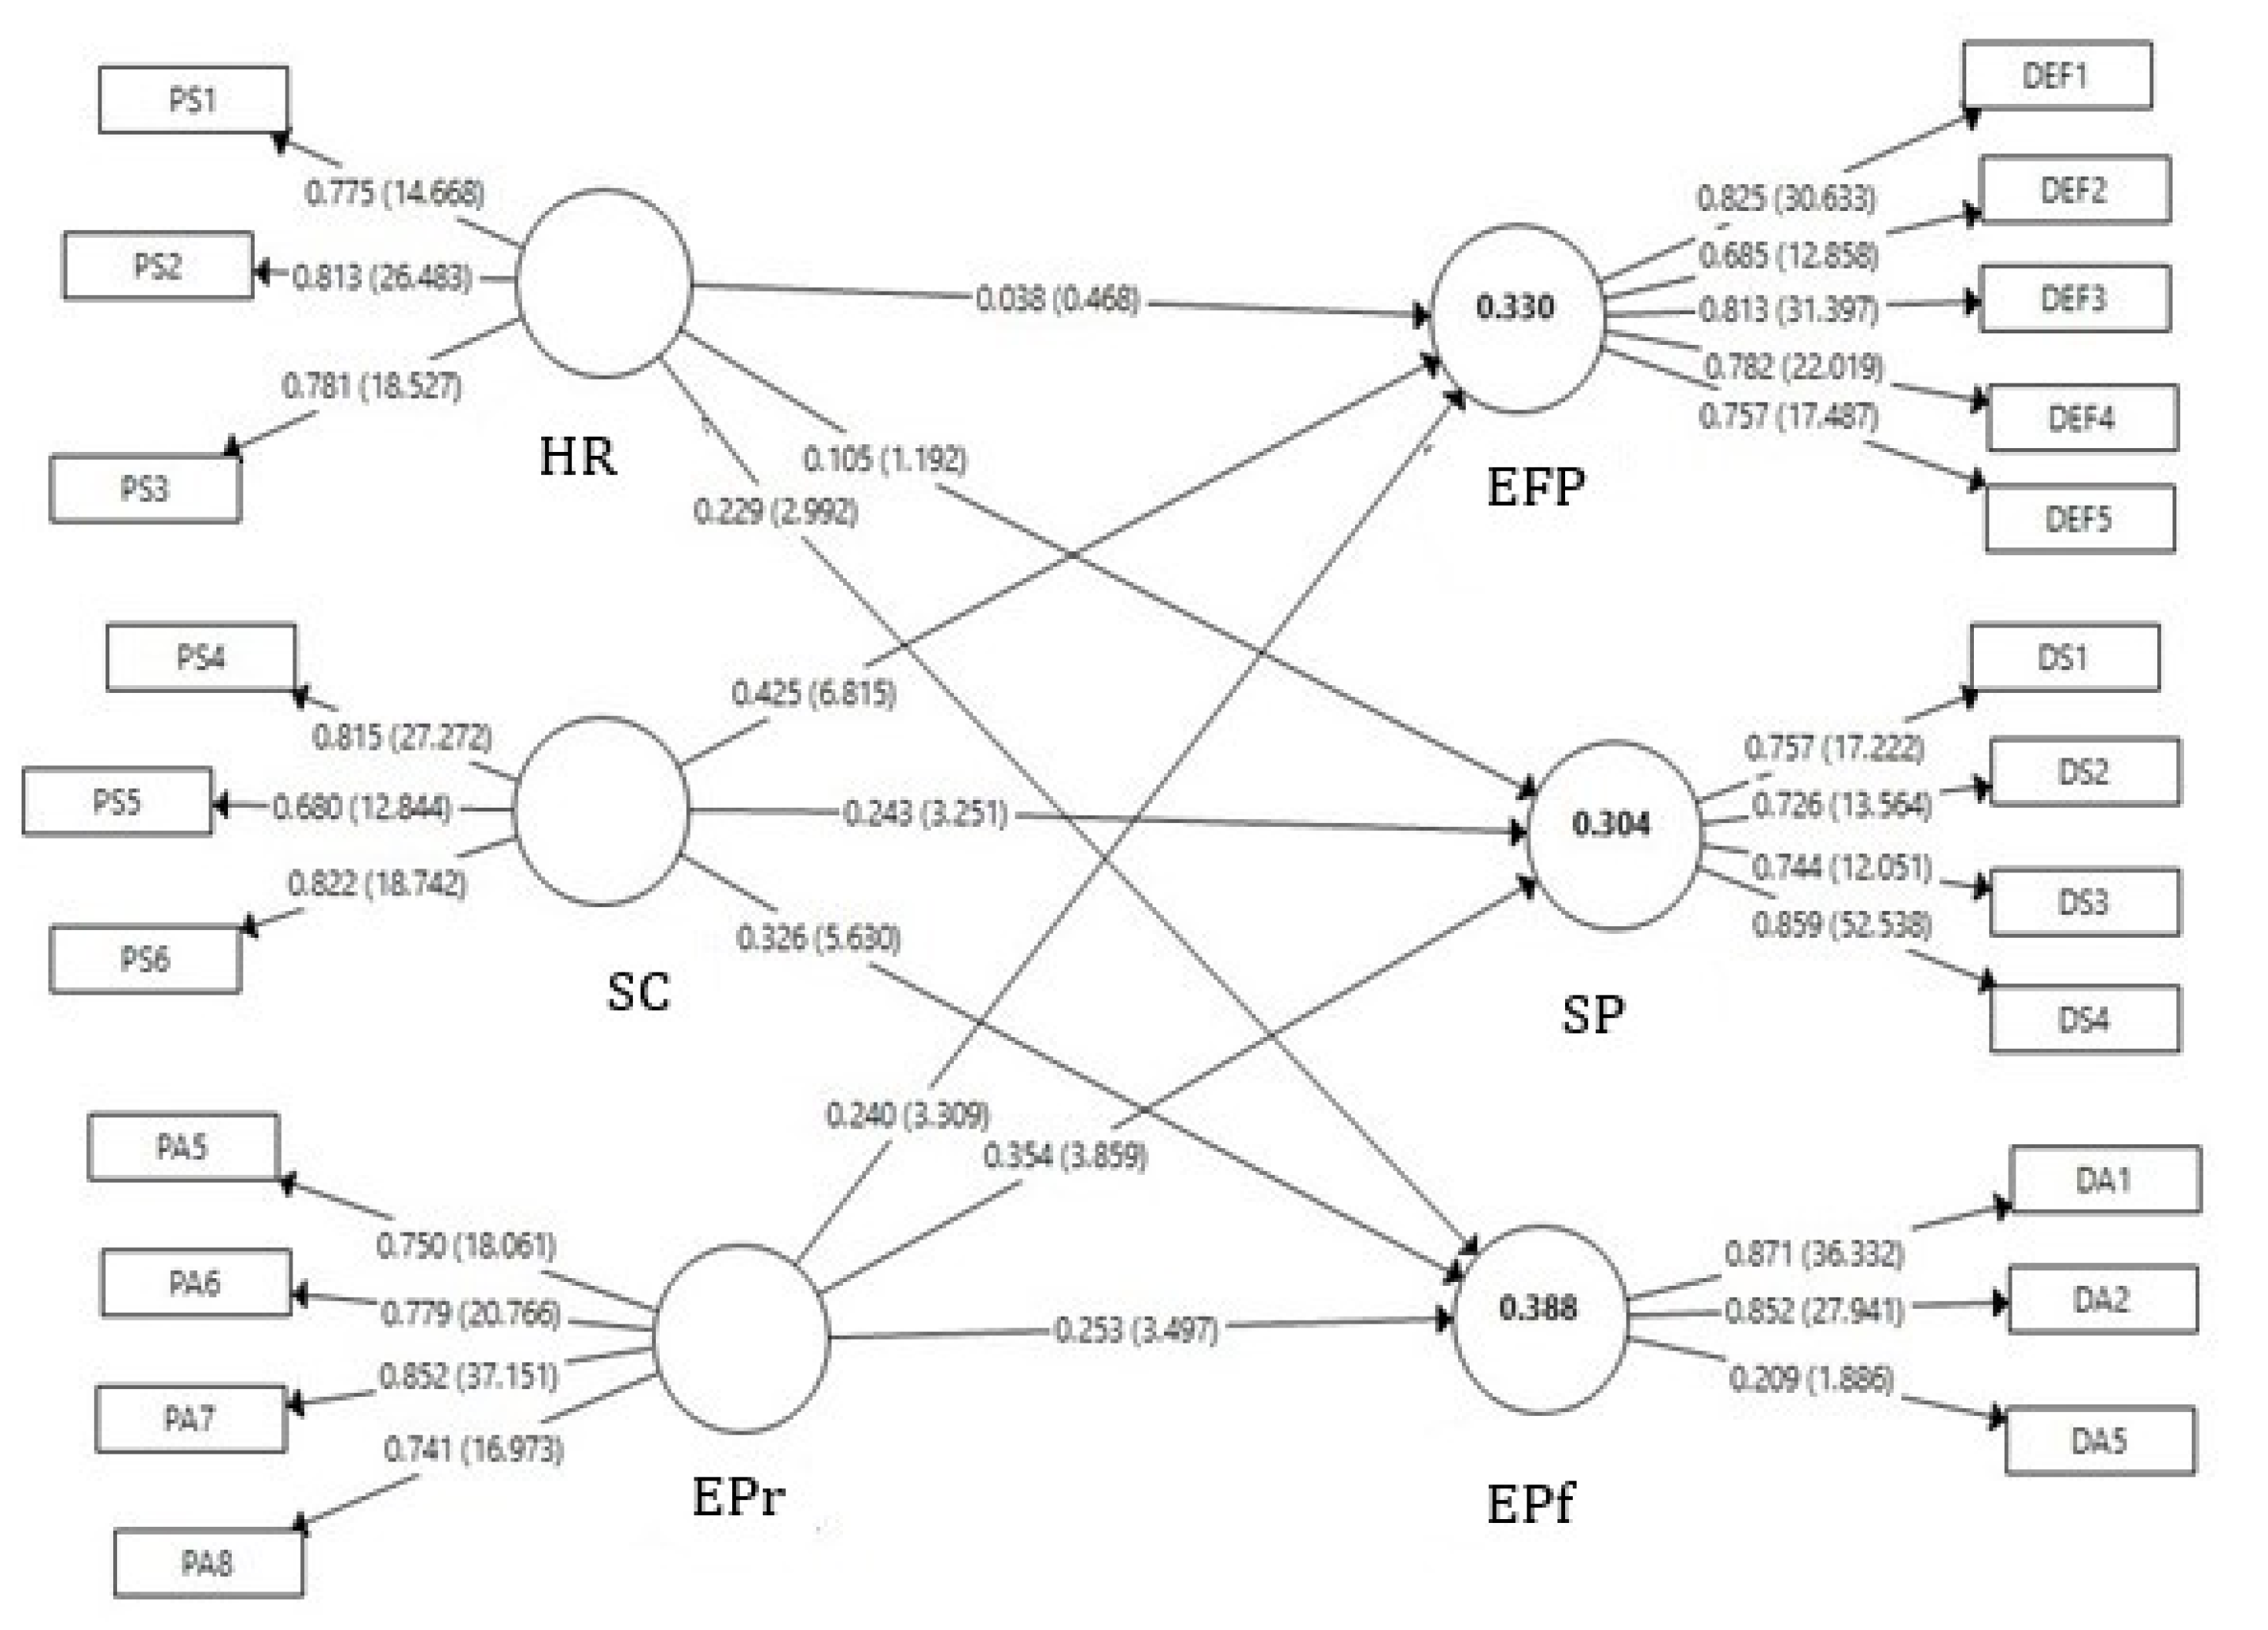
| Variable Indicators | Codes | Factorial | Loadings | t-Student |
|---|---|---|---|---|
| Social Responsibility Practices | Quality of life of employees | PS1 | 0.775 | 14.668 |
| Competence development of employees | PS2 | 0.813 | 26.483 | |
| Employee satisfaction | PS3 | 0.781 | 18.527 | |
| Social projects | PS4 | 0.815 | 27.272 | |
| Social Inclusion | PS5 | 0.680 | 12.844 | |
| Family support | PS6 | 0.822 | 18.742 | |
| Environmental Responsibility Practices | Energy and water savings | PA5 | 0.750 | 18.061 |
| Sorting solid waste | PA6 | 0.779 | 20.766 | |
| Environmental awareness | PA7 | 0.852 | 37.151 | |
| Environmental management system | PA8 | 0.741 | 16.973 | |
| Economic and financial performance | Low production costs | DEF1 | 0.825 | 30.633 |
| Energy and water savings | DEF2 | 0.685 | 12.858 | |
| It allows for low waste treatment rates | DFE3 | 0.813 | 31.397 | |
| Improves return on investment | DFE4 | 0.782 | 22.019 | |
| Increases the value of the company’s capital in the medium and long term | DFE5 | 0.757 | 17.487 | |
| Social Performance | Improves the well-being of stakeholders | DS1 | 0.757 | 17.222 |
| Improves the safety and health of the local community | DS2 | 0.726 | 13.564 | |
| Improve workers’ safety and health in the workplace | DS3 | 0.744 | 12.051 | |
| Improves information and reduces complaints from all stakeholders | DS4 | 0.859 | 52.538 | |
| Environmental Performance | Reduces solid waste production | DA1 | 0.871 | 36.332 |
| Decreases consumption of toxic/hazardous/harmful materials | DA2 | 0.852 | 27.941 | |
| Increases the use of renewable resources | DA5 | 0.209 | 1.886 |
| 1 | The Institute for the Promotion of Small and Medium Enterprises (IPEME) is the Mozambican public institution whose mission is to encourage the establishment, consolidation and development of small enterprises in Mozambique. |
References
- Albasu, Joseph, and Jerome Nyameh. 2017. Relevance of Stakeholders Theory, Organizational Identity Theory and Social Exchange Theory to Corporate Social Responsibility and Employees Performance in the Commercial Banks in Nigeria. International Journal of Business, Economics and Management 4: 95–105. [Google Scholar] [CrossRef] [Green Version]
- Allouche, José, and Patrice Laroche. 2005. A Meta-analytical investigation of the relationship between corporate social and financial performance. Revue de Gestion Des Ressources Humaines 57: 18. [Google Scholar]
- Arrow, Keneth J. 1997. Social Responsibility and Economic Efficiency. (A revised version of K. J. Arrow’s 1972 Carl Snyder Memorial Lecture). In Ethics in Business and Economics. Edited by Thomas Donaldson and Thomas W. Dunfee. Aldershot: Ashgate-Dartmouth, vol. 1, pp. 137–51. [Google Scholar]
- Bagur-Femenias, Llorenç, Josep Llach, and María del Mar Alonso-Almeida. 2013. Is the adoption of environmental practices a strategical decision for small service companies? An empirical approach. Management Decision 51: 41–62. [Google Scholar] [CrossRef]
- Baldarelli, Maria-Gabriella, Mara Del Baldo, and Ninel Nesheva-Kiosseva. 2017. Environmental Accounting and Reporting. Cham: Springer International Publishing AG. [Google Scholar] [CrossRef]
- Barbieri, José Carlos, and Jorge Emanuel Cajazeira. 2012. Responsabilidade Social, Empresarial e Empresa Sustentável. Da Teoria à Prática, 2nd ed. São Paulo: Saraiva. [Google Scholar]
- Benkraiem, Ramzi, Sabri Boubaker, and Asif Saeed. 2021. How does corporate social responsibility engagement affect the information content of stock prices? Managerial and Decision Economics. [Google Scholar] [CrossRef]
- Boubaker, Sabri, Alexis Cellier, Riadh Manita, and Asif Saeed. 2020. Does corporate social responsibility reduce financial distress risk? Economic Modelling 91: 835–51. [Google Scholar] [CrossRef]
- Boubaker, Sabri, Lamia Chourou, Darlene Himick, and Samir Saadi. 2017. It’s about time! The influence of institutional investment horizon on corporate social responsibility. Thunderbird International Business Review 59: 571–94. [Google Scholar] [CrossRef]
- Carneiro, Celia Maria Braga, and Alisson Victor Moreira Rodrigues. 2014. The determinants of Corporate Social Responsibility commitment to the internal public of companies. XVI ENGEMA. Available online: https://www.engema.org.br/XVIENGEMA/452.pdf (accessed on 13 May 2021).
- Carroll, Archie B. 2008. A History of Corporate Social Responsibility: Concepts and Practices. In The Oxford Handbook of Corporate Social Responsibility. Oxford: Oxford University Press, pp. 1–20. [Google Scholar] [CrossRef]
- da Silva Faria, Maria José. 2015. Responsabilidade Social Empresarial—Relato e Análise Económica e Financeira. Porto: Vida Económica. [Google Scholar]
- Delautre, Guillaume, and Bruno Abriata. 2018. Corporate social responsibility: Exploring determinants and complementarities. ILO Research Department Working Paper. No. 38. Available online: http://englishbulletin.adapt.it/wp-content/uploads/2019/03/wcms_654735.pdf (accessed on 13 May 2021).
- Donaldson, Thomas, and Lee E. Preston. 1995. The Stakeholder Theory of the Corporation: Concepts, Evidence, and Implications. Academy of Management Review 20: 65–91. [Google Scholar] [CrossRef]
- Elliott, W. Brooke, Kevin E. Jackson, Mark E. Peecher, and Brian J. White. 2014. The Unintended Effect of Corporate Social Responsibility Performance on Investors’ Estimates of Fundamental Value. The Accounting Review 89: 275–302. [Google Scholar] [CrossRef] [Green Version]
- Fernandes, Nuno Miguel A. 2010. A Responsabilidade Social das Empresas: A Dimensão Interna: Uma Ferramenta para a Criação de Valor [ISCAL—Instituto Superior de Contabilidade e Administração de Lisboa]. Available online: http://hdl.handle.net/10400.21/91 (accessed on 13 May 2021).
- Fornell, Claes, and David F. Larcker. 1981. Evaluating Structural Equation Models with Unobservable Variables and Measurement Error. Journal of Marketing Research 18: 39–50. [Google Scholar] [CrossRef]
- Freeman, R. Edward. 1984. Strategic Management: A Stakeholder Approach. Boston: Pitman. [Google Scholar]
- Friedman, Milton. 1962. Capitalism and Freedom. Chicago: University of Chicago Press. [Google Scholar]
- Friedman, Milton. 1970. The Social Responsibility of Business is to Increase Its Profits. The New York Times Magazine. September 13. Available online: https://www.nytimes.com/1970/09/13/archives/a-friedman-doctrine-the-social-responsibility-of-business-is-to.html (accessed on 13 May 2021).
- Gonçalves, Tiago, Cristina Gaio, and Eva Costa. 2020. Committed vs. opportunistic corporate and social responsibility reporting. Journal of Business Research 115: 417–27. [Google Scholar] [CrossRef]
- Gonçalves, Tiago, Cristina Gaio, and André Ferro. 2021a. Corporate social responsibility and earnings management: Moderating impact of economic cycles and financial performance. Sustainability 13: 9969. [Google Scholar] [CrossRef]
- Gonçalves, Tiago, Diego Pimentel, and Cristina Gaio. 2021b. Risk and Performance of European Green and Conventional Funds. Sustainability 13: 4226. [Google Scholar] [CrossRef]
- Gray, Rob. 2013. Back to basics: What do we mean by environmental (and social) accounting and what is it for?-A reaction to Thornton. Critical Perspectives on Accounting 24: 459–68. [Google Scholar] [CrossRef]
- Hahn, Rudiger, and Michael Kühnen. 2013. Determinants of sustainability reporting: A review of results, trends, theory, and opportunities in an expanding field of research. Journal of Cleaner Production 59: 5–21. [Google Scholar] [CrossRef]
- Hair, Joseph F., William C. Black, Bill J. Babi, Rolph E. Anderson, and Ronald L. Tatham. 2009. Multivariate Data Analysis. Porto Alegre: Bookman Publisher. [Google Scholar]
- Hair, Joseph F., G. Thomas M. Hult, Christian Ringle, and Marko Sarstedt. 2014. A Primer on Partial Least Squares Structural Equation Modeling (PLS-SEM). Thousand Oaks: Sage Pub. [Google Scholar]
- Hong, Harrison, Jeffrey Kubik, and Jose Scheinkman. 2012. Financial Constraints on Corporate Goodness. Cambridge: National Bureau of Economic Research. [Google Scholar] [CrossRef]
- Huang, Xiaobei B., and Luke Watson. 2015. Corporate social responsibility research in accounting. Journal of Accounting Literature 34: 1–16. [Google Scholar] [CrossRef]
- Hummel, Katrin, and Christian Schlick. 2016. The relationship between sustainability performance and sustainability disclosure—Reconciling voluntary disclosure theory and legitimacy theory. Journal of Accounting and Public Policy 35: 455–76. [Google Scholar] [CrossRef] [Green Version]
- Hunjra, Ahmed I., Sabri Boubaker, Murugesh Arunachalam, and Asad Mehmood. 2021. How does CSR mediate the relationship between culture, religiosity and firm performance? Finance Research Letters 39: 101587. [Google Scholar] [CrossRef]
- Karabolad, Natalia. 2008. The Paths and Challenges for Global Governance and Social and Environmental Responsibility as a Tool for Sustainability. In Responsabilidade Social nas Empresas: A Contribuição das Universidades. Edited by Bruno Gaspar. São Paulo: Peirópolis, vol. 6. [Google Scholar]
- Khoury, George, Janet Rostami, and Peri Lynn Turnbull. 1999. Corporate Social Responsibility: Turning Words into Action. Ottawa: The Conference Board of Canada. [Google Scholar]
- Kolk, Ans, and Jonatan Pinkse. 2008. A perspective on multinational enterprises and climate change: Learning from “an inconvenient truth”? Journal of International Business Studies 39: 1359–78. [Google Scholar] [CrossRef]
- Liu, Bai, Tao Ju, and Simon S. Gao. 2021. The combined effects of innovation and corporate social responsibility on firm financial risk. Journal of International Financial Management & Accounting 32: 283–310. [Google Scholar]
- Lu, Yingjun, and Indra Abeysekera. 2021. Do investors and analysts value strategic corporate social responsibility disclosures? Evidence from China. Journal of International Financial Management & Accounting 32: 147–81. [Google Scholar]
- Lucato, Wagner C., Jose Carlos da Silva Santos, and Athos Paulo T. Pacchini. 2018. Measuring the sustainability of a manufacturing process: A conceptual framework. Sustainability 10: 81. [Google Scholar] [CrossRef] [Green Version]
- Margolis, Joshua D., Hillary Anger Elfenbein, and James P. Walsh. 2009. Does It Pay to Be Good...and Does It Matter? A Meta-Analysis of the Relationship between Corporate Social and Financial Performance. Available online: https://ssrn.com/abstract=1866371 (accessed on 13 May 2021).
- Margolis, Joshua D., and James P. Walsh. 2001. Misery Loves Companies: Whither Social Initiatives by Business? Boston: Division of Research, Harvard Business School. [Google Scholar]
- Mello, Mario Fernando, and Arthur Zago Mello. 2018. An analysis of the practices of social responsibility and sustainability as strategies for industrial companies in the furniture sector: A case study. Gestao e Producao 25: 81–93. [Google Scholar] [CrossRef] [Green Version]
- Moskowitz, Milton. 1972. Choosing socially responsible stocks. Business and Society Review 1: 71–75. [Google Scholar]
- O’Brien, Robert M. 1979. The Use of Pearson’s with Ordinal Data. American Sociological Review 44: 851–57. [Google Scholar] [CrossRef]
- Parket, I. Robert, and Henry Eilbirt. 1975. The practice of business social responsibility: The underlying factors. Business Horizons 18: 5–10. [Google Scholar] [CrossRef]
- Pava, Moses L., and Joshua Krausz. 1996. The association between corporate social-responsibility and financial performance: The paradox of social cost. Journal of Business Ethics 15: 321–57. [Google Scholar] [CrossRef]
- Pinto, Inês, Cristina Gaio, and Tiago Gonçalves. 2019. Corporate governance, foreign direct investment, and bank income smoothing in African countries. International Journal of Emerging Markets 15: 670–90. [Google Scholar] [CrossRef]
- Pizzi, Simone, Maria Del Baldo, Fabio Caputo, and Andrea Venturelli. 2021. Voluntary disclosure of Sustainable Development Goals in mandatory non-financial reports: The moderating role of cultural dimension. Journal of International Financial Management & Accounting. [Google Scholar] [CrossRef]
- Pondeville, Sophie, Valerie Swaen, and Yves De Rongé. 2013. Environmental management control systems: The role of contextual and strategic factors. Management Accounting Research 24: 317–32. [Google Scholar] [CrossRef]
- Porter, Michael E., and Mark R. Kramer. 2006. The link between competitive Advantage and corporate social responsibility. Harvard Business Review 84: 78–92. [Google Scholar]
- Preston, Lee E., and Douglas P. O’Bannon. 1997. The Corporate Social-Financial Performance Relationship: A Typology and Analysis. Business & Society 36: 419–29. [Google Scholar] [CrossRef]
- Ramesh, G. 2010. Mainstreaming an Unorganized Industry: The Case of Suguna Poultry. Vikalpa 35: 35–48. [Google Scholar] [CrossRef] [Green Version]
- Ramírez, Tulio. 2010. Cómo hacer un proyecto de investigación. Caracas: Panapo. [Google Scholar]
- Ringle, Christian M., Dirceu Da Silva, and Diogenes de Souza Bido. 2014. Modelagem de Equações Estruturais com Utilização do Smartpls. Revista Brasileira de Marketing 13: 56–73. [Google Scholar] [CrossRef]
- Russo, Michael V., and Paul A. Fouts. 1997. A resouce-perspective on corporate environment perfomance and profitability. Academy of Management Journal 40: 534–59. Available online: https://www.researchgate.net/publication/245040725_Russo_M_V_P_A_Fouts_1997_A_Resource-Based_Perspective_on_Corporate_Environmental_Performance_and_Profitability_Academy_of_Management_Journal (accessed on 13 May 2021).
- Sarstedt, Marko, Jorg Henseler, and Christian M. Ringle. 2011. Multigroup Analysis in Partial Least Squares (PLS) Path Modeling: Alternative Methods and Empirical Results. Measurement and Research Methods in International Marketing 22: 195–218. [Google Scholar] [CrossRef]
- Servaes, Henri, and Ane Tamayo. 2013. The Impact of Corporate Social Responsibility on Firm Value: The Role of Customer Awareness. Management Science 59: 1045–61. [Google Scholar] [CrossRef] [Green Version]
- Stanaland, Andrea J. S., May O. Lwin, and Patrick E. Murphy. 2011. Consumer Perceptions of the Antecedents and Consequences of Corporate Social Responsibility. Journal of Business Ethics 102: 47–55. [Google Scholar] [CrossRef]
- Tabachnick, Barbara G., and Linda S. Fidell. 2007. Using Multivariate Statistics, 5th ed. Boston: Pearson/Allyn & Bacon. [Google Scholar]
- Tench, Ralph, Ryan Bowd, and Brian Jones. 2007. Perceptions and perspectives: Corporate social responsibility and the media. Journal of Communication Management 11: 348–70. [Google Scholar] [CrossRef]
- Tenório, Fernando G. 2006. Responsabilidade Social Empresarial: Teoria E Prática, 2nd ed. Rio de Janeiro: Editora FGV. [Google Scholar]
- Tsoutsoura, Margarita. 2004. Corporate Social Responsibility and Financial Performance. Berkeley: Center for Responsible Business, Available online: https://escholarship.org/uc/item/111799p2 (accessed on 13 May 2021).
- UNDP. 2015. The Sustainable Development Goals. Available online: http://www.pnud.org.br/ods.aspx (accessed on 13 May 2021).
- Van Beurden, Pieter, and Tobias Gössling. 2008. The worth of values—A literature review on the relation between corporate social and financial performance. Journal of Business Ethics 82: 407–24. [Google Scholar] [CrossRef] [Green Version]
- Velinov, Emil, and Simona Cincalova. 2021. Corporate Social Responsibility and Internationalization of Czech Transport Enterprises. Hradec Economic Days. [Google Scholar] [CrossRef]
- Wong, Ken Kwong-Kay. 2013. Partial Least Squares Structural Equation Modeling (PLS-SEM) Techniques Using SmartPLS. Marketing Bulletin 24: 1–32. [Google Scholar]
- Wren, Daniel A. 2005. History of Management Thought, 5th ed. Hoboken: John Wiley and Sons, Inc. [Google Scholar]


| Variable | Reference | Indicators | Codes |
|---|---|---|---|
| Social Responsibility Practices | Hummel and Schlick (2016) Bagur-Femenias et al. (2013) | Quality of life of employees | PS1 |
| Competence development of employees | PS2 | ||
| Employee satisfaction | PS3 | ||
| Social projects | PS4 | ||
| Social Inclusion | PS5 | ||
| Family support | PS6 | ||
| Environmental Responsibility Practices | Bagur-Femenias et al. (2013) Gray (2013) | Environmental policies | PA1 |
| Eco-friendly products | PA2 | ||
| Environmental Integration in the Marketing Plan | PA3 | ||
| Reduction of pollution | PA4 | ||
| Energy and water savings | PA5 | ||
| Sorting solid waste | PA6 | ||
| Environmental awareness | PA7 | ||
| Environmental management system | PA8 | ||
| Economic and Financial Performance | Fernandes (2010) Tsoutsoura (2004) | Low production costs | DEF1 |
| Energy and water savings | DEF2 | ||
| It allows for low waste treatment rates | DEF3 | ||
| Improves return on investment | DEF4 | ||
| Increases the value of the company’s capital in the medium and long term | DEF5 | ||
| Social Performance | Khoury et al. (1999) Allouche and Laroche (2005) | Improves the well-being of stakeholders | DS1 |
| Improves the safety and health of the local community | DS2 | ||
| Improves the health and safety of workers on site | DS3 | ||
| Improves information and reduces complaints | DS4 | ||
| Environmental Performance | Baldarelli et al. (2017) Donaldson and Preston (1995) Margolis and Walsh (2001) | Reduces solid waste production | DA1 |
| Decreases consumption of toxic/hazardous/harmful materials | DA2 | ||
| Reduces energy and water consumption | DA3 | ||
| Improves environmental awareness | DA4 | ||
| Increases the use of renewable resources | DA5 |
| Cronbach’s Alpha: α = 0.735 | |||||
|---|---|---|---|---|---|
| Survey Indicator | Code | Min | Max | Avg. | Std. Dev. |
| 1. The company shall ensure the Employees’ quality of life | PS1 | 2 | 5 | 4.29 | 0.648 |
| 2. The company must develop employee skills | PS2 | 1 | 5 | 4.33 | 0.680 |
| 3. The company shall promote actions to ensure employee satisfaction at work | PS3 | 1 | 5 | 4.16 | 0.815 |
| 4. The company should spend time and money on community projects and charities | PS4 | 1 | 5 | 3.85 | 0.957 |
| 5. The company should recruit employees with different socio-demographic characteristics (gender, age, race, disabled) | PS5 | 1 | 5 | 4.30 | 0.841 |
| 6. The company should have family support policies | PS6 | 1 | 5 | 3.93 | 0.931 |
| Cronbach’s Alpha: α = 0.818 | |||||
|---|---|---|---|---|---|
| Survey Indicator | Code | Min | Max | Avg. | Std. Dev. |
| 1. The company must have clear and concrete policies | PA1 | 1 | 5 | 4.34 | 0.762 |
| 2. The company should include in budget planning the purchase of environmentally responsible goods and services (environmentally friendly products) | PA2 | 1 | 5 | 3.96 | 0.819 |
| 3. The company should integrate in marketing and culture programs, environmental management plans, the environmental vision and mission | PA3 | 2 | 5 | 4.11 | 0.735 |
| 4. The company should reduce the use of products that harm the environment | PA4 | 2 | 5 | 4.37 | 0.584 |
| 5. The company should implement energy and water saving processes | PA5 | 2 | 5 | 4.44 | 0.631 |
| 6. The company should promote the selection of solid waste | PA6 | 2 | 5 | 4.23 | 0.679 |
| 7. The company should promote environmental awareness | PA7 | 1 | 5 | 4.34 | 0.669 |
| 8. The company must have an environmental management system | PA8 | 1 | 5 | 4.22 | 0.739 |
| Cronbach’s Alpha: α = 0.832 | |||||
|---|---|---|---|---|---|
| Survey Indicator | Code | Min | Max | Avg. | Std. Dev. |
| 1. Low production costs | DEF1 | 1 | 5 | 3.48 | 1.180 |
| 2. Energy and water saving | DEF2 | 1 | 5 | 4.06 | 1.016 |
| 3. Allows for low waste treatment rates | DEF3 | 1 | 5 | 3.78 | 0.940 |
| 4. Improves Return on Investment | DEF4 | 1 | 5 | 3.79 | 1.083 |
| 5. Increases the value of the company’s capital in the medium and long term | DEF5 | 1 | 5 | 3.74 | 1.108 |
| Cronbach’s Alpha: α = 0.771 | |||||
|---|---|---|---|---|---|
| Survey Indicator | Code | Min | Max | Avg. | Std. Dev. |
| 1. improves the well-being of the company’s stakeholders | DS1 | 1 | 5 | 3.88 | 1.010 |
| 2. Improve the safety and health of the local community | DS2 | 1 | 5 | 4.16 | 0.839 |
| 3. Improve workers’ safety and health in the workplace | DS3 | 1 | 5 | 4.32 | 0.701 |
| 4. Improve information and reduce complaints from all stakeholders | DS4 | 1 | 5 | 4.09 | 0.880 |
| Cronbach’s Alpha: α = 0.776 | |||||
|---|---|---|---|---|---|
| Survey Indicator | Code | Min | Max | Avg. | Std. Dev. |
| 1. Reduces solid waste production | DA1 | 1 | 5 | 4.09 | 0.688 |
| 2. Decreases consumption of toxic/hazardous/harmful materials | DA2 | 1 | 5 | 4.12 | 0.712 |
| 3. Reduces energy and water consumption | DA3 | 1 | 5 | 4.17 | 0.856 |
| 4. Improves environmental awareness | DA4 | 1 | 5 | 4.25 | 0.698 |
| 5. Increases the use of renewable resources | DA5 | 1 | 5 | 4.07 | 0.758 |
| Latent Variable | DM | KMO | TEB (p-Value) | VTE | Prinicpal Components | Indicators (Code) |
|---|---|---|---|---|---|---|
| Social Practices | 0.26 | 0.719 | 0.000 | 61.831 | Human Resources Development | PS2, PS1, PS3 |
| Support to the community | PS4, PS6, PS5 | |||||
| Environmental Practices | 0.88 | 0.824 | 0.000 | Initial: 45.345 Final: 61.126 | Environmental Practices | PS5, PS6, P7, PS8 |
| Economic and Financial Performance | 0.15 | 0.813 | 0.000 | 60.208 | Economic and Financial Performance | DEF1, DEF2. DEF3, DEF4, DEF5 |
| Social Performance | 0.33 | 0.727 | 0.000 | 59.988 | Social Performance | DS4, DS2, DS1, DS3 |
| Environmental Performance | 0.31 | 0.788 | 0.000 | Initial: 51.898 Final: 65.721 | Environmental Performance | DA2, DA5, DA1 |
| Cronbach’s Alpha | Composite Reliability | Average Variance Extracted (AVE) | |
|---|---|---|---|
| Community Support | 0.664 | 0.818 | 0.601 |
| Environmental Performance | 0.495 | 0.717 | 0.509 |
| Econ-Financial Performance | 0.832 | 0.882 | 0.599 |
| Social Performance | 0.777 | 0.855 | 0.598 |
| HR Development | 0.699 | 0.832 | 0.623 |
| Environmental Practices | 0.786 | 0.862 | 0.611 |
| Community Support | Environmental Performance | Eco-Financial Performance | Social Performance | HR Development | Environmental Practices | |
|---|---|---|---|---|---|---|
| Community Support | 0.775 | |||||
| Environmental Performance | 0.521 | 0.714 | ||||
| Econ-Financial Performance | 0.533 | 0.593 | 0.774 | |||
| Social Performance | 0.424 | 0.503 | 0.636 | 0.773 | ||
| HR Development | 0.427 | 0.469 | 0.316 | 0.352 | 0.789 | |
| Environmental Practices | 0.386 | 0.471 | 0.419 | 0.490 | 0.403 | 0.782 |
| R2 | Adjusted R2 | Classification | |
|---|---|---|---|
| Environmental Performance | 0.396 | 0.388 | Large effect |
| Eco-Financial Performance | 0.339 | 0.330 | Large effect |
| Social Performance | 0.313 | 0.304 | Large effect |
| Relationship between Variables | T Statistics | p Values |
|---|---|---|
| Social Practices of Community Support -> Eco-Financial Performance | 6.815 | 0.000 |
| Social Practices of Community Support -> Social Performance | 3.251 | 0.001 |
| Social Practices in Support of the Community -> Environmental Performance | 5.630 | 0.000 |
| Social HR Development Practices -> Eco-Financial Performance | 0.468 | 0.621 |
| Social HR Development Practices -> Social Performance | 1.192 | 0.213 |
| Social Practices of HR Development -> Environmental Performance | 2.992 | 0.002 |
| Environmental Practices -> Eco-Financial Performance | 3.309 | 0.001 |
| Environmental Practices -> Social Performance | 3.859 | 0.000 |
| Environmental Practices -> Environmental Performance | 3.497 | 0.001 |
| Main Component | Q2 | f2 |
|---|---|---|
| Social Practices of HR Development | 0.254 | |
| Social Practices in Support of the Community | 0.224 | |
| Environmental Practices | 0.352 | |
| Economic and Financial Performance | 0.193 | 0.398 |
| Social Performance | 0.177 | 0.334 |
| Environmental Performance | 0.187 | 0.166 |
| Relationship between Constructs | Correlation | |
|---|---|---|
| Social Practices of HR Development (HR) → Economic–Financial Performance (EFP) | 0.04 | Insignificant |
| Social Practices of HR Development (HR) → Social Performance (SP) | 0.1 | Insignificant |
| Social Practices of HR Development (HR) → Environmental Performance (EPf) | 0.2 | Insignificant |
| Social Practices in Support of the Community (SC) → Economic–Financial Performance (EFP) | 0.4 | Weak |
| Social Practices of Community Support (SC) → Social Performance (SP) | 0.2 | Insignificant |
| Social Practices in Support of the Community (SC) → Environmental Performance (EPf) | 0.3 | Weak |
| Environmental Practices (EPr) → Economic–Financial Performance (EFP) | 0.2 | Insignificant |
| Environmental Practices (EPr) → Social Performance (SP) | 0.4 | Weak |
| Environmental Practices (EPr) → Environmental Performance (EPf) | 0.2 | Insignificant |
Publisher’s Note: MDPI stays neutral with regard to jurisdictional claims in published maps and institutional affiliations. |
© 2022 by the authors. Licensee MDPI, Basel, Switzerland. This article is an open access article distributed under the terms and conditions of the Creative Commons Attribution (CC BY) license (https://creativecommons.org/licenses/by/4.0/).
Share and Cite
Madime, E.; Gonçalves, T.C. Consequences of Social and Environmental Corporate Responsibility Practices: Managers’ Perception in Mozambique. Int. J. Financial Stud. 2022, 10, 4. https://0-doi-org.brum.beds.ac.uk/10.3390/ijfs10010004
Madime E, Gonçalves TC. Consequences of Social and Environmental Corporate Responsibility Practices: Managers’ Perception in Mozambique. International Journal of Financial Studies. 2022; 10(1):4. https://0-doi-org.brum.beds.ac.uk/10.3390/ijfs10010004
Chicago/Turabian StyleMadime, Eulália, and Tiago Cruz Gonçalves. 2022. "Consequences of Social and Environmental Corporate Responsibility Practices: Managers’ Perception in Mozambique" International Journal of Financial Studies 10, no. 1: 4. https://0-doi-org.brum.beds.ac.uk/10.3390/ijfs10010004