Intraday Volatility Spillovers among European Financial Markets during COVID-19


1
Department of Management Sciences, Comsats University, Islamabad 45550, Pakistan
2
Business School, Hanyang University, Seoul 04763, Korea
3
VALORIZA—Research Center for Endogenous Resource Valorization, 7300-555 Portalegre, Portugal
4
Department of Economic Sciences and Organizations, Polytechnic Institute of Portalegre, 7300-555 Portalegre, Portugal
5
CEFAGE-UE, IIFA, University of Évora, 7000 Évora, Portugal
6
State Bank of Pakistan, Karachi 74200, Pakistan
*
Author to whom correspondence should be addressed.
Int. J. Financial Stud. 2021, 9(1), 5; https://0-doi-org.brum.beds.ac.uk/10.3390/ijfs9010005
Submission received: 25 November 2020
/
Revised: 22 December 2020
/
Accepted: 29 December 2020
/
Published: 5 January 2021
(This article belongs to the Special Issue COVID-19 and the Stability of the Financial System)
Abstract
:During crises, stock market volatility generally rises sharply, and as consequence, spillovers are identified across markets. This study estimates the volatility spillover among twelve European stock markets representing all four regions of Europe. The data consists of 10,990 intraday observations from 2 December 2019 to 29 May 2020. Using the methodology of Diebold and Yilmaz, we use static and rolling windows to characterize five-minute volatility spillovers. Our results show that 77.80% of intraday volatility forecast error variance in twelve European markets comes from spillovers. Furthermore, the highest gross directional volatility spillovers are found in Sweden and the Netherlands, while the minimum spillovers to other stock markets are observed in the stock markets of Poland and Ireland. However, German and Dutch markets transmit the highest net directional volatility spillovers. Splitting the whole sample in pre- and post-pandemic declaration (11 March 2020) we find more stable spillovers in the latter. The findings reveal important information about European stock market interdependence during COVID-19, which will be beneficial to both policy-makers and practitioners.
1. Introduction
As an unanticipated disease, the very first case of coronavirus (COVID-19) was reported in Wuhan, China, on 31 December 2019. Due to being highly infectious, the World Health Organization (WHO) issued an alert on 30 January 2020 (WHO 2020a). Later, on 11 March 2020, they declared it a pandemic (WHO 2020b). Over time its concentration has shifted from China to Europe and then to the American continent, mostly North America. The immediate solution to avoid its spread was isolation, and lockdown was applied in most countries. Hence the term, general lockdown, is used to represent a simultaneous restriction on economic and social activity in many countries. The restrictions on domestic and international travel and ensuing disruption of supply chains led to predictions of economic crisis by the International Monetary Fund (IMF) and all other international agencies, who revised their global growth projections. Likewise, lockdown and other restrictions have had an effect on the sports and entertainment industries (Horowit 2020, Elliot 2020).
According to The Economist, this pandemic is a severe threat to global markets (The Economist 2020a). Its effect on economic and market activity has led to a level of risk aversion behavior seen after the global financial crisis (OECD 2020). The report adds that a 30% decline in stock markets and implied volatilities of equities and oil have increased to crisis levels. Furthermore, news about COVID-19 in the international media causes negative sentiments, fear, and uncertainty (Aslam et al. 2020a). Due to these fears, global financial markets have slumped (The Economist 2020b). For instance, the Dow Jones Industrial Average (DJIA) registered falls of 12.93% and 9.99% on 16 and 9 March 2020 and 12 March 2020, respectively. Likewise, the FTSE100 experienced a drop of 24.8% (The Guardian 2020) while the Nikkei index dropped by 20% from a December 2019 high (Bloomberg 2020). This spread will affect the world economy by interfering with the supply of labor, goods, and services. The spillover effect is alarming (The Economist 2020c). According to the Australian National University’s estimation, as a consequence of COVID-19, the GDP of America and Europe would decline by 2% to 8% in the worst case scenario (The Economist 2020d).
Changes in stock market returns and volatility and the subsequent contagion through the transfer of information across local and international markets during a crisis has received considerable attention from academics, policy-makers, and investors (Lin et al. 1994). There have been theoretical as well as empirical contributions in the financial literature. The spillover effects between markets have important implications for calculating value-at-risk, obtaining optimal portfolio weights, and determining if the portfolio hedge ratio is effective (Jiang et al. 2019; Mensi et al. 2017; Mensi et al. 2018). Particularly, during financial crises, markets show a sharp increase in volatility and spillovers in other markets. A similar phenomenon has been confirmed during COVID-19. In addition to a significant decline in stock indices (McKibbin and Vines 2020), an increase in stock markets’ volatility has been recorded during this pandemic(Ali et al. 2020; Barro et al. 2020), causing huge investment losses (Zhang et al. 2020). Furthermore, the intraday efficiency of European stock markets and forex markets has declined during the COVID-19 outbreak (Aslam et al. 2020b; Aslam et al. 2020c; Aslam et al. 2020d). During such a crisis, it becomes very important to track the extent of that crisis and to issue early warnings by measuring the spillovers among stock markets (Diebold and Yilmaz 2012).
A diverse range of models has been applied in the empirical literature to estimate the volatility spillovers among financial markets. For instance, Jebran et al. (2017) examined the volatility spillover between emerging Asian stock markets in pre- and post-2007 financial crisis periods using the EGARCH model. The authors documented that the volatility spillover of Indian and Sri Lankan markets is bidirectional around the 2007 crises. However, the spillover of Pakistan and Sri Lanka markets is bidirectional only in the post-crisis period. Likewise, Xu et al. (2017) investigated the volatility spillover between the Shanghai and Hong Kong stock markets using the GARCH-X model. The authors conclude that spillovers are bidirectional most of the time and they gain strength from an increase in capital flows or during major financial events. In a similar study, Mensi et al. (2018) used the model of (Diebold and Yilmaz 2012; Diebold and Yılmaz 2014) on static and rolling-windows to explore volatility spillovers among the GIPSI (Greece, Ireland, Portugal, Spain, and Italy) markets. The authors documented an increase in spillover intensity during the crisis, i.e., global financial and European Sovereign Debt Crises (ESDC). Using the same econometric approach, (Nishimura et al. 2018) associated stock market spillovers with international stock investors’ activities. The authors further argued that spillovers of both return and volatility increase with greater stock market openness. They analyzed volatility spillovers and their determinants among 40 developed, emerging, and frontier stock markets using a Granger-Causality framework, identifying market size, liquidity, and financial openness as the most important determinants.
In recent literature, Kang et al. (2019) examine the spillover effect between ASEAN-5 and global stock markets by applying the spillover-index of Diebold and Yilmaz (2012). The authors document a positive spillover between ASEAN-5 and world stock markets. They also concluded that return and volatility spillovers increased during the crises. Likewise, McIver and Kang (2020) investigated spillover dynamics between the USA and BRICS (Brazil, Russia, India, China and South Africa) stock markets. Using the spillover index method with the multivariate DECO-GJR-GARCH model, the authors also concluded that crisis periods like GFC (Global Financial Crisis) and ESDC lead to increased spillovers. Further, they showed that the USA, Brazil, and China are net transmitters, while Russia, India, and South Africa are net receivers of volatility in their respective stock markets. A similar outcome was identified for G7 and BRICS countries. Su (2020) concluded that the USA, Germany, France and Canada are net transmitters while the UK, Japan, Italy and BRICS are net recipients of risk spillovers. The author proposed a quantile variance decomposition to measure extreme risk spillover across international stock markets. The framework is an extension of the spillover index approach of Diebold and Yilmaz (2009), replacing OLS (Ordinary Least Squares) with a quantile regression. Hou and Li (2020) examined volatility and skewness spillover during the market crash in 2015 with high-frequency data for the Chinese stock market and derivative markets. The authors used bivariate dynamic-conditional-correlation (DCC) and the GARCH model. Their results show unidirectional spillover from futures to spot markets. Using stock market data from the USA, the UK, Germany, and Japan, Finta and Aboura (2020) examined volatility and skewness risk premium spillovers by applying variance decompositions of a vector autoregressive (VAR) model (Diebold and Yilmaz 2012). They concluded on increased cross-market and cross-moment spillovers during periods of stress. Diebold and Yilmaz (2009) presented a volatility spillover measure based on forecast error variance decompositions (FEVD) from VAR. This is used to ascertain the spillovers in returns or return volatilities across individual assets, portfolios, markets, etc. This Diebold and Yilmaz (DY) framework had several limitations which were accounted for by Diebold and Yilmaz (2012), who used the generalized VAR framework. The FEVD in this new framework are not influenced by variable ordering, and it explicitly includes directional volatility spillovers.
Black swan events, such as epidemics, could lead to a panic-selling response from international investors (Burch et al. 2016). Nippani and Washer (2004) found a negative impact of the SARS period on Chinese and Vietnamese stock markets. From an industry perspective, Chen et al. (2007) also found a negative impact of SARS on the shares of hotels in the stock markets of mainland China and Taiwan. Likewise, during the Ebola outbreak investors’ decisions were affected, which then harmed equity capital in African (Del Giudice and Paltrinieri 2017) and US (Ichev and Marinc 2018) stock markets.
Very recent studies on the financial impacts of COVID-19 have reported varying results for different stock markets. Baker et al. (2020) proved that COVID-19 is far more destructive for the US stock market than previous infectious diseases. Likewise, Nicola et al. (2020) confirmed that this immense black swan event has overwhelming impacts on global financial markets. The stock markets of the USA react more than Asian and Australian stock markets to the coronavirus outbreak (Ammy-Driss and Garcin 2020). Similar results are reported by Garcin et al. (2020). However, Topcu and Gulal (2020) reveal that Asian stock markets are more affected than European ones. By relating the number of confirmed cases and deaths caused by COVID-19, they recorded that stock markets react more negatively to positive cases of COVID-19 than to deaths.
Increasing empirical literature focuses on the financial impacts of COVID-19 by applying diverse statistical techniques (Akhtaruzzaman et al. 2020; Ashraf 2020; Aslam et al. 2020b; Aslam et al. 2020c; Baker et al. 2020; Sharif et al. 2020; Topcu and Gulal 2020; Zhang et al. 2020). Very recently, Yarovaya et al. (2020), using DOW Jones world index and Islamic sakkuk index data argued that Islamic bonds (Sukuk) showed properties of being a safe haven during the ongoing COVID crisis. The authors also asserted that spillovers between conventional and Islamic stock markets increased during this period. Similarly, Hung (2020) explored the pre and during COVID spillovers between crude oil prices and five developed stock markets in Europe, concluding that spillovers are more apparent during the COVID period. However, no comprehensive study has focused particularly on intraday spillovers during the COVID-19 outbreak. It is crucial to estimate volatility spillovers during COVID-19 for early warning signs and to track the extent of the current crisis. Furthermore, little attention is given to high-frequency data. To fill this gap, we measure total and directional volatility spillovers among 12 European stock markets during COVID-19. Furthermore, we use high-frequency data to reveal the inner volatility dynamics among European stock markets during this pandemic. One important element of this whole episode is that the World Health Organization (WHO) declared COVID-19 as a global pandemic on 11 March 2020 (Maier and Brockmann 2020), despite the fear of inciting panic (Aslam et al. 2020a). Hence, we compare the results of total intraday volatility spillovers for all 12 European Stock Markets before and after the declaration of the pandemic.
In this paper we use the changes suggested by Diebold and Yilmaz (2012) to study directional volatility spillover in European countries during the pandemic. The European Union (EU) made efforts to create and reinforce the integration project, with the free flow of people, goods and services resulting in a higher degree of stock market integration than in other regions in the world. Extensive literature is devoted to exploring the degree of integration between the markets of EU member countries Bekaert et al. (2013). Our study will help investors and regulators to design effective policies by uncovering the spillover effects among these stock markets.
2. Materials and Methods
2.1. Data Description
We investigate volatility spillover during the COVID-19 crisis among twelve European stock markets representing all four European regions. Before the introduction of the euro in 1999, western European countries went through a period marked by efforts towards economic, monetary, and financial integration (Baele 2005). Despite the advantages of this financial integration, very important challenges are related to the connection among financial markets. Hence, it is pertinent to explore the direction of volatility spillover during the current crisis on a regional basis, since this could give some information about which markets are predominant in terms of affecting the others. The first case of 2019-nCoV was reported in Europe on 24 January 2020 in France and the highest number of COVID-19 cases is reported in Spain (Table 1). To reveal the inner dynamics, we use 5-minute stock market data from selected countries from 2 December 2019 till 29 May 2020, corresponding to 10,990 observations. Duplicated prices, which lead to zero returns, were deleted during the data cleaning process. Using the pandemic declaration date, the intraday prices ranging from 2 December 2019 to 10 March 2020 refer to the period before the pandemic and prices from 11 March 2020 to 29 May 2020 form the sample for the period during the pandemic.
We follow the literature dating back to (Parkinson 1980), and calculate 5-min variance using high and low prices. For market i at time t we have
where is the highest (max) price in market iat t, and is the lowest (min) price and with as an estimator of the 5-min variance. Since volatilities tend to be skewed, it is common practice to use log-volatilities which come close to normal distribution. However, to control volatility levels near to zero, is used instead of the natural logarithm The corresponding annualized daily standard deviation (volatility) is postulated in Equation (2).
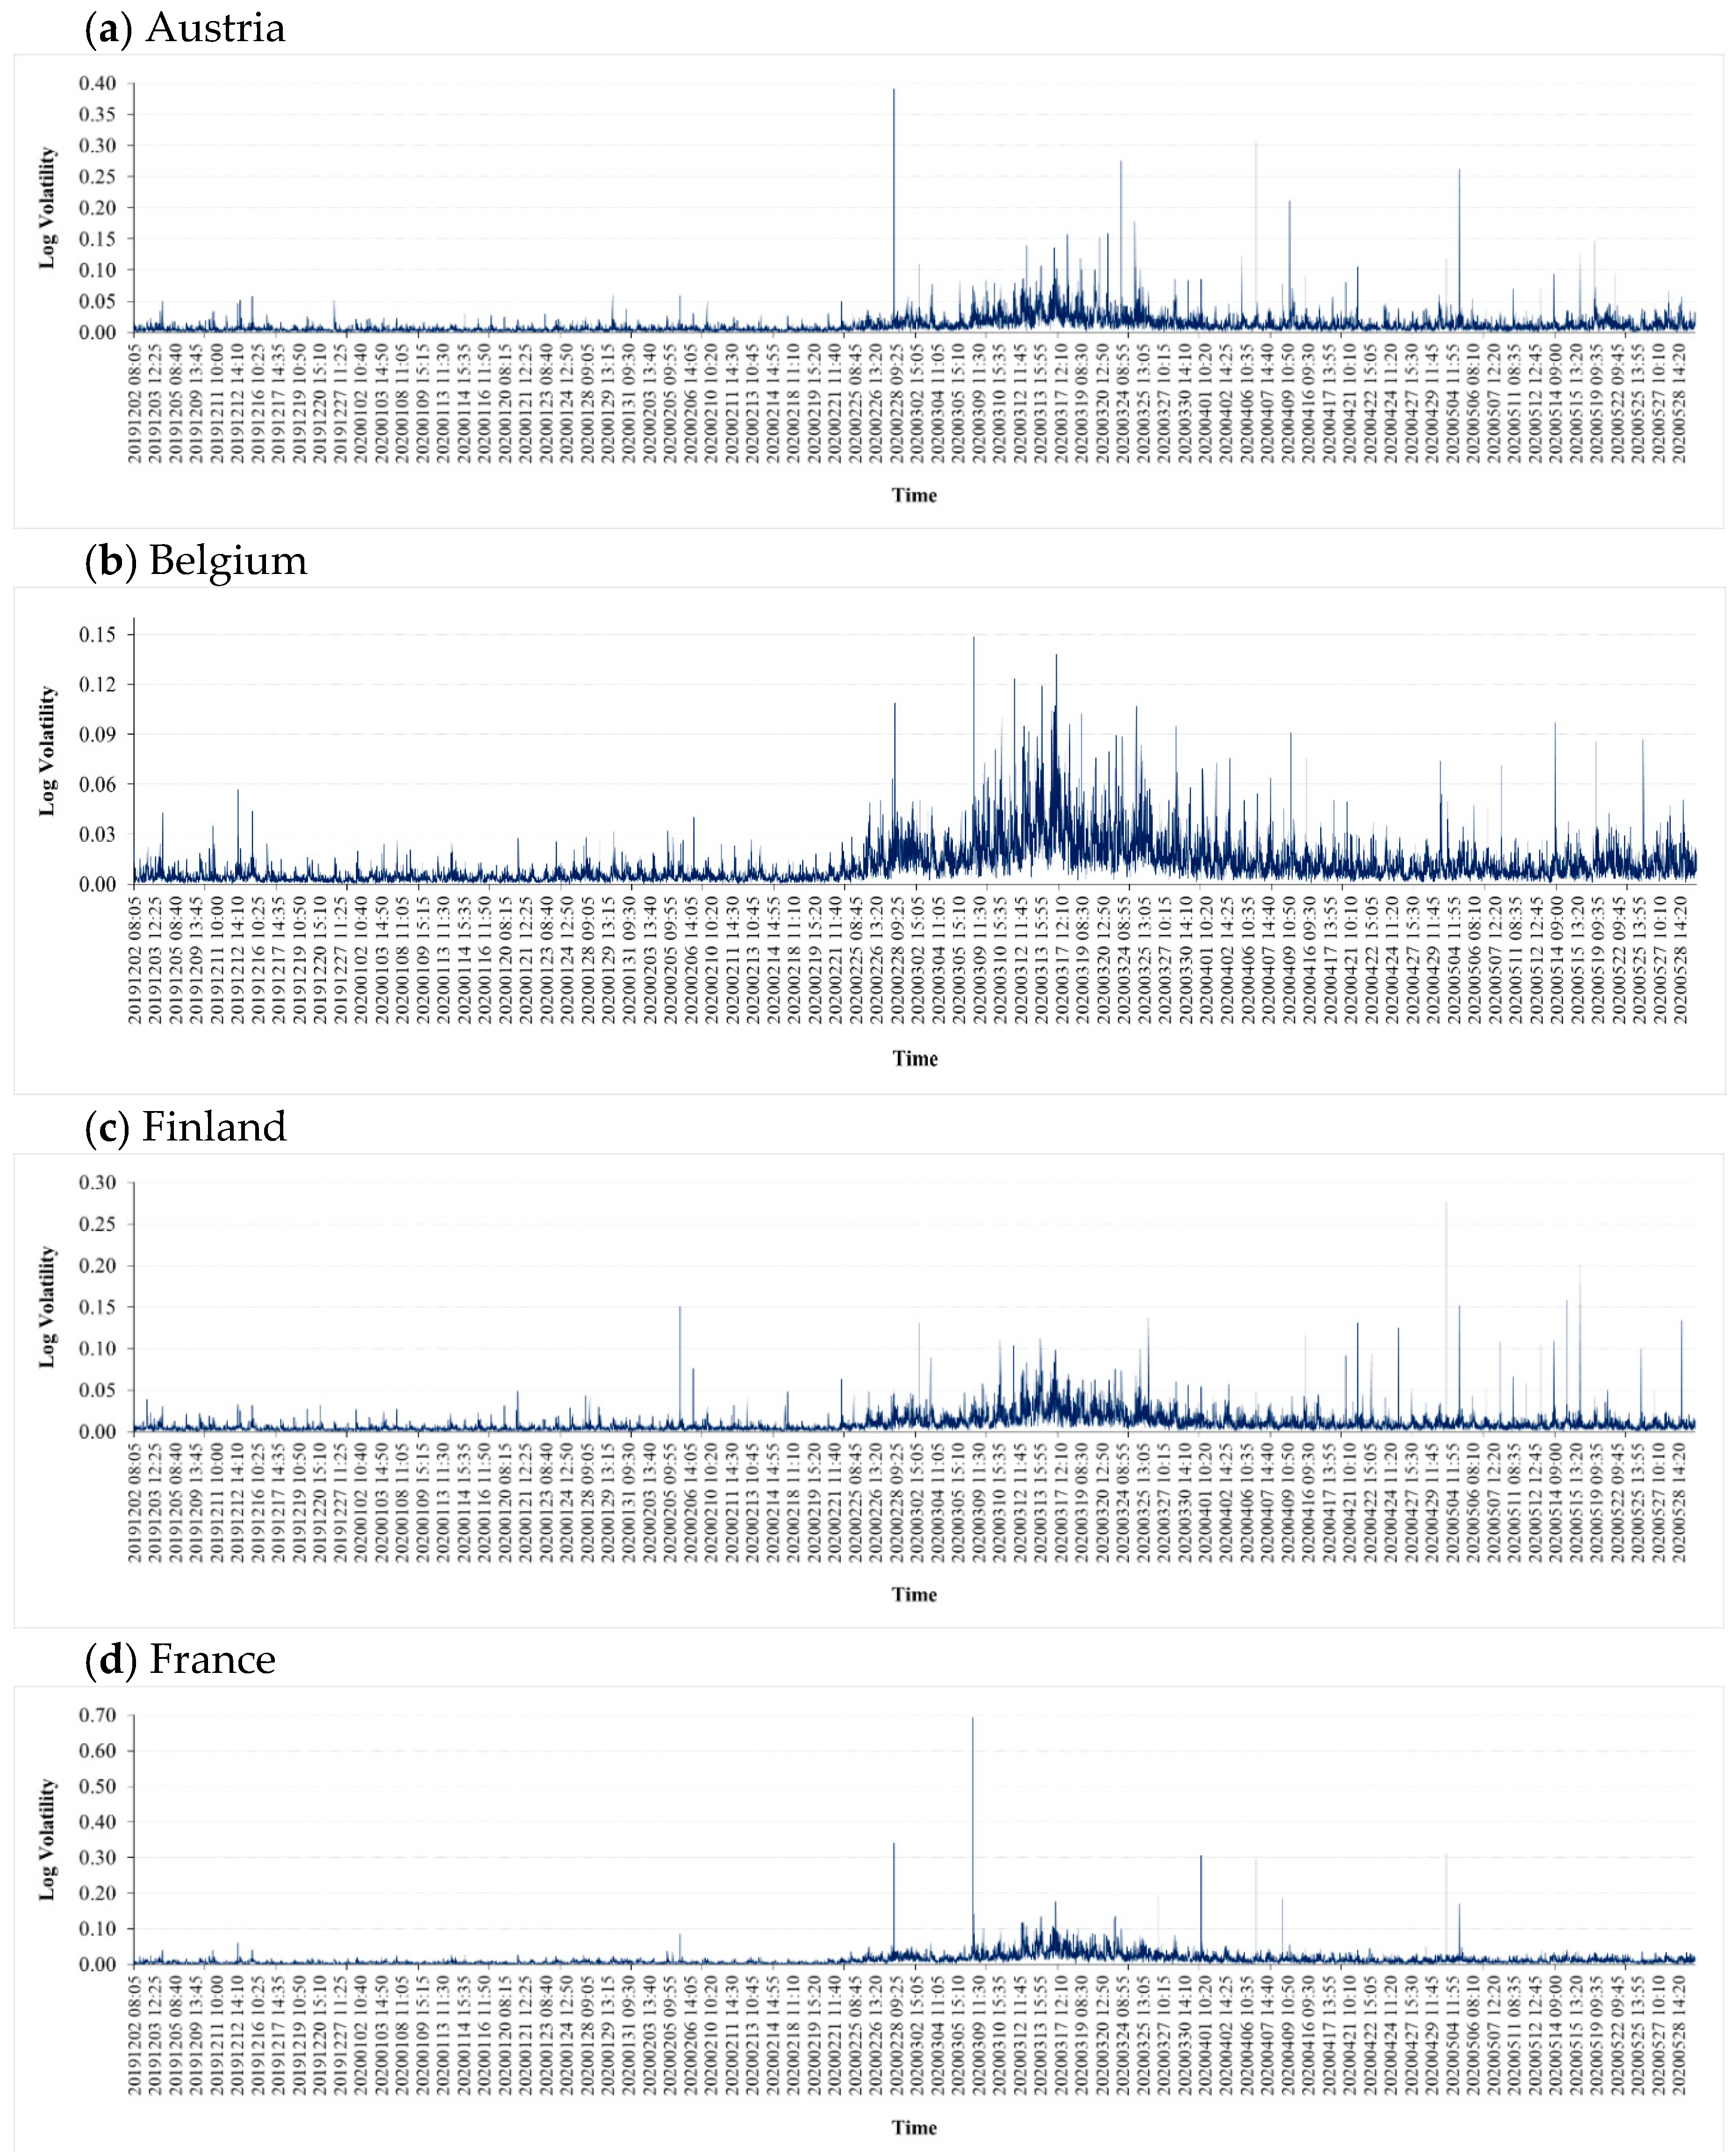
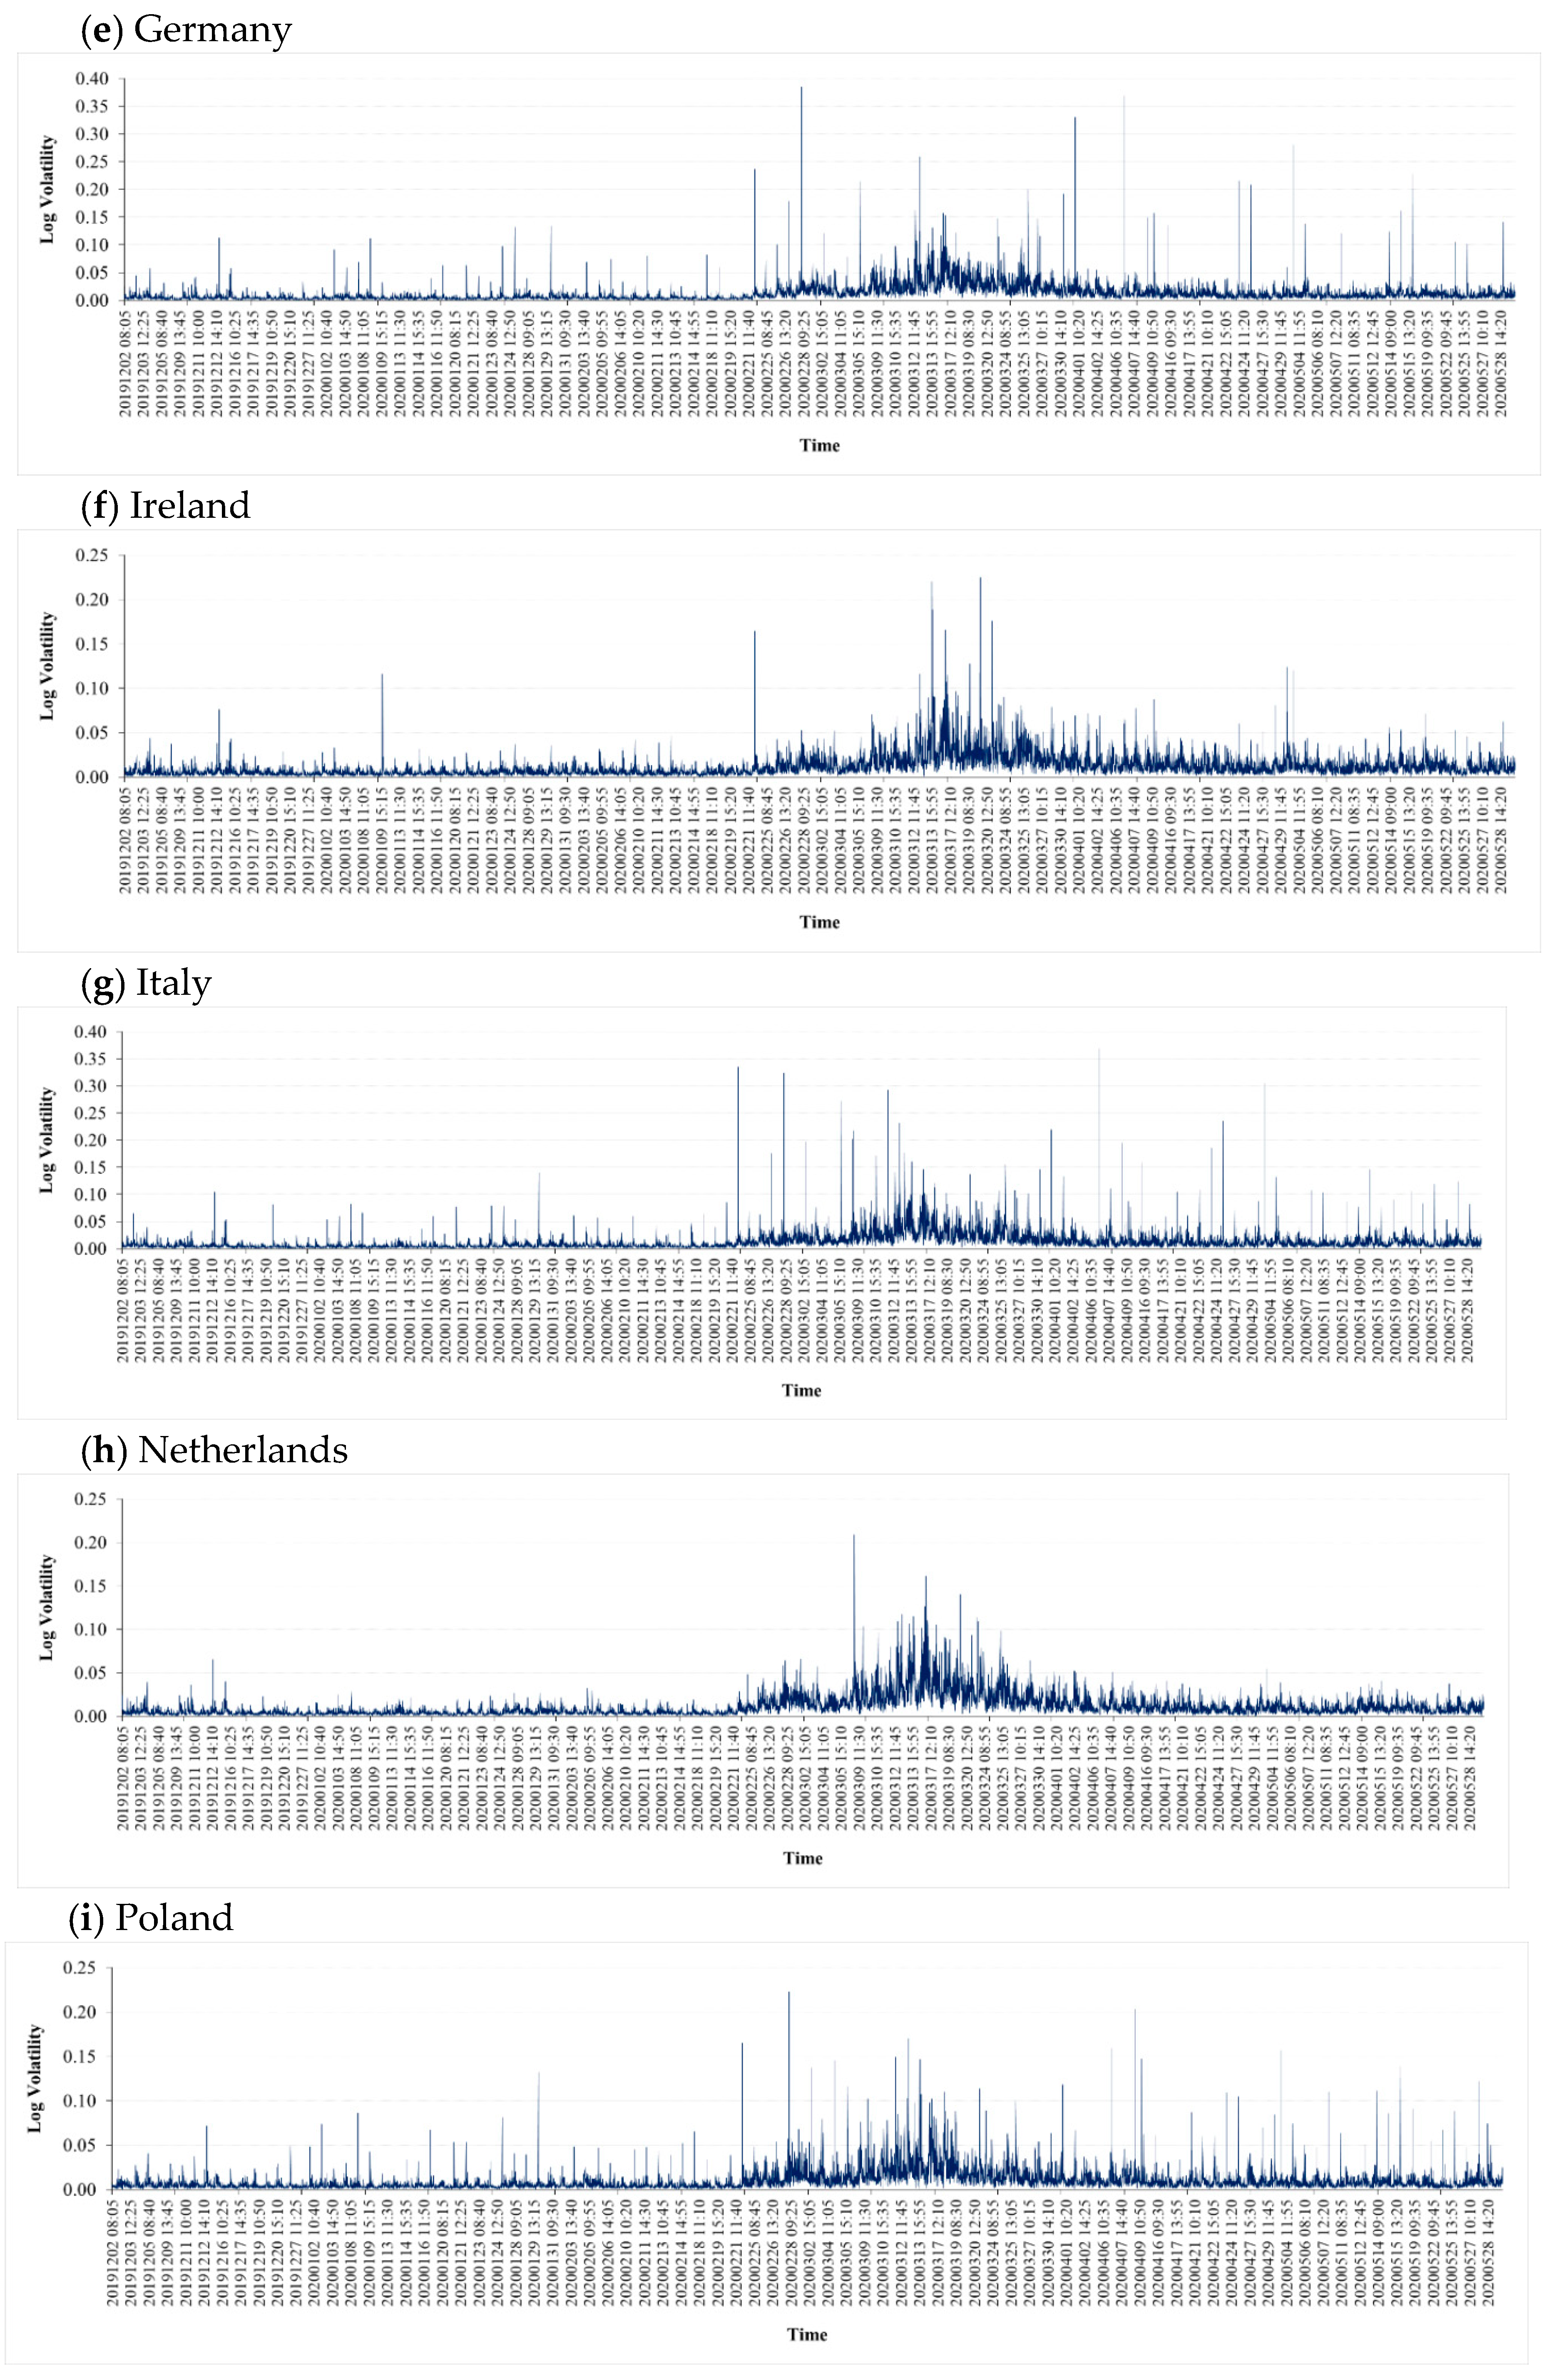
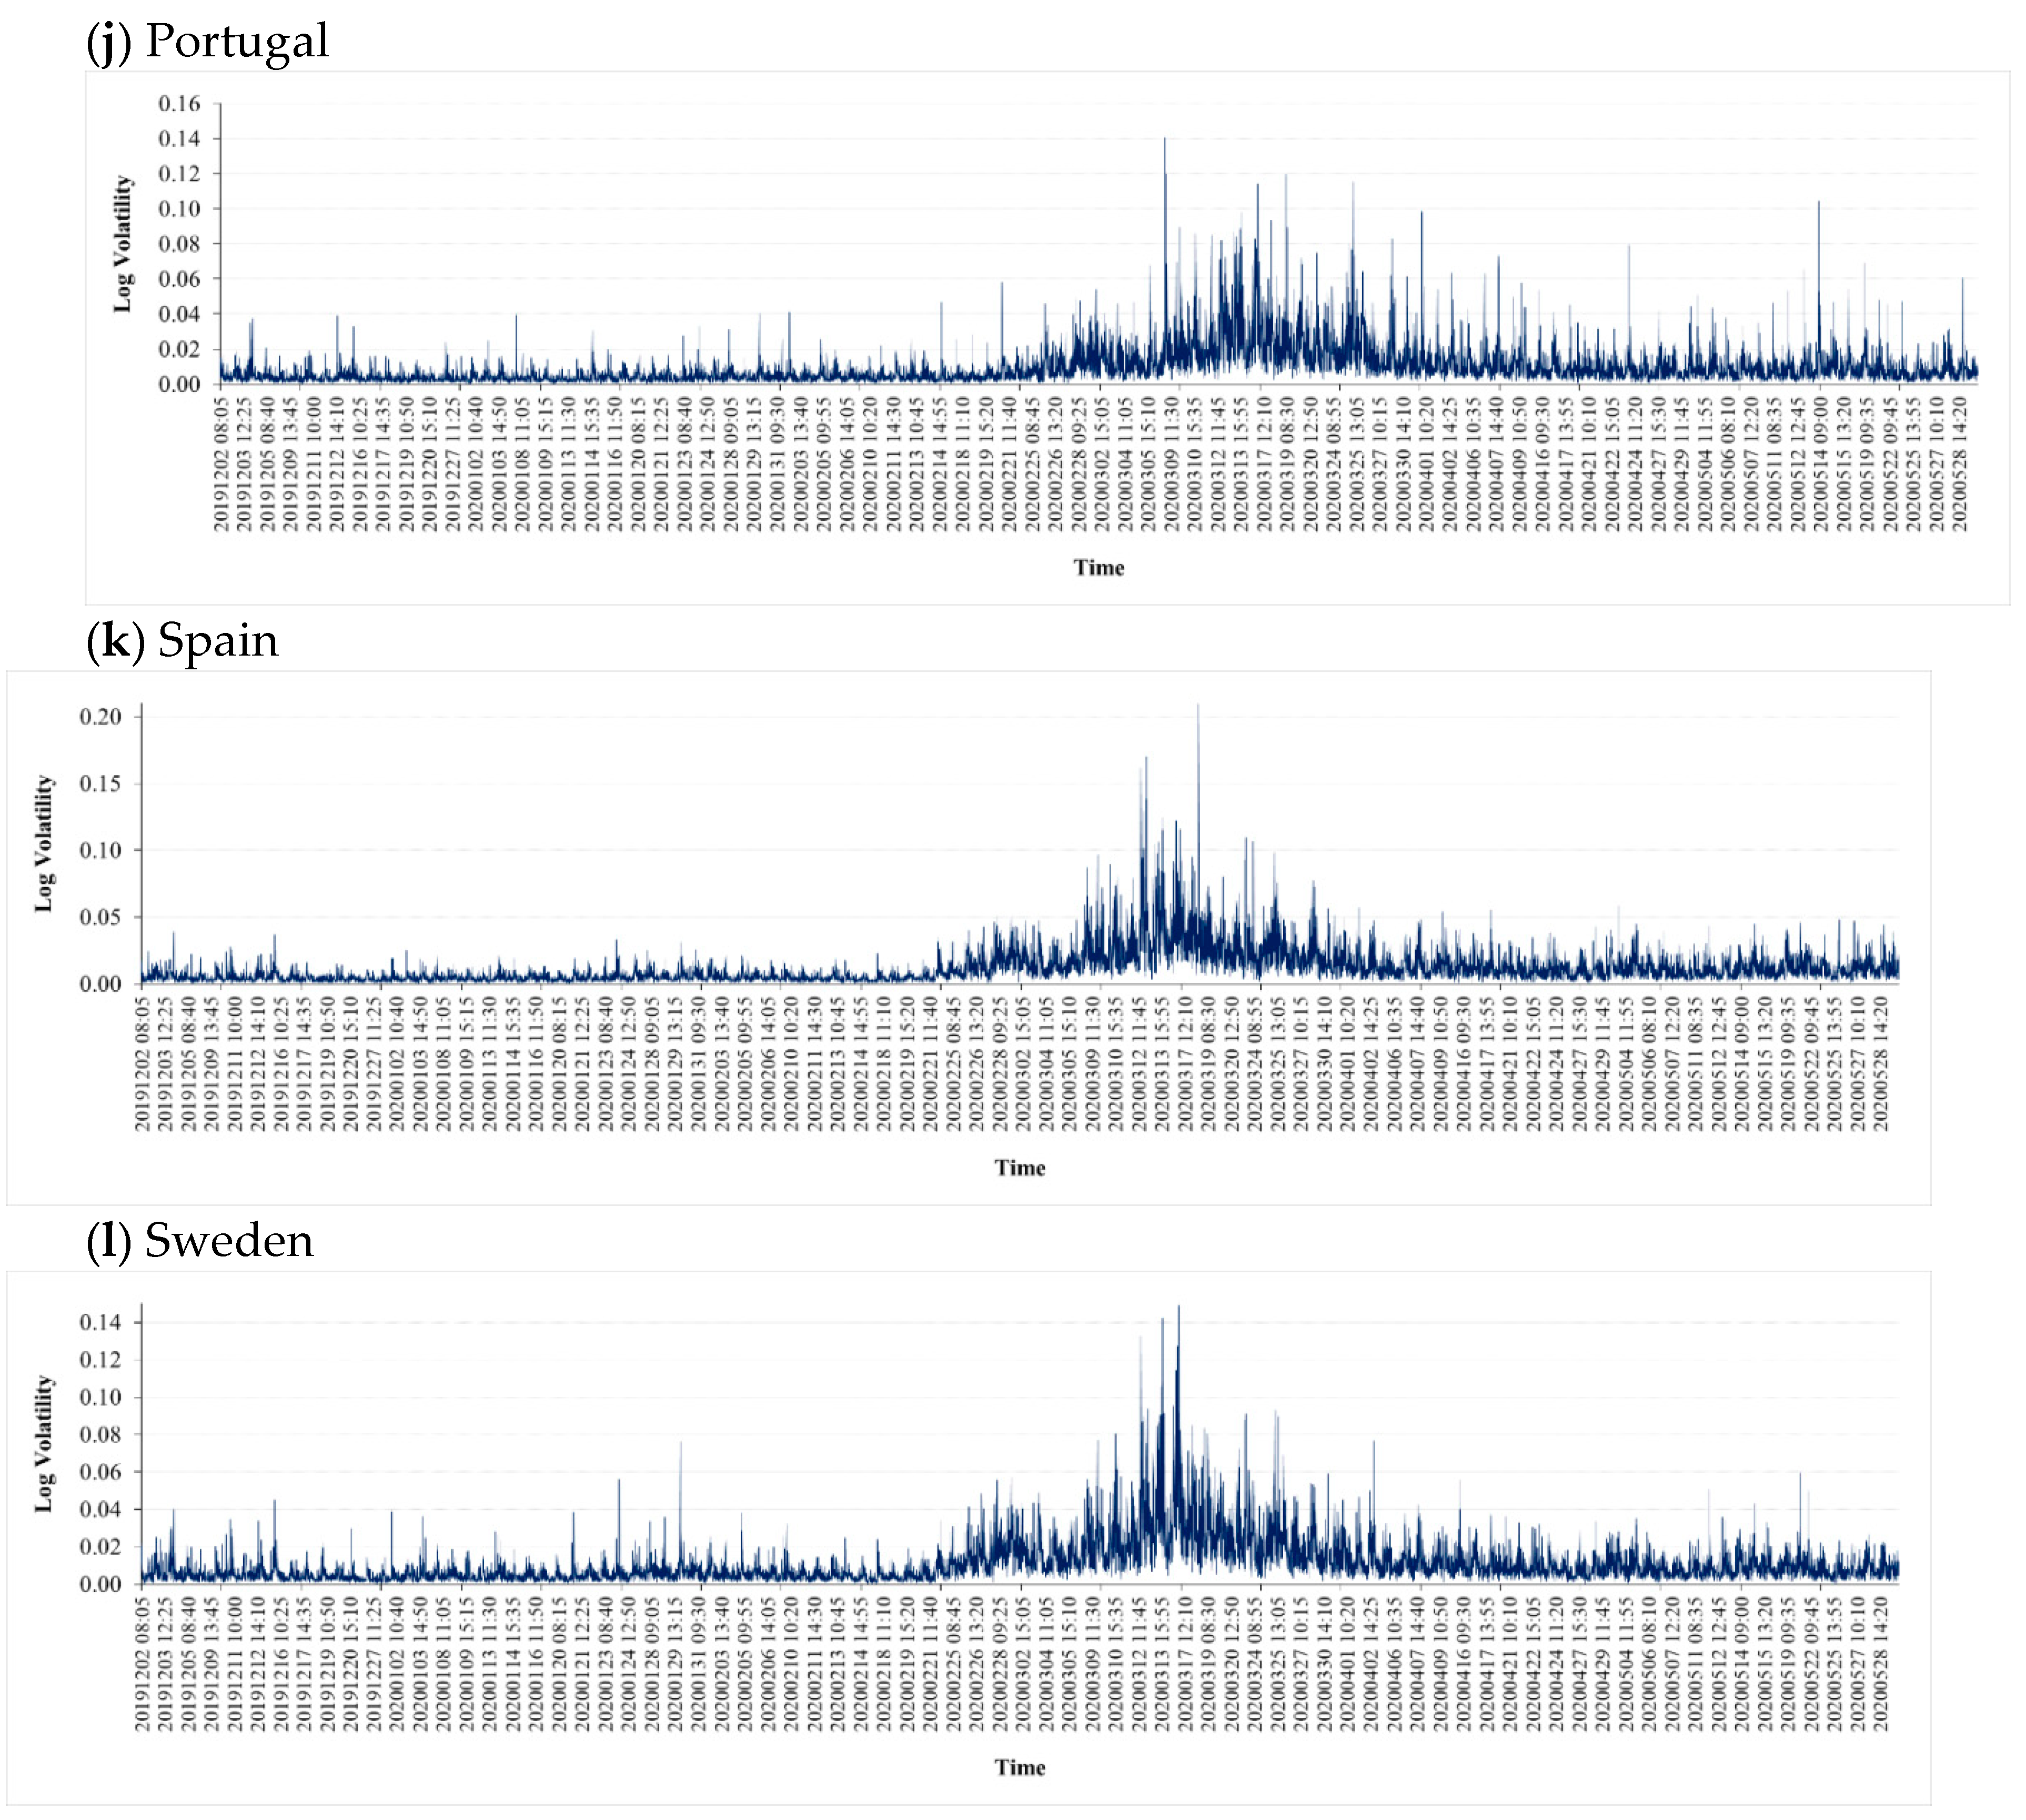
Table 2 presents some descriptive statistics on the five-minute return volatility of the 12 European stock markets studied. The stock markets of Finland (0.0092) and Portugal (0.0092) show minimum levels, while those of Italy (0.0126) and Germany (0.0123) are the most volatile. Figure A1, in Appendix A, shows the volatility movement of all 12 markets from 2 December 2019 to 29 May 2020. The volatility dynamics are consistent with the previous literature summarized by Andersen et al. (2007). High volatility clusters are visible in the last week of February and persist till the first week of March for all twelve markets with the value of 0.70 for France showing a huge jump. It is also noted that European markets have become more volatile during the spread of COVID-19.
2.2. Methodology
We apply DY-spillover index (Diebold and Yilmaz 2012), which is derived from variance decomposition of n-variable Vector Autoregressive model, which is not dependent on the order of variables. The main advantage of this econometric model is that we are able to estimate and present the directional spillovers.
Consider a covariance stationary N-variable VAR(p), where is an iid disturbance vector. Its MA representation is . The n × n coefficient matrices obey the recursion , with being an n × n identity matrix and with = 0 for I < 0. The dynamics of the system can be understood by MA coefficients, impulse response functions or variance decompositions. We use variance decompositions, which breaks down the variance of error forecasts for each variable into segments associated with the system shocks. Through variance decompositions, T-step-ahead error variance in predicting due to shocks to for each i can be evaluated.
Orthogonal innovations based on Cholesky factorization type identification schemes are needed to calculate variance decompositions, which however, creates dependency on ordering of the variables. Hence, to avoid the issues raised by dependency on ordering, Diebold and Yilmaz (2012) used the generalized VAR setup of Koop et al. (1996) and Pesaran and Shin (1998). This approach allows correlated shocks, which is more appropriate for our analysis.
The initial step is to define variance segments as the fractions of T-step-ahead error variances in forecasting based on shocks to for and cross error variance spillover in forecasting is due to shock to for .
Showing the KPPS T-step-ahead FEVD as we have
In Equation (3), refers to the standard deviation of the error of the jth equation, while is the selection vector, equal to 1 for the ith element and zero otherwise. It is also possible to write , since the summation of elements across rows of variance decomposition is different from the unity. Hence,
which will be used in calculating the spillover index.
By definition, and
KPPS variance decomposition is used to obtain volatility contributions to construct total spillover-index as
This total spillover-index represents the combined spillovers of volatility shocks of twelve stock markets to the total forecast error variance. With this information at hand it is interesting to explore the directional properties of spillover. We measure the directional volatility spillovers to market i from all other markets j as
The generalized VAR decomposition also enables measurement of the spillovers from market i to all j markets:
Equations (6) and (7) are then used to measure net volatility spillover between market i and all other markets, just by taking the difference of the two equations:
Equation (8) gives information only from the perspective of a single market while considering its receipt of and transmission of spillover to all other markets. It can also be interesting to evaluate net pairwise volatility spillovers, where the similar net association is expressed for a pair of two markets. For market I and j we calculate:
3. Empirical Results
We present the estimated “input–output” decomposition of the total volatility spillover index in Table 3. Its ijth entry is the calculated share of the forecast error variance of market i transmitted from shocks to market j. It is important to mention that these findings are based on auto-regressive vectors of order 4 and generalized variance decompositions of 10-day-ahead volatility forecast errors (for VAR order selection, Figure A1 in Appendix A shows the min, max, and median values of spillover-index for orders 2 to 6). The sums of the off-diagonal column (i.e., excluding the diagonal terms) identify the “contributions TO others” of spillovers, measuring how much volatility each stock market index contributes to the system. Likewise, the sum of the off-diagonal row (again excluding the diagonal terms) measures how much volatility the stock index receives from the system. Finally, the “FROM” are the net volatility spillovers. Therefore, each cell in Table 3 shows the amount of volatility from column i which is given to row j. For instance, the spillover from Germany to Austria is 9.37, and from Austria to Germany is 6.15. Therefore, the net pairwise spillover from Germany to Austria is 3.22. Likewise, the spillover from Italy to France is 6.33, and from France to Italy is 7.77. So the net pairwise spillover from Italy to France is −1.44. Similarly, the spillover from Sweden to Ireland is 2.15 (7.75–5.6) and from Poland to Belgium is −1.66 (4.1–5.76).
The row labeled “directional to others” shows that gross directional volatility spillovers to the other 12 European stock markets varies significantly. These results reveal that gross directional volatility spillovers “To others” from the Netherlands is highest (100.16) followed by Sweden, where spillover to others explains 91.12 of the forecast error variance. The minimum spillovers to other stock markets are observed in the stock markets of Poland (50.73) and Ireland (55.09). Comparing both types of spillovers, a little less variability is found in the “directional from others” column which shows the gross directional volatility spillovers from the other 12 stock markets to each market. The results show that gross directional volatility spillovers from the other markets to Belgian stocks is 80.72% followed by Germany with 80.62%, while the minimum spillovers from other markets are found in Poland, explaining 69.862% of the forecast error variance.
The row “NET Directional Connectedness” shows that the Dutch stock market originates highest net directional volatility spillover to the other markets (100.16 − 80.25 = 19.91%) and then from Germany to others (99.54 − 80.62 = 18.92%). On the other hand, the smallest are from the Irish (55.09 − 75.84 = −20.75%) and Polish stock markets to others (50.73 − 69.86 = −19.13%). Finally, various directional volatility spillovers are converted into a single index of total (non-directional) spillover. This is calculated by dividing the total off-diagonal column/row sum (933.61) by the total row sum including diagonals (1200.02), expressed as a percentage in the last row and last column of Table 3. The index value indicates that, on average, from December 2019 to May 2020, 77.80% (933.61/1200.02) of intraday volatility forecast error variance in 12 European stock markets is due to spillovers. Overall, our results confirm that both total and directional spillovers remained high during COVID-19.
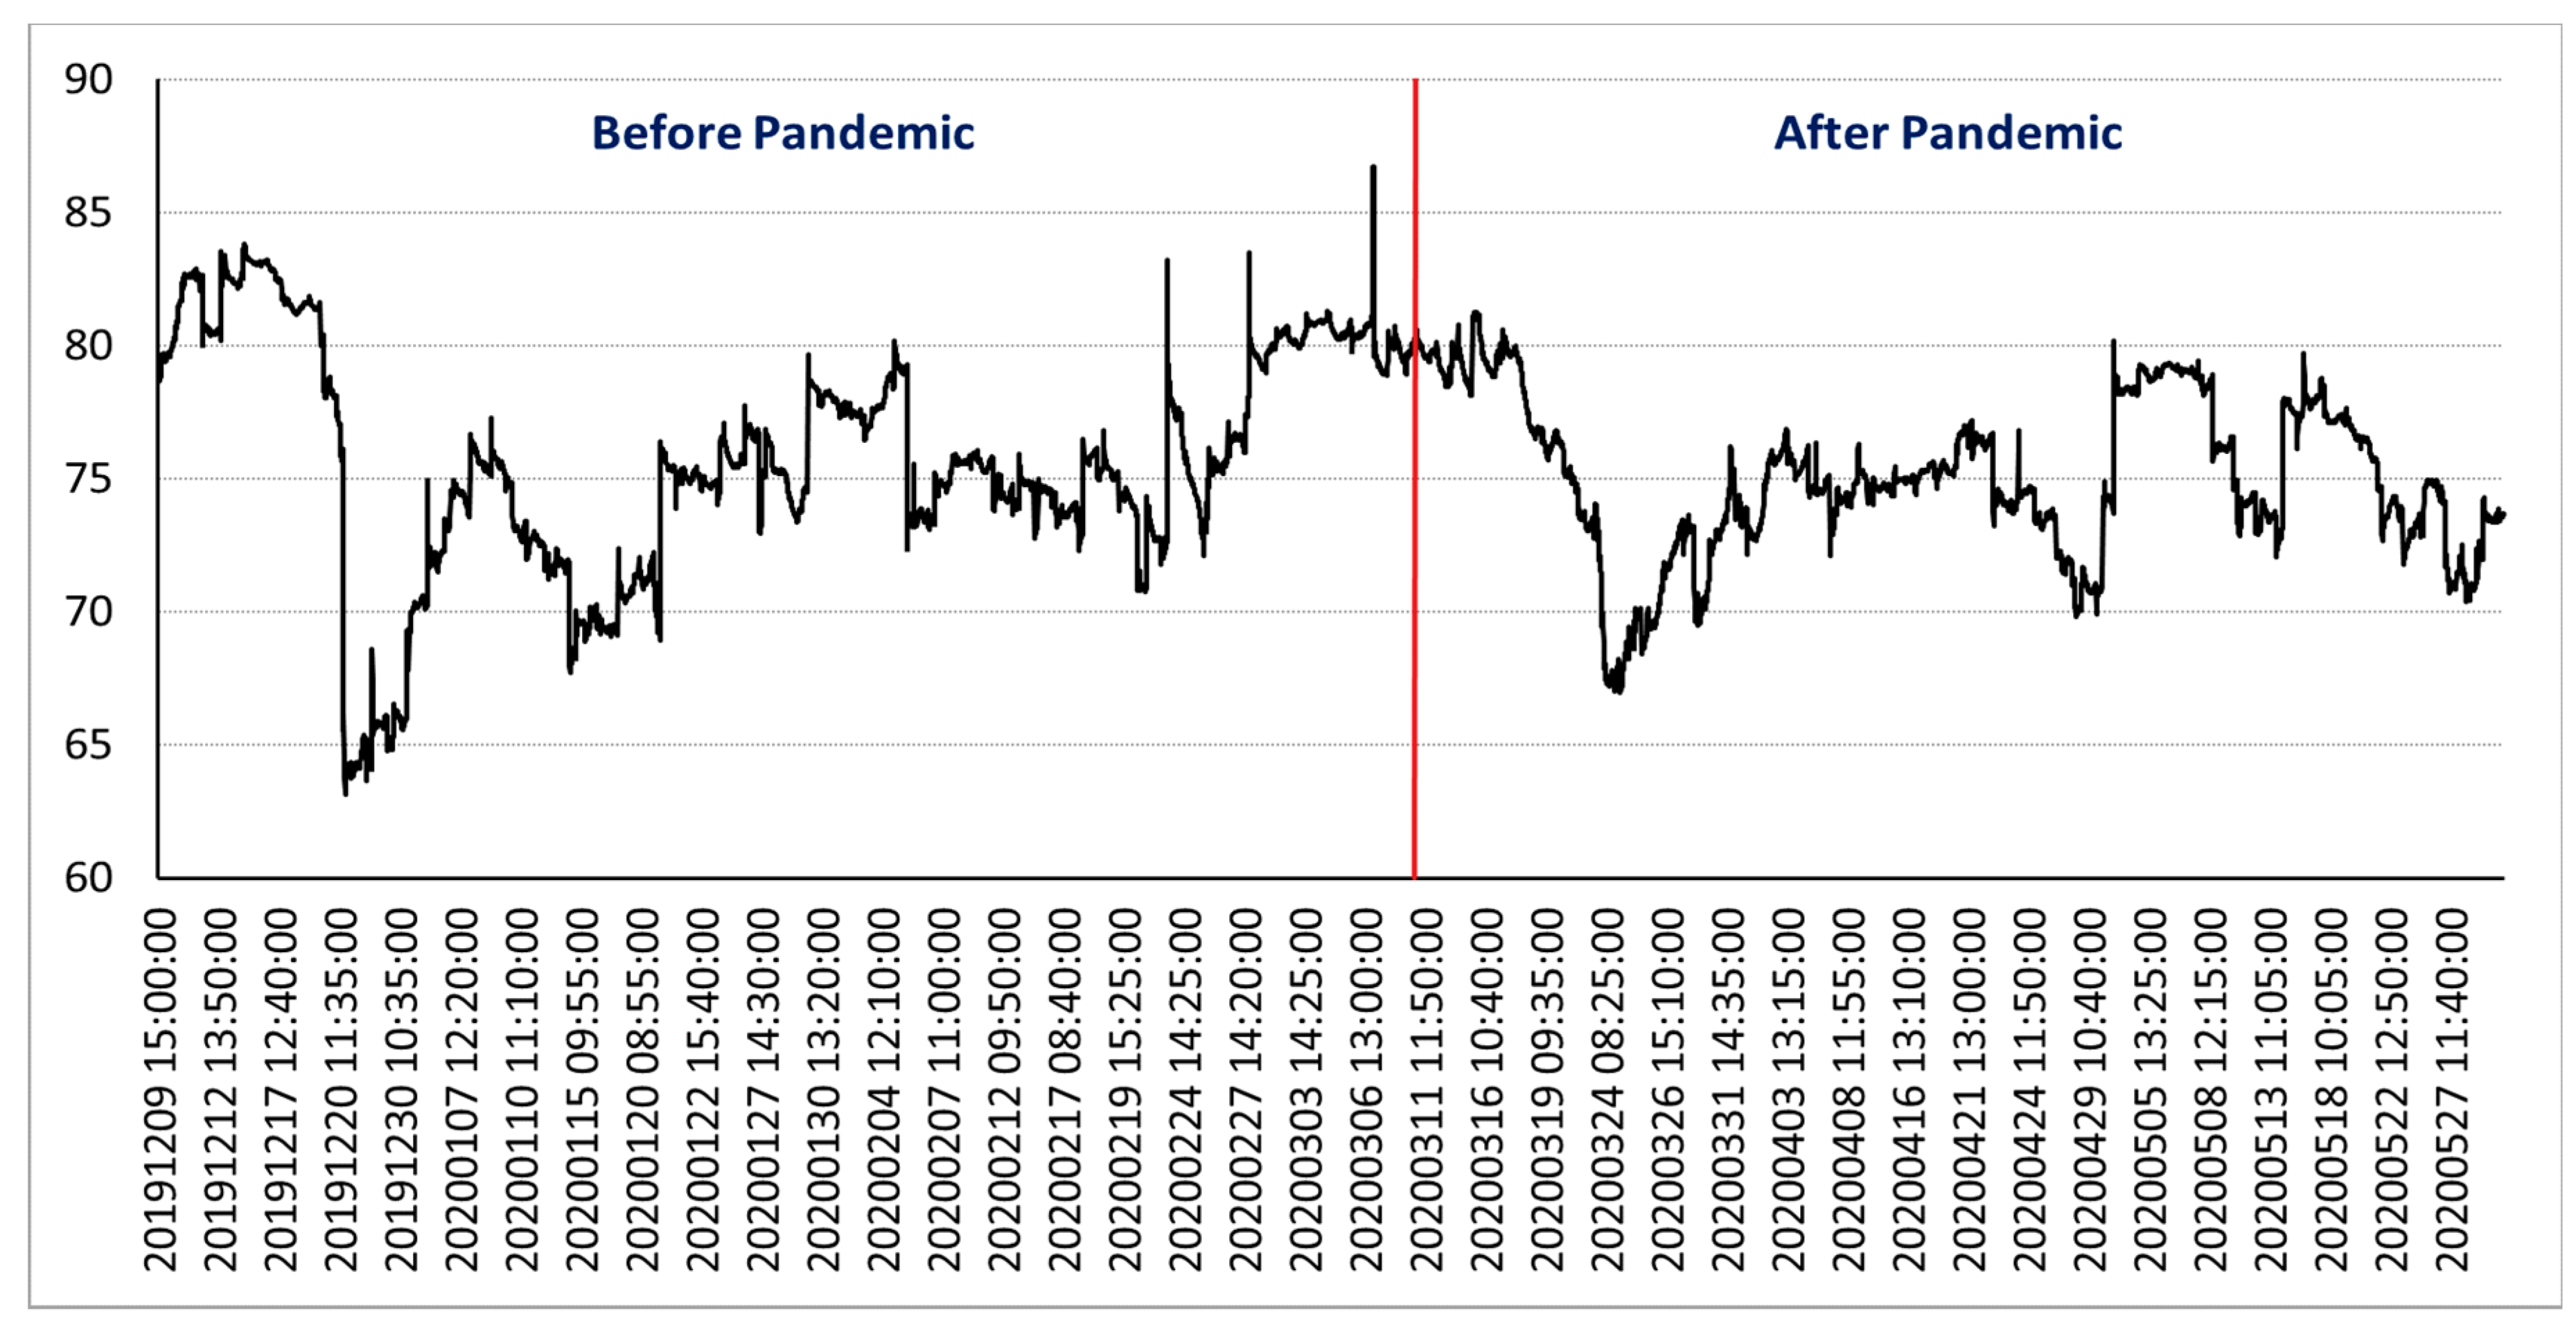
To address the evolution of COVID-19 and European stock markets, the volatility spillover is examined by using the rolling windows of 450 observations. This rolling windows estimation assesses the degree and type of spillover dynamics from December 2019 to May 2020. The results of the total spillover plot are presented in Figure 1. The total intraday volatility spillover for all selected European stock markets during the crisis gives many interesting insights. Starting with slightly below 80% in the first window, overall, it fluctuates in a range of 70% to 80%. However, the spillovers fall below 70% in January and March and exceed 80% in March and April. Most importantly, we can see two clear cycles in the total intraday spillover plot. One starts in March, has the highest peak and lowest trough and shows great fluctuation compared to the other cycle. The second cycle, relatively less peaked, begins in April and extends till the start of May. To mitigate the impacts of the COVID-19 pandemic, in March 2020, an emergency purchase package amounting to 750 billion Euros was initiated by the European Central Bank. Likewise, in April 2020 the Commission launched the Support mitigating Unemployment Risks in Emergency (SURE) program to support employment and families in need. The Commission also proposed to reallocate available structural funds to minimize the negative impacts of the COVID-19 crisis.
As previously mentioned, we split our whole sample in two sub-samples: the period before the declaration of the pandemic (from 2 December 2019 to 10 March 2020) and the period after that declaration (from 11 March 2020 to 29 May 2020). The date of the declaration is marked in Figure 1 by a vertical red line. The figure shows a significant decline in the variation of intraday volatility spillovers. Before the pandemic was declared, the volatility spillovers fluctuate from a minimum of 63.11 to a maximum of 86.74, while after 11 March 2020 this range significantly declined from a minimum of 66.97 to a maximum of 80.16. Similarly, the Variance also declined from 18.65 to 7.15 after the declaration. Although apparently the average spillover is not too different, we applied a t-test for the means, showing a significant decline in the volatility spillovers after the pandemic declaration (see these results in Table 3).
According to Corbet et al. (2020), in order to curtail the increased spillover of volatility during times of crises, policy-makers can ensure the availability of liquidity to financial markets. In fact, the European Central Bank (ECB) worked as a first line of defense against the panic in European markets and implemented different measures to ensure the existence of liquidity in markets, such as launching programs for asset purchasing or bank lending, as well as new supervisory and coordination measures. Simultaneously, governments responded quickly with significant fiscal packages in the different countries, supported by measures like SURE (Support to mitigate Unemployment Risks in an Emergency) or the European Stability Mechanism (ESM) which could have helped to decrease the volatility in stock markets.
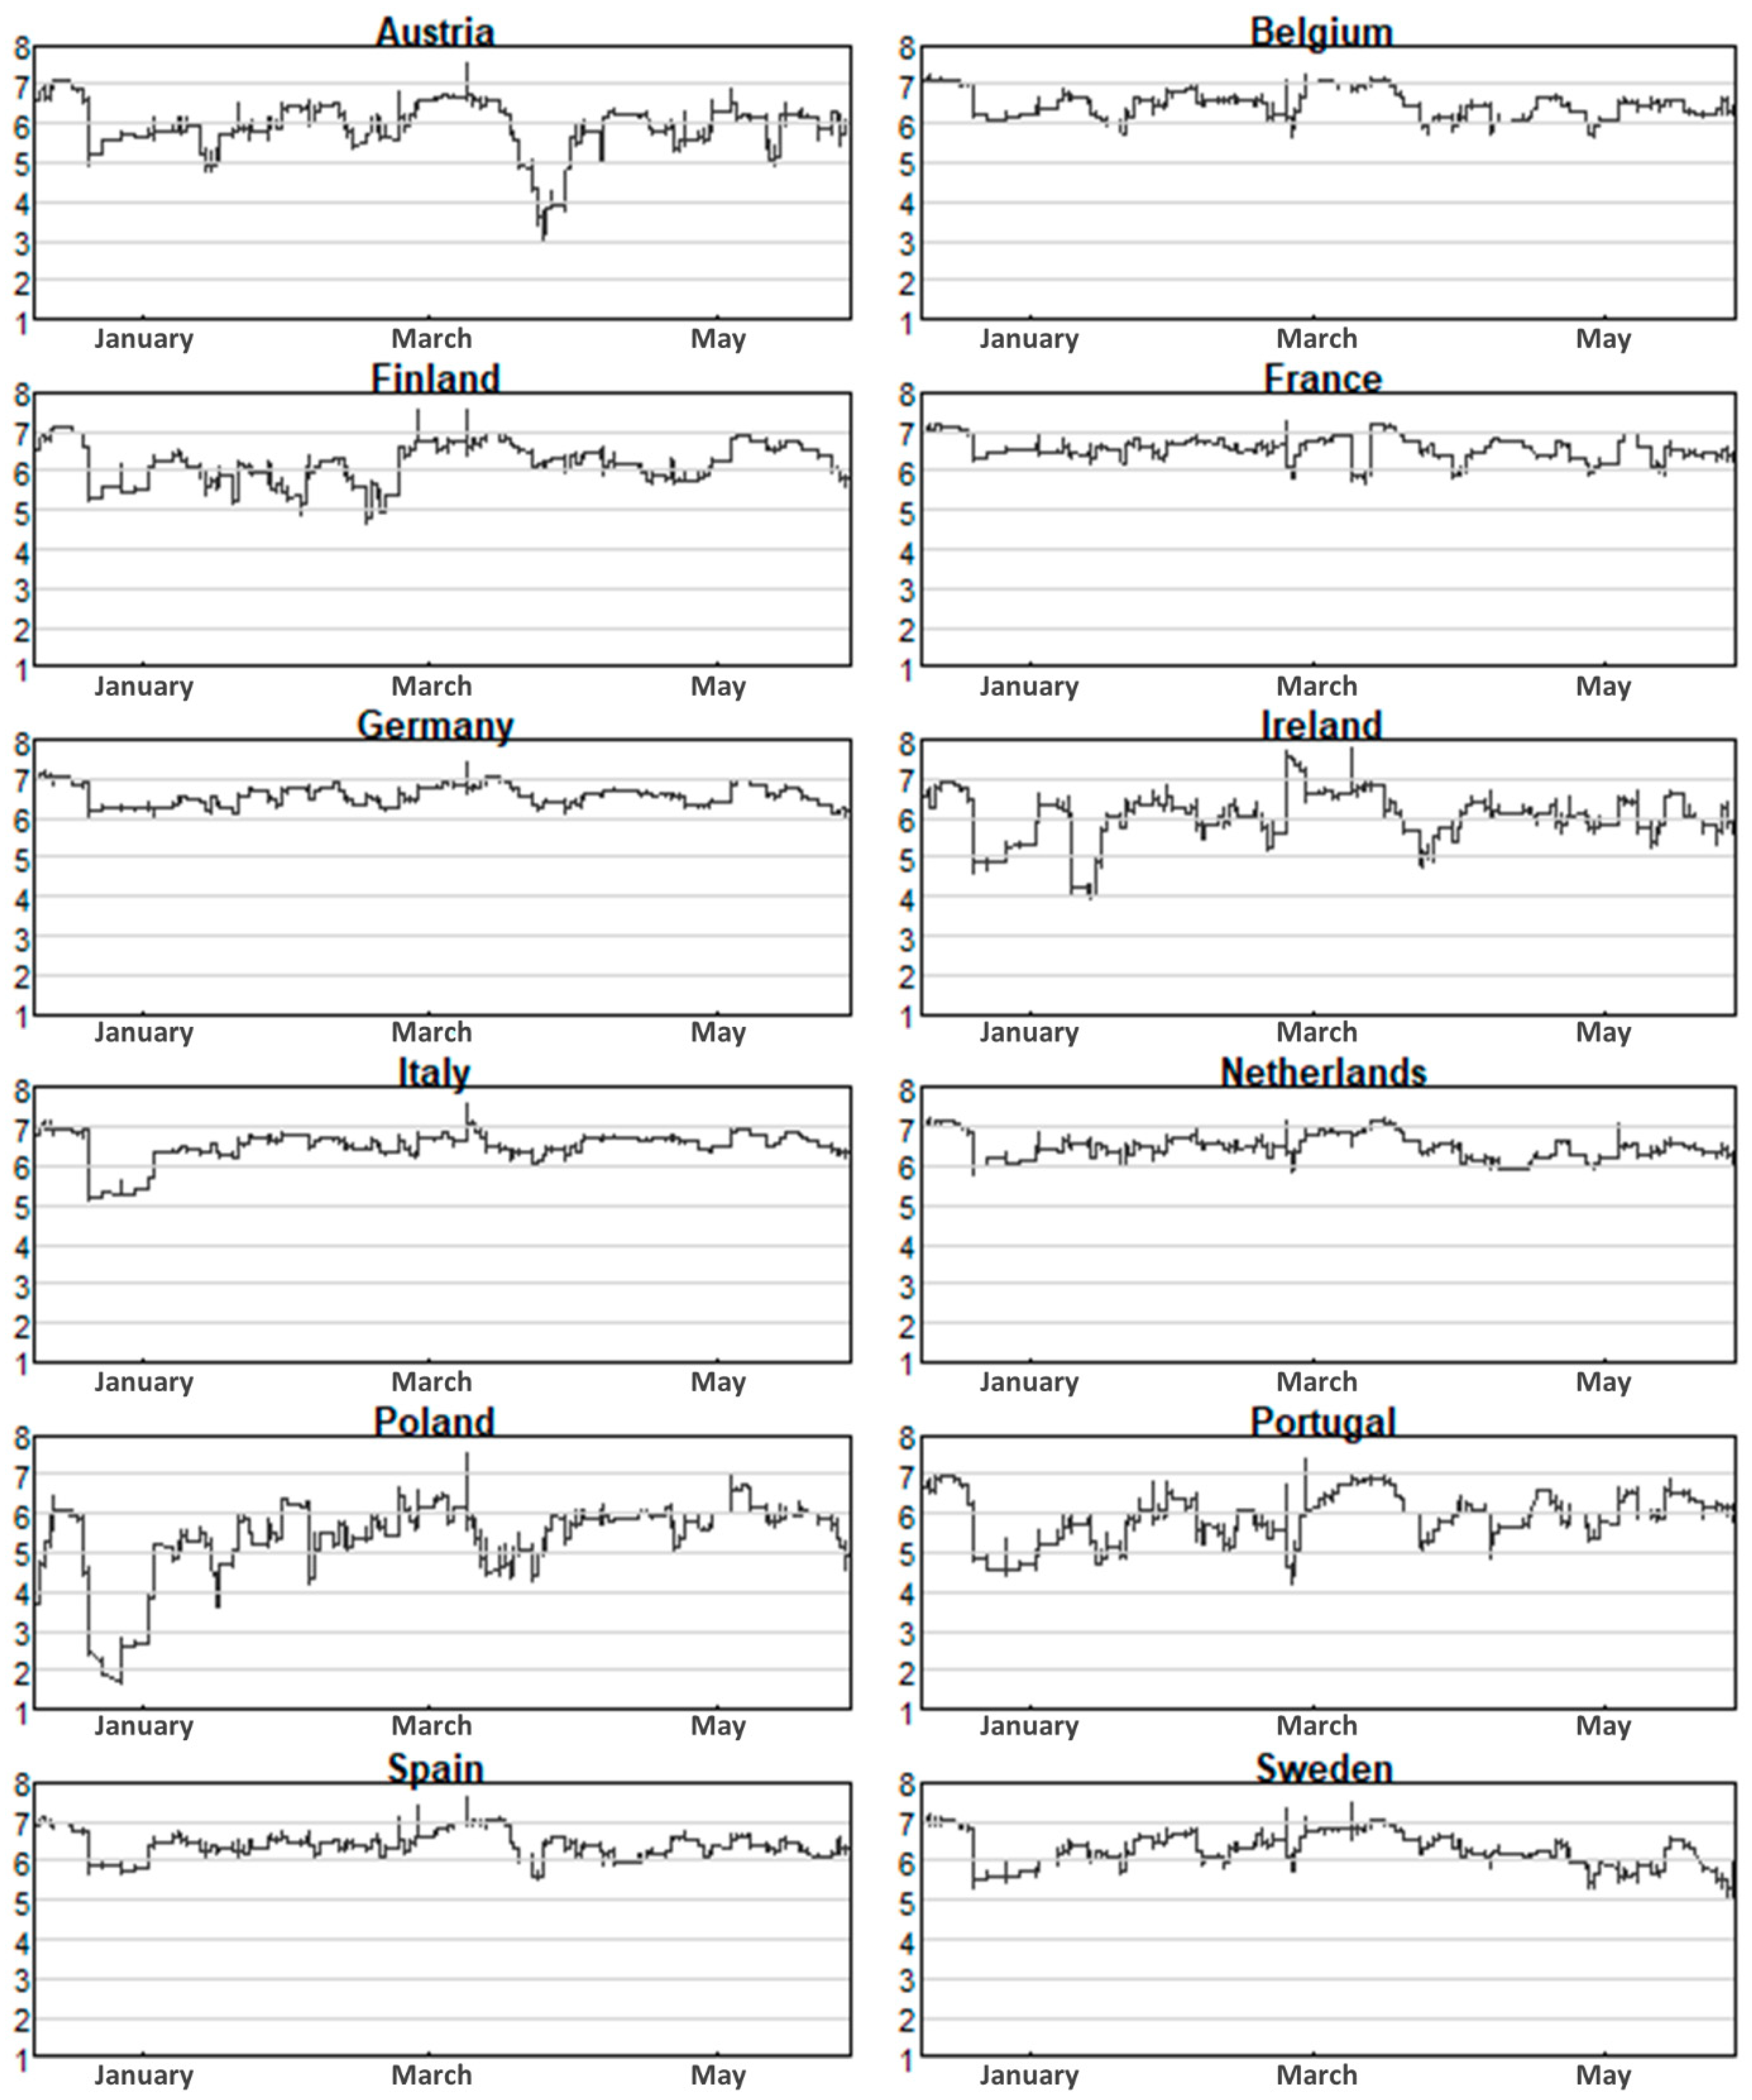
Figure 2 presents the directional volatility spillovers from each of the twelve stock markets to the other markets, which is labelled as “directional to others” in Table 4. During the Covid crisis, directional spillovers increase to approximately 7%. Within the twelve markets gross volatility spillovers from Belgium, France, Germany, the Netherlands, and Spain to the other markets are relatively larger than the spillovers from the other markets.
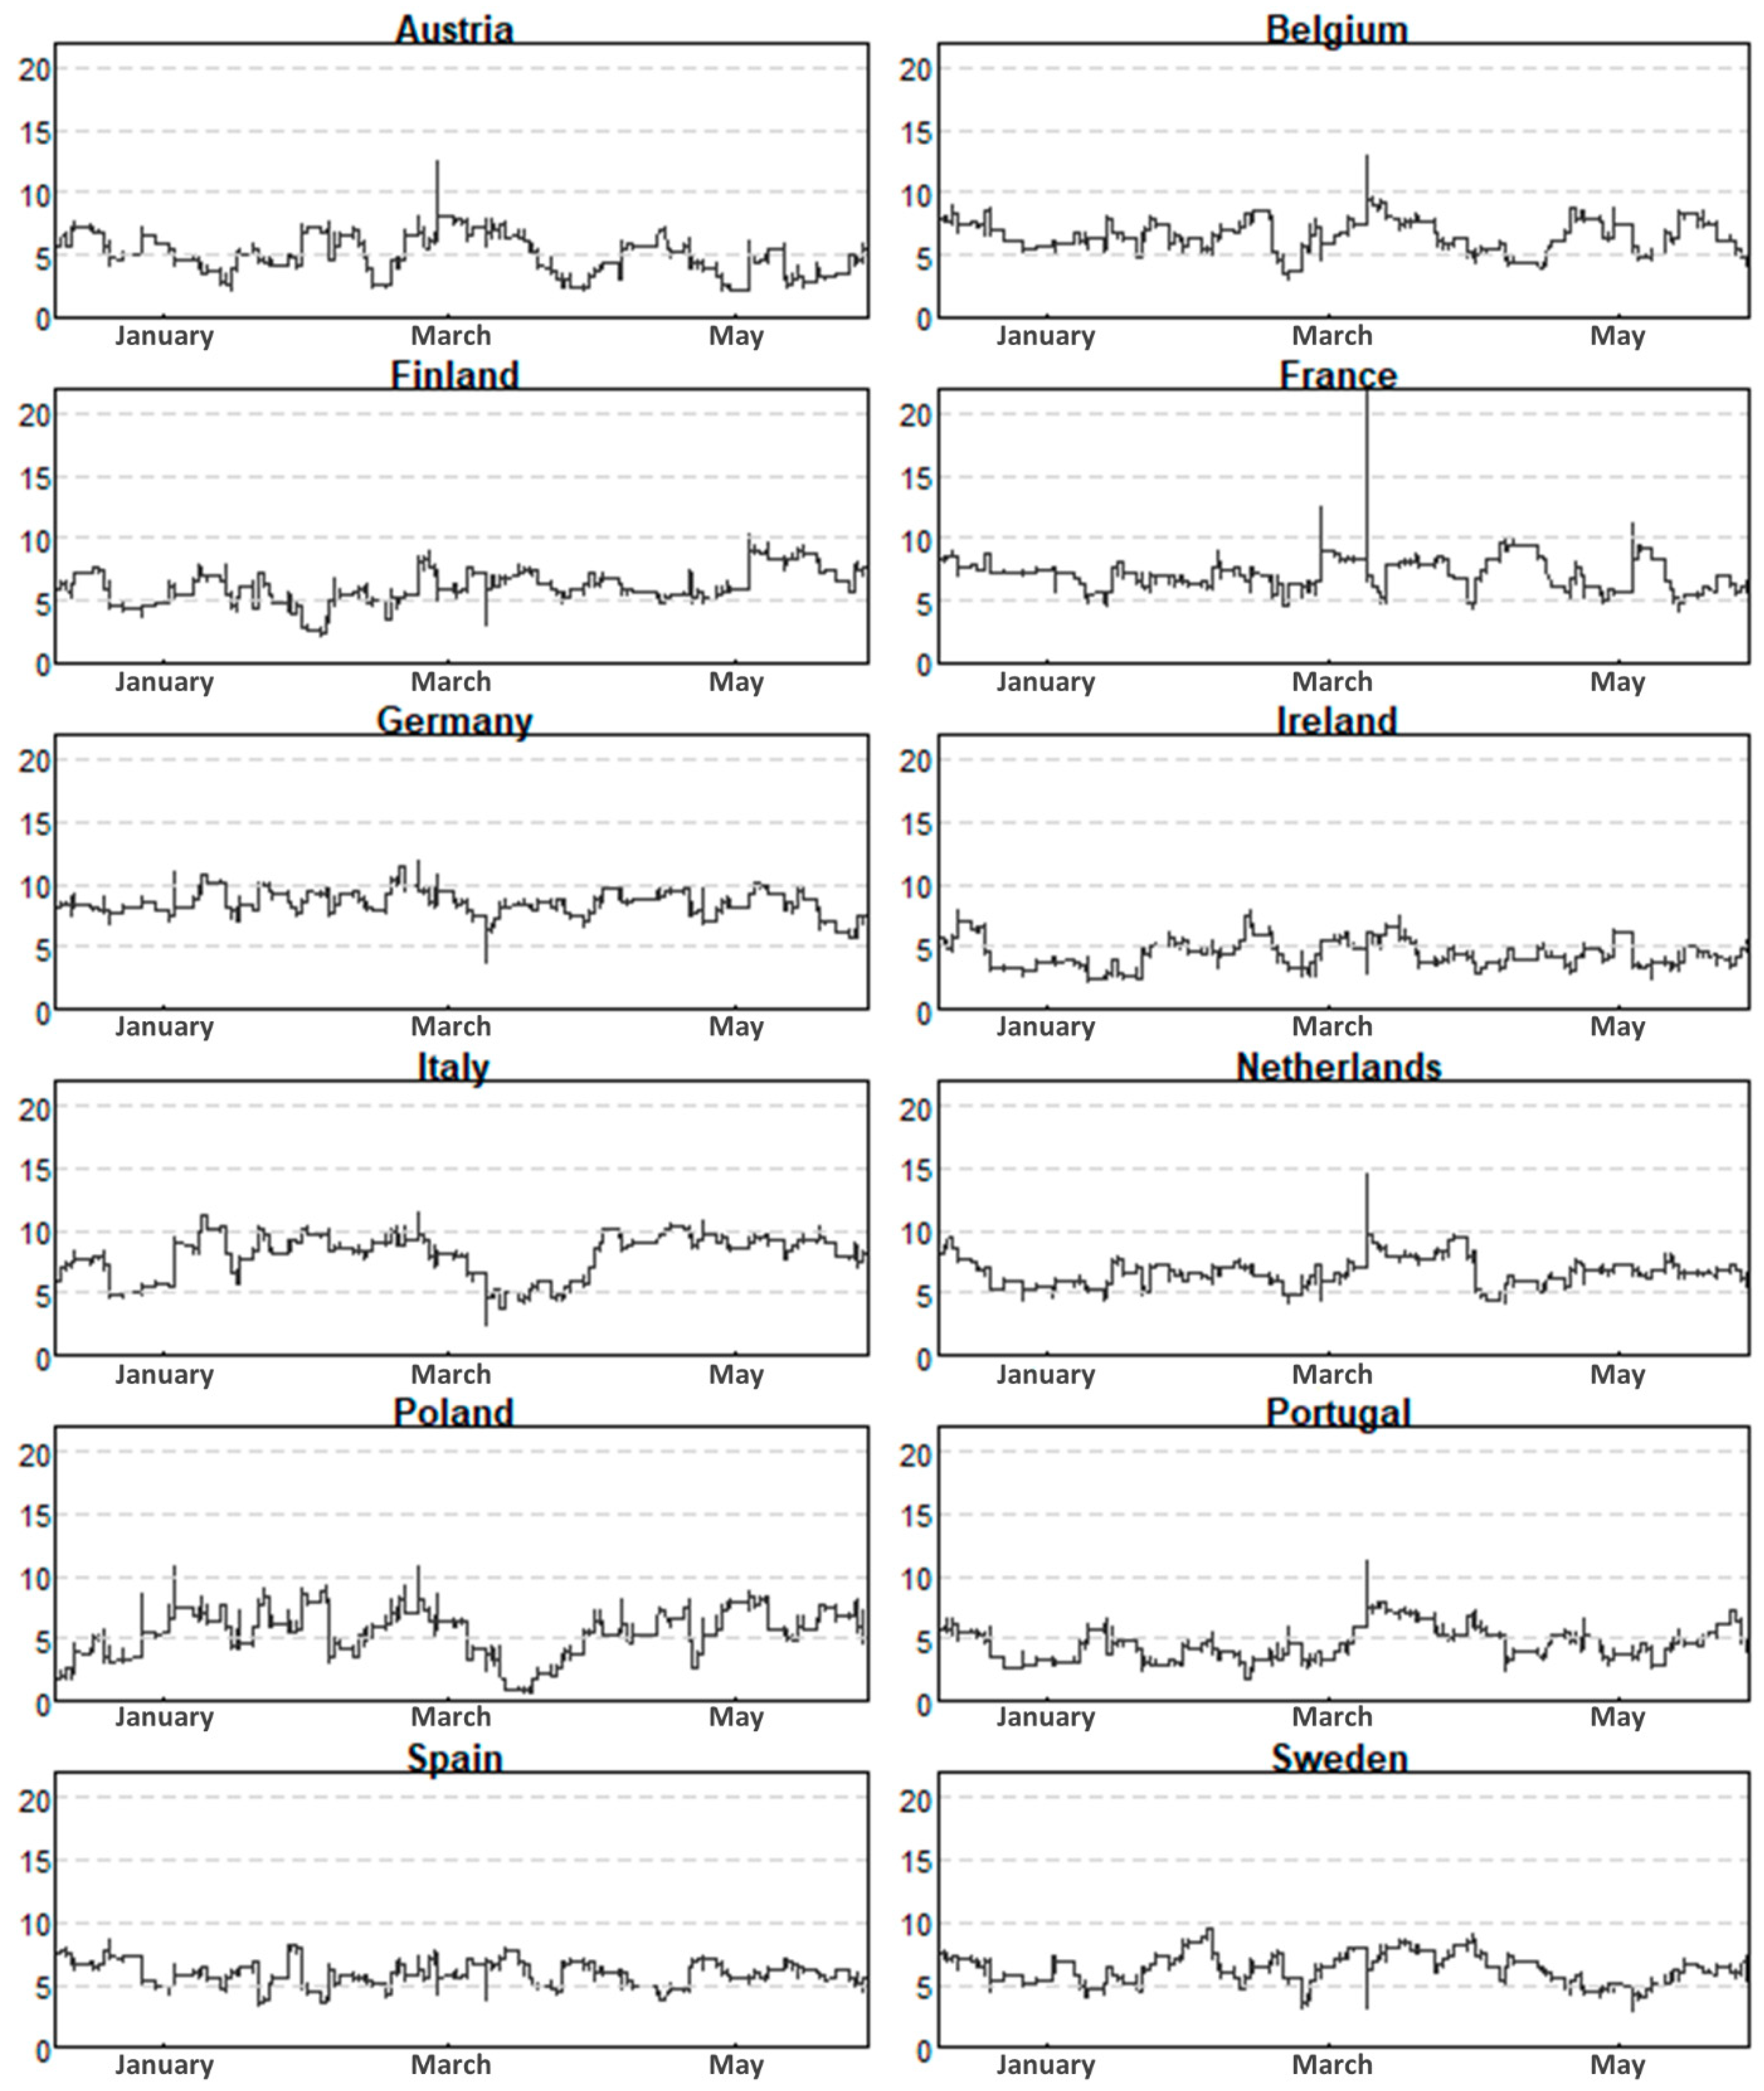
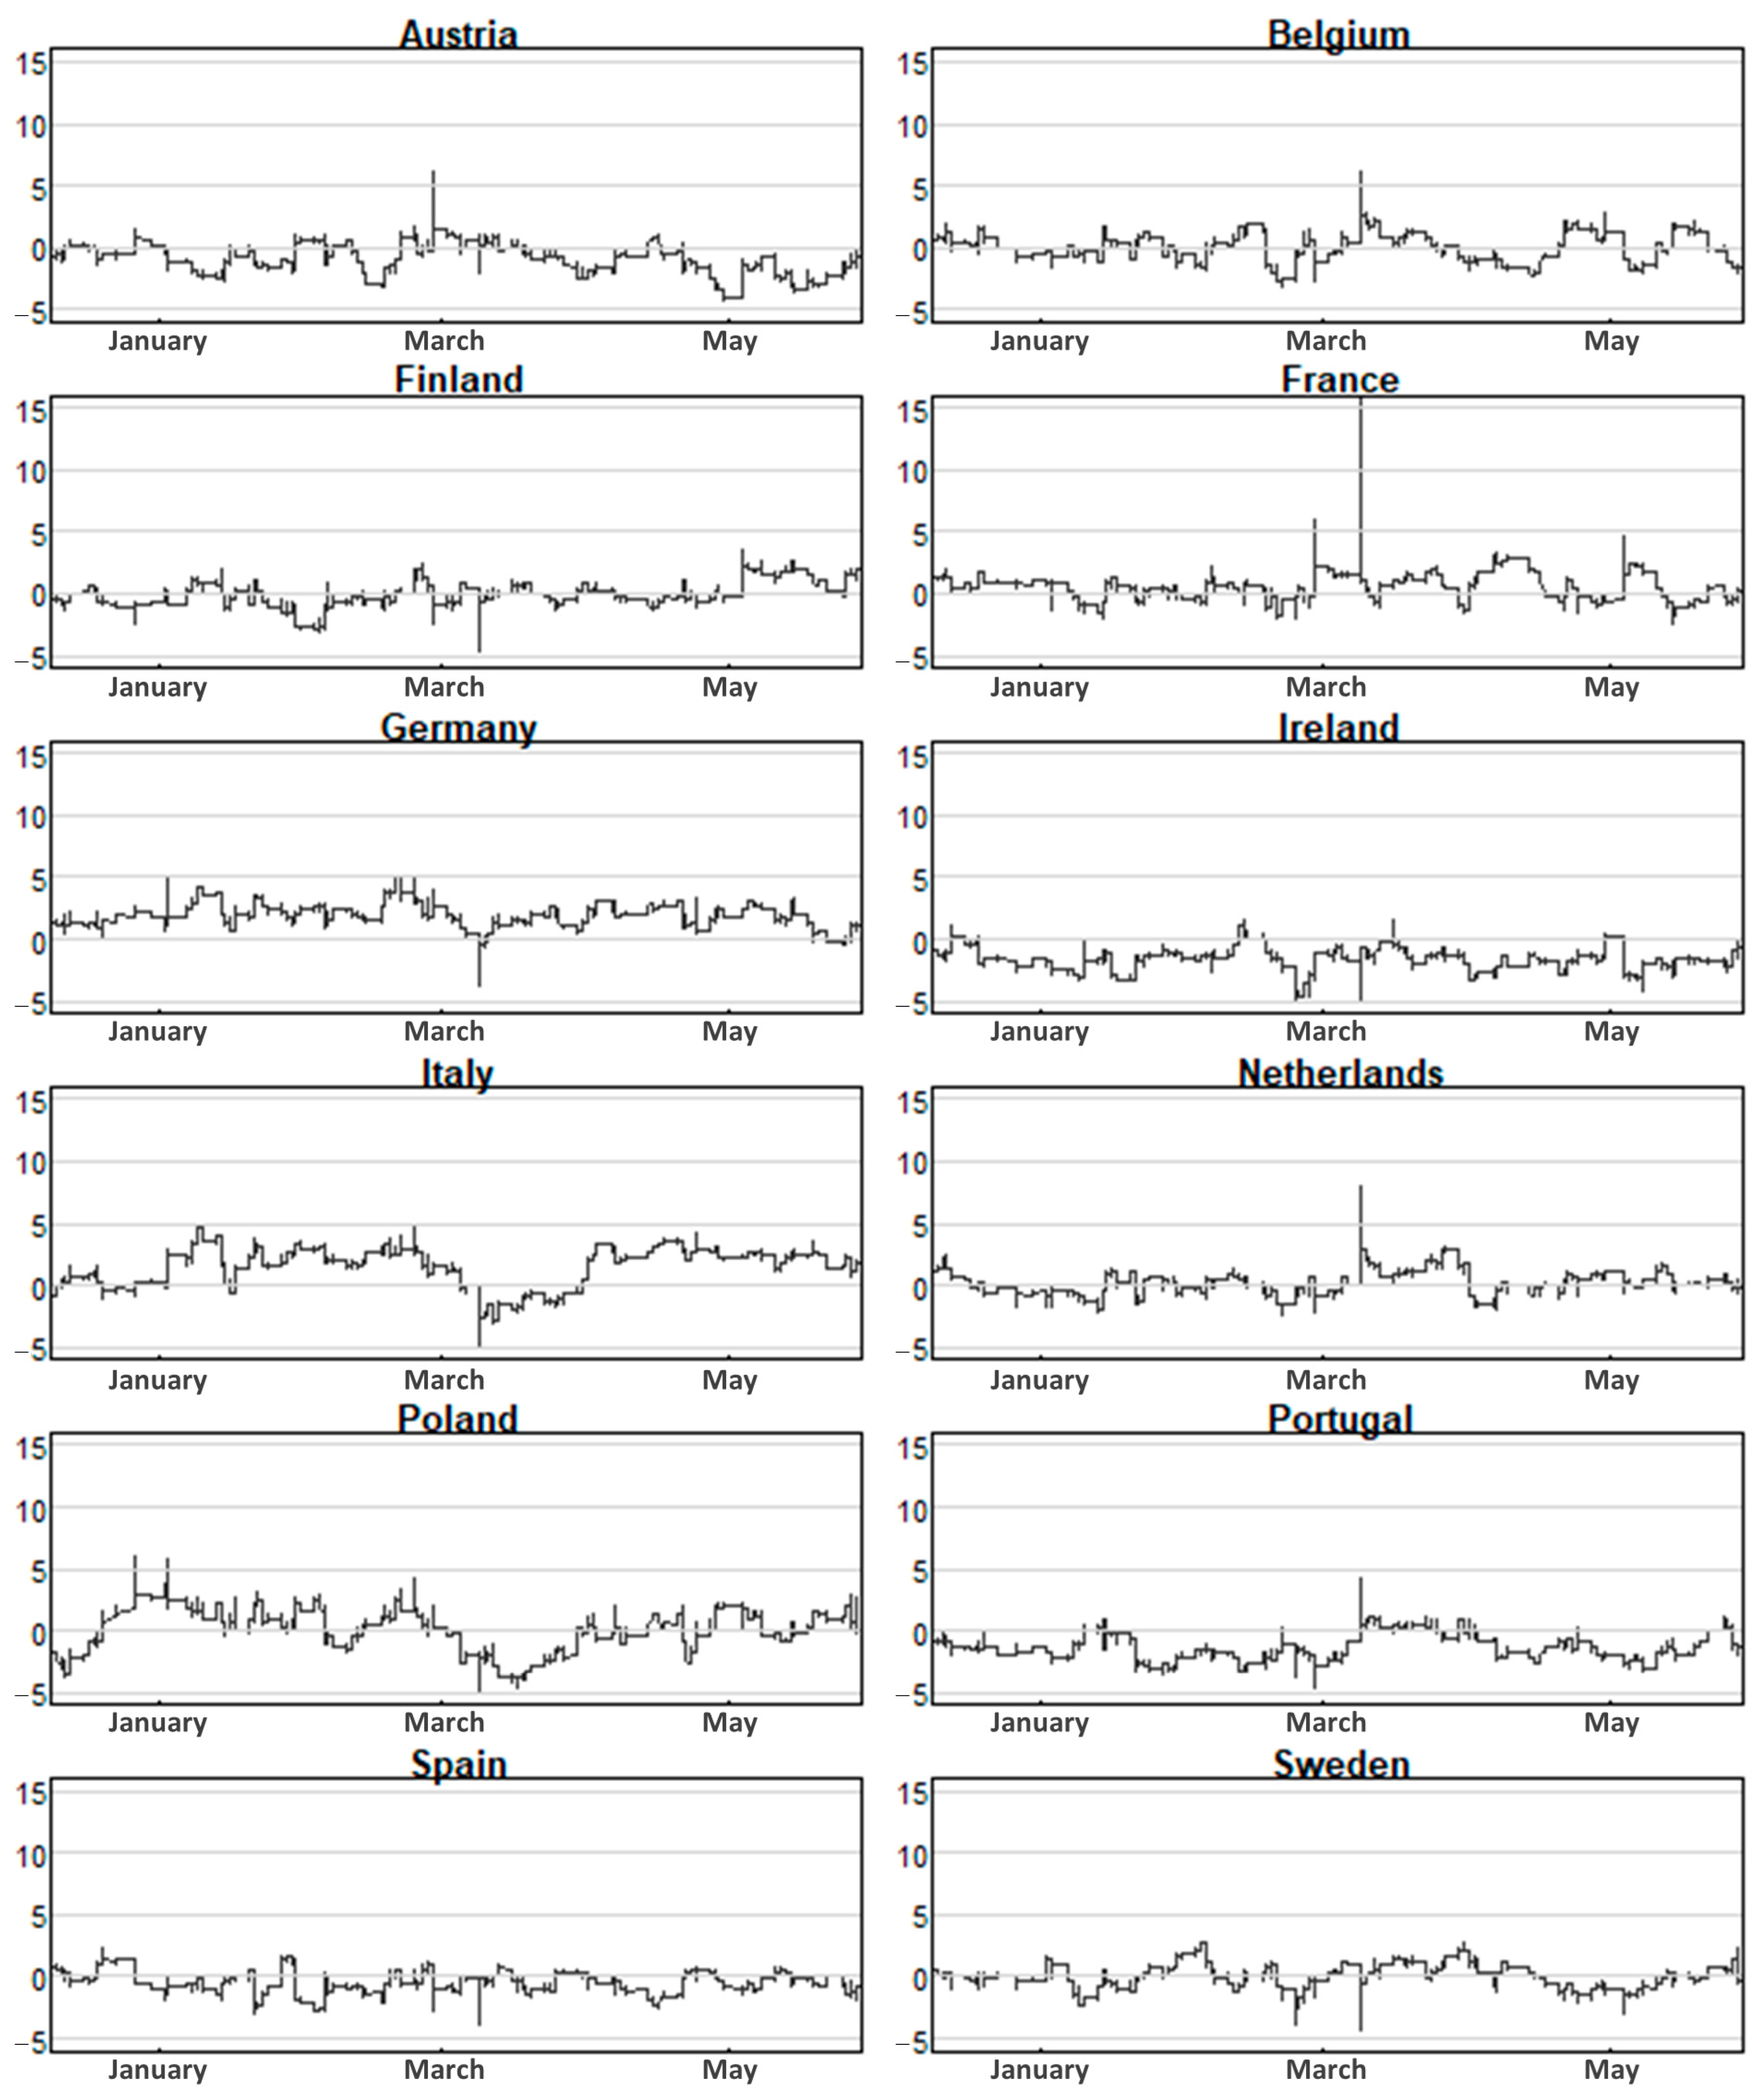
Figure 3 depicts the directional volatility spillovers from the other markets to each of the twelve European stock markets in the “directional from others” column of Table 4. This varies from 5% to 10% over time, with France increasing relatively more during the pandemic. The net directional spillover plot is in Figure 4. Every point in Figure 4 corresponds to (Equation (8)) and is the difference between the sums of the “Contribution from” column and “Contribution to” row. Furthermore, until February, there is no significant difference in any European stock market for the giving and receiving ends of net volatility transmissions. However, a dramatic change is noticed in March 2020. The net volatility spillovers remained negative throughout the crisis, climbing as high as fifteen percent in March for France.
On the receiving side of volatility spillovers, we should highlight Germany, where the economy is expected to shrink by 6.6% in 2020. According to the Institute for Economic Research (Ifo), the German economy is expected to deteriorate until the end of 2020 due to COVID-19. Several important industries including aviation, hotels, travel agencies, and tour operators reported the biggest slump during the outbreak.
According to the International Monetary Fund (IMF), uncertainty will remain in Sweden’s economy and financial markets due to COVID-19. The Swedish government took less restrictive measures than its European and Nordic neighbors. It had one of the most relaxed lockdowns in the world and drew attention to its unorthodox approach to managing the coronavirus outbreak. The government justified the decision with the view that the pandemic would last a long time. As a consequence, a very high death rate raises very serious concerns. Furthermore, manufacturing exports fall significantly in March 2020, reflected in supply chain disruptions, and weighing heavily on growth. The government failed to respond to this sudden decline in external demand because it was not determined by the country’s own containment policy. On the other hand, the Netherlands is one of the most integrated economies and somewhat more sensitive and vulnerable to a global crisis such as the COVID-19 pandemic. More than 60% of the Netherlands’ GDP consists of exports of goods and services, and this has been growing in importance in the last decade. Furthermore, the Netherlands owns a big portion of domestic and foreign assets through occupational pension funds. So far in 2020, the prices of these financial assets (notably stocks) have declined significantly. During the last events of the financial crisis 2008 and the euro area debt, a significant increase in savings was recorded in the Netherlands. This is likely to happen again, resulting in somewhat slower recovery of private consumption.
4. Discussion and Conclusions
It is important to understand the transmission of intraday cross-market volatility during this ongoing COVID-19 crisis. This study employed the methodology of Diebold and Yilmaz (2012) to estimate the gross and net directional spillovers among 12 European stock markets using high frequency data (5-min) ranging from 2 December 2019 to 29 May 2020.
The main findings reveal that during the pandemic, spillovers are the main cause of volatility forecast error variance among European stock markets, with an average of 77.78% of intraday volatility forecast error variance, in all twelve European stock markets, coming from spillovers. Overall, both the directional and total directional spillovers remain high during COVID-19. The stock markets of Sweden and the Netherlands transmit the highest intraday gross directional volatility spillovers while those of Poland and Ireland transmit minimum spillover to other European stock markets. Other stock markets transmit the highest spillover to the stock markets of Belgium and Germany with minimum spillovers to that of Poland. Our empirical findings have important implications for investors and policy-makers regarding the cross-border transmission of stock market shocks during COVID-19. The findings show that European stock markets remained integrated with increasing volatility spillovers across borders. Changes in stock prices in one country are usually translated into changes in asset prices and valuations in other European countries. The existence of volatility spillover apparently suggests a low potential for diversification. So, investors can reallocate their investments among financially interconnected countries by increasing the importance (weight) of less integrated stock markets with minimum spillover effects (Gulzar et al. 2019). Policy-makers may consider this spillover from one market to others as an important phenomenon and form strategies to watch capital flows and support the financial performance of stock markets during such a catastrophic event (Jebran et al. 2017). For instance, policy-makers should keep providing liquidity for financial markets’ stability (Akhtaruzzaman et al. 2020). There are different channels of spillovers including the portfolio effect, trade linkages, information, or policy spillovers. Additional important information for policy-makers is the “come and go” nature of foreign investors. Particularly, in European stock markets, Baele (2005) linked this spillover to market liberalization for foreign investors, which leads to volatile capital flow and results in high volatility spillover.
Topics to analyze in future research include the identification of spillover transmission channels and the role of economic fundamentals to prevent transmission of the crisis among these markets, as well as the use of a minimum underlying volatility in order to correct possible low estimated volatility levels.
Author Contributions
Conceptualization, F.A. and P.F.; data curation, F.A. and P.F.; formal analysis, F.A., P.F., and K.S.M.; methodology, F.A. and P.F.; writing—original draft, F.A., P.F., and B.B.; writing—review and editing, F.A., P.F., K.S.M., and B.B. All authors have read and agreed to the published version of the manuscript.
Funding
Paulo Ferreira acknowledges financial support from Fundação para a Ciência e a Tecnologia (grants UIDB/04007/2020 and UIDB/05064/2020).
Institutional Review Board Statement
Not applicable.
Informed Consent Statement
Not applicable.
Data Availability Statement
The data presented in this study are available on request from the corresponding author.
Conflicts of Interest
The authors declare no conflict of interest.
Appendix A
Figure A1.
Intraday Volatility of European Stock Markets during COVID-19.


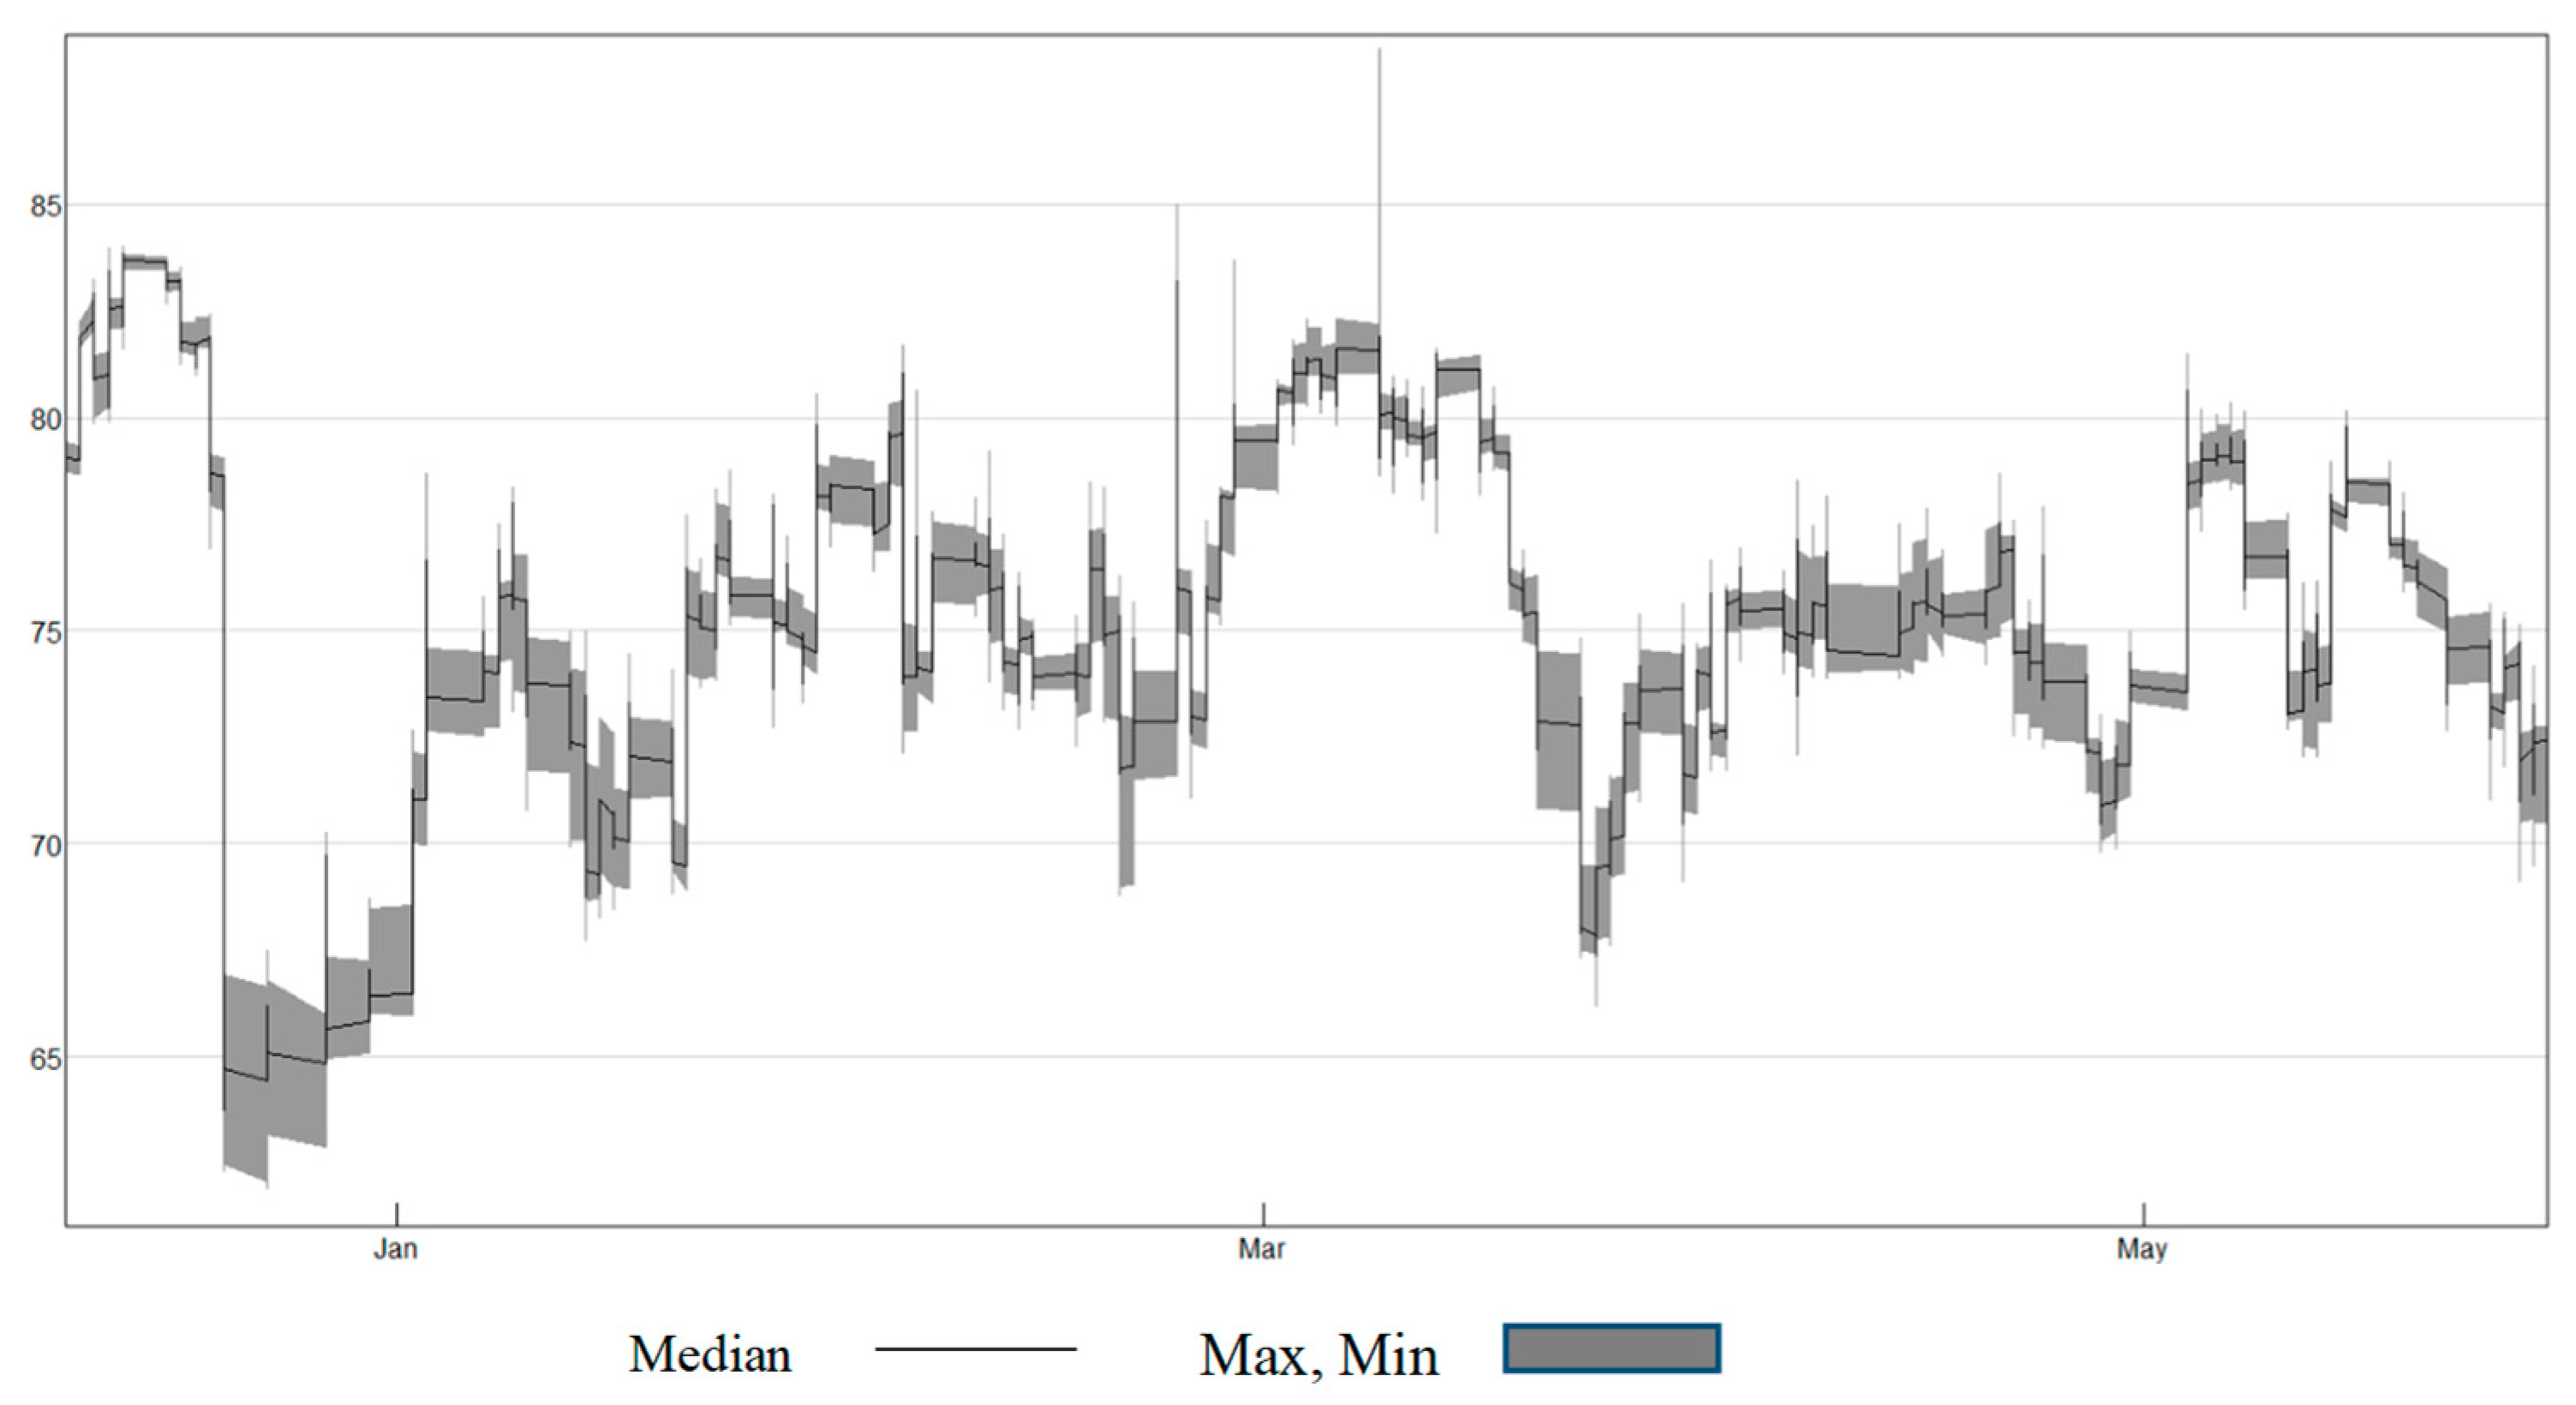
Figure A2.
Sensitivity of the index to the VAR lag (2–6) structure.

References
- Akhtaruzzaman, Md, Sabri Boubaker, and Ahmet Sensoy. 2020. Financial contagion during COVID–19 crisis. Finance Research Letters, 101604. [Google Scholar] [CrossRef]
- Ali, Mohsin, Nafis Alam, and Syed Aun R Rizvi. 2020. Coronavirus (COVID-19)–An epidemic or pandemic for financial markets. Journal of Behavioral and Experimental Finance 27: 100341. [Google Scholar] [CrossRef] [PubMed]
- Ammy-Driss, Ayoub, and Matthieu Garcin. 2020. Efficiency of the financial markets during the COVID-19 crisis: Time-varying parameters of fractional stable dynamics. arXiv arXiv:2007.10727. [Google Scholar]
- Andersen, Torben G, Tim Bollerslev, Peter Christoffersen, and Francis X Diebold. 2007. Practical volatility and correlation modeling for financial market risk management. In The Risks of Financial Institutions. Chicago: University of Chicago Press, pp. 513–48. [Google Scholar]
- Ashraf, Badar Nadeem. 2020. Stock markets’ reaction to COVID-19: Cases or fatalities? Research in International Business and Finance 54: 101249. [Google Scholar] [CrossRef]
- Aslam, Faheem, Tahir Mumtaz Awan, Jabir Hussain Syed, Aisha Kashif, and Mahwish Parveen. 2020a. Sentiments and emotions evoked by news headlines of coronavirus disease (COVID-19) outbreak. Humanities and Social Sciences Communications 7: 1–9. [Google Scholar] [CrossRef]
- Aslam, Faheem, Saqib Aziz, Duc K Nguyen, Khurrum S Mughal, and Maaz Khan. 2020b. On the Efficiency of Foreign Exchange Markets in times of the COVID-19 Pandemic. Technological Forecasting and Social Change 161: 120261. [Google Scholar] [CrossRef] [PubMed]
- Aslam, Faheem, Wahbeeah Mohti, and Paulo Ferreira. 2020c. Evidence of Intraday Multifractality in European Stock Markets during the recent Coronavirus (COVID-19) Outbreak. International Journal of Financial Studies 8: 31. [Google Scholar] [CrossRef]
- Aslam, Faheem, Francisca Nogueiro, Mariana Brasil, Paulo Ferreira, Khurram Shahzad Mughal, Beenish Bashir, and Saima Latif. 2020d. The footprints of COVID-19 on Central Eastern European stock markets: An intraday analysis. In Post-Communist Economies. pp. 1–19. [Google Scholar] [CrossRef]
- Baele, Lieven. 2005. Volatility spillover effects in European equity markets. Journal of Financial and Quantitative Analysis 40: 373–401. [Google Scholar] [CrossRef] [Green Version]
- Baker, Scott R, Nicholas Bloom, Steven J Davis, Kyle J Kost, Marco C Sammon, and Tasaneeya Viratyosin. 2020. The Unprecedented Stock Market Impact of COVID-19. National Bureau of Economic Research working paper 26945. Cambridge: National Bureau of Economic Research. [Google Scholar]
- Barro, Robert J, José F Ursúa, and Joanna Weng. 2020. The Coronavirus and the Great Influenza Pandemic: Lessons from the “Spanish flu” for the Coronavirus’s Potential Effects on Mortality and Economic Activity. National Bureau of Economic Research working paper 26866. Cambridge: National Bureau of Economic Research. [Google Scholar]
- Bekaert, Geert, Campbell R Harvey, Christian T Lundblad, and Stephan Siegel. 2013. The European Union, the Euro, and equity market integration. Journal of Financial Economics 109: 583–603. [Google Scholar] [CrossRef] [Green Version]
- Bloomberg. 2020. Perfect Storm Plunges Asia Stocks into Bear Markets One by One. Available online: https://www.bloomberg.com/news/articles/2020-03-09/perfect-storm-is-plunging-asia-stocks-to-bear-markets-one-by-one (accessed on 19 August 2020).
- Burch, Timothy R, Douglas R Emery, and Michael E Fuerst. 2016. Who Moves Markets in a Sudden Marketwide Crisis? Evidence from 9/11. Journal of Financial & Quantitative Analysis 51: 463–87. [Google Scholar]
- Chen, Ming-Hsiang, SooCheong Shawn Jang, and Woo Gon Kim. 2007. The impact of the SARS outbreak on Taiwanese hotel stock performance: An event-study approach. International Journal of Hospitality Management 26: 200–12. [Google Scholar] [CrossRef]
- Corbet, Shaen, Greg Hou, Yang Hu, Les Oxley, and Danyang Xu. 2020. Pandemic-related financial market volatility spillovers: Evidence from the Chinese COVID-19 epicentre. International Review of Economics & Finance 71: 55–81. [Google Scholar]
- Del Giudice, Alfonso, and Andrea Paltrinieri. 2017. The impact of the Arab Spring and the Ebola outbreak on African equity mutual fund investor decisions. Research in International Business and Finance 41: 600–12. [Google Scholar] [CrossRef]
- Diebold, Francis X, and Kamil Yilmaz. 2009. Measuring financial asset return and volatility spillovers, with application to global equity markets. The Economic Journal 119: 158–71. [Google Scholar] [CrossRef] [Green Version]
- Diebold, Francis X, and Kamil Yılmaz. 2012. Better to give than to receive: Predictive directional measurement of volatility spillovers. International Journal of Forecasting 28: 57–66. [Google Scholar] [CrossRef] [Green Version]
- Diebold, Francis X, and Kamil Yılmaz. 2014. On the network topology of variance decompositions: Measuring the connectedness of financial firms. Journal of Econometrics 182: 119–34. [Google Scholar] [CrossRef] [Green Version]
- Elliot, Larry. 2020. Prepare for the coronavirus global recession. In The Guardian. Media report. London: CNN. [Google Scholar]
- Finta, Marinela Adriana, and Sofiane Aboura. 2020. Risk premium spillovers among stock markets: Evidence from higher-order moments. Journal of Financial Markets 49: 100533. [Google Scholar] [CrossRef]
- Garcin, Matthieu, Jules Klein, and Sana Laaribi. 2020. Estimation of time-varying kernel densities and chronology of the impact of COVID-19 on financial markets. arXiv arXiv:2007.09043. [Google Scholar]
- Gulzar, Saqib, Ghulam Mujtaba Kayani, Hui Xiaofen, Usman Ayub, and Amir Rafique. 2019. Financial cointegration and spillover effect of global financial crisis: A study of emerging Asian financial markets. Economic research-Ekonomska istraživanja 32: 187–218. [Google Scholar] [CrossRef] [Green Version]
- Horowit, J. 2020. The Global Coronavirus Recession is Beginning. Media report. London: CNN. [Google Scholar]
- Hou, Yang Greg, and Steven Li. 2020. Volatility and skewness spillover between stock index and stock index futures markets during a crash period: New evidence from China. International Review of Economics & Finance 66: 166–88. [Google Scholar]
- Hung, Ngo Thai. 2020. Dynamic spillover effects between oil prices and stock markets: New evidence from pre and during COVID-19 outbreak. AIMS Energy 8: 819. [Google Scholar] [CrossRef]
- Ichev, Riste, and Matej Marinc. 2018. Stock prices and geographic proximity of information: Evidence from the Ebola outbreak. International Review of Financial Analysis 56: 153–66. [Google Scholar] [CrossRef]
- Jebran, Khalil, Shihua Chen, Irfan Ullah, and Sultan Sikandar Mirza. 2017. Does volatility spillover among stock markets varies from normal to turbulent periods? Evidence from emerging markets of Asia. The Journal of Finance and Data Science 3: 20–30. [Google Scholar] [CrossRef]
- Jiang, Yonghong, Yuyuan Fu, and Weihua Ruan. 2019. Risk spillovers and portfolio management between precious metal and BRICS stock markets. Physica A: Statistical Mechanics and its Applications 534: 120993. [Google Scholar] [CrossRef]
- Kang, Sang Hoon, Gazi Salah Uddin, Victor Troster, and Seong-Min Yoon. 2019. Directional spillover effects between ASEAN and world stock markets. Journal of Multinational Financial Management 52: 100592. [Google Scholar] [CrossRef]
- Koop, Gary, M Hashem Pesaran, and Simon M Potter. 1996. Impulse response analysis in nonlinear multivariate models. Journal of Econometrics 74: 119–47. [Google Scholar] [CrossRef]
- Lin, Wen-Ling, Robert F Engle, and Takatoshi Ito. 1994. Do bulls and bears move across borders? International transmission of stock returns and volatility. Review of Financial Studies 7: 507–38. [Google Scholar] [CrossRef]
- Maier, Benjamin F, and Dirk Brockmann. 2020. Effective containment explains subexponential growth in recent confirmed COVID-19 cases in China. Science 368: 742–46. [Google Scholar] [CrossRef] [PubMed] [Green Version]
- McIver, Ron P, and Sang Hoon Kang. 2020. Financial crises and the dynamics of the spillovers between the US and BRICS stock markets. Research in International Business and Finance 54: 101276. [Google Scholar] [CrossRef]
- McKibbin, Warwick J, and David Vines. 2020. Global macroeconomic cooperation in response to the COVID-19 pandemic: A roadmap for the G20 and the IMF. Oxford Review of Economic Policy 36: S297–S337. [Google Scholar] [CrossRef]
- Mensi, Walid, Shawkat Hammoudeh, and Sang Hoon Kang. 2017. Risk spillovers and portfolio management between developed and BRICS stock markets. The North American Journal of Economics and Finance 41: 133–55. [Google Scholar] [CrossRef]
- Mensi, Walid, Ferihane Zaraa Boubaker, Khamis Hamed Al-Yahyaee, and Sang Hoon Kang. 2018. Dynamic volatility spillovers and connectedness between global, regional, and GIPSI stock markets. Finance Research Letters 25: 230–38. [Google Scholar] [CrossRef]
- Nicola, Maria, Zaid Alsafi, Catrin Sohrabi, Ahmed Kerwan, Ahmed Al-Jabir, Christos Iosifidis, Maliha Agha, and Riaz Agha. 2020. The socio-economic implications of the coronavirus pandemic (COVID-19): A review. International Journal of Surgery 78: 185. [Google Scholar] [CrossRef]
- Nippani, Srinivas, and Kenneth M Washer. 2004. SARS: A non-event for affected countries’ stock markets? Applied Financial Economics 14: 1105–10. [Google Scholar] [CrossRef]
- Nishimura, Yusaku, Yoshiro Tsutsui, and Kenjiro Hirayama. 2018. Do international investors cause stock market spillovers? Comparing responses of cross-listed stocks between accessible and inaccessible markets. Economic Modelling 69: 237–48. [Google Scholar] [CrossRef]
- OECD. 2020. Global Financial Markets Policy Responses to COVID-19” March 2020. Available online: https://www.oecd.org/coronavirus/policy-responses/global-financial-markets-policy-responses-to-covid-19-2d98c7e0/ (accessed on 19 August 2020).
- Parkinson, Michael. 1980. The extreme value method for estimating the variance of the rate of return. Journal of business 53: 61–65. [Google Scholar] [CrossRef]
- Pesaran, H Hashem, and Yongcheol Shin. 1998. Generalized impulse response analysis in linear multivariate models. Economics Letters 58: 17–29. [Google Scholar] [CrossRef]
- Sharif, Arshian, Chaker Aloui, and Larisa Yarovaya. 2020. COVID-19 pandemic, oil prices, stock market, geopolitical risk and policy uncertainty nexus in the US economy: Fresh evidence from the wavelet-based approach. International Review of Financial Analysis 70: 101496. [Google Scholar] [CrossRef]
- Su, Xianfang. 2020. Measuring extreme risk spillovers across international stock markets: A quantile variance decomposition analysis. The North American Journal of Economics and Finance 51: 101098. [Google Scholar] [CrossRef]
- The Economist. 2020a. Spread and Stutter. Available online: https://www.economist.com/finance-and-economics/2020/02/27/markets-wake-up-with-a-jolt-to-the-implications-of-covid-19 (accessed on 19 August 2020).
- The Economist. 2020b. The Right Medicine for the World Economy. Available online: https://www.economist.com/leaders/2020/03/05/the-right-medicine-for-the-world-economy (accessed on 19 August 2020).
- The Economist. 2020c. Sneezy Money. Available online: https://espresso.economist.com/b0b9da81cf357c8884a06de8ef72bea0 (accessed on 19 August 2020).
- The Economist. 2020d. Tracking the Economic Impact of Covid-19 in Real Time. Available online: https://www.economist.com/united-states/2020/03/14/tracking-the-economic-impact-of-covid-19-in-real-time (accessed on 19 August 2020).
- The Guardian. 2020. FTSE 100 Suffers Worst Quarter since 1987 as Covid-19 Recession Looms—As it Happened. Available online: https://www.theguardian.com/business/live/2020/mar/31/china-economy-picks-up-covid-19-german-unemployment-us-confidence-stock-markets-business-live (accessed on 19 August 2020).
- Topcu, Mert, and Omer Serkan Gulal. 2020. The impact of COVID-19 on emerging stock markets. Finance Research Letters 36: 101691. [Google Scholar] [CrossRef]
- WHO. 2020a. Public Health Emergency of International Concern Declared. Available online: https://www.who.int/docs/default-source/coronaviruse/transcripts/ihr-emergency-committee-for-pneumonia-due-to-the-novel-coronavirus-2019-ncov-press-briefing-transcript-30012020.pdf?sfvrsn=c9463ac1_2 (accessed on 19 August 2020).
- WHO. 2020b. WHO Characterizes COVID-19 as a Pandemic. Available online: https://www.who.int/docs/default-source/coronaviruse/transcripts/who-audio-emergencies-coronavirus-press-conference-full-and-final-11mar2020.pdf?sfvrsn=cb432bb3_2 (accessed on 19 August 2020).
- Xu, Yajing, Saiping Li, Xiong Xiong, and Fei Ren. 2017. Intraday Volatility Spillover between the Shanghai and Hong Kong Stock Markets—Evidence from A+ H Shares after the Launch of the Shanghai-Hong Kong Stock Connect. Journal of Management Science and Engineering 2: 290–317. [Google Scholar] [CrossRef]
- Yarovaya, Larisa, Ahmed H Elsayed, and Shawkat M Hammoudeh. 2020. Searching for Safe Havens during the COVID-19 Pandemic: Determinants of Spillovers between Islamic and Conventional Financial Markets. Available online: https://papers.ssrn.com/sol3/papers.cfm?abstract_id=3634114 (accessed on 19 August 2020).
- Zhang, Dayong, Min Hu, and Qiang Ji. 2020. Financial markets under the global pandemic of COVID-19. Finance Research Letters 36: 101528. [Google Scholar] [CrossRef]
Figure 1.
Total Intraday volatility spillovers for all 12 European Stock Markets during COVID-19. (11 March 2020).
Figure 1.
Total Intraday volatility spillovers for all 12 European Stock Markets during COVID-19. (11 March 2020).

Figure 2.
Intraday Directional volatility spillovers, FROM all Stock Markets during COVID-19.

Figure 3.
Intraday Directional volatility spillovers, TO all Stock Markets during COVID-19.

Figure 4.
Net Intraday volatility spillovers in European Markets during COVID-19.


Table 1.
Country Specific Details.
| Sr. | Countries | Region | Stock Market Symbol | Number of COVID-19 Cases * |
|---|---|---|---|---|
| 1 | Austria | Western Europe | ATX | 89,496 |
| 2 | Belgium | Western Europe | BFX | 368,337 |
| 3 | Finland | Northern Europe | OMX | 15,566 |
| 4 | France | Western Europe | FCHI | 1,235,132 |
| 5 | Germany | Western Europe | GDAXI | 482,355 |
| 6 | Ireland | Northern Europe | ISEQ | 59,434 |
| 7 | Italy | Southern Europe | FTMIB | 589,766 |
| 8 | Netherlands | Western Europe | AEX | 319,991 |
| 9 | Poland | Eastern Europe | WIG | 319,205 |
| 10 | Portugal | Southern Europe | PSI | 128,392 |
| 11 | Spain | Southern Europe | IBEX | 1,194,681 |
| 12 | Sweden | Northern Europe | OMX | 117,913 |
* As at 29 October 2020. Source: https://www.worldometers.info/coronavirus/.
Table 2.
Descriptive Statistics of stock market volatility.
| Mean | Median | Maximum | Minimum | Std. Dev. | Skewness | Kurtosis | |
|---|---|---|---|---|---|---|---|
| Austria | 0.0108 | 0.0067 | 0.3916 | 0.0002 | 0.0135 | 7.1718 | 120.3540 |
| Belgium | 0.0110 | 0.0069 | 0.1488 | 0.0003 | 0.0121 | 3.0378 | 14.3959 |
| Finland | 0.0092 | 0.0058 | 0.2760 | 0.0003 | 0.0109 | 5.4823 | 66.7437 |
| France | 0.0118 | 0.0072 | 0.6939 | 0.0002 | 0.0158 | 11.8236 | 370.2963 |
| Germany | 0.0123 | 0.0072 | 0.3849 | 0.0002 | 0.0165 | 6.7773 | 92.0665 |
| Ireland | 0.0116 | 0.0078 | 0.2246 | 0.0002 | 0.0123 | 4.1836 | 37.2131 |
| Italy | 0.0126 | 0.0077 | 0.3693 | 0.0002 | 0.0169 | 6.7171 | 84.9397 |
| Netherlands | 0.0109 | 0.0067 | 0.2087 | 0.0003 | 0.0126 | 3.5357 | 22.2254 |
| Poland | 0.0096 | 0.0060 | 0.2227 | 0.0002 | 0.0120 | 5.1959 | 47.3502 |
| Portugal | 0.0092 | 0.0059 | 0.1406 | 0.0001 | 0.0104 | 3.4241 | 18.6832 |
| Spain | 0.0114 | 0.0073 | 0.2096 | 0.0004 | 0.0125 | 3.5045 | 22.4803 |
| Sweden | 0.0105 | 0.0069 | 0.1490 | 0.0003 | 0.0113 | 3.2874 | 17.6739 |
Table 3.
t-Test: Two-Sample Assuming Unequal Variances.
| Before | After | |
|---|---|---|
| Mean | 75.7278 | 74.5561 |
| Variance | 18.6478 | 7.1473 |
| Range | 23.6219 | 13.1974 |
| Minimum | 63.1159 | 66.9676 |
| Maximum | 86.7378 | 80.1650 |
| Observations | 5646 | 4444 |
| t Stat | 0.0000 | |
| P(Tą ≤ t) one-tail | 1.6450 | |
| t Critical one-tail | 0.0000 | |
| P(T ≤ t) two-tail | 1.9602 |
Table 4.
Intraday Volatility Spillover among 12 European Stock Markets.
| Austria | Belgium | Finland | France | Germany | Ireland | Italy | Netherlands | Poland | Portugal | Spain | Sweden | FROM | |
|---|---|---|---|---|---|---|---|---|---|---|---|---|---|
| Austria | 27.29 | 6.84 | 6.64 | 6.95 | 9.37 | 5.07 | 8.04 | 6.07 | 5.87 | 6.49 | 5.51 | 5.87 | 72.71 |
| Belgium | 5.43 | 19.28 | 6.44 | 7.98 | 7.62 | 5.99 | 5.86 | 11.19 | 4.10 | 7.58 | 9.13 | 9.39 | 80.72 |
| Finland | 5.76 | 7.78 | 21.69 | 6.03 | 9.63 | 5.13 | 7.81 | 8.02 | 5.78 | 6.89 | 6.86 | 8.62 | 78.31 |
| France | 5.49 | 9.08 | 5.40 | 20.96 | 9.71 | 4.66 | 6.33 | 12.11 | 3.59 | 6.48 | 7.96 | 8.24 | 79.04 |
| Germany | 6.15 | 6.68 | 7.57 | 8.60 | 19.38 | 4.37 | 11.58 | 7.99 | 6.27 | 5.6 | 7.21 | 8.58 | 80.62 |
| Ireland | 6.14 | 8.30 | 6.68 | 6.25 | 7.78 | 24.16 | 5.86 | 8.93 | 4.28 | 6.94 | 6.93 | 7.75 | 75.84 |
| Italy | 6.29 | 6.51 | 7.33 | 7.77 | 13.56 | 4.02 | 20.69 | 7.07 | 6.71 | 6.03 | 7.00 | 7.03 | 79.31 |
| Netherlands | 4.18 | 10.63 | 5.56 | 9.89 | 7.61 | 5.93 | 4.89 | 19.75 | 3.01 | 7.34 | 9.92 | 11.28 | 80.25 |
| Poland | 6.28 | 5.76 | 7.48 | 5.35 | 10.47 | 3.82 | 9.34 | 5.45 | 30.14 | 5.50 | 4.50 | 5.92 | 69.86 |
| Portugal | 5.67 | 9.18 | 6.64 | 7.39 | 7.20 | 5.24 | 6.55 | 9.55 | 4.25 | 22.43 | 7.84 | 8.06 | 77.57 |
| Spain | 4.94 | 9.74 | 5.83 | 7.36 | 7.85 | 5.25 | 6.27 | 11.4 | 3.17 | 7.59 | 20.22 | 10.38 | 79.78 |
| Sweden | 4.31 | 8.91 | 6.31 | 6.95 | 8.73 | 5.60 | 5.87 | 12.38 | 3.69 | 6.87 | 9.97 | 20.41 | 79.59 |
| Directional TO Others | 60.64 | 89.41 | 71.87 | 80.53 | 99.54 | 55.09 | 78.39 | 100.16 | 50.73 | 73.32 | 82.81 | 91.12 | 933.61 |
| Directional Including Own | 87.93 | 108.69 | 93.56 | 101.49 | 118.91 | 79.25 | 99.08 | 119.92 | 80.87 | 95.75 | 103.03 | 111.54 | 77.80% |
| NET Directional Connectedness | −12.07 | 8.69 | −6.44 | 1.49 | 18.91 | −20.75 | −0.92 | 19.92 | −19.13 | −4.25 | 3.03 | 11.54 | 77.80 |
Publisher’s Note: MDPI stays neutral with regard to jurisdictional claims in published maps and institutional affiliations. |
© 2021 by the authors. Licensee MDPI, Basel, Switzerland. This article is an open access article distributed under the terms and conditions of the Creative Commons Attribution (CC BY) license (http://creativecommons.org/licenses/by/4.0/).
Share and Cite
MDPI and ACS Style
Aslam, F.; Ferreira, P.; Mughal, K.S.; Bashir, B. Intraday Volatility Spillovers among European Financial Markets during COVID-19. Int. J. Financial Stud. 2021, 9, 5. https://0-doi-org.brum.beds.ac.uk/10.3390/ijfs9010005
AMA Style
Aslam F, Ferreira P, Mughal KS, Bashir B. Intraday Volatility Spillovers among European Financial Markets during COVID-19. International Journal of Financial Studies. 2021; 9(1):5. https://0-doi-org.brum.beds.ac.uk/10.3390/ijfs9010005
Chicago/Turabian StyleAslam, Faheem, Paulo Ferreira, Khurrum Shahzad Mughal, and Beenish Bashir. 2021. "Intraday Volatility Spillovers among European Financial Markets during COVID-19" International Journal of Financial Studies 9, no. 1: 5. https://0-doi-org.brum.beds.ac.uk/10.3390/ijfs9010005
Note that from the first issue of 2016, this journal uses article numbers instead of page numbers. See further details here.