Article

Do Green Bonds Act as a Hedge or a Safe Haven against Economic Policy Uncertainty? Evidence from the USA and China

1
Department of Management Sciences, Comsats University Islamabad, Islamabad 45550, Pakistan
2
Department of Occupational Therapy, Faculty of Associated Medical Sciences, Chiang Mai University, Chiang Mai 50200, Thailand
3
Asia-Australia Business College, Liaoning University, Shenyang 110036, China
*
Author to whom correspondence should be addressed.
Int. J. Financial Stud. 2021, 9(3), 40; https://0-doi-org.brum.beds.ac.uk/10.3390/ijfs9030040
Submission received: 1 June 2021 / Revised: 24 July 2021 / Accepted: 24 July 2021 / Published: 1 August 2021
(This article belongs to the Special Issue COVID-19 and the Stability of the Financial System)

Abstract

:
Economic policy uncertainty and particularly COVID-19 has stimulated the need to investigate alternative avenues for policy risk management. In this context, this study examines the dynamic association among economic policy uncertainty, green bonds, clean energy stocks, and global rare earth elements. A dynamic conditional correlation-multivariate generalized autoregressive conditional heteroscedasticity (DCC-MGARCH) model was used to gauge the time-varying co-movements among these indices. The analysis finds that green bonds act more as a hedge than a safe haven against economic policy uncertainty (EPU). In the case of diversification, green bonds work as diversifiers with clean energy stocks and rare earth elements during COVID-19 and in the whole sample period. Additionally, clean energy stocks and rare earth elements show safe haven properties against EPUs. This study contributes to the hedging and safe haven literature with some new insight considering the role of green bonds and clean energy stocks. Additionally, the outcomes of the research contribute toward the literature of portfolio diversification theory. These findings pave the way for not only US investors to hedge long-term economic policy risk by investing in green bonds, but also for China and the UK, as these financial assets (green bonds, clean energy stocks, and rare earth metals) and EPU are long-term financial and economic variables.

1. Introduction

Economic policy uncertainty (EPU) is termed an independent nature of risk associated with the financial system of countries due to the undefined pathways of fiscal, monetary, and other regulatory policies (Baker et al. 2016). Security-specific risk is often easier to diversify than systematic risks, such as EPU. Financial integration and global trade wars among countries have increased economic policy uncertainty (Al-Thaqeb and Algharabali 2019; Wang et al. 2019a). Moreover, the current COVID-19 crisis continues to raise economic policy uncertainty in the United States, and appears to be a more catastrophic event than the global financial crisis and European debt crisis (Baker et al. 2020). Interestingly, the COVID-19 crisis damaged the financial market far more than any other pandemic in the past, including the Spanish flu. Higher economic policy uncertainty curbs the flow of investment (Bernanke 1983; Kido 2016), and investors (regardless of type; institutional or individual) always look to eliminate the risk associated with their investment. Therefore, the current financial and economic crisis due to COVID-19 remains a heated topic among scholars and policymakers around the world (Abdelrhim et al. 2020).
Previously, researchers have investigated the hedging ability of financial assets such as cryptocurrency commodities and international stocks against inflation, EPU (Cheng and Yen 2019; Yen and Cheng 2020), global EPU (Al Mamun et al. 2020; Shaikh 2020; Su et al. 2020), and VIX (Bouri et al. 2017a; Kalyvas et al. 2020; Wang et al. 2019b). Very few studies have examined green bonds, such as the correlation patterns of green bonds and conventional bonds (Nguyen et al. 2020), green bonds and black bonds (Broadstock and Cheng 2019), pricing spillover from green bonds and financial markets (Reboredo 2018; Saeed et al. 2020a, 2020b), and the yield spread of US green and conventional municipal bonds and the impact of green bonds market liquidity on the green bonds yield (Karpf and Mandel 2018). However, the investigation of the hedging and safe haven properties of green bonds against economic policy uncertainty has been previously ignored, as the emerging green bonds market requires further econometric investigation and more empirical evidence. Moreover, the linkage of environmentally friendly securities and macroeconomic variables can serve as a novel line of inquiry (Broadstock and Cheng 2019). Due to the worldwide impact, the literature on the risk management strand has started to grow quickly. The correlation between financial and non-financial firms has experienced a surge, and increased the optimal hedge ratio to a higher hedging cost during the COVID-19 (Akhtaruzzaman et al. 2021a). During the COVID-19 period, the oil industry received higher benefits while the financial industry and oil consumers reacted negatively during oil price shocks (Akhtaruzzaman et al. 2020). Interestingly, (Akhtaruzzaman et al. 2021b) investigated the safe haven properties of gold in multiple phases during the COVID-19; they found a mixture of risk mitigation patterns, as gold proved a safe haven during the first phase and lost in the second phase.
Previous literature is limited to discussing the risk management role of gold (Akhtaruzzaman et al. 2021b; Paule-Vianez et al. 2020; Qin et al. 2020; Wu et al. 2019), cryptocurrencies (Baur and Hoang 2020; Dwita Mariana et al. 2020; Haq and Aftab, forthcoming; Paule-Vianez et al. 2020; Qin et al. 2020; Wu et al. 2019) against economic policy uncertainty. Therefore, this research has two main purposes. The primary purpose of this paper is to explore sustainable risk management avenues (green bonds, clean energy stocks, and rare earth elements) against the economic policy uncertainty of the USA, China, and the United Kingdom. Moreover, the secondary purpose is to investigate the diversification properties between green bonds, clean energy stocks, and rare earth elements. This research is conducted to answer the question of how green bonds, clean energy stocks, and rare earth elements are correlated with economic policy uncertainty and each other over time.
Green bonds offer potential pathways for risk management and diversification as they fulfill both needs for investors, such as environmental protection and financial resources (Huynh et al. 2020). Green bonds can improve the overall performance of the environment and provide returns to investors (Flammer 2019; Maltais and Nykvist 2020). Recently, stock exchanges have introduced specific green bonds segments; moreover, since its inception in 2007, the green bonds market has been growing in size and significance for institutions and individual investors (Febi et al. 2018; Reboredo and Ugolini 2020; Tang and Zhang 2020). Therefore, this may help green bonds become a sustainable and well-established investment instrument (Maltais and Nykvist 2020). Green bonds are better performing financial instruments than conventional bonds (Kanamura 2020), and their correlation is sensitive to changes in economic policy uncertainty (Broadstock and Cheng 2019).
Rare earth elements (REEs) have become attractive due to their progressive mining, production, and recycling activities in recent years. REEs were discovered in 1788 and, until the 1950s, the worldwide production of RREs and their utilization rate was less than 5 thousand metric tons (Zhou et al. 2017), even if the REEs were scarcely used in our everyday lives (Klinger and Svensson 2015). According to Zhou et al. (2017), the worldwide consumption rate for REEs has increased rapidly as rare earth elements (REEs) have certain electromagnetic and conductive properties, and these properties are salient features in a broad range of applications, i.e., wind turbines, photovoltaic cells, aircraft engines, mobile phones, electric vehicle batteries, LEDs, drill bits for oil, natural gas mining, and many others. Based on these properties, in the 21st century, the usage of rare earth elements escalated due to the transformation of traditional industries into the manufacturing of highly technological products (Li et al. 2019; Wang et al. 2015).
This study follows the definitions of (Baur and Lucey 2010; Bouri et al. 2017b) to define hedges, diversifiers, and safe havens. Green bonds and rare earth elements have not been sufficiently investigated as hedges, diversifiers, and safe havens against economic policy uncertainty and other green stocks, such as clean energy stocks (Dutta et al. 2020; Dawar et al. 2021), although green bonds have recently received attention from researchers in the diversification strand (Huynh et al. 2020; Reboredo 2018; Reboredo et al. 2020; Reboredo and Ugolini 2020; Saeed et al. 2020a).
This paper contributes to the related literature in at least three ways. First, it is the first attempt to capture the dynamic conditional co-movements between green bonds and economic policy uncertainty. Overall, green bonds show negative correlation patterns with EPUs. Second, this study tests the hedging role of green bonds against the economic policy uncertainty of China, the UK, and the USA, and the diversification properties of green bonds against clean energy stocks and global rare earth elements. Third, despite the hedging and diversification role of green bonds, this study also uncovers the safe haven role of green bonds under the shadow of COVID-19. This work adds a novel addition to the safe haven literature, as it is the first to consider the safe haven role of green bonds, clean energy stocks, and rare earth elements against the economic policy uncertainty of China, the UK, and the USA, which adds to a recent study by (Bouri et al. 2021). Additionally, these findings provide support in the shadow of modern portfolio or portfolio diversification theory1. Hedging and diversification properties support the portfolio theory and offer some new insight and avenues regarding risk mitigation in green finance.
The empirical results demonstrate dynamic conditional correlations among US green bonds, US clean energy stocks, global rare earth elements, and EPUs (USA, China, and UK). Firstly, green bonds demonstrated a positive correlation with US EPU, however a negative correlation with China EPU and UK EPU indexes in full sample estimation, implying that they play a hedging role against the economic policy uncertainty of China and the UK, but not the USA. This is due to the fact that the volatility of green bonds may prone to economic policy uncertainty of the USA, therefore green bonds were not proven as a hedge. Moreover, clean energy stocks proved a strong hedge against the economic policy risk, however a weak hedge against China EPU. Thirdly, the index of global rare earth elements proved a strong hedge against the economic policy uncertainty of China and the UK. However, a positive association between US-EPU and global rare earth elements implies that US EPU may prone to the volatility of global rare earth elements due to the monopolistic control of China over rare earth elements. Therefore, it removes the hedging ability of global rare earth elements against US EPU. A positive, but not perfectly positive correlation between green bonds, clean energy stocks, and rare earth elements suggests that these can be used as diversifiers with one another. The financial assets also demonstrated similar correlation patterns during the COVID-19 pandemic. Moreover, green bonds and clean energy stocks were confirmed as a strong safe haven against the US and UK economic policy uncertainty, however not against China EPU. Afterward, rare earth elements proved a strong safe haven against all EPU indexes. These findings suggest a road map to the fund managers for policy risk mitigation. Additionally, the results guide policymakers, regulators, and all market participants to develop strategies to cope with independent economic policy risk in the USA, China, and the UK.
The remainder of the paper is organized as follows. Section 2 describes the data description and methods. Section 3 presents the analysis and results. Section 4 conducts a robustness check during COVID-19. Section 5 debates the discussion, while Section 6 concludes the paper.

2. Data and Methods

2.1. Data Description

This study considered the daily prices of green bonds (GB), clean energy stock (CES), the global rare earth elements (REE) index and three EPU indices (US-EPU, China-EPU, and United Kingdom-EPU). Five days of a week were considered starting from 11 March 2014 to 29 September 2020 for all indices due to daily data unavailability for global rare earth elements. A total number of 1636 observations were considered for full-sample estimation, 1427 before COVID-19 and 209 for during the COVID-19 estimation. The Clean Energy Fuels Corp (CLNE) index by NASDAQ was considered for clean energy stocks. Data on clean energy stocks and global rare earth elements were sourced from www.Investing.com (accessed on 15 October 2020), Green Bonds from the official S&P (Standard and Poor) website, EPU indices for the USA and UK were obtained from www.economicpolicyuncertainty.com (accessed on 15 October 2020), and data for the Chinese Economic policy uncertainty index were sourced from https://economicpolicyuncertaintyinchina.weebly.com (accessed on 15 October 2020). The economic policy uncertainty index is a news-based index and was initially constructed by (Baker et al. 2016).

2.2. Dynamic Conditional Correlation Model

This study follows the dynamic conditional correlation multivariate GARCH model proposed by Engle (2002). Traditionally, the measurement of the conditional time-varying correlation among two or more time series is often called a gauge (Wang et al. 2019b). Researchers are often in a trade-off choosing between exponential smoothing average techniques and a rolling windows method or rolling regression (Ratner and Chiu 2013). However, the dynamic conditional correlation model is a comparatively better tool than an exponential moving average method and competitive with the multivariate GARCH model (Engle 2002). The rapid adaptation and continuous adjustment in the correlation for dynamics in volatility often elevates DCC-GARCH to be a superior model (Cho and Parhizgari 2008). The superiority of the DCC-GARCH model over rolling window regression is due to the usefulness and reliability characteristics in DCC-based time-variant correlation (Isogai 2016). Many multivariate GARCH models prevail to capture multivariate relationships; for instance, Baba, Engle, Kraft and Kroner model (BEKK) and full Vectorized conditional variance matrices (VECH) can produce distortion in the results and, thus, have costly consequences in the case of an increased sample size to three asset returns in time estimation (Chiang et al. 2007). The concept of constant conditional correlation (CCC) has stood untrue and unrealistic across many financial assets due to the continuous time-variant nature of volatility among financial assets (Bera and Kim 2002). The wider acceptance of DCC-MGARCH underpins numerous benefits. Accounting for heterogeneity directly using standardized residuals allows for multiple variable return directions to be examined without introducing several numbers of parameters (Chiang et al. 2007). Interestingly, the information normally generated by DCCs enables investors, strategy makers, and researchers to understand correlation movements under different financial and economic conditions, particularly volatility shocks and crises (Chiang et al. 2007; Moore and Wang 2014). Thus, certainly, a rigorous approach has clear relevance to achieve the research objectives.
Originally, the DCC MGARCH model comprises two steps: the first estimates the conditional volatility through univariate GARCH (p, q), and the second estimates the time-varying conditional correlation through the DCC (M, N) specification given by Engle (2002). The overall model definition can be expressed as follows:
Y t = λ t + H t + ε t
where Y t is a vector for past time-series observations ( Y 1 t 1 t ,   Y 2 t Y n t ) , H t is a multivariate contemporaneous variance matrix of N × N , λ t is a vector of time series conditional returns, and ε t is a vector having standardized residual returns.
ε t | δ t 1 ~ c ( λ , H t )
where Equation (2) is a conditional mean equation containing a time series that assumes ε t gives the unconditional mean returns that are either equal to or near zero but <1, denoted as λ , or residuals from filtered time series H t on information set δ at times t 1 . c is a multivariate density function, dependent upon the vector conditional covariance matrix H t and unconditional mean. Thus, the conditional covariance matrix can be put into the product of conditional returns of standardized residuals and the time-variance conditional correlation matrix as follows:
H t = D t C t D t
The elements C t = ρ i j and D t are a N × N diagonal matrix dynamic nature of standard deviations or standardized residuals of the conditional returns obtained from the Univariate-GARCH model having h i , t on the diagonal of any ith matrix as follows:
i th = [ h i , t σ i , j σ i , j h i , t ] w h e r e ,   i = ( 1 , 2 , 3 , , n )   or   ( D t = d i a g ( h 11 , t ,   h 22 , t , h 33 , t , h N N , t )
where the h i , t element follows the   ( p , q ) process for the individual GARCH, which can be signified as follows:
h i , t = δ i + p = 1 p i A i p ε i , t p 2 + q = 1 q i B i , q h i , t p
In the above equation, the first element δ i is considered a constant term, while the term A captures the short-term conditional volatility, and the B element estimates long-term volatility persistence; this equation collectively expresses conditional variance denoted as h i , t . The element C t is a symmetric time-variant conditional correlation matrix, and C t = d i a g ( Q t ) 1 / 2 Q t d i a g ( Q t ) 1 / 2 .
The second step of the model outlines the DCC specification or the DCC ( M , N )   process estimates the ( C t ) dynamic conditional correlation vector, and the specification of the structure can be presented as follows:
C t = Q t * 1 Q t Q t * 1
where Q t * is the k × k diagonal matrix composed of h n n   on the diagonal of Q t as follows:
Q t * = [ h 11 0 0 0 0 h 22 0 0 0 0 h 33 0 0 0 0 h n n ]
where Q t follows the structure
Q t = ( 1 m = 1 M m n = 1 N φ n ) Q ¯ + n = 1 N φ n Q t n + m = 1 M m ( ϑ i , t m ϑ j , t m )
Q t = q i j t and conditional variance-covariance matrix N × N of standardized residuals ( ϑ i t = ε i t / h i , t ) following an autoregressive process. The term Q t purportedly drives the variations in the time-variant nature of the time series conditional correlation.
Q ¯ is the time-varying ( E ( ϑ i , t 1 ϑ j , t 1 ) unconditional correlation matrix of standardized residuals obtained from the first stage after estimation, and are positively definite parameters to satisfy ( + φ ) > 1 . m and φ n are parameters that indicate the previous shock effects and the effects of prior DCCs on the current DCC, respectively. There is the absence of unit diagonal elements in C t in Equation (6); therefore, the elements are scaled to obtain an appropriate time-variant conditional correlation matrix   C t :
C t = d i a g ( Q t ) 1 / 2 Q t d i a g ( Q t ) 1 / 2
where d i a g ( Q t ) 1 / 2 = d i a g ( 1 q 11 ) ,   ( 1 q 22 ) , ( 1 q n n ) . Thus, the latest Equation (7) for C t builds a correlation matrix having absolute values (1 on the diagonal and >1 on off-diagonal elements) where Q t is subject to be positive definite. Ultimately, the authors are concerned with the correlation estimator ( C t ) due to its key significance in this econometric methodology. Certainly, the key element C t has the form indicated: p i , j , t   = q i , j , t   / q i , i , t   q j , j , t   , as it delineates the contemporaneous correlation between cryptocurrencies and global and national economic policy uncertainty.
The QMLE quasi-maximum likelihood technique was used to estimate both the volatility ( D t with Ɵ ) and correlation ( C t with Ʋ ) parameters. Additionally, the parameters in D t include the volatility component and the correlation component C t so as to aggregate into a single log-likelihood function. Generally, the authors can write a likelihood function for both of the estimators following the Gaussian assumption as follows:
L ( Ɵ , Ʋ ) = L 1 ( Ɵ ) + L 2 ( Ɵ , Ʋ ) or   L ( Ɵ , Ʋ ) = 0.5 t = 1 T ( k log ( 2 π ) + log | D t | 2 + ε t D t 2 ε t ) + ( log | C t | + ϑ t C t 1 ϑ t ϑ t ϑ t )
The log-likelihood function split into two separate functions for both volatility and correlation parameters L 1 ( Ɵ ) is the sum of univariate GARCH equations, and L 2 ( Ɵ , Ʋ ) can be maximized to estimate the correlation coefficient in the equation below:
L 1 ( Ɵ ) = 0.5 t = 1 T ( k log ( 2 π ) + log | D t | 2 + ε t D t 2 ε t )
L 2 ( Ɵ , Ʋ ) = 0.5 t = 1 T ( log | C t | + ϑ t C t 1 ϑ t ϑ t ϑ t )

3. Empirical Results

The analysis part is divided into two samples: full sample estimation and COVID-19 analysis. 
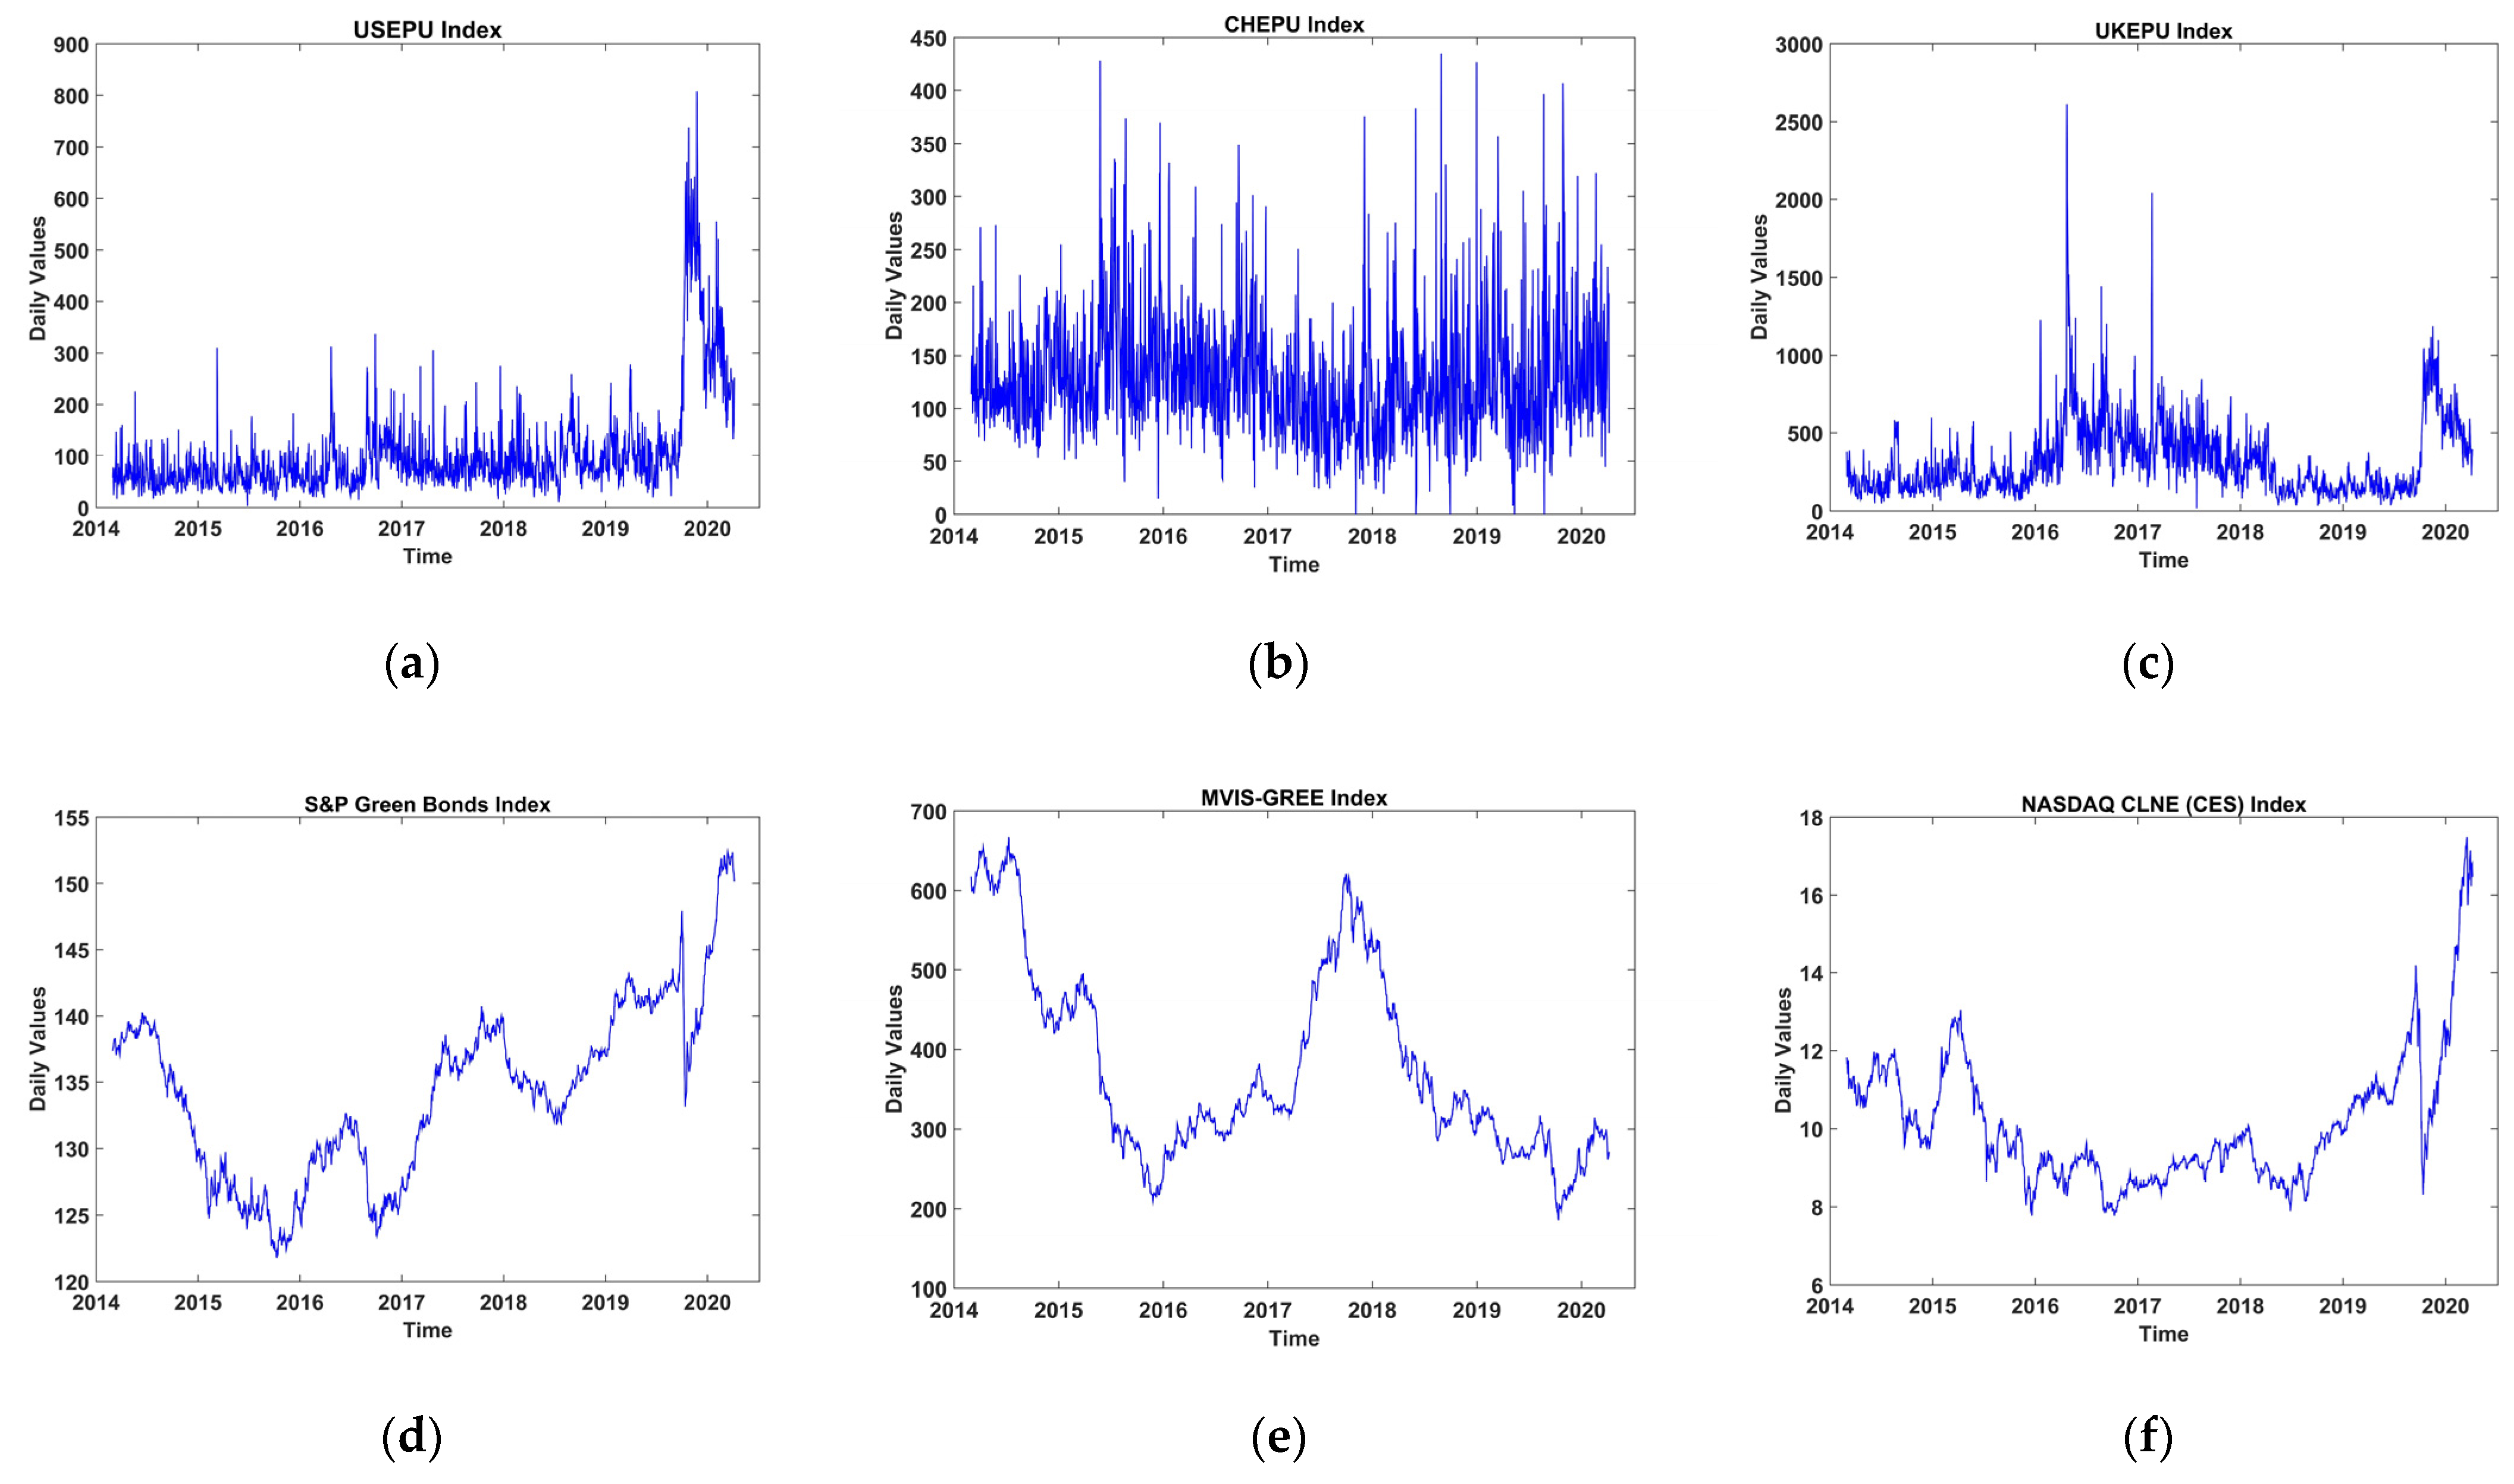
Table 1 illustrates the descriptive statistics for each index based on daily values. The descriptive statistics are based on the daily logarithm values of all indices. Values in bold indicate significant coefficients at the 5% level. The mean and standard deviation coefficients for EPU reflect the stability of economic policy uncertainty in China; however, economic policy uncertainty is more volatile in the cases of the USA and UK. Countries with high EPU are more volatile, such as the US and UK. Green bonds are less volatile than clean energy stocks and global rare earth elements. This may be due to the sustainability and environmentally friendly perspective attached to green bonds. Moreover, green bonds are often considered long-term investments; thus, investors often buy and hold securities. Figure 1 demonstrated an increase in economic policy uncertainty of the USA and UK during the COVID-19, whereas this is not true in case of China EPU. Moreover, green bonds index and global rare earth element index showed a surge. All coefficients and p-values for the Jarque–Bera test confirmed that all series are non-normally distributed, thus violating normality.
The presence of serial correlation in financial time series is one of the critical issues. Serial correlation reflects the correlation of a time series with itself over multiple lagged periods; moreover, a serially correlated time series may not be a random walk. Table 2 illustrates the outputs for the Portmanteau (Q) test for serial correlation up to the 40th order. Bold values in parentheses depict the p-values at the 5% level. The Q statistic and p-values supported the alternative hypothesis and rejected the null hypothesis of no serial correlation in EPUs, clean energy stocks, green bonds, and global rare earth elements. Thus, current estimates lead to choosing the DCC-MGARCH model to capture time-varying volatility in a time series, as the authors find GARCH (1,1) to be the best suitable model based on the Akaike information criterion.
Results of Phillips Perron test for unit root are illustrated in 
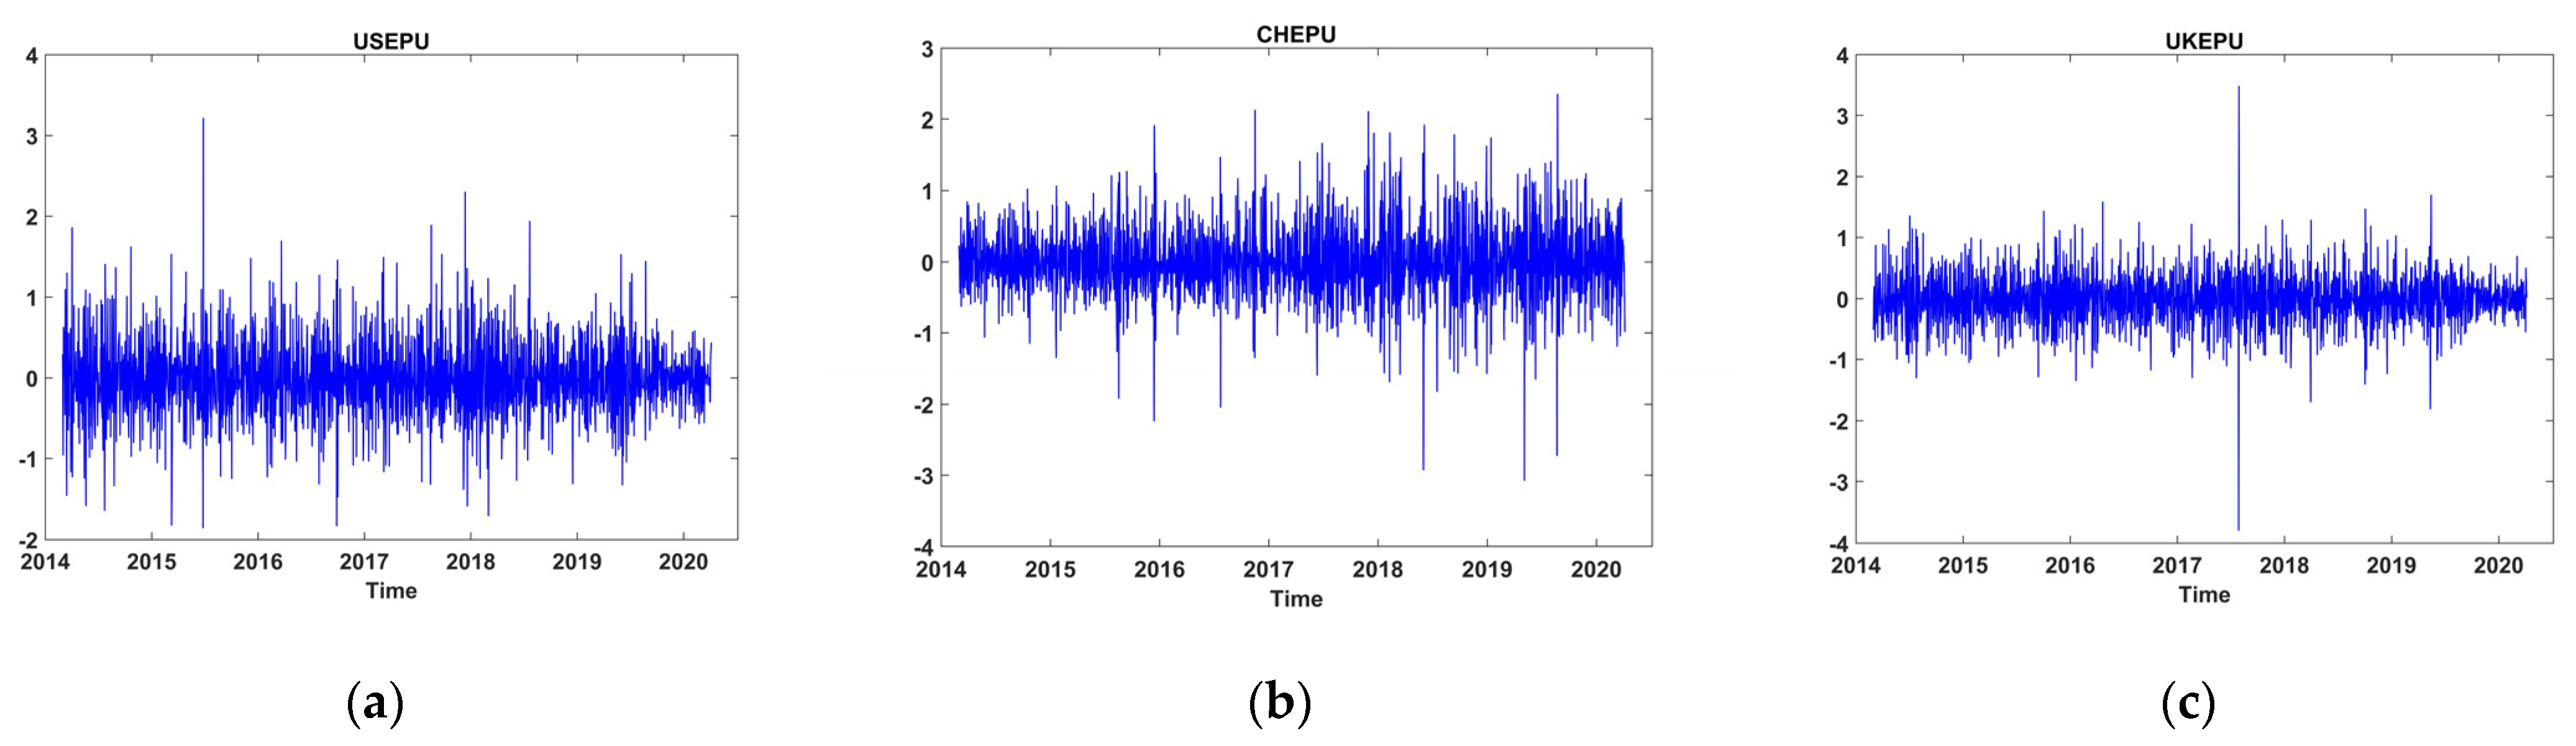
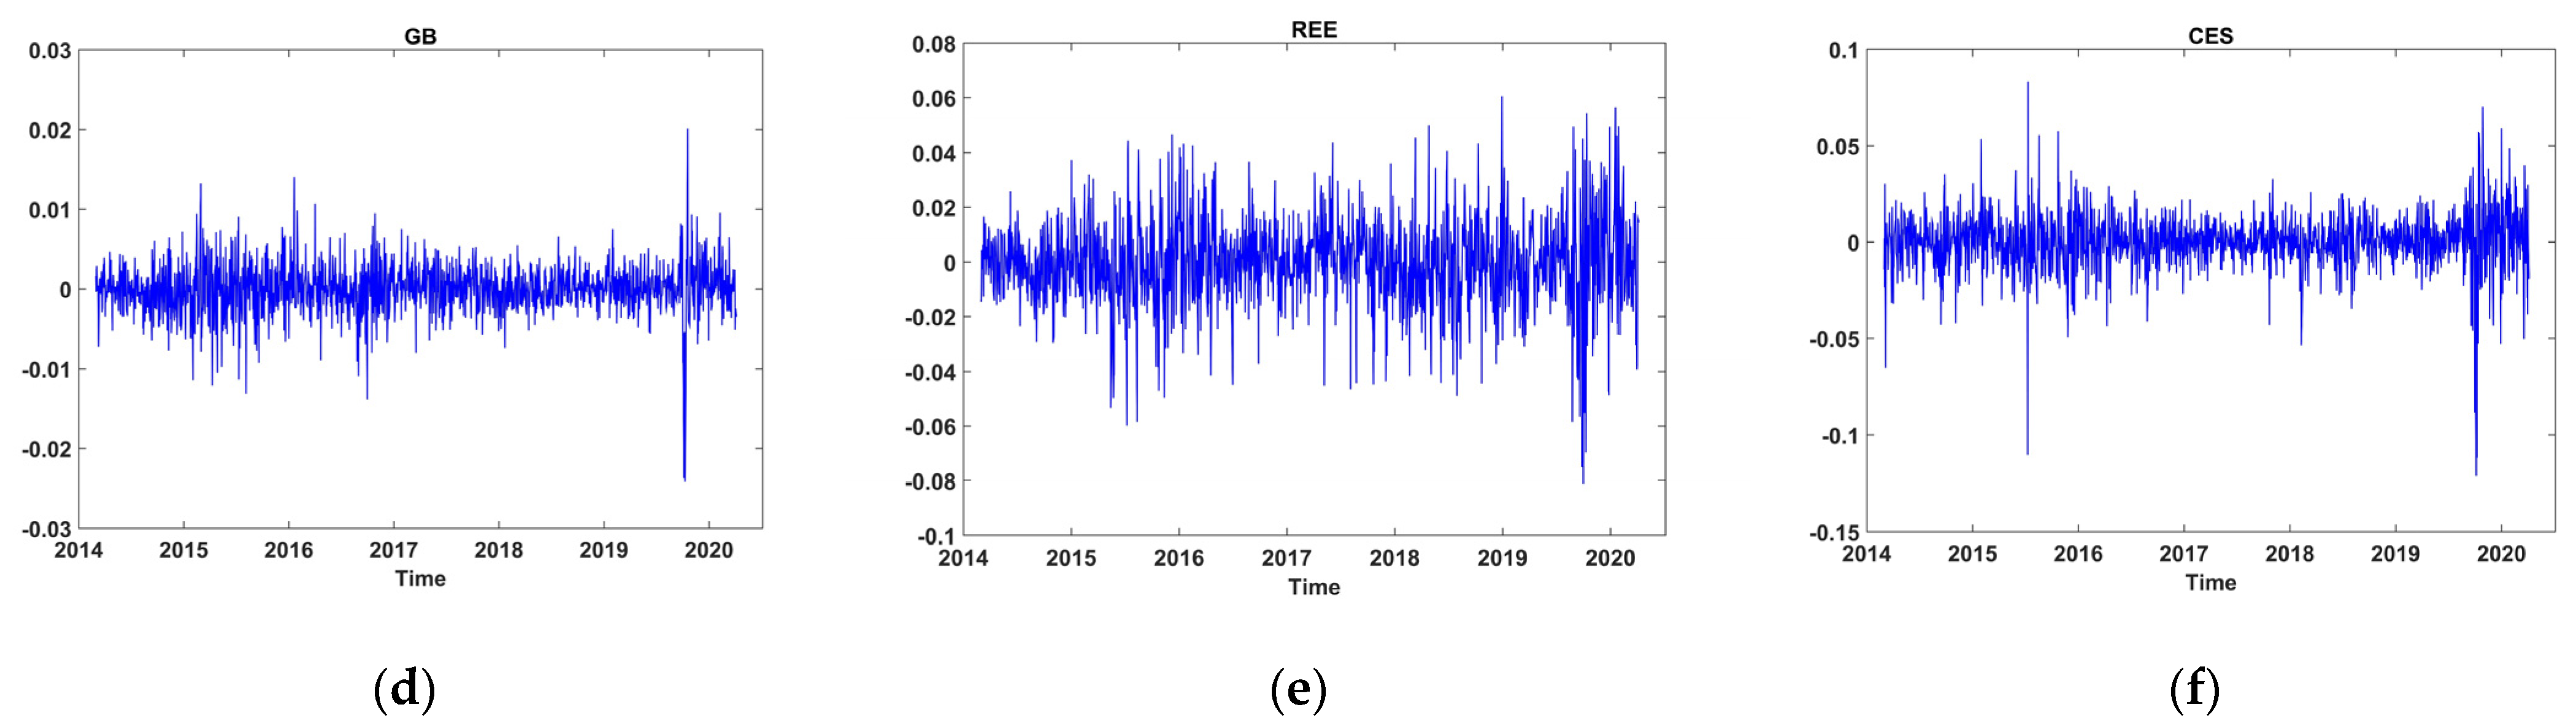
Table 3. Results confirmed that the null hypothesis is rejected for all indexes at a high-level significance. Therefore, all variables are stationary at the first difference and fulfilling a pre-estimation assumption for DCC-GARCH estimation. *** indicates significance at 5%. All variables are stationary, as can be viewed in Figure 2.
However, the authors estimated unconditional correlation before DCC-MGARCH estimation, as shown by the results in Table 4. The authors also tested the null hypothesis that the unconditional correlation is equal to zero. The results for unconditional correlations reported in Table 4 confirm the evidence for a negative and not perfect positive correlation based on the p-values and t-test statistics. Thus, a predominant positive correlation sign suggests that clean energy stocks, green bonds, and rare earth elements are avenues for diversification, and that green bonds, rare earth elements, and clean energy stocks are strong hedges against the economic policy uncertainty of the USA. Moreover, green bonds and clean energy stocks proved to be strong hedges against UKEPU and CHEPU indexes, respectively. In contrast, the negative correlation of green bonds, clean energy stocks, and rare earth elements against EPUs suggests that green bonds’ hedging ability is not limited to the USA only. These findings are consistent with our proposal that hedging ability prevails in green bonds, clean energy stocks, and rare earth elements against EPU. Correlation values in bold denote unconditional correlation coefficients at t 0 at a 5% statistical significance level.
Authors estimated the DCC-GARCH model quasi-maximum likelihood technique due to non-normality in the time series. The quasi-maximum likelihood function ignores non-normality and generates standard errors by maximizing the likelihood. This technique assumes that residuals are conditionally normal, but originally draw from other conditional distributions. After consideration of several log-likelihood value evaluations, the authors consider GARCH (1,1) as the data are better fitted in DCC (1,1) with each conditional variance in GARCH (1,1) in the current lag periods for all series. Table 5 and Table 6 illustrate the GARCH (1,1) results for the full sample and during COVID-19, respectively, to estimate conditional volatility since 2014 and during the novel coronavirus to uncover the diversification properties among green bonds, clean energy stocks, and rare earth elements with more hedge and safe haven efficiency against EPUs. The sum of A i and B i is near 1; thus, all GARCH processes are highly persistent.
Likewise, the DCC parameters are consistent and statistically significant, as the chi-square coefficient and probability values are significant in Table 5 and Table 6. This suggests that the null hypothesis, which assumes a constant correlation over time, is rejected.
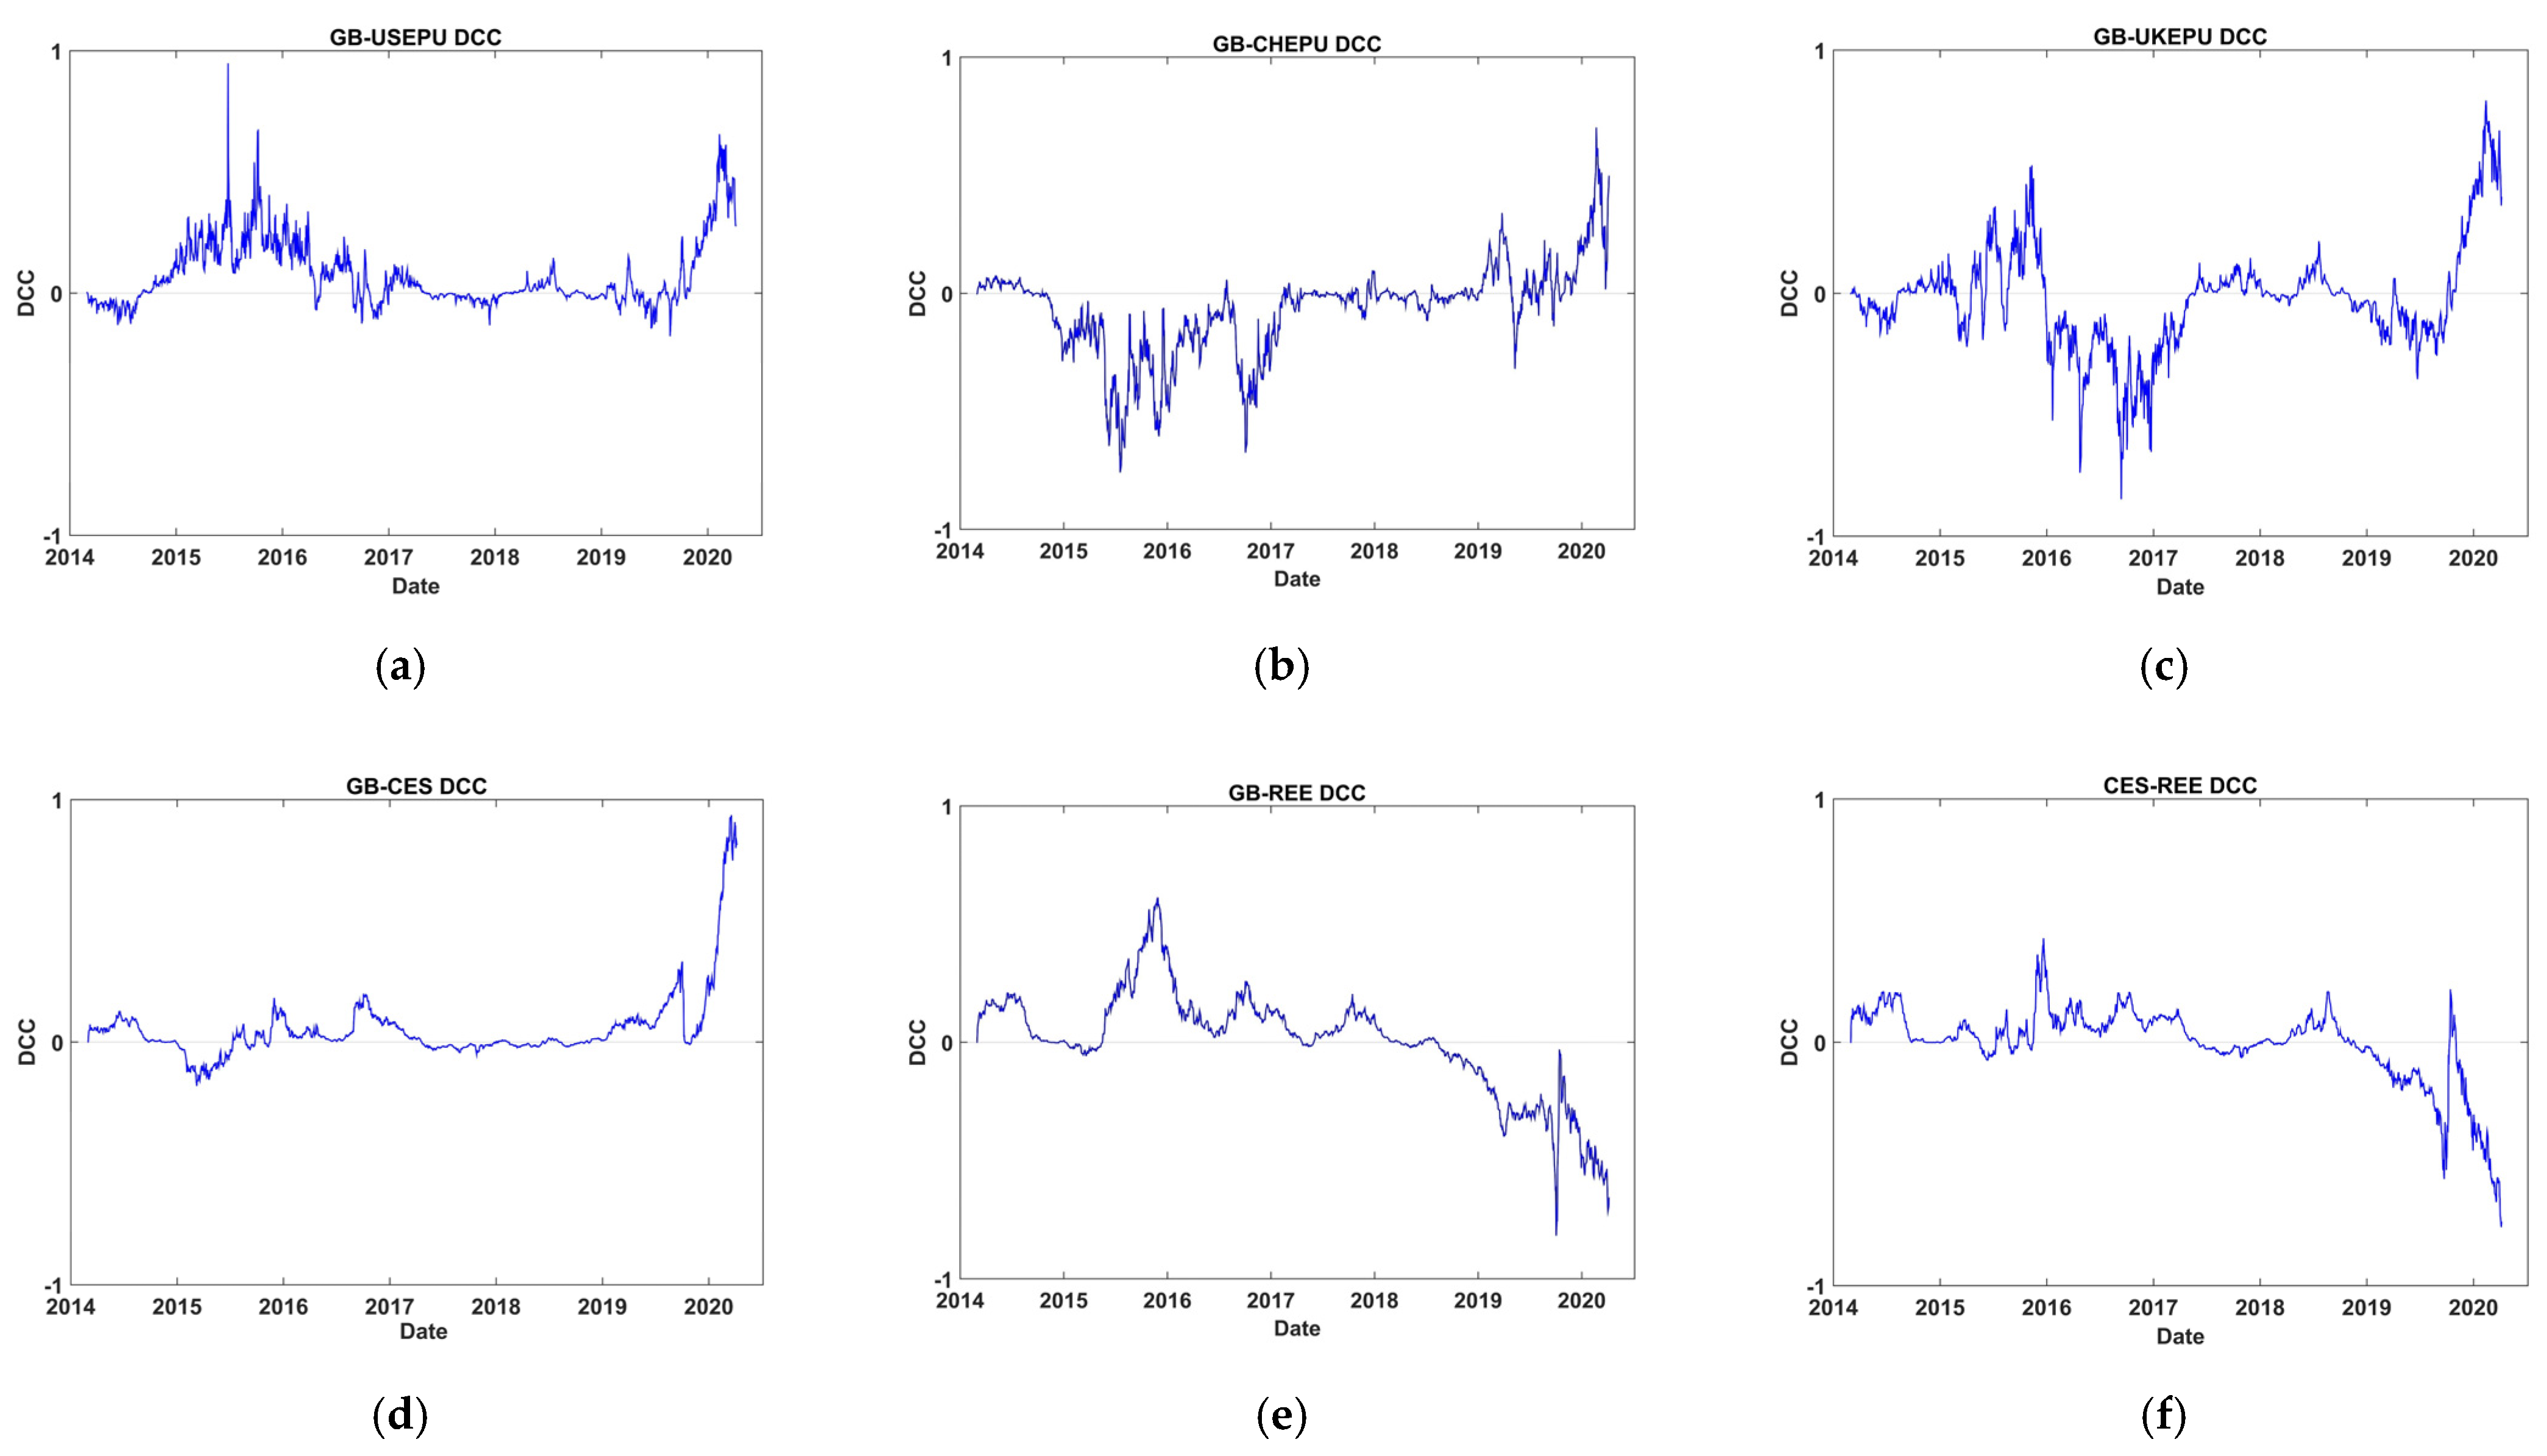
The second step estimation covers dynamic conditional correlations; Figure 3 reports the dynamic conditional correlations between green bonds and EPUs, and DCCs among green bonds, clean energy stocks, and rare earth elements. In the full sample, outcomes confirm the conditional correlation between green bonds volatility and EPU’s dominantly negative in the case of the UK and China; however, green bonds volatility and USEPU demonstrated a positive correlation with few negative high magnitude correlation trends.
Afterwards, mixed volatility correlation patterns for green bonds with rare earth elements and clean energy stocks were observed; however, in 2020, the correlation demonstrated an unconventional pattern. Rare earth elements and clean energy stocks are dominantly positively correlated over time.

4. Robustness Check: During COVID-19

Moving towards the COVID-19 pandemic, the authors estimated a separate analysis to verify the robustness of findings in full sample estimation. Table 6 illustrates DCC M-GARCH results for sub-sample during the COVID-19, and it shows the persistence of all GARCH processes as, for all cases of any two return series, the sum of A i and B i is close to “1”, thus fulfilling the GARCH assumption. Moreover, Table 7 reports that DCC parameters for correlation are also consistent in all cases. 
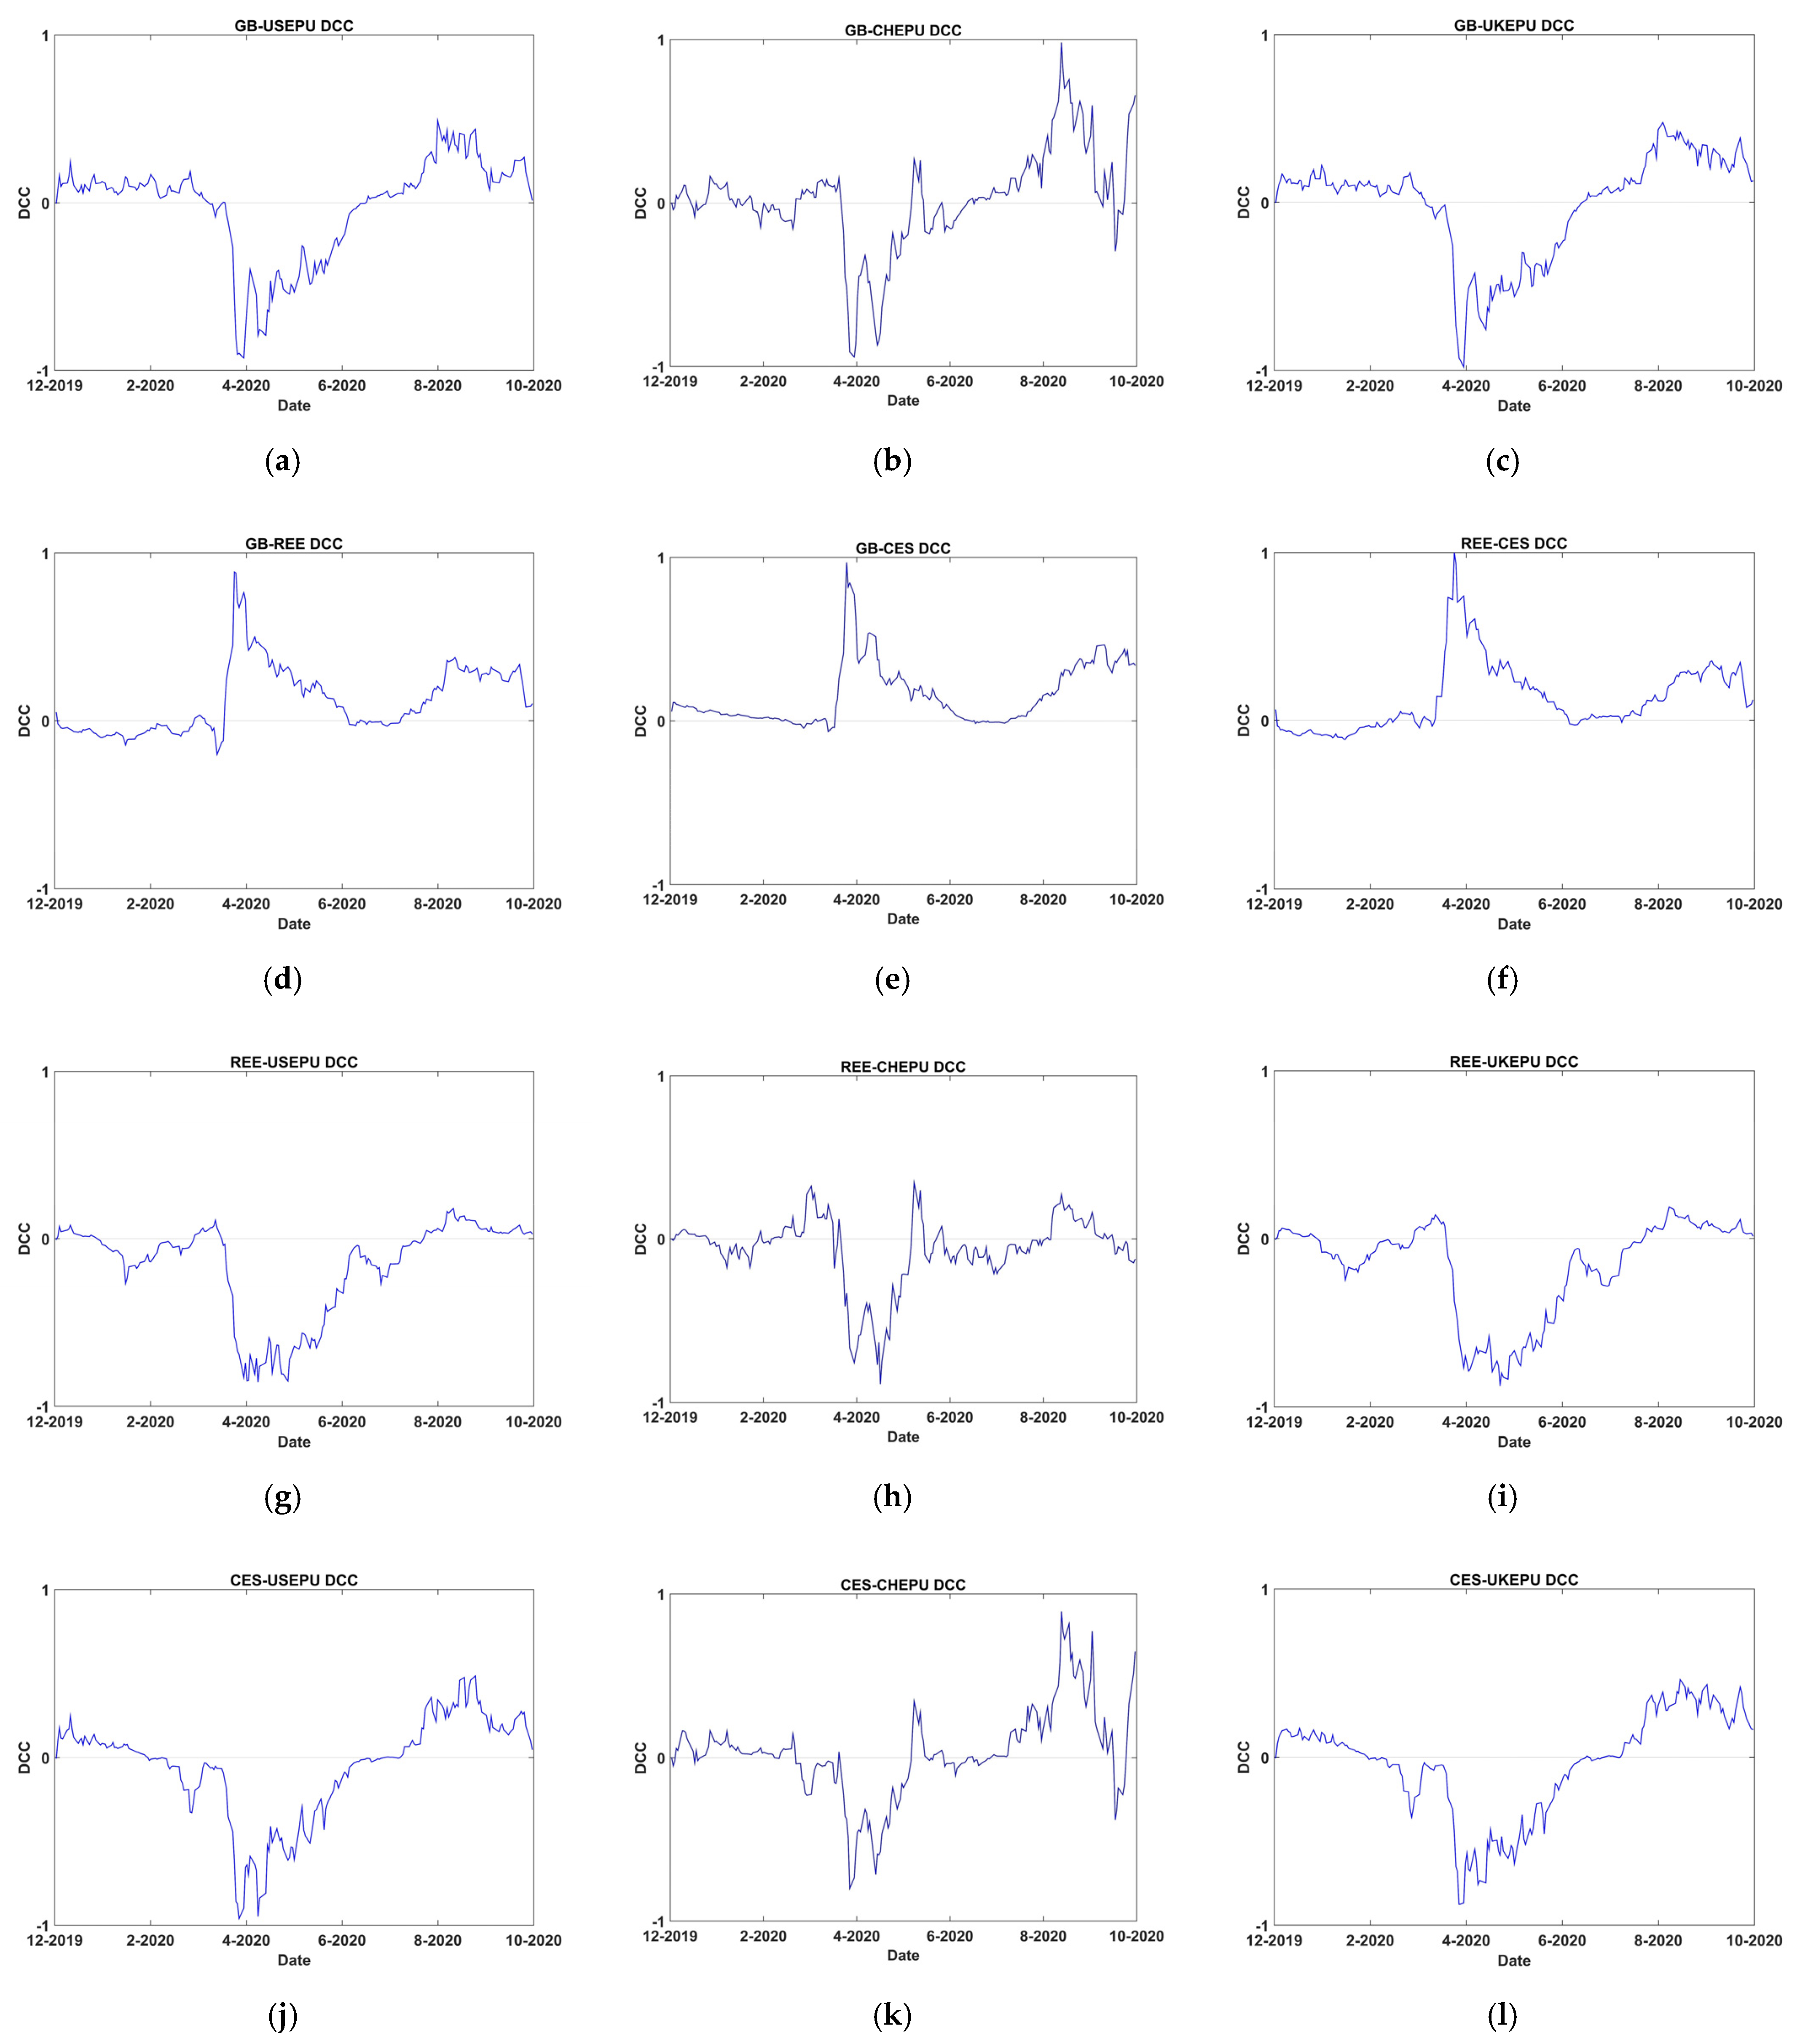
Figure 4 illustrates the time-varying conditional correlation among green bonds, rare earth elements, and clean energy stocks against EPUs during the novel coronavirus. Interestingly, dynamic conditional correlation outcomes validate that the negative association of green bonds, clean energy stocks, and rare earth elements is more prominent with the economic policy uncertainty of the USA, China, and the UK during the COVID-19 episode. However, alternative positive trends are spotted. In contrast, all other indices, such as green bonds, clean energy stocks, and rare earth elements, are positively correlated with each other during the sanitary crisis. This positive (though not perfectly positive) association infers that these securities may be considered as diversifiers against each other. Table 7 demonstrates the DCC parameters that are statistically significant and consistent with Figure 4. The authors report a median spline graph to smooth reoccurring variations as a Figure 4. The horizontal line in the graph demonstrates the zero correlation on the y-axis, and bold values in Table 7 denote the dynamic conditional correlation coefficient between all indices. All values in parentheses are the p-values at a 5% significance level. “A” refers to full sample estimation for hedging and diversification and “B” refers to the COVID-19 period. In overview, diversification, hedging, and safe haven properties for green bonds, clean energy stocks, and rare earth elements are alive during the COVID-19 period, during which previous studies have indicated evidence of strong linkages across major stock indices (Abuzayed et al. 2021).

5. Discussion

Economic policy uncertainty is deteriorating. Global financial integration and trade wars among nations are sources of higher EPU. Undoubtedly, the outbreak of COVID-19 has also led to devastating effects on foreign exchange markets (Aslam et al. 2020a), volatility of financial markets (Aslam et al. 2020b), and economic policy uncertainty (Baker et al. 2020). Thus, investors urgently need to find potential avenues that may protect their investments from loss during a catastrophic event (such as COVID-19). Interestingly, countries have heterogeneous national economic policy uncertainty patterns based on their regulatory framework and monetary and fiscal policies (Haq and Aftab, forthcoming). Therefore, every country-specific economic policy uncertainty requires diverse solutions to hedge.
To the best of our knowledge, this study is the first to consider economic policy uncertainty and green bonds time-varying associations. This study revealed that green bonds are a strong hedge against clean energy stocks, rare earth elements, China-EPU and UK-EPU. However, they serve as a weak hedge against the economic policy uncertainty of the USA, and rare earth elements act more as a diversifier against clean energy stocks. This suggests that green bonds can serve as a good financial instrument to hedge economic policy risk in the USA and even better in other countries, such as China and the United Kingdom. Thus, the emergence of green bonds is a potential avenue to hedge and mitigate risk in financial and economic systems (Broadstock and Cheng 2019).
Green bonds are a promising financial asset-class, and their economic significance is not restricted to the setting of the US. However, the hedging abilities are going beyond the borders, proving green bonds as an encouraging risk management tool worldwide. These findings have significance for international investors who have an investment in financial markets of China and the UK, as adding green bonds to a portfolio can shield certain investments from the economic policy shocks in these countries during normal economic conditions. Additionally, there exists a positive volatility linkage between global rare earth elements and clean energy stocks. This is due to the dependency of clean energy production on rare earth elements; these findings are well-aligned with (De Koning et al. 2018). In addition, this is also due to the monopolistic control China holds over rare earth elements (Marscheider-Weidemann et al. 2013), and the US imports rare earth elements for clean energy production from China. This is the main reason that the volatility of US clean energy stocks is positively correlated with global rare earth elements. Moreover, rising tensions between the United States and China have sparked concerns. The Chinese government and National Development and Reform Commission (NDRC) took this seriously against the US by blocking its REE supply (Schmid 2019; Global Times 2019) which will ultimately affect the US’s clean energy industry. In current crucial times, the US green bonds demonstrated a positive volatility correlation with both clean energy stocks and rare earth elements during the period of this study. Therefore, US investors have ample risk management opportunities in the shape of having US green bonds, as green bonds are proven diversifiers against the volatility of clean energy stocks and global rare earth elements in normal market conditions.
The COVID-19 pandemic unveiled some interesting correlation patterns and implications for investors. Interestingly, clean energy stocks and rare earth elements are strong safe havens against economic policy uncertainty, as the correlation signs are predominantly negative during catastrophic events such as COVID-19. However, green bonds stood as strong safe havens against US EPU and UK EPU; thus, green bonds as a safe haven faded during COVID-19 in the case of the China EPU. This may be as US EPU influences the performance and movements of green bonds (Broadstock and Cheng 2019). These findings imply that green bonds are more of a hedge than a safe haven. Moreover, the abilities of safe havens are more pronounced in clean energy stocks and rare earth elements against EPUs’ economic policy uncertainty. Clean energy stocks, rare earth elements, and green bonds are not a hedge or a safe haven, but act as diversifiers against each other as these financial assets share homogeneous characteristics. Likewise, this observation may be due to the limited connectedness between the green bonds market and general stock markets, as clean energy stocks and green bonds belong to two different asset classes (Ferrer et al. 2021).

Policy Implications

This research provides useful implications for several sustainable economists and economic actors in terms of hedging, portfolio management, and sustainability policy. The restrictive exports policy of China and ban over REE exports to the USA damaging clean energy production and other dependent industries, i.e., high technology firms. Thus, American authorities should keep promoting US green bonds, as they can hedge the volatility of global rare earth elements and the US clean energy stocks for clean energy investors. Moreover, it can protect US REE investors from the volatility spillover effect from China’s rare earth metals (due to its dominance over rare earth resources) and win the trade war. The description of the nature and usage of green bonds should be standardized internationally to improve their wider acceptance worldwide. Moreover, monitoring the development and formalization of green bonds can be an effective area of action for any sustainable economist. The emerging US green bonds hedging properties beyond the borders suggest that Chinese and UK authorities should ease the restrictions and allow investors to invest in the US green bonds market. At the same time, these findings provide a useful roadmap for international policymakers and fund managers having investments in the USA, China, and the UK. Overall, it infers that US clean energy stocks are vulnerable to the global rare earth elements.
In terms of sustainability policy, it is time to move the attention toward green finance and sustainable investment, i.e., green bonds to raise funds. Therefore, the attractiveness of green bonds are twofold; they are not solely a risk mitigation and hedging tool, but also are issued to generate money to mitigate climate change and environmental projects, improve energy efficacy, and accelerate decarbonization in the economy.

6. Conclusions

Despite the growing interest in green investment avenues such as green bonds, the current finance and economics literature still lacks empirical evidence for their risk management abilities as a hedge, safe haven, and diversifier against clean energy stocks, rare earth elements in general, and economic policy uncertainty in particular. Thus, this study focuses on the hedging and safe haven abilities of green bonds, clean energy stocks, and global rare earth elements. Additionally, it explored diversification properties between green bonds, clean energy stocks, and global rare earth elements in the full sample and during the COVID-19 episode. Thus, this study focuses on four ideas: (i) the hedge and safe haven properties of green bonds against economic policy uncertainty during COVID-19; (ii) hedging and the safe haven properties of clean energy stocks; (iii) hedging and safe haven role of rare earth elements against economic policy uncertainty during COVID-19; and (iv) the diversification properties among green bonds, clean energy stocks, and rare earth elements, using five-day daily values for each index within a dynamic conditional correlation model (Engle 2002).
Firstly, the results for the full sample estimation reveal that green bonds are potential avenues for risk mitigation. The authors find that the DCCs between green bonds and China EPU and UK EPU indices are negative in the full sample estimation, indicating that green bonds were a strong hedge against China and UK EPU. However, the DCC between US EPU and green bonds indices was positive in the full sample, indicating that green bonds were not a hedge (strong or weak) against US EPU. This implies that the volatility of green bonds may prone to economic policy uncertainty, therefore green bonds lost their hedging role. On the other hand, the DCCs between green bonds, US EPU, and UK EPU are negative during COVID-19, indicating green bonds were a strong safe haven against US EPU and UK EPU during COVID-19. However, there was not a statically significant correlation between green bonds and China EPU, indicating that green bonds lost their safe haven ability during COVID-19.
Secondly, clean energy stocks serve as an effective strong hedge against the US EPU and UK EPU in full sample estimation. As the DCCs between clean energy stocks, US EPU, and UK EPU were negative in the full sample. However, DCC was negative insignificant in the case of China EPU, thus clean energy stocks were not a hedge against China EPU. Particularly during COVID-19, the DCC’s patterns remained the same as the full sample estimation, thus clean energy stocks were a safe haven against US EPU and UK EPU, but not against China EPU.
Thirdly, the DCCs between global rare earth elements, China EPU, and UK EPU indices are negative in full sample estimation, indicating that global rare earth elements were a strong hedge against the economic policy uncertainty indices of China and the UK. However, insignificant DCC between US EPU and global rare earth elements indicated no presence of hedging role against US EPU. This may be due to the monopolistic control of China over rare earth elements production. During COVID-19, the DCCs between global rare earth elements and all EPUs (USA, China, and UK) were negative, indicating that global rare earth elements were a strong safe haven against the economic policy uncertainty of the USA, China, and the UK.
Fourthly, the results of DCCs between green bonds, clean energy stocks, and global rare earth elements are mainly positive (though not perfectly positive) in the full sample estimation, indicating that these securities can be used as diversifiers collectively with each other. In particular, the positive DCCs (not perfectly positive) remained similar to the full sample, thus these assets are diversifiers if used in a single portfolio. These results can guide policymakers and fund managers to form suitable policies and strategies considering COVID-19.
Finally, future studies should explore the real-life importance of green bonds in terms of sustainability in the USA and around the globe. Further research is expected on how US EPU and China EPU are related to their country-specific rare earth elements. It will be interesting to capture the impact of trade wars between the USA and China on rare earth elements, especially as China has monopolistic control over rare earth production worldwide.

Author Contributions

Conceptualization, I.U.H.; methodology, I.U.H.; software, S.C. and C.H.; validation, C.H. and S.C.; formal analysis, I.U.H.; investigation, I.U.H.; resources, I.U.H.; data curation, I.U.H.; writing—original draft preparation, I.U.H.; writing—review and editing, S.C. and I.U.H.; visualization, S.C.; supervision, C.H.; project administration, C.H. All authors have read and agreed to the published version of the manuscript.

Funding

This research received no grant from any funding agency.

Institutional Review Board Statement

Not applicable.

Informed Consent Statement

Not applicable.

Data Availability Statement

The data that support the findings of this research are available from the corresponding author upon request.

Conflicts of Interest

Authors declare no conflicts of interest.

Note

1
Investors can form portfolios to improve their expected returns for a given level of risk.

References

  1. Abdelrhim, Mansour, Abdullah Elsayed, Mahmoud Mohamed, and Mahmoud Farouh. 2020. Investment Opportunities in the Time of (COVID-19) Spread: The Case of Cryptocurrencies and Metals Markets. SSRN Electronic Journal, 1–19. [Google Scholar] [CrossRef]
  2. Abuzayed, Bana, Elie Bouri, Nedal Al-Fayoumi, and Naji Jalkh. 2021. Systemic risk spillover across global and country stock markets during the COVID-19 pandemic. Economic Analysis and Policy 71: 180–97. [Google Scholar] [CrossRef]
  3. Akhtaruzzaman, Md, Sabri Boubaker, Mardy Chiah, and Angel Zhong. 2020. COVID−19 and oil price risk exposure. Finance Research Letters, 101882. [Google Scholar] [CrossRef]
  4. Akhtaruzzaman, Md, Sabri Boubaker, and Ahmet Sensoy. 2021a. Financial contagion during COVID–19 crisis. Finance Research Letters 38: 101604. [Google Scholar] [CrossRef] [PubMed]
  5. Akhtaruzzaman, Md, Sabri Boubaker, Brian M. Lucey, and Ahmet Sensoy. 2021b. Is gold a hedge or a safe-haven asset in the COVID–19 crisis? Economic Modelling 102: 105588. [Google Scholar] [CrossRef]
  6. Al Mamun, Md, Gazi Salah Uddin, Muhammad Tahir Suleman, and Sang Hoon Kang. 2020. Geopolitical risk, uncertainty and Bitcoin investment. Physica A: Statistical Mechanics and Its Applications 540: 123107. [Google Scholar] [CrossRef]
  7. Al-Thaqeb, Saud Asaad, and Barrak Ghanim Algharabali. 2019. The Journal of Economic Asymmetries Economic policy uncertainty: A literature review. The Journal of Economic Asymmetries 20: e00133. [Google Scholar] [CrossRef]
  8. Aslam, Faheem, Saqib Aziz, Duc Khuong Nguyen, Khurrum S. Mughal, and Maaz Khan. 2020a. On the efficiency of foreign exchange markets in times of the COVID-19 pandemic. Technological Forecasting and Social Change 161: 120261. [Google Scholar] [CrossRef]
  9. Aslam, Faheem, Yasir Tariq Mohmand, Paulo Ferreira, Bilal Ahmed Memon, Maaz Khan, and Mrestyal Khan. 2020b. Network analysis of global stock markets at the beginning of the coronavirus disease (COVID-19) outbreak. Borsa Istanbul Review 20: S49–S61. [Google Scholar] [CrossRef]
  10. Baker, Scott R., Nicholas Bloom, and Steven J. Davis. 2016. Measuring Economic Policy Uncertainty. The Quarterly Journal of Economics 131: 1–52. [Google Scholar] [CrossRef]
  11. Baker, Scott R., Nicholas Bloom, Steven J. Davis, Kyle Kost, Marco Sammon, and Tasaneeya Viratyosin. 2020. The Unprecedented Stock Market Reaction to COVID-19. The Review of Asset Pricing Studies 10: 742–58. [Google Scholar] [CrossRef]
  12. Baur, Dirk G., and Lai T. Hoang. 2020. A crypto safe haven against Bitcoin. Finance Research Letters 38: 101431. [Google Scholar] [CrossRef]
  13. Baur, Dirk G., and Brian M. Lucey. 2010. Is Gold a Hedge or a Safe Haven? An Analysis of Stocks, Bonds and Gold. Financial Review 45: 217–29. [Google Scholar] [CrossRef]
  14. Bera, Anil K., and Sangwhan Kim. 2002. Testing constancy of correlation and other specifications of the BGARCH model with an application to international equity returns. Journal of Empirical Finance 9: 171–95. [Google Scholar] [CrossRef]
  15. Bernanke, Ben. 1983. Irreversibility, Uncertainty, and Cyclical Investment. National Bureau of Economic Research 98: 85–106. [Google Scholar] [CrossRef]
  16. Bouri, Elie, Georges Azzi, and Anne Haubo Dyhrberg. 2017a. On the return-volatility relationship in the bitcoin market around the price crash of 2013. Economics 11: 1–17. [Google Scholar] [CrossRef] [Green Version]
  17. Bouri, Elie, Peter Molnár, Georges Azzi, David Roubaud, and Lars Ivar Hagfors. 2017b. On the hedge and safe haven properties of Bitcoin: Is it really more than a diversifier? Finance Research Letters 20: 192–98. [Google Scholar] [CrossRef]
  18. Bouri, Elie, Kakali Kanjilal, Sajal Ghosh, David Roubaud, and Tareq Saeed. 2021. Rare earth and allied sectors in stock markets: Extreme dependence of return and volatility. Applied Economics. [Google Scholar] [CrossRef]
  19. Broadstock, David C., and Louis T. W. Cheng. 2019. Time-varying relation between black and green bond price benchmarks: Macroeconomic determinants for the first decade. Finance Research Letters 29: 17–22. [Google Scholar] [CrossRef]
  20. Cheng, Hui-Pei, and Kuang-Chieh Yen. 2019. The relationship between the economic policy uncertainty and the cryptocurrency market. Finance Research Letters 35: 101308. [Google Scholar] [CrossRef]
  21. Chiang, Thomas C., Bang Nam Jeon, and Huimin Li. 2007. Dynamic correlation analysis of financial contagion: Evidence from Asian markets. Journal of International Money and Finance 26: 1206–28. [Google Scholar] [CrossRef]
  22. Cho, Jang Hyung, and Ali M. Parhizgari. 2008. East Asian Financial Contagion under DCC-Garch. The International Journal of Banking and Finance 6: 17–30. [Google Scholar] [CrossRef]
  23. Dawar, Ishaan, Anupam Dutta, Elie Bouri, and Tareq Saeed. 2021. Crude oil prices and clean energy stock indices: Lagged and asymmetric effects with quantile regression. Renewable Energy 163: 288–99. [Google Scholar] [CrossRef]
  24. De Koning, Arjan, René Kleijn, Gjalt Huppes, Benjamin Sprecher, Guus Van Engelen, and Arnold Tukker. 2018. Metal supply constraints for a low-carbon economy? Resources, Conservation and Recycling 129: 202–8. [Google Scholar] [CrossRef]
  25. Dutta, Anupam, Elie Bouri, Tareq Saeed, and Xuan Vinh Vo. 2020. Impact of energy sector volatility on clean energy assets. Energy 212: 118657. [Google Scholar] [CrossRef]
  26. Engle, Robert Fry. 2002. Dynamic conditional correlation: A simple class of multivariate generalized autoregressive conditional heteroskedasticity models. Journal of Business and Economic Statistics 20: 339–50. [Google Scholar] [CrossRef]
  27. Febi, Wulandari, Dorothea Schäfer, Andreas Stephan, and Chen Sun. 2018. The impact of liquidity risk on the yield spread of green bonds. Finance Research Letters 27: 53–59. [Google Scholar] [CrossRef]
  28. Ferrer, Román, Syed Jawad Hussain Shahzad, and Pilar Soriano. 2021. Are green bonds a different asset class? Evidence from time-frequency connectedness analysis. Journal of Cleaner Production 292: 125988. [Google Scholar] [CrossRef]
  29. Flammer, Caroline. 2019. Corporate Green Bonds. Academy of Management Proceedings 2019: 15250. [Google Scholar] [CrossRef]
  30. Global Times. 2019. China indicates it may use rare earths as weapon in trade war. Global Times. Available online: https://www.globaltimes.cn/content/1152119.shtml (accessed on 1 July 2021).
  31. Haq, Inzamam Ul, and Muhammad Aftab. Forthcoming. The Pandemic, Economic Policy Uncertainty, and the Hedging Role of Cryptocurrencies: A Global Perspective. International Journal of Finance and Economics Manuscript, 1–43.
  32. Huynh, Toan Luu Duc, Erik Hille, and Muhammad Ali Nasir. 2020. Diversification in the age of the 4th industrial revolution: The role of artificial intelligence, green bonds and cryptocurrencies. Technological Forecasting and Social Change 159: 120188. [Google Scholar] [CrossRef]
  33. Isogai, Takashi. 2016. Building a dynamic correlation network for fat-tailed financial asset returns. Applied Network Science 1: 1–24. [Google Scholar] [CrossRef] [Green Version]
  34. Kalyvas, Antonios, Panayiotis Papakyriakou, Athanasios Sakkas, and Andrew Urquhart. 2020. What drives Bitcoin’s price crash risk? Economics Letters 191: 108777. [Google Scholar] [CrossRef]
  35. Kanamura, Takashi. 2020. Are green bonds environmentally friendly and good performing assets? Energy Economics 88: 104767. [Google Scholar] [CrossRef]
  36. Karpf, Andreas, and Antoine Mandel. 2018. The changing value of the “green” label on the US municipal bond market. Nature Climate Change 8: 161–65. [Google Scholar] [CrossRef]
  37. Kido, Yosuke. 2016. On the link between the US economic policy uncertainty and exchange rates. Economics Letters 144: 49–52. [Google Scholar] [CrossRef]
  38. Klinger, Ulrike, and Jakob Svensson. 2015. The emergence of network media logic in political communication: A theoretical approach. New Media and Society 17: 1241–57. [Google Scholar] [CrossRef]
  39. Li, Xiang-Yang, Jian-Ping Ge, Wei-Qiang Chen, and Peng Wang. 2019. Scenarios of rare earth elements demand driven by automotive electrification in China: 2018–2030. Resources, Conservation and Recycling 145: 322–31. [Google Scholar] [CrossRef]
  40. Maltais, Aaron, and Björn Nykvist. 2020. Understanding the role of green bonds in advancing sustainability. Journal of Sustainable Finance and Investment. [Google Scholar] [CrossRef] [Green Version]
  41. Mariana, Christy Dwita, Irwan Adi Ekaputra, and Zaäfri Ananto Husodo. 2020. Are Bitcoin and Ethereum safe-havens for stocks during the COVID-19 pandemic? Finance Research Letters 38: 101798. [Google Scholar] [CrossRef]
  42. Marscheider-Weidemann, Frank Marscheider-Weidemann, Luis A. Tercero Espinoza Espinoza, Sander Hoenderdaal Hoenderdaal, and Wina Graus Graus. 2013. Can a dysprosium shortage threaten green energy technologies? Energy 49: 344–55. [Google Scholar] [CrossRef]
  43. Moore, Tomoe, and Ping Wang. 2014. Dynamic linkage between real exchange rates and stock prices: Evidence from developed and emerging Asian markets. International Review of Economics and Finance 29: 1–11. [Google Scholar] [CrossRef] [Green Version]
  44. Nguyen, Thi Thu Ha, Muhammad Abubakr Naeem, Faruk Balli, Hatice Ozer Balli, and Xuan Vinh Vo. 2020. Time-frequency comovement among green bonds, stocks, commodities, clean energy, and conventional bonds. Finance Research Letters 40: 101739. [Google Scholar] [CrossRef]
  45. Paule-Vianez, Jessica, Camilo Prado-Román, and Raúl Gómez-Martínez. 2020. Economic policy uncertainty and Bitcoin. Is Bitcoin a safe-haven asset? European Journal of Management and Business Economics 29: 347–63. [Google Scholar] [CrossRef] [Green Version]
  46. Qin, Meng, Chi-Wei Su, and Ran Tao. 2020. BitCoin: A new basket for eggs? Economic Modelling 94: 896–907. [Google Scholar] [CrossRef]
  47. Ratner, Mitchell, and Chih-Chieh Jason Chiu. 2013. Hedging stock sector risk with credit default swaps. International Review of Financial Analysis 30: 18–25. [Google Scholar] [CrossRef]
  48. Reboredo, Juan Carlos. 2018. Green bond and financial markets: Co-movement, diversification and price spillover effects. Energy Economics 74: 38–50. [Google Scholar] [CrossRef]
  49. Reboredo, Juan C., and Andrea Ugolini. 2020. Price connectedness between green bond and financial markets. Economic Modelling 88: 25–38. [Google Scholar] [CrossRef]
  50. Reboredo, Juan C., Andrea Ugolini, and Fernando Antonio Lucena Aiube. 2020. Network connectedness of green bonds and asset classes. Energy Economics 86: 104629. [Google Scholar] [CrossRef]
  51. Saeed, Tareq, Elie Bouri, and Dang Khoa Tran. 2020a. Hedging strategies of green assets against dirty energy assets. Energies 12: 3141. [Google Scholar] [CrossRef]
  52. Saeed, Tareq, Elie Bouri, and Hamed Alsulami. 2020b. Extreme return connectedness and its determinants between clean/green and dirty energy. Energy Economics 96: 105017. [Google Scholar] [CrossRef]
  53. Schmid, Marc. 2019. Mitigating supply risks through involvement in rare earth projects: Japan’s strategies and what the US can learn. Resources Policy 63: 101457. [Google Scholar] [CrossRef]
  54. Shaikh, Imlak. 2020. Policy uncertainty and Bitcoin returns. Borsa Istanbul Review 20: 257–68. [Google Scholar] [CrossRef]
  55. Su, Chi-Wei, Meng Qin, Ran Tao, and Xiaoyan Zhang. 2020. Is the status of gold threatened by Bitcoin? Economic Research-Ekonomska Istrazivanja 33: 420–37. [Google Scholar] [CrossRef]
  56. Tang, Dragon Yongjun, and Yupu Zhang. 2020. Do shareholders benefit from green bonds? Journal of Corporate Finance 61: 1–18. [Google Scholar] [CrossRef]
  57. Wang, Xibo, Yalin Lei, Jianping Ge, and Sanmang Wu. 2015. Production forecast of China’s rare earths based on the generalized Weng model and policy recommendations. Resources Policy 43: 11–18. [Google Scholar] [CrossRef] [Green Version]
  58. Wang, Gang-Jin, Chi Xie, Danyan Wen, and Longfeng Zhao. 2019a. When Bitcoin meets economic policy uncertainty (EPU): Measuring risk spillover effect from EPU to Bitcoin. Finance Research Letters 31: 489–97. [Google Scholar] [CrossRef]
  59. Wang, Pengfei, Wei Zhang, Xiao Li, and Dehua Shen. 2019b. Is cryptocurrency a hedge or a safe haven for international indices? A comprehensive and dynamic perspective. Finance Research Letters Journal 31: 1–18. [Google Scholar] [CrossRef]
  60. Wu, Shan, Mu Tong, Zhongyi Yang, and Abdelkader Derbali. 2019. Does gold or Bitcoin hedge economic policy uncertainty? Finance Research Letters 31: 171–78. [Google Scholar] [CrossRef]
  61. Yen, Kuang-Chieh, and Hui-Pei Cheng. 2020. Economic Policy Uncertainty and Cryptocurrency Volatility. Finance Research Letters 38: 101428. [Google Scholar] [CrossRef]
  62. Zhou, Baolu, Zhongxue Li, and Congcong Chen. 2017. Global potential of rare earth resources and rare earth demand from clean technologies. Minerals 7: 203. [Google Scholar] [CrossRef] [Green Version]
Figure 1. Original data. Note: Figure 1 potrays the level series for the considered time period. Subfigures (a) USEPU daily values, (b) CNEPU daily values, (c) UKEPU daily values, (d) S&P green bonds daily index, (e) MVIS global rare earth elements daily index. and (f) US clean energy stocks daily index.
Ijfs 09 00040 g001
Figure 2. 1st difference series. Note: Figure 1 delineats first difference series of log returns. Subfigures (a) USEPU, (b) CNEPU, (c) UKEPU, (d) S&P green bonds index, (e) MVIS global rare earth elements index. and (f) US clean energy stocks index.
Ijfs 09 00040 g002aIjfs 09 00040 g002b
Figure 3. Dynamic Conditional Correlations (A). Note: Subfigures demonstrate the dynamic conditional correlations, subfigure (a) DCC between GB and USEPU, (b) DCC between GB and CHEPU, (c) DCC between GB and UKEPU, (d) DCC between GB and CES, (e) DCC between GB and REE, and (f) DCC between GB and CES. Authors report a median spline graph to smooth reoccurring variations. The horizontal line demonstrates the zero correlation on the y-axis and time on x-axis. A refers to full sample estimation for hedging and diversification.
Ijfs 09 00040 g003
Figure 4. Dynamic Conditional Correlations (B). Note: B refers to the COVID-19 period (1 December 2019 to 30 September 2020) for safe haven properties. Subfigures demonstrate the dynamic conditional correlations, (ac) DCCs between GB and USEPU, CHEPU and UKEPU respectively. Subfigure (d) DCC between GB and REE, (e) DCC between GB and CES, (f) DCC between REE and CES. Subfigures (gi) DCCs between REE and USEPU, CHEPU and UKEPU respectively. Likewise, subfigures (jl) DCCs between CES and USEPU, CHEPU, UKEPU respectively. Authors report a median spline graph to smooth reoccurring variations. The horizontal line demonstrates the zero correlation on the y-axis and time on x-axis.
Ijfs 09 00040 g004
Table 1. Descriptive Statistics.
CESCHEPUGBREEUKEPUUSEPU
Mean2.3004.7554.8995.8925.5464.418
Median2.2684.7824.9055.8045.5144.361
Maximum2.8626.0755.0266.5037.8676.694
Minimum2.0502.1144.8025.2232.7951.200
Standard Deviation0.1490.4610.0480.2970.6750.656
Skewness1.055−0.5580.1240.3580.0470.604
Kurtosis4.3244.6982.5472.1342.7444.090
Jarque–Bera422.910281.42118.21386.11722.040180.427
Probability0.0000.0000.0000.0000.0040.000
Observations163616361636163616361636
Note: The descriptive statistics is based on the daily values of all indices. Values in bold indicate significant coefficients at the 5% level (values in parentheses). Abbreviation; Green Bonds (GB), Global Rare Earth Elements (REE), Clean Energy Stocks (CES), United States Economic Policy Uncertainty (USEPU), China Economic Policy Uncertainty (CHEPU), and United Kingdom Economic Policy Uncertainty (UKEPU).
Table 2. Portmanteau (Q) Test for Serial Correlation.
GBCESREE
Q Test27,688.64923,957.796728,487.137
Probability0.0000.0000.000
USEPUCHEPUUKEPU
Q Test9378.4235538.644912,169.8416
Probability0.0000.0000.000
Note: Refer to Table 1 for abbreviations. Bold values in parentheses depict the p-values at the 1% level.
Table 3. Philips Perron test of ADF results (1st Difference).
Indext-Statistics(Probability)
USEPU−65.815(0.000) ***
CHEPU−72.173(0.000) ***
UKEPU−66.315(0.000) ***
CES−30.095(0.000) ***
GB−36.399(0.000) ***
REE−37.336(0.000) ***
Note: *** indicates the significance level at 5% and p-values in parenthesis indicates that all series are stationary, thus appropriate for DCC-GARCH estimation.
Table 4. Preliminary Evidence from Unconditional Correlation.
IndexesCorrelation Coefficientt-Statsp-Values
CES–CHEPU−0.0160.6500.026
GB–CES0.58829.4030.000
GB–CHEPU−0.142−5.7800.000
REE–CES0.0592.4070.016
REE–CHEPU−0.165−6.7630.000
REE–GB0.1074.3620.000
CES–UKEPU−0.132−5.3940.000
GB–UKEPU−0.041−1.6610.010
REE–UKEPU−0.132−5.3840.000
CES–USEPU−0.1917.8860.000
GB–USEPU−0.36115.6420.000
REE–USEPU−0.348−15.0260.000
Note: Statistical significance at the 5% level. Correlation values in bold denote unconditional correlation coefficients at t 0 .
Table 5. DCC Multivariate GARCH Estimations (A).
GBREECESGBUSEPUCHEPUUKEPU
Constant0.0000.0000.0000.0000.088−0.0030.073
0.0000.0000.0000.0000.0000.9540.001
Arch1.0701.1141.1380.8840.3950.1360.333
0.0000.0000.0000.0000.0000.0000.000
Garch−0.0020.001−0.0020.0020.3840.9060.457
0.5570.1960.5430.3230.0000.0000.000
C10.293 0.119
0.000 0.000
C20.704 0.856
0.000 0.000
χ2 test14,000,000.000 140,000.000
0.000 0.000
REEUSEPUCHEPUUKEPUCESUSEPUCHEPUUKEPU
Constant0.0000.089−0.0360.0820.0000.091−0.0380.075
0.0000.0000.3570.0000.0000.0000.3370.030
Arch0.8720.3810.1400.3600.8500.3730.1350.294
0.6490.0000.0000.0000.0000.0000.0000.000
Garch0.0000.3911.0630.4230.0030.3441.0700.460
0.0000.0000.0000.0000.333000
C10.106 0.101
0.000 0.000
C20.873 0.866
0.000 0.000
χ2 test190,000.000 66,027.280
0.000 0.000
Note: Table 4 exhibits the DCC-MGARCH full sample results for hedging and diversification properties of green bonds. Bold values in parentheses demonstrate p-values. These parameter coefficients are output from the DCC-MGARCH model: h i , t = δ i + p = 1 p i A i p ε i , t p 2 + q = 1 q i B i , q h i , t p and Q t = ( 1 m = 1 M m n = 1 N φ n ) Q ¯ + n = 1 N φ n Q t n + m = 1 M m ( ϑ i , t m ϑ j , t m ) . A refers to full sample estimation for hedging and diversification.
Table 6. DCC Multivariate GARCH Estimations (B).
CESUSEPUCHEPUUKEPUGBUSEPUCHEPUUKEPU
Constant0.0000.06385820.01853690.03154510.00002070.07685390.0003810.0603688
0.0130.2230.8740.5850.030.1240.9980.318
Arch0.87624060.44785750.18392590.3834526−0.0253520.4850330.21502080.4416211
000.0880000.0480
Garch−0.01220340.3913630.1810.5213946−0.0250.31199240.86854950.3847559
0.0690.038−0.3350.0030.230.0830.160.021
C10.1132437 0.1861076
0 0
C20.8660593 0.7897954
0 0
χ2 test18,908.87 22,122.61
0 0
REEUSEPUCHEPUUKEPUGBCESREE
Constant0.00096070.05835260.03575470.03417160.00004680.00072250.0017002
0.0070.3410.7740.6540.00100.02
Arch0.90390610.44423680.17849360.37611460.84523060.78978220.7691403
000.0920000
Garch−0.0405210.41188720.71053580.54813330.01401950.0639737−0.0081224
0.0630.0440.220.0060.6940.0410.916
C10.1328137 0.8438846
0 0
C20.8607332 0.0976604
0 0.053
χ2 test110,000.00 6275.61
0 0
Note: Table 5 exhibits the DCC-MGARCH (during COVID-19) results for safe haven properties of green bonds, clean energy stocks, and global rare elements. Bold values in parentheses demonstrate p-values. These parameter coefficients are output from the DCC-MGARCH model: h i , t = δ i + p = 1 p i A i p ε i , t p 2 + q = 1 q i B i , q h i , t p and Q t = ( 1 m = 1 M m n = 1 N φ n ) Q ¯ + n = 1 N φ n Q t n + m = 1 M m ( ϑ i , t m ϑ j , t m ) . B refers to the COVID-19 period (1 December 2019 to 30 September 2020) for safe haven properties.
Table 7. Dynamic Conditional Correlation Coefficients.
Dynamic Conditional Correlation Coefficients (A)
GB–REEGB–CESREE–CESGB–USEPUGB–CHEPUGB–UKEPU
0.4130.7630.2710.386−0.191−0.415
0.0000.0000.0210.0010.0450.047
CES–USEPUCES–CHEPUCES–UKEPUREE–USEPUREE–CHEPUREE–UKEPU
−0.519−0.085−0.4630.065−0.482−0.024
0.004−0.0840.029−0.049−0.042−0.050
Dynamic Conditional Correlation Coefficient (B)
GB–REEGB–CESREE–CESGB–USEPUGB–CHEPUGB–UKEPU
0.2390.1980.418−0.019−0.048−0.109
0.0010.0040.000−0.009−0.081−0.038
REE–USEPUREE–CHEPUREE–UKEPUCES–USEPUCES–CHEPUCES–UKEPU
−0.053−0.016−0.054−0.128−0.007−0.340
0.0420.0450.0000.0000.0920.000
Note: Values in bold denote dynamic conditional correlation between all indices and the values in parentheses depict the p-values. A refers to full sample estimation for hedging and diversification and B refers to the COVID-19 period (1 December 2019 to 30 September 2020) for safe haven properties.
Publisher’s Note: MDPI stays neutral with regard to jurisdictional claims in published maps and institutional affiliations.

