Article

Crowdsourcing without Data Bias: Building a Quality Assurance System for Air Pollution Symptom Mapping

1
Department of Geoinformatics, Cartography and Remote Sensing, Faculty of Geography and Regional Studies, University of Warsaw, Krakowskie Przedmieście 30, 00-927 Warsaw, Poland
2
Department of Grassland and Landscape Studies, Faculty of Agrobioengineering, University of Life Sciences, 15 Akademicka St., 20-950 Lublin, Poland
3
Department of Geoinformatics and Applied Computer Science, Faculty of Geology, Geophysics and Environmental Protection, AGH University of Science and Technology, Mickiewicza Av. 30, 30-059 Cracow, Poland
4
Department of Clinical and Environmental Allergology, Jagiellonian University Medical College, Botaniczna 3, 31-531 Kraków, Poland
*
Author to whom correspondence should be addressed.
ISPRS Int. J. Geo-Inf. 2021, 10(2), 46; https://0-doi-org.brum.beds.ac.uk/10.3390/ijgi10020046
Submission received: 2 December 2020 / Revised: 5 January 2021 / Accepted: 20 January 2021 / Published: 22 January 2021
(This article belongs to the Special Issue Citizen Science and Geospatial Capacity Building)

Abstract

:
Crowdsourcing is one of the spatial data sources, but due to its unstructured form, the quality of noisy crowd judgments is a challenge. In this study, we address the problem of detecting and removing crowdsourced data bias as a prerequisite for better-quality open-data output. This study aims to find the most robust data quality assurance system (QAs). To achieve this goal, we design logic-based QAs variants and test them on the air quality crowdsourcing database. By extending the paradigm of urban air pollution monitoring from particulate matter concentration levels to air-quality-related health symptom load, the study also builds a new perspective for citizen science (CS) air quality monitoring. The method includes the geospatial web (GeoWeb) platform as well as a QAs based on conditional statements. A four-month crowdsourcing campaign resulted in 1823 outdoor reports, with a rejection rate of up to 28%, depending on the applied. The focus of this study was not on digital sensors’ validation but on eliminating logically inconsistent surveys and technologically incorrect objects. As the QAs effectiveness may depend on the location and society structure, that opens up new cross-border opportunities for replication of the research in other geographical conditions.

Graphical Abstract

1. Introduction

Urban air pollution is well known to cause negative health impacts. Therefore, the monitoring of pollutant concentration levels plays a key role in understanding air quality and its effects on the subjective well-being (SWB) of citizens [1]. The SWB reflects the philosophical notion of a good life, as a proxy for assessing life satisfaction, momentary experiences, and stress. Kim-Prieto et al. [2] also took into account contemporary health hazards, among which air pollution is a key factor [3,4]. The development of smart and sustainable cities can only be accomplished through inclusive growth, using smart people, technologies, and policies [5]. From the perspective of smart people [6]—those who use smart devices to make their everyday living easier and health safer—we found it necessary to develop geospatial web (GeoWeb) solutions to measure the adverse impact of cities on their inhabitants. Ensuring measurement credibility becomes a key scientific challenge in this context. To this end, we carried out research on the example of air pollution health symptoms, an emerging trend particularly related to odor [7] and green pollutant [8] crowdsensing [9,10]. As crowdsensing (or, more generally, crowdsourcing) methods for health symptom mapping are subject to data bias [11], we developed and tested a quality assurance mechanism (QAm) framework (Section 2.2), which can be transferred to similar health-symptom-based studies.
Sparse or irregular monitoring station networks as well as limited access to the reference air pollution data underlie the need for citizen science (CS) activities in the field of air pollution monitoring. Personalized information about exposure to air pollutants, monitoring during acute events or at specific locations, partnerships with local governments, and educational and community-driven purposes are the key benefits of bottom-up environmental monitoring. CS enables the collection of data on much larger spatial and temporal scales and at much finer resolution than would otherwise be possible. The issue of urban air pollution crowdsourcing motivated the implementation of several CS programs, such as those led by Mapping for Change, a community interest company in London (e.g., Pepys Air Quality Project, Science in the City Project, Love Lambeth Air (https://mappingforchange.org.uk/projects/)), as well other international-scale activities found at claircity.eu and citi-sense.eu [12]. All the CS activities mentioned above were hosted on GeoWeb [13,14,15] (as discussed in Section 1.2). In this approach, citizens are required to act as sensors [12,16].
The CS HackAir project (https://www.hackair.eu) as well PollenApp were the projects that undertook the first attempts to crowdsource urban air pollution data, where air pollution was understood as the compound effect of anthropogenic- and biophysical-sourced particulate matter (PM) [8]. Pan-European CS projects, such as Distributed Network for Odor Sensing Empowerment and Sustainability (D-NOSES) [7], have shown that particular aspects of urban air pollution can be measured through the sense of smell of trained citizen scientists. Despite the subjective measurement nature of the human sense of smell, human-sensed CS (sCS) meets the high-quality method expectations (D-NOSES meets germ. Verein Deutscher Ingenieure, eng. the Association of German Engineers (VDI) 3940 standard). Ambient air pollution sCS, as well as the symptoms it causes, provides a promising source of spatial information. However, the unstructured nature of crowdsourced data [17,18,19] requires data quality assurance (QA) protocols [20,21], as well as trust and reputation modeling (TRM) [22] procedure development.
To the best of our knowledge, using QA for the purpose of air pollution symptom mapping (APSM) has not yet been investigated. Our goal was to address the challenge of crowdsourced APSM with the use of the GeoWeb platform (Section 2.3) and to solve the data bias problem by using a quality assurance system (QAs; Section 2.2) based on logic rules. By assessing the rejection rate of reports affected by data bias, we provide evidence of reliable air pollution monitoring expressed as the severity of human health symptoms caused by combined factors of anthropogenic and biophysical ambient air pollutants [23]. Extending the paradigm of air pollution referenced by WHO in terms of six main air pollutant [24] concentration levels and their public health impacts [25] to air pollution symptoms (APS), we indicate new possibilities for citizen-driven research and social inclusion in environmental and health-related issues, as experienced by sustainable cities. We also contribute to the development of the sCS data quality methodology.
In our study, we consider health symptoms caused by air pollution as one of the indicators of the current ecological footprint of humanity on the environment. Therefore, we focus on urban air pollution as a case study with the starting point of health symptoms caused by human exposure to air pollutants. This concept highlights the relationship between urban habitats and the SWB of citizens. The issue of air pollution requires spatial information provided thoroughly by a modern spatially variable society [26,27]. This underlines the need to implement a local partnership between monitoring agencies, researchers, and the local community, who all breathe the same air.

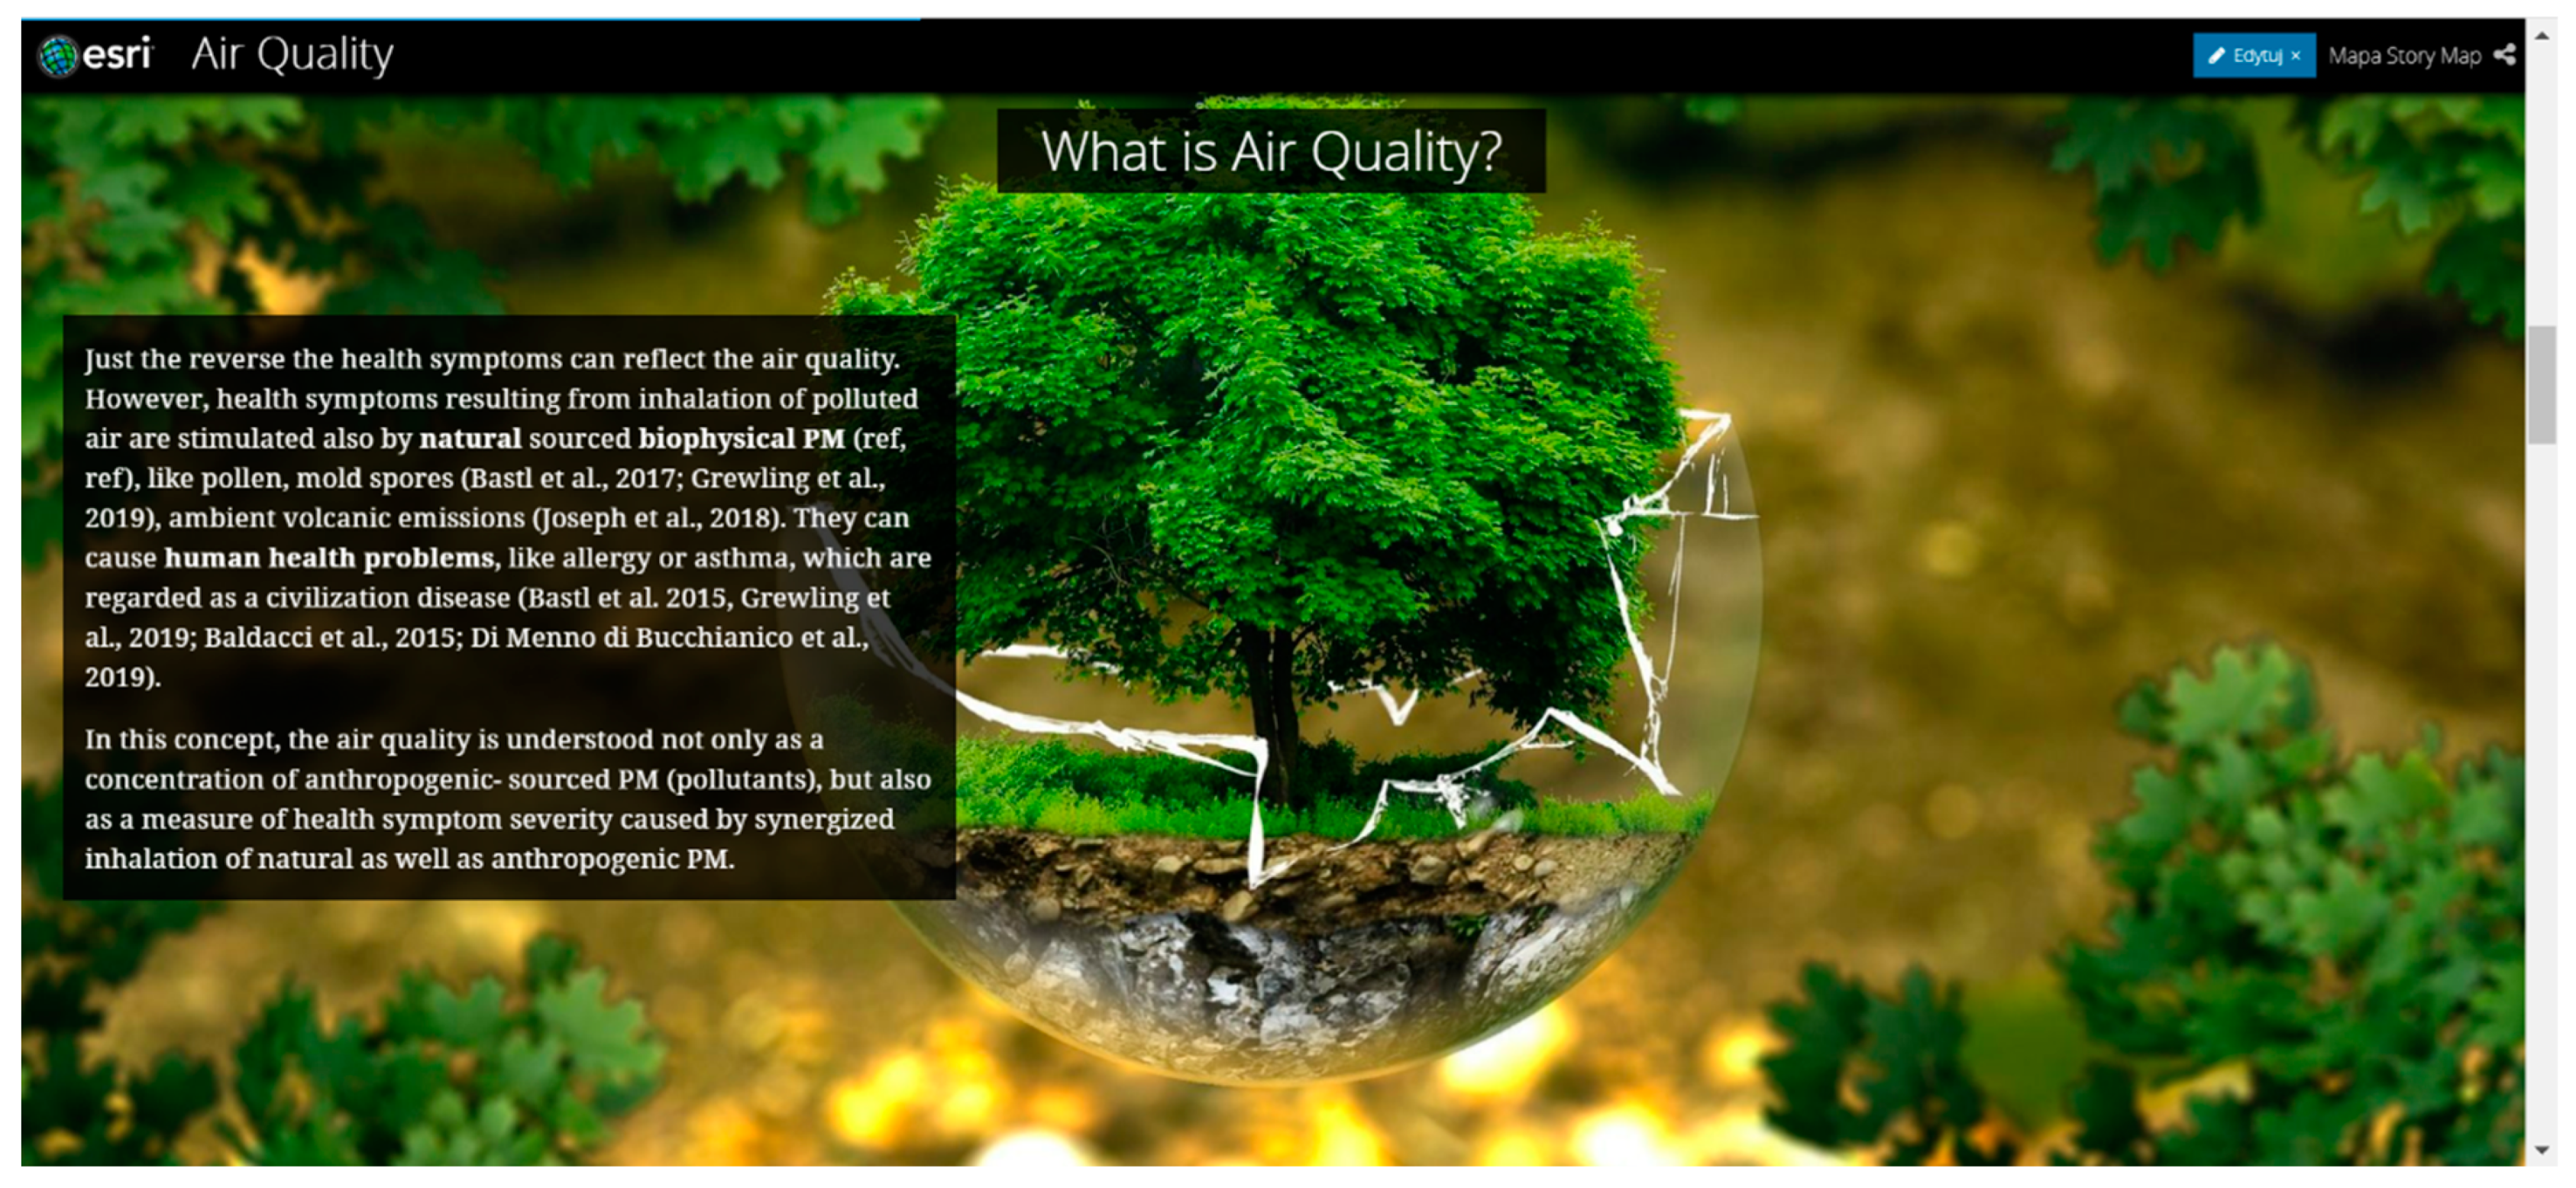
1.1. Extending the Paradigm of Urban Air Pollution

In the field of environmental research air quality, information about the quality (i.e., clean or polluted) of air is reported as an air quality index (AQI) [28]. The AQI tracks six major air pollutants: inhalable particulate matter (PM10), fine particulate matter (PM2.5), ozone (O3), sulfur dioxide (SO2), nitrogen dioxide (NO2), and carbon monoxide (CO) [24]. The spectrum of pollutant sources includes those related to the development of human civilization (anthropogenic pollutants) [23], as well those from natural sources, which questions the belief that everything that is natural is healthy [29]. Ambient air pollution concentrations above the approved limits [30,31] can cause certain health symptoms. Conversely, health symptoms can reflect air pollution. However, health symptoms resulting from inhalation of polluted air are also stimulated by natural-sourced biophysical PM such as pollen, mold spores [23,32], and volcanic emissions [33], causing human health problems such as respiratory allergies, including allergic asthma, which is regarded as an important disease [23,34,35]. Bastl et al. [8,32] described pollen as one of the green pollutants, which are significant components of the atmosphere and are relevant to air quality information for pollen allergy sufferers. This distinction is important for the comprehensive understanding of APS. Air pollution is specified as the concentration of pollutants measured in physical values (e.g., micrograms per cubic meter), whereas air quality refers to the AQI, as well as to classifications, opinions, and feelings, including the experiences of citizens in terms of air- and air-quality-related SWB [1,4]. This concept extends our understanding of air pollution from pollutant concentration levels to personal health symptoms caused by pollutant inhalation. The quantity and severity of symptoms can explain the air quality; however, a consensus about the terminology involving urban air quality has not yet been reached, and researchers typically distinguish air pollution through pollen exposure [36]. There is no symptom classification for air quality yet. Regardless, both factors shape air quality. Future research is required to understand and quantify the interaction of co-exposure to both types of air pollutants and its impact on the severity of human health symptoms [37].
Symptom mapping is a prerequisite for the spatial explanation of both dependencies. The first attempts at citizen symptom mapping related to green pollutants were made by Bastl et al. [32] and Werchan et al. [38]. Their research proved that citizen symptom load can be mapped efficiently using crowdsourced data; however, the sources of the symptoms cannot be clearly determined. The symptom load index is not directly correlated with annual pollen load and has a strong correlation to allergen content [32], with a linear (often daily) correlation [32,39]. Finding that relationship is beyond the scope of this paper; however, crowdsourced symptom data have shown potential as an indicator of the effects of urban air pollution on citizen well-being. The unstructured nature of crowdsourced data requires rigorous QA mechanisms (QAm). In this study, our aim is to identify a QA system for GeoWeb-based APSM to stream high-quality geospatial data. So far, this data stream does not exist. By sharing trusted and open data on air pollution symptoms, our findings can be used for aerobiological and health-risk-forecasting research.

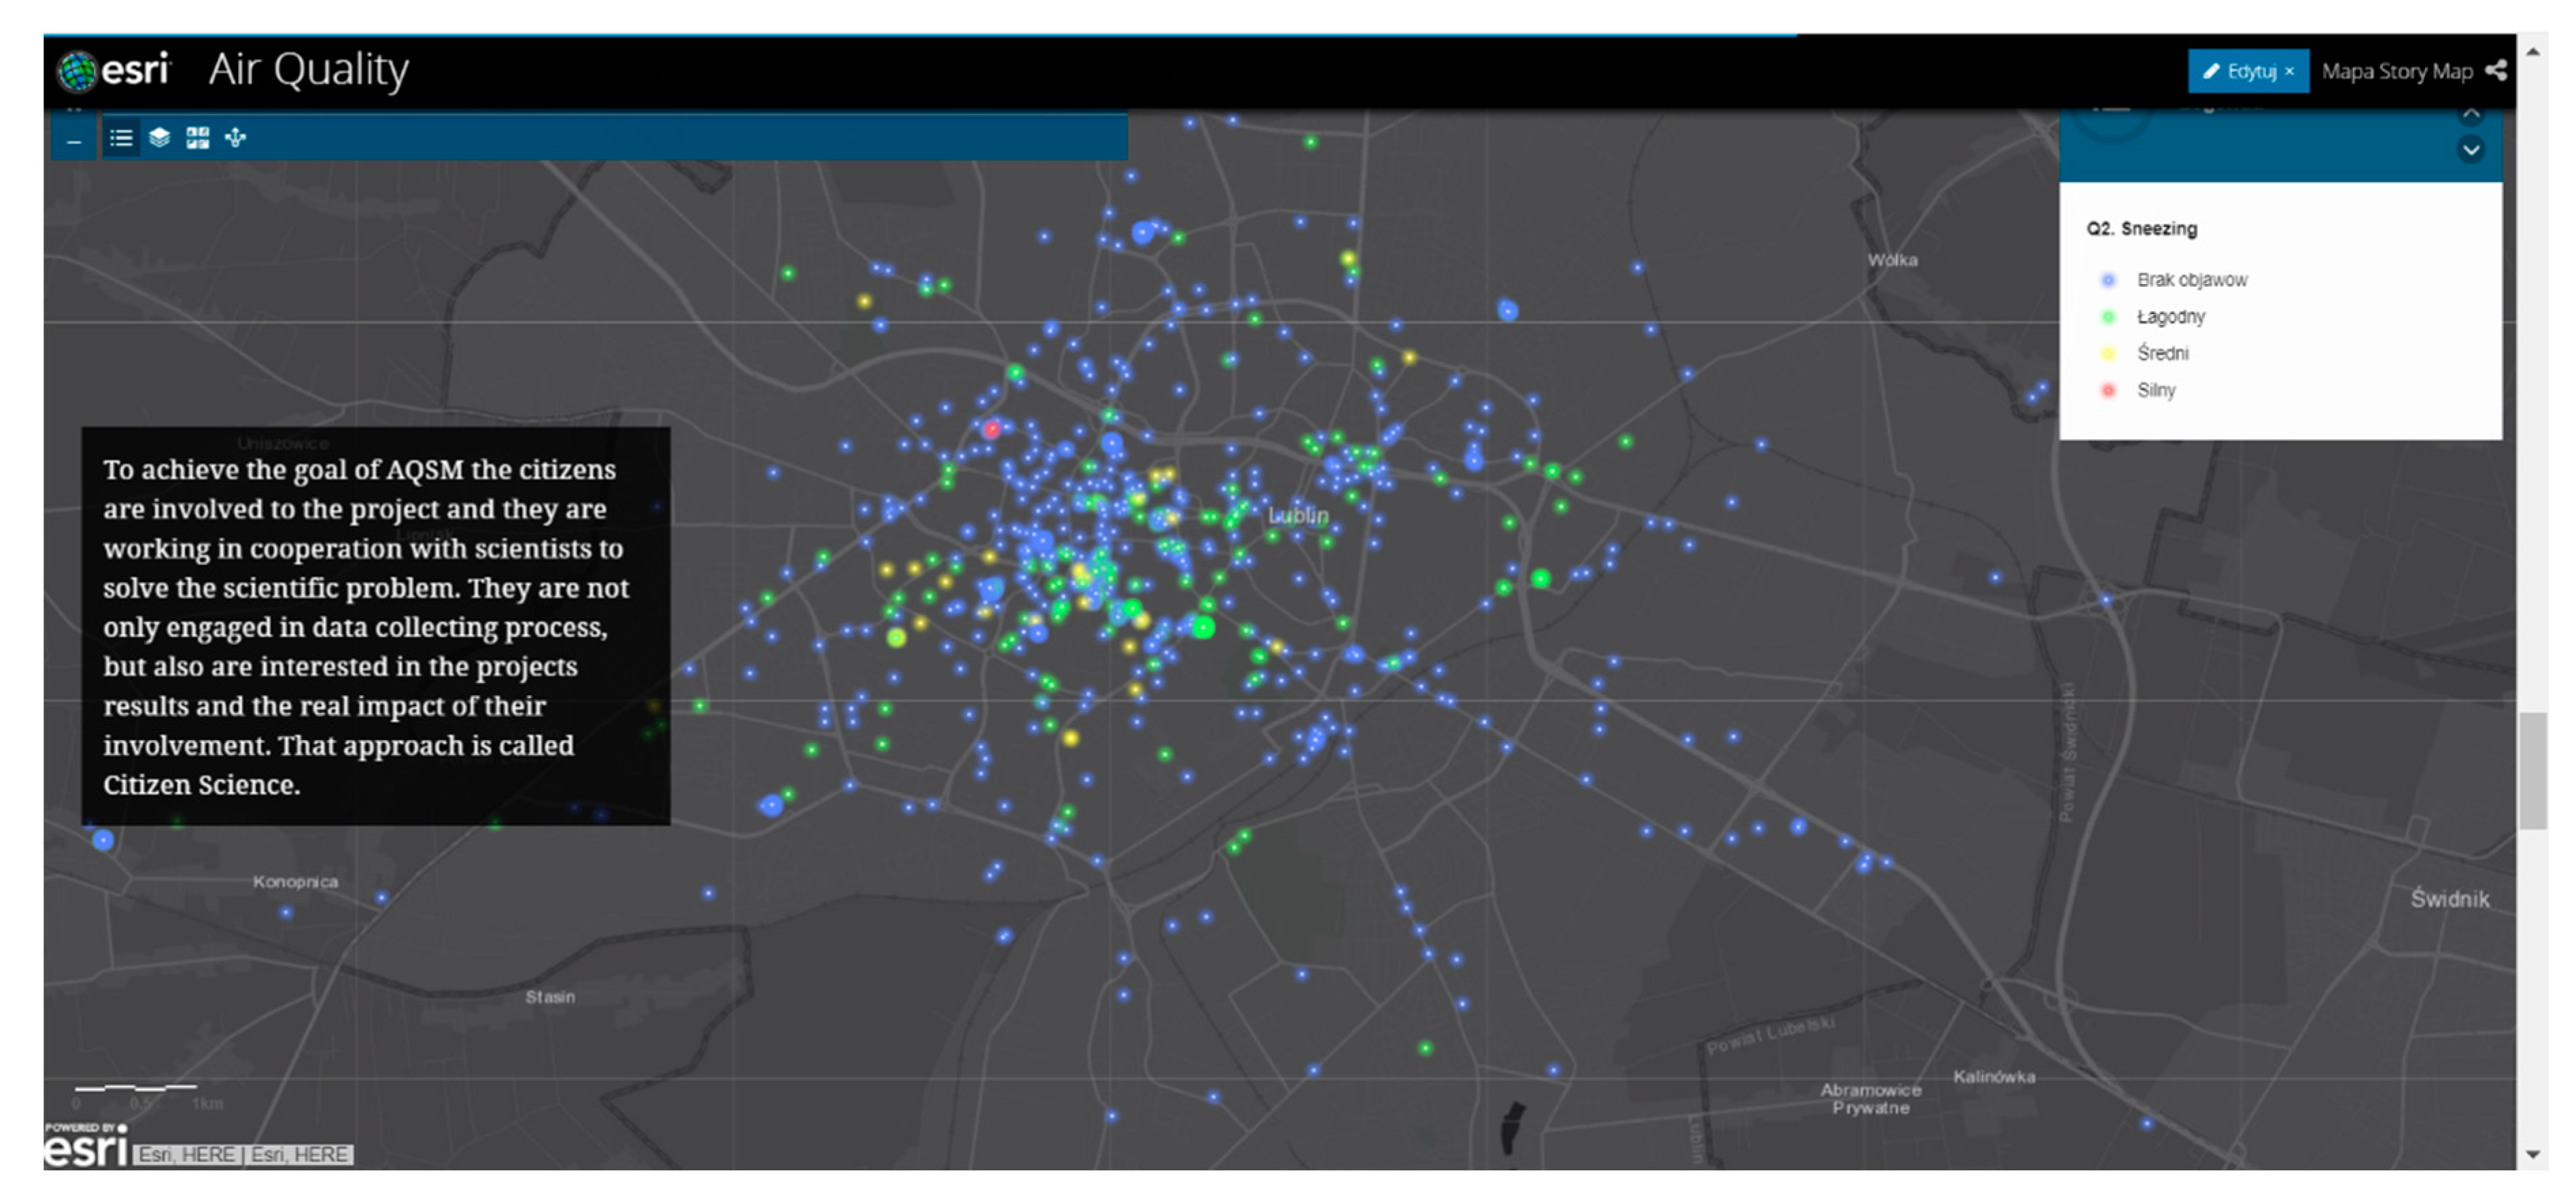
1.2. Contribution of Citizen Science to Improvements in Air Pollution Mapping

According to Haklay [14], geographical citizen science overlaps volunteered geographic information (VGI), especially in the geographical context of citizen-driven research. GeoWeb plays an essential role in this field. However, it is crucial that CS and VGI not be seen as equal, as the main purpose of VGI is to produce geographical information, while citizen science aims to produce new scientific knowledge [40,41]. Citizens engaged in scientific research projects become citizen scientists [42], who, depending upon their personal interests, motivation, education level, and experience in previous projects, engage with different levels of participation and expect to see the results of their research contribution. They contribute to the project by collecting and analyzing data but may also be involved in defining research questions or even interpreting results [14,43,44]. Considering the scope of citizen participation, Haklay [14] defined four levels of CS: crowdsourcing (first level), distributed intelligence (second level), participatory science (third level), and extreme citizen science (fourth level). Citizen involvement in environmental projects on air pollution is usually based on collecting and analyzing sensor data in the form of online maps. In this way, knowledge is produced. The fundamental questions about the harmful health effects of air pollutants have been asked, so these activities are typified as CS level 1 and CS level 2. Of course, higher levels (depending on the engagement of members) are not excluded. In the case of odor crowdsourcing, which requires training as well as expecting measurement insights back from members, a collection method can be devised (i.e., level 3). Our study was based on the first level of CS, where citizens are engaged in the process of crowdsourcing APS data, producing a new scientific knowledge of APSM, together with researchers. CS provides a solution to research problems [44], while also educating citizens [45].
So far, smartphones have not been considered appropriate equipment for measuring urban air pollution. This is due to the fact that the built-in sensors of smartphones, by default, do not allow users to measure air pollutant concentrations. Therefore, bottom-up activities considering air pollution have usually relied on external, low-cost sensors (initially only capable of PM measurement, these sensors can now also sense all major pollutants, including volatile organic compounds). Loreto et al. [46] emphasized that modern participatory sensing, which is one of three sub-categories of citizen cyberscience [47], has witnessed significant progress related to the fast development and social networking tools of information and communication technologies (ICT), which “allow effective data and opinion collection and real-time information sharing processes”. In that context, Guo et al. [48] and Capponi et al. [49] introduced mobile crowdsensing (MCS), which focuses on sensing and collecting data with mobile devices and aggregating data in the cloud. However, there are pollutants that are still exclusive for Internet of Things sensor dust. A great challenge of contemporary CS measurement is odor sensing, which affects both indoor as well as outdoor air quality. Human-sensed air pollution monitoring seems to be an emerging trend.
In this research, we specify the citizens as sensors and participatory sensing concepts, where the senses, subjective impressions, and perception of humans are the only sensors used in the project; therefore, we propose this as sCS. Moreover, by developing a QA mechanism for sCS, this study contributes to bottom-up air pollution monitoring and open-data credibility.

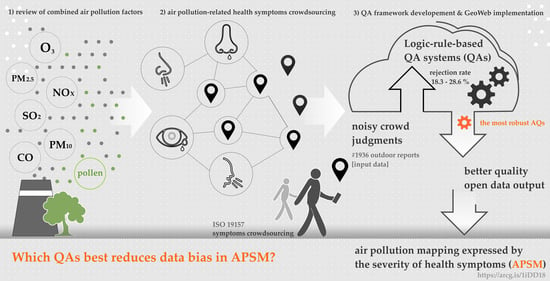
1.3. Importance of Data Quality in Crowdsourced Air Pollution

Data quality issues include errors and biases. Factors affecting the data collected through citizen perceptions result in data biases. CS requires the collaborative contributions of multiple contributors [50], but the assumption of multiple contributors is insufficient to provide high-quality data. Therefore, data quality protocols are an essential part of crowdsourcing-driven research. Although participatory research faces methodological challenges such as biases in data collection [51,52], CS has been proven to be a source of trusted geospatial data [20,53,54,55,56], including for health risk mapping [57,58,59] and risks caused by poor air quality [32,60,61]. The data quality determines its usefulness [62,63]. Thus, the unstructured nature of crowdsourced data requires rigorous data QA protocols [17,64,65,66,67].
The starting point for QA in CS is education and the provisioning of technical information and resources [21,68] in order to increase citizen knowledge about the issues of air pollution and to improve their environmental awareness and motivation to provide air-quality-monitoring supporting activities [60,69,70]. Of the range of crowdsourced data quality measures discussed in the academic literature by Haklay [50] and Foody et al. [67], among others, attribute accuracy and completeness are essential. Furthermore, these aspects of geographic data quality have also been recognized by international standards of spatial data quality. The ISO 19157 [71], which handles the diverse perspective of data quality, defines a set of standardized data quality measures, including completeness of data, positional accuracy, and temporal accuracy, which are all grouped as so-called data quality elements (DQEs) [72]. Each DQE is, then, further evaluated, and the result of the evaluation is documented and reported [67]. The principles of the aforementioned ISO 19157 [71] served as the basis for the proposed APSM data quality assurance framework.
The goal of this study was to answer the question of data quality assurance mechanism implementation in GeoWeb-based APSM. For this purpose, we propose a dedicated APSM framework for the QA mechanisms of start-check, sequence, cross-validation, repeating, and time-loop check in order to reduce data bias, such as user response inconsistency, location inaccuracy, and duplicate time–space-related reports (see Section 2). By combining several logic-based QA mechanisms (QAm), we tested the robustness of the QAm to find the strongest QAm set and build a ranked data quality assurance system (QAs). Our research question was, Which QAs best reduces data bias in APSM? The sources of data bias include contradictory entries in the geodatabase attribute table recorded as answers supplied to the specially created APSM survey. However, we did not solve the problem caused by the non-air-pollution-related factors that affect human symptom severity, which act synergistically with air pollution to contribute to spatial database robustness on health-related symptoms [8,73,74,75,76].

2. Materials and Methods

For our participatory APSM project, we followed the CS development framework of Bonney et al. [77], starting from the research question and project team formulation through to CS action execution and the dissemination of project findings (Section 2.1 and Section 2.3). However, we focused on addressing data bias (Section 2.2) to improve the symptom-based air-pollution-mapping data quality.

2.1. Building a Field Data Collection Strategy

The method was adopted in the city of Lublin and Lubelskie Voivodship, located in eastern Poland. The data collection campaign lasted for one academic semester, from February to May 2018. Starting the campaign in the first quarter of the year is crucial, as anthropogenic pollutants and pollen occur simultaneously at the beginning of the year, especially gaseous pollutants that can act as adjuvants, exacerbating pollen allergenic potency and immunoreactivity [78]. A group of 56 students from different faculties of the University of Life Sciences in Lublin were involved in the project as volunteers and, according to Harlin et al. [79], turned into citizen scientists, of which, 30 spatial management students were the core citizen group of the project. A total of 18 non-academic citizens joined the research and collected data together with the student group. The project was continually open to everybody through the community channel for data and app sharing, which was implemented in GeoWeb. By sharing their conclusions and opinions during the social campaign, the citizens had a direct impact on the optimization of methods used.
To strengthen the data quality potential already before the field data collection campaign began, the scientific student organization of the Spatial Management Faculty of the University of Life Sciences in Lublin organized workshops for the citizen scientists, who were learned about the subject of study and the research project assumptions. Furthermore, they were trained on handling the mobile and web apps (details about apps provided in Section 2.3). The workshops, training, informing, and research project promotion among citizens lasted for the first month.
According to the study requirements, the citizen scientists were asked to collect data only during their daily outdoor activities, preferably once per day. If they observed air-pollution-related symptoms, they were asked to report them as soon as possible. If they caught a cold or were sick, they were expected to stop collecting data until they recovered. The project assumptions and rules for collecting data were included in the mobile app, as a user guide introducing the study. Other educational materials were made available in the narrative web apps.
Our study referred to the patterns of citizen activity characteristic for CS specifics [80]. As such, we implemented a method for citizen engagement improvement, which was based on the monthly activity ranking of users, presenting a number of submitted APS reports. Users were assigned award titles according to the following number of reports sent per month: 1–5, Beginner; 6–10, Pretty Involved; 11–20, Super-Engaged; and >20, Excellent Citizen Scientist. A user-activity-tracking module, included in the operations dashboard app (details in Section 2.3), was public and allowed for competition between the citizens.

2.2. Data Quality Assurance Methods for APSM
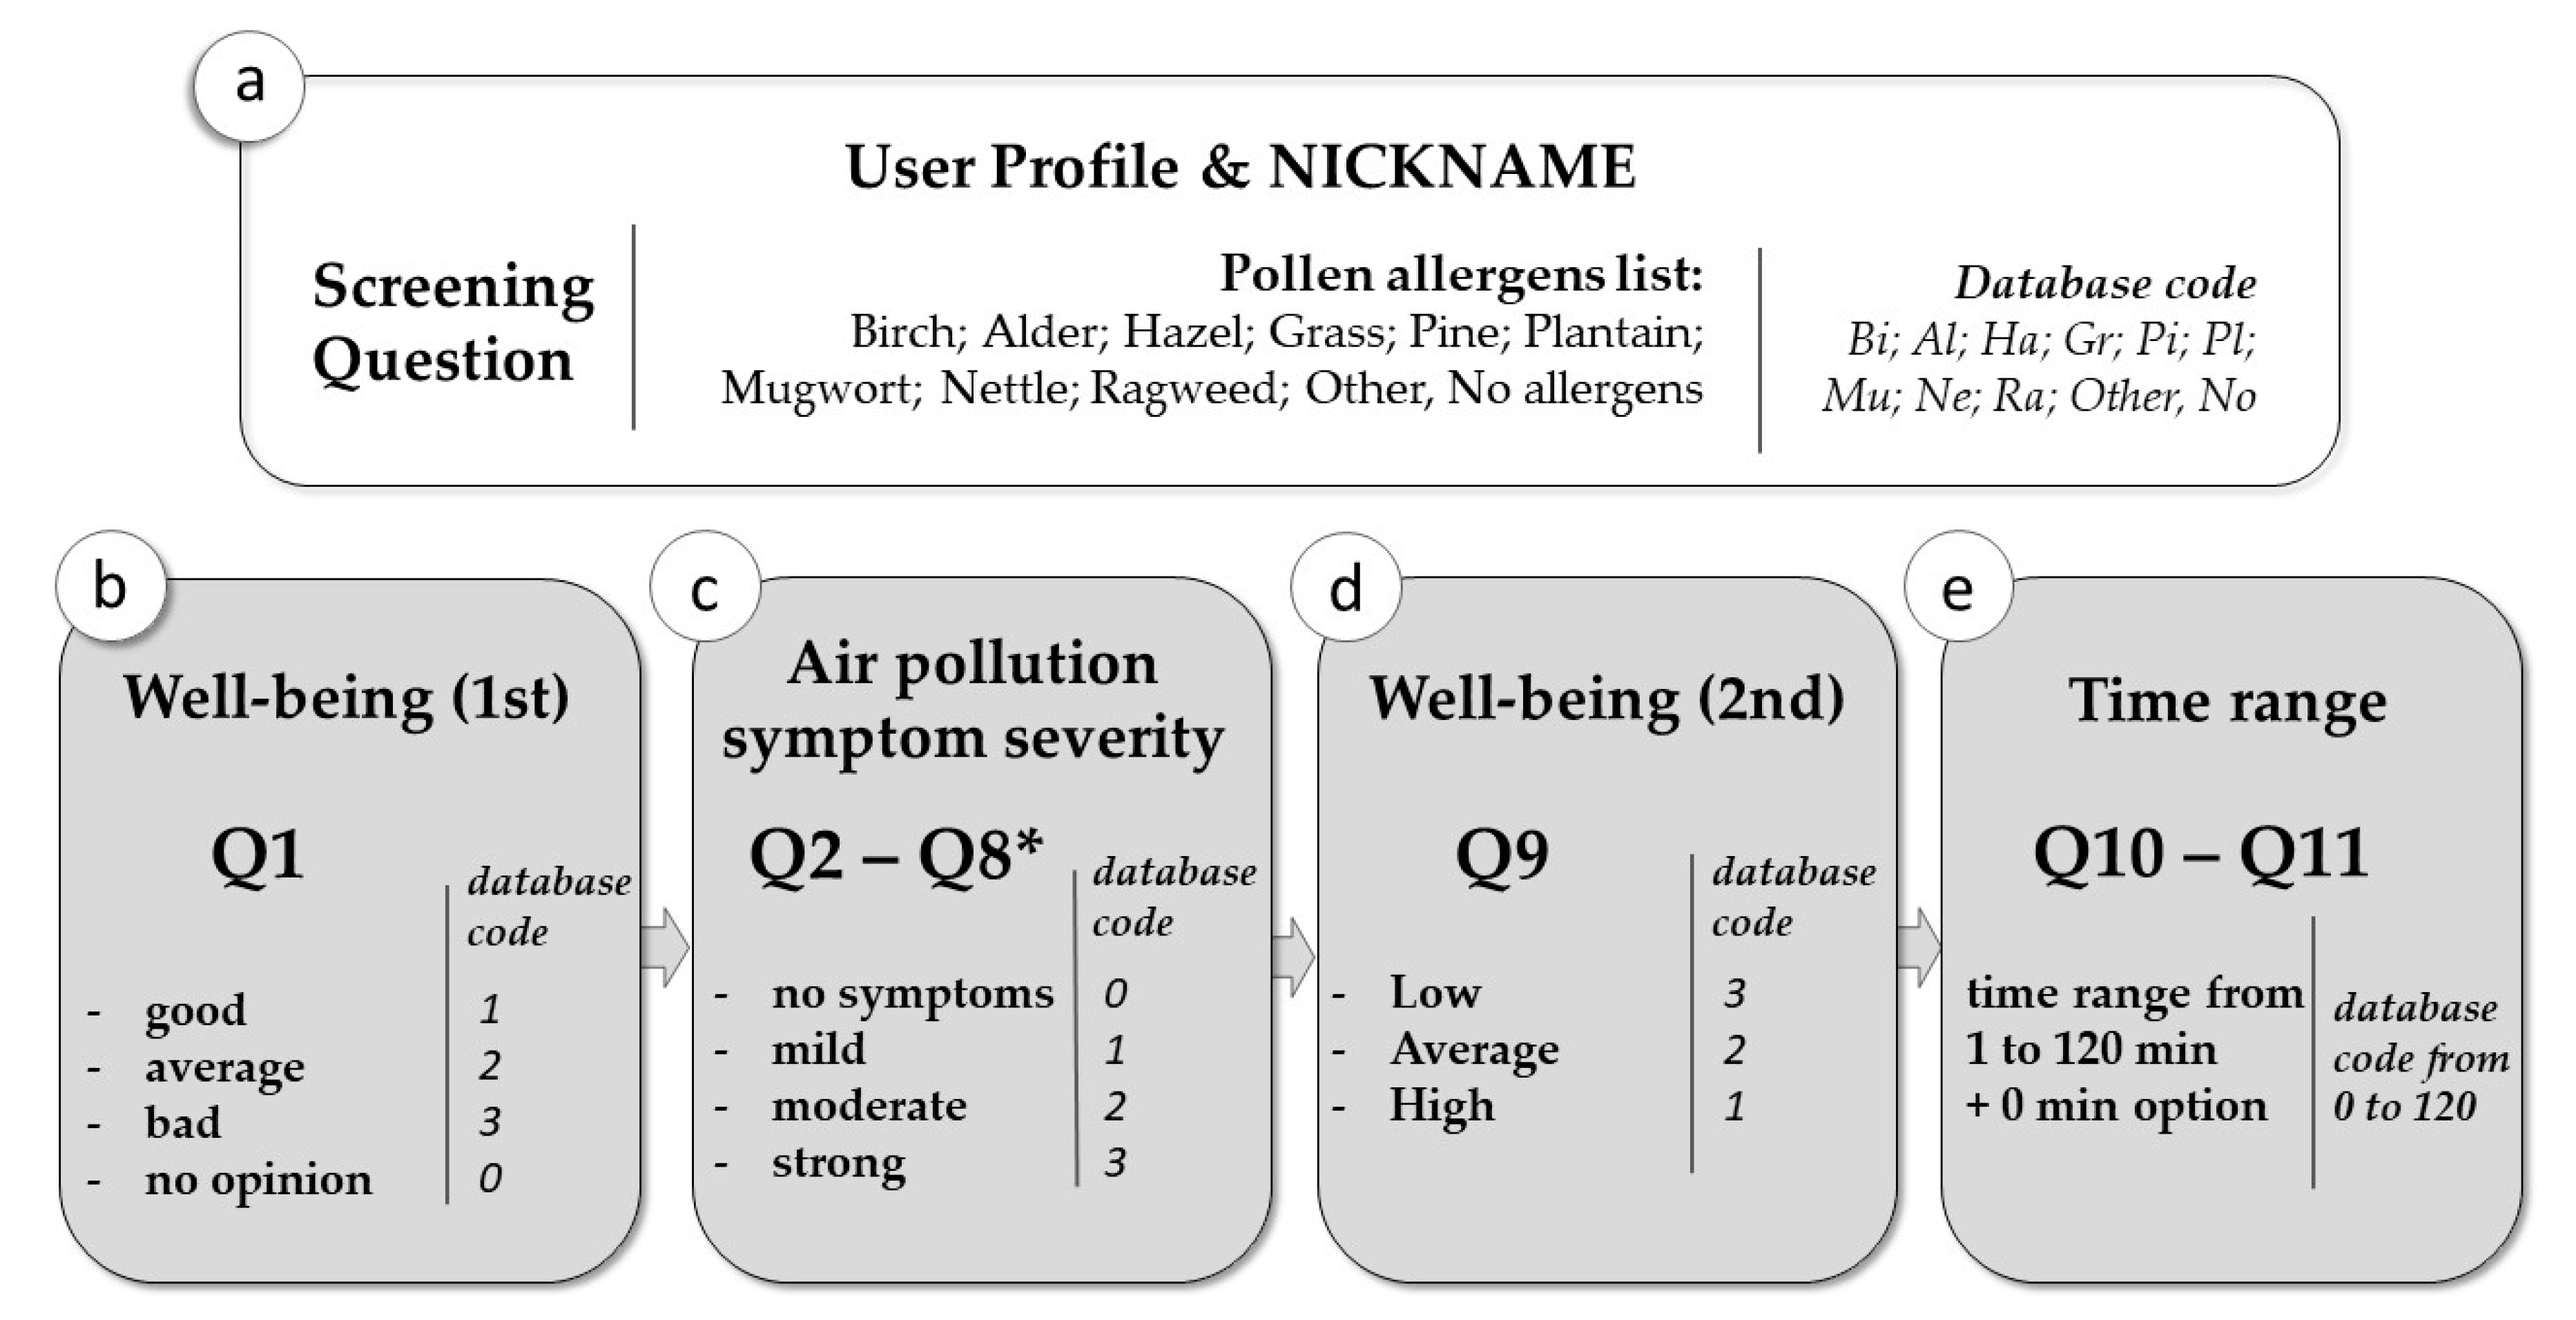
Following other studies of human health symptom severity, such as the Symptom Load Index research in pollen allergy sufferers [81], we used a questionnaire sheet. However, we extended the group of potential citizens to all those who suffered from air-quality-related health symptoms, whereas to improve the method of data quality assessment, the user-screening question was implemented in the questionnaire, which helped identify the more sensitive citizens to air pollution. The question asked for any pollen allergens the user is allergic to (birch, alder, hazel, grass, pine, plantain, mugwort, nettle, ragweed, others; it is also possible to answer no allergens; Figure 1a). The survey included close-ended questions about health symptoms related to air quality according to the classification defined in the research on the epidemiology of allergic diseases in Poland (PL: Epidemiologia Chorob Alergicznych w Polsce (ECAP)) [82], accompanying the SWB question, which developed the QA method; a personal profile with the user-screening question; and finally time range and geolocation information. The questions are as follows:
User-screening question: Which pollen allergens are you allergic to?
Q1. 
How do you feel today?
Q2. 
Sneezing. If you are currently experiencing this symptom, please choose the level of severity.
Q3. 
Nose itching. If you are currently experiencing this symptom, please choose the level of severity.
Q4. 
Runny nose. If you are currently experiencing this symptom, please choose the level of severity.
Q5. 
Watering eyes. If you are currently experiencing this symptom, please choose the level of severity.
Q6. 
Scratchy throat. If you are currently experiencing this symptom, please choose the level of severity.
Q7. 
Breathing problems. If you are currently experiencing this symptom, please choose the level of severity.
Q8. 
Do you rub your eyes?
Q9. 
Could you assess the level of your current self-comfort?
Q10. 
How long have you been in this location?
Q11. 
For how long have you felt your symptoms?
The questionnaire design was inspired by sociological research. We followed the rule that filling out a web form shouldn’t take more than 10 min [83]. The designed web questionnaire was tested in web form so that it did not exceed the assumed 10 min. Following Malchotra [84], the questionnaire contained mainly dichotomous and multiple-choice questions. The APS questions were grouped together [85]. The data stored in the database were displayed as a text data type in the mobile app, which is simple and intuitive for the user. The data were also coded in the database in the short integer data type (except for the user-screening question, which was coded in text data type) and were used for data analysis and statistics, as shown in the flowchart of the APSM questionnaire (Figure 1). The proposed method includes data forms, which are the basis of the developed conditional statements.

2.2.1. QA Methods Applied during the Data Collection Process

We initially adopted three QA methods in the mobile survey app in order to improve data quality during the data collection process. These methods were based on the quality measures of ISO 19157 [71]: positional and temporal accuracy, data completeness, and consistency. The first QA method eliminated identical reports sent from the same location within a certain time interval (5 min) from the database in case the same report was duplicated. The report duplication was confirmed with the same nickname of the citizen who made the report. Then reports lacking geolocation were excluded from the database by the second QA method. The third method controlled the Global Navigation Satellite System (GNSS) positioning accuracy of the reported APS observations, under the assumption that reports with a horizontal accuracy error greater than 100 m are outliers, which were eliminated in the data collection stage. If the surveys were accepted under the three QA methods described above, they were finally checked with the completeness quality measure. Surveys that were not completed, in terms of obligatory questions, were automatically blocked against submission through the mechanism configured in the app so that the database was free from incompleteness.

2.2.2. Logic-Based QA Mechanisms Implemented after the Data Collection Process

The proposed logic-based QA framework for APSM has a four-tier structure, starting with a set of logically related questions, the basis of the quality assurance (QA) mechanisms, which in various configurations form five mechanisms and then QA systems (Figure 2).
The logic formula for each conditional statement was built to filter and eliminate data bias. The conditional statements were the primary components for QA mechanisms. To determine the potential logic rules, the following general criteria based on the database-coded answers from the questionnaire were assumed: Q2–Q7, which are the questions reporting citizen health symptoms, should have been implemented in minimum six conditional statements, while Q1 and Q9 (SWB questions) should have been implemented in minimum two conditional statements each. Then the conditional statements identified data inconsistencies, based on false hypothesis, such that false results were returned (Table 1). The QA mechanisms of start-check, sequence, cross-validation, repeating, and time-loop check were proposed, with one or two levels of robustness (Table 2). These QA mechanisms were implemented in the database after the data collection process was finished.
To date, such a method has not been implemented in an sCS air-pollution-related symptom-mapping project. As a data quality assurance framework for APSM, we propose a data quality assurance system (QAs) that is a combination of each QA mechanism, depending on the QA mechanism robustness variant (Table 3). The choice of the QA system variant depends on the project character: each QA mechanism works independently and, so, can be implemented in the APSM project separately or in any combination, if needed.
The core principle for the research is the logic-based data quality assurance procedure. The start-check, cross-validation, and time-loop check mechanisms are based primarily on the medical assumptions included in the logic rule framework. The other QA mechanisms, sequence and repeating, are purely logical and result from social and psychological survey methods for monitoring, the typical respondent-answering process, and data quality control [86].
The start-check mechanism was used to verify the report consistency at the beginning of the survey, excluding reports whose symptom severity answers were not consistent with the general well-being question. The quality assurance method of applying a general question about the issue preceding the detailed questions was used by Bastl et al. [8] and Bousquet et al. [87]; however, these studies did not report success in using this conditional statement. We examined this in two variants of robustness. Components and algorithms of the start-check mechanism are presented in Table 1 and Table 2, which were implemented in the database work as follows: Variant 1 is less robust and assumes that the report is consistent when the citizens assess their current comfort as “good” (1), and then the answers to Q2–Q7 should be between “no symptoms” (0) and “moderate symptom severity” (2). If the answer for Q1 is poor self-comfort (3), then at least one question between Q2–Q7 must be answered as “strong symptom severity” (3). Variant 2 is stricter and assumes that the possible answers for Q2–Q7 can only be “no symptoms” (0) or “mild symptom severity” (1) when the current comfort is rated as “good” (1). If the answer for Q1 was “poor comfort” (3), the same conditional statement was used as in variant 1. For both variants, the reports with the answer “I have no opinion” (0) for Q1 were excluded.
The sequence mechanism was applied to exclude user automatism in providing answers, which is often caused by a citizen giving rash answers or not reading the questions. Therefore, each report with all questions answered by responses with the same place in the sequence (e.g., every first answer for each question) were eliminated from the database. The QA mechanism is based on the method of rearranging the order of possible answers [88,89] for one question in the sequence of similarly asked questions. The standard order of the answers for questions Q2–Q7 was 1, 2, 3, 0. Q5 was an exception, with an answer order of 3, 0, 1, 2.
The cross-validation mechanism was used to reject responses by using three essentially related questions. If the answer to the additional question was not consistent with one of the two previously answered related questions, the report was excluded. The APS mentioned in Q8 (rubbing eyes) should be related to symptoms of a runny nose (Q4) or watering eyes (Q5). The mechanism was tested in two variants, where variant 2 is stricter.
The repeating mechanism determines the consistency of the report, according to the other previously answered questions, by asking the same question but in a different way. If the repeated answer is not consistent with the former one [21,88,90,91], the report is excluded from the database. This was used with Q9, which repeated the content about the citizen’s self-comfort in Q1. Additionally, the mechanism tested the report’s compatibility based on the repeated SWB question and symptom severity ones (Q2–Q7). The mechanism was examined in two variants of the robustness level analogous to the previous mechanisms.
The time-loop check mechanism was used to eliminate reports that did not align to the geolocation of the citizens, according to the length of their stay in a place in comparison to the duration of their symptoms. Previous studies [92,93,94] have shown that human allergic reactions to pollen range from 10 to 20 min, usually resolving after 1–2 h for an early-phase reaction and 3–4 h with resolution after 6–12 h, sometimes even 24 h, for a late-phase reaction. The late-phase reaction is preceded by an early-phase reaction. The early-phase reaction is characterized by symptoms such as allergic rhinitis (including sneezing, itching, and rhinorrhea) [34,95], while the late phase is connected with nasal congestion and obstruction [34,96]. For anthropogenic-sourced air pollutants PM10 and PM2.5, the reaction time (according to the pollutant type) ranges between 2 and 10 min for the most sensitive subjects and resolves after 30 min [97,98]. For the purpose of APSM, we adopted the time range for the duration of the human early-phase reaction to air pollutants as between 1 min and 2 h. This mechanism assumes that all reports with a time loop value higher than the duration the user remained in the place are eliminated, as such information indicates a late-phase reaction, which is not connected with the actual geolocation of the citizen.

2.3. GeoWeb Method Supporting Data Quality Assurance

The GeoWeb platform, which was the technological basis of this project, to maintain project openness, consists of a mobile app for field data collection based on the configurable Survey123 for the ArcGIS application (Survey123; Esri Inc., Redlands, CA, USA) and a data mapping module, including dashboards (web mapping applications based on ArcGIS Online (AGOL) components; see Figure 3), available to citizens for free on a smartphone but also via a web browser.
The mobile app (A) includes the APS survey for field data collection. The educational and technical training materials (B) are provided in a narrative web mapping application (Esri story map templates), which are served through Representational State Transfer (REST) services. The collected data are sent to the geodatabase through REST services, and raw data are presented in the dashboard app (C) in real time. Then, the raw data are QA-checked in the database using ArcGIS Desktop integrated with the REST and R statistical software (R: a language and environment for statistical computing; R Foundation for Statistical Computing, Vienna, Austria; www.R-project.org) (D), which is used for analysis of the QA mechanisms and QA system variant robustness, as well as the survey result statistics. Finally, the QA-checked data are returned to the database and presented as APSM results in the open web mapping applications, including dashboards (C). The results were reported in the dashboard app as a percentage of the observations eliminated by the most robust QA mechanism combination, presenting the total robustness of the implemented QA system.
The questions proposed for the survey in Section 2.2 were included in the mobile survey, which was divided into individual pages, in order to help the user to quickly navigate between questions without scrolling down the whole form [99,100]. This helped to avoid mistakes in filling out similar APS questions and focus on the relevant section of the survey. An offline mode in the mobile app was secured to collect actual geolocation, even if without the internet. We used a user authorization option with an alphanumeric nickname and a four-digit code at the beginning of the survey in order to help follow the reports of each citizen, while also providing them with anonymity. To improve the quality of collected data, we implemented closed questions with single- or multiple-choice type and data range functionality, which prevented submitting certain reports that were inconsistent with the rules of the project.
Within the field data collection campaign, the reports were mapped, in real time, in a point-symbolized data layer (Figure A4, Appendix A). Cooperation between the Survey123 mobile app and the web mapping module was based on the typical WebGIS architecture [101]. The dashboard displayed the user activity-ranking widget, which was based on a list of 10 most active citizens, presented as their nicknames together with their award titles, as well as their number of reports in the last month (Section 2.1). This functionality helped to enhance the engagement of the citizens during the data collection process.
The design concept and interface description of GeoWeb applications, along with the crowdsourced symptom map formed from the Lublin case study, are provided in Appendix A.

3. Results

Data quality assurance is key for useful and effective sCS, and so, the results mostly focus on the implemented QA mechanisms and the robustness analysis of the QA system variants for air-pollution-related symptom mapping. We first focused on the field data collection campaign, which provided us with the input for our analysis. The citizen activity curves indicated the varying and regularly decreasing activity of the citizens. For QA robustness results, our key focus was the eight QA system variants, the combinations of five logic-based QA mechanisms, which rejected from 18.3% to 28.6% of reports with data bias. As a result, we created and proposed a QA framework for APSM, based on the ArcGIS platform, which was configured and customized to the study requirements. The air-pollution-related symptom map and GeoWeb apps are presented in Appendix A.

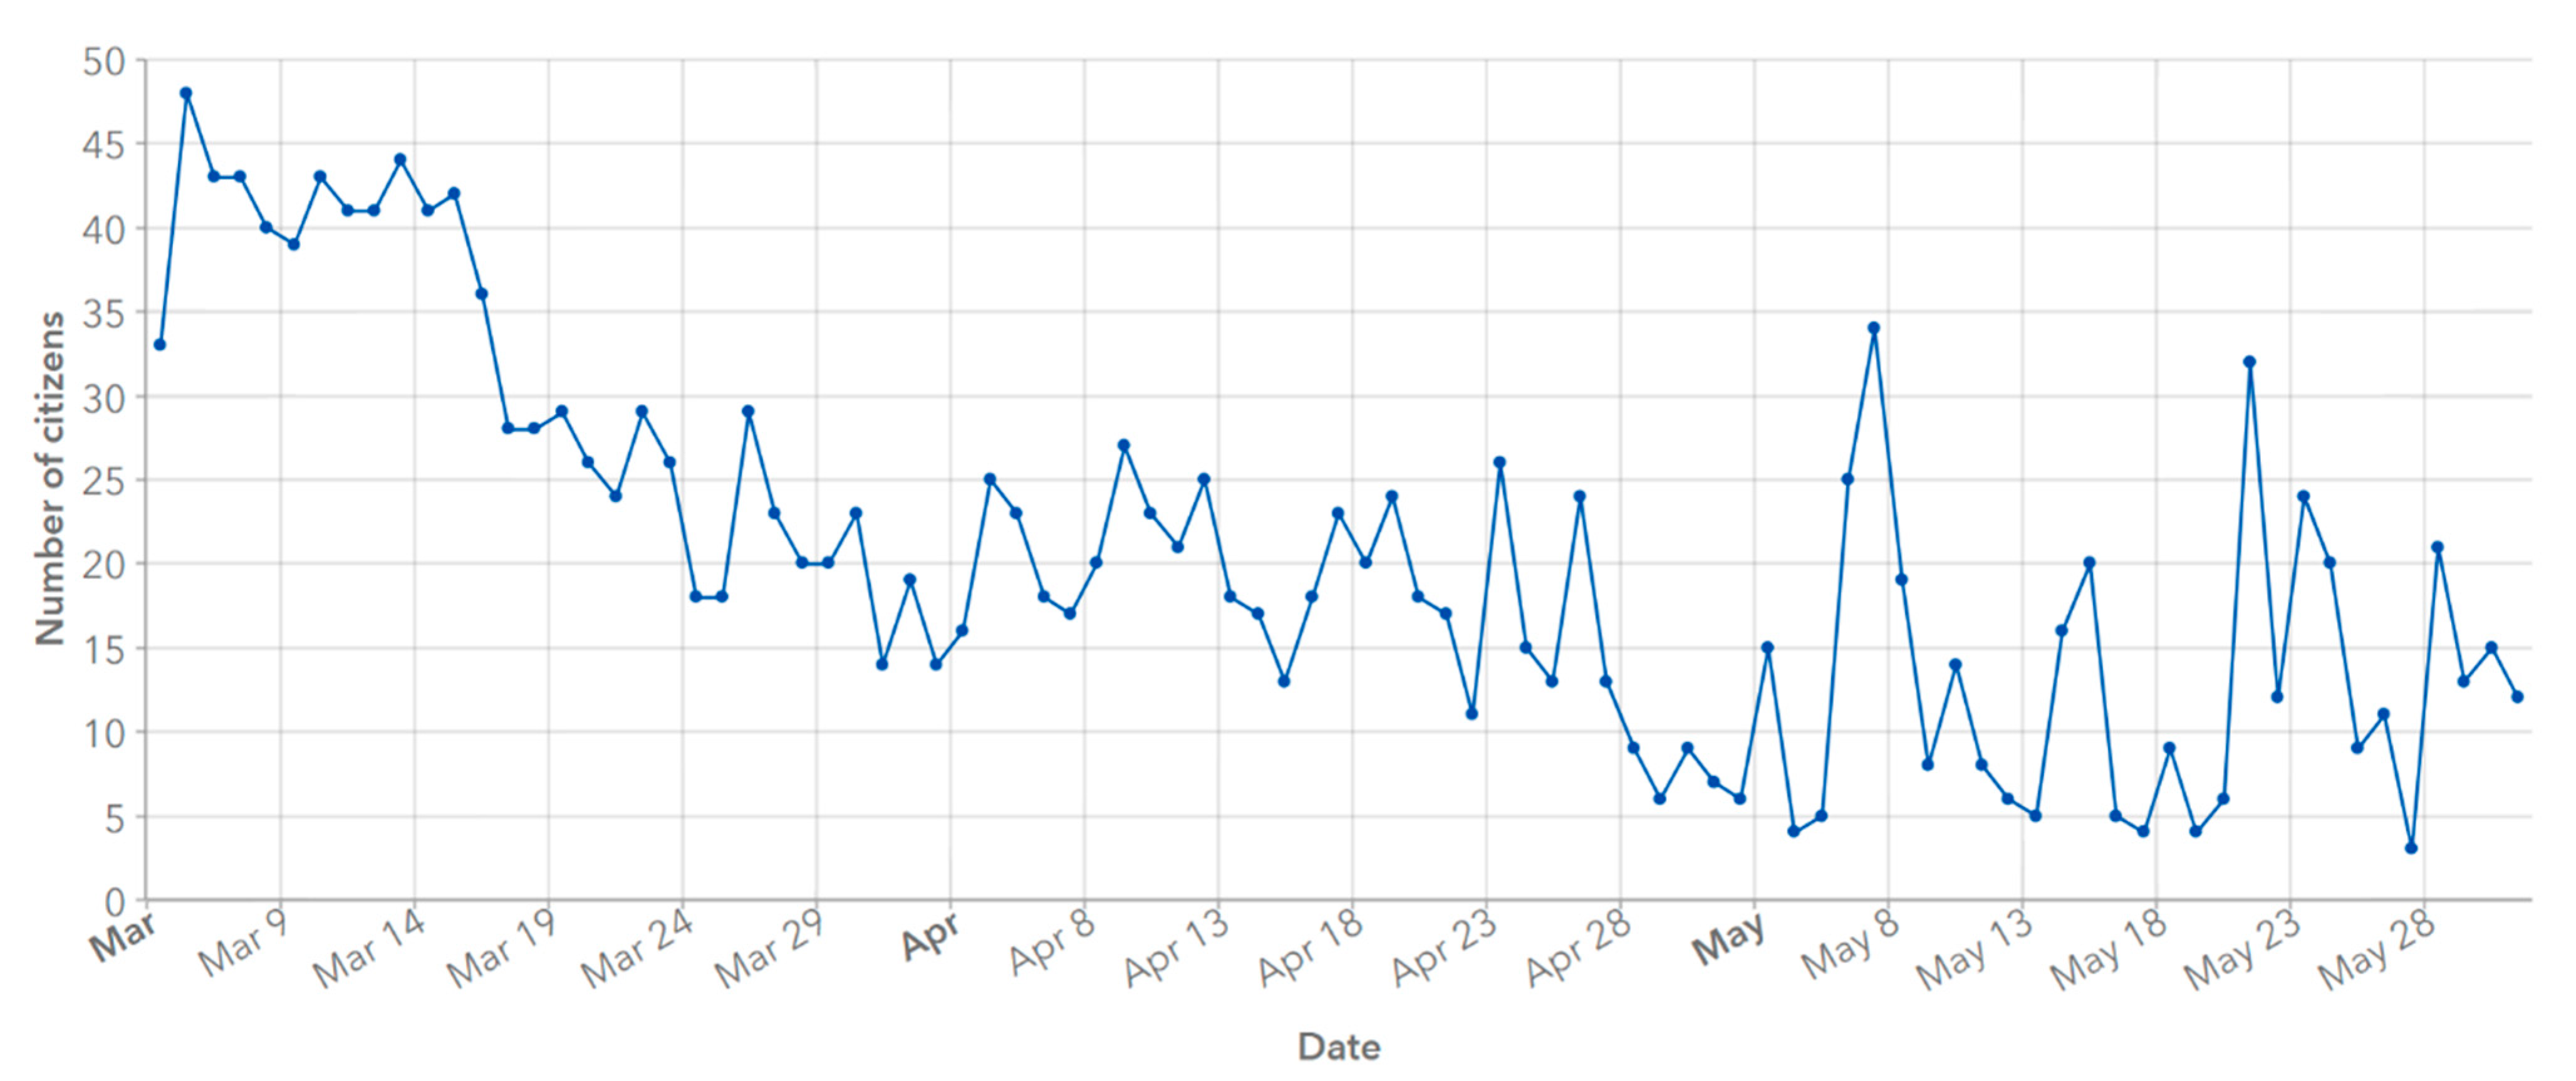
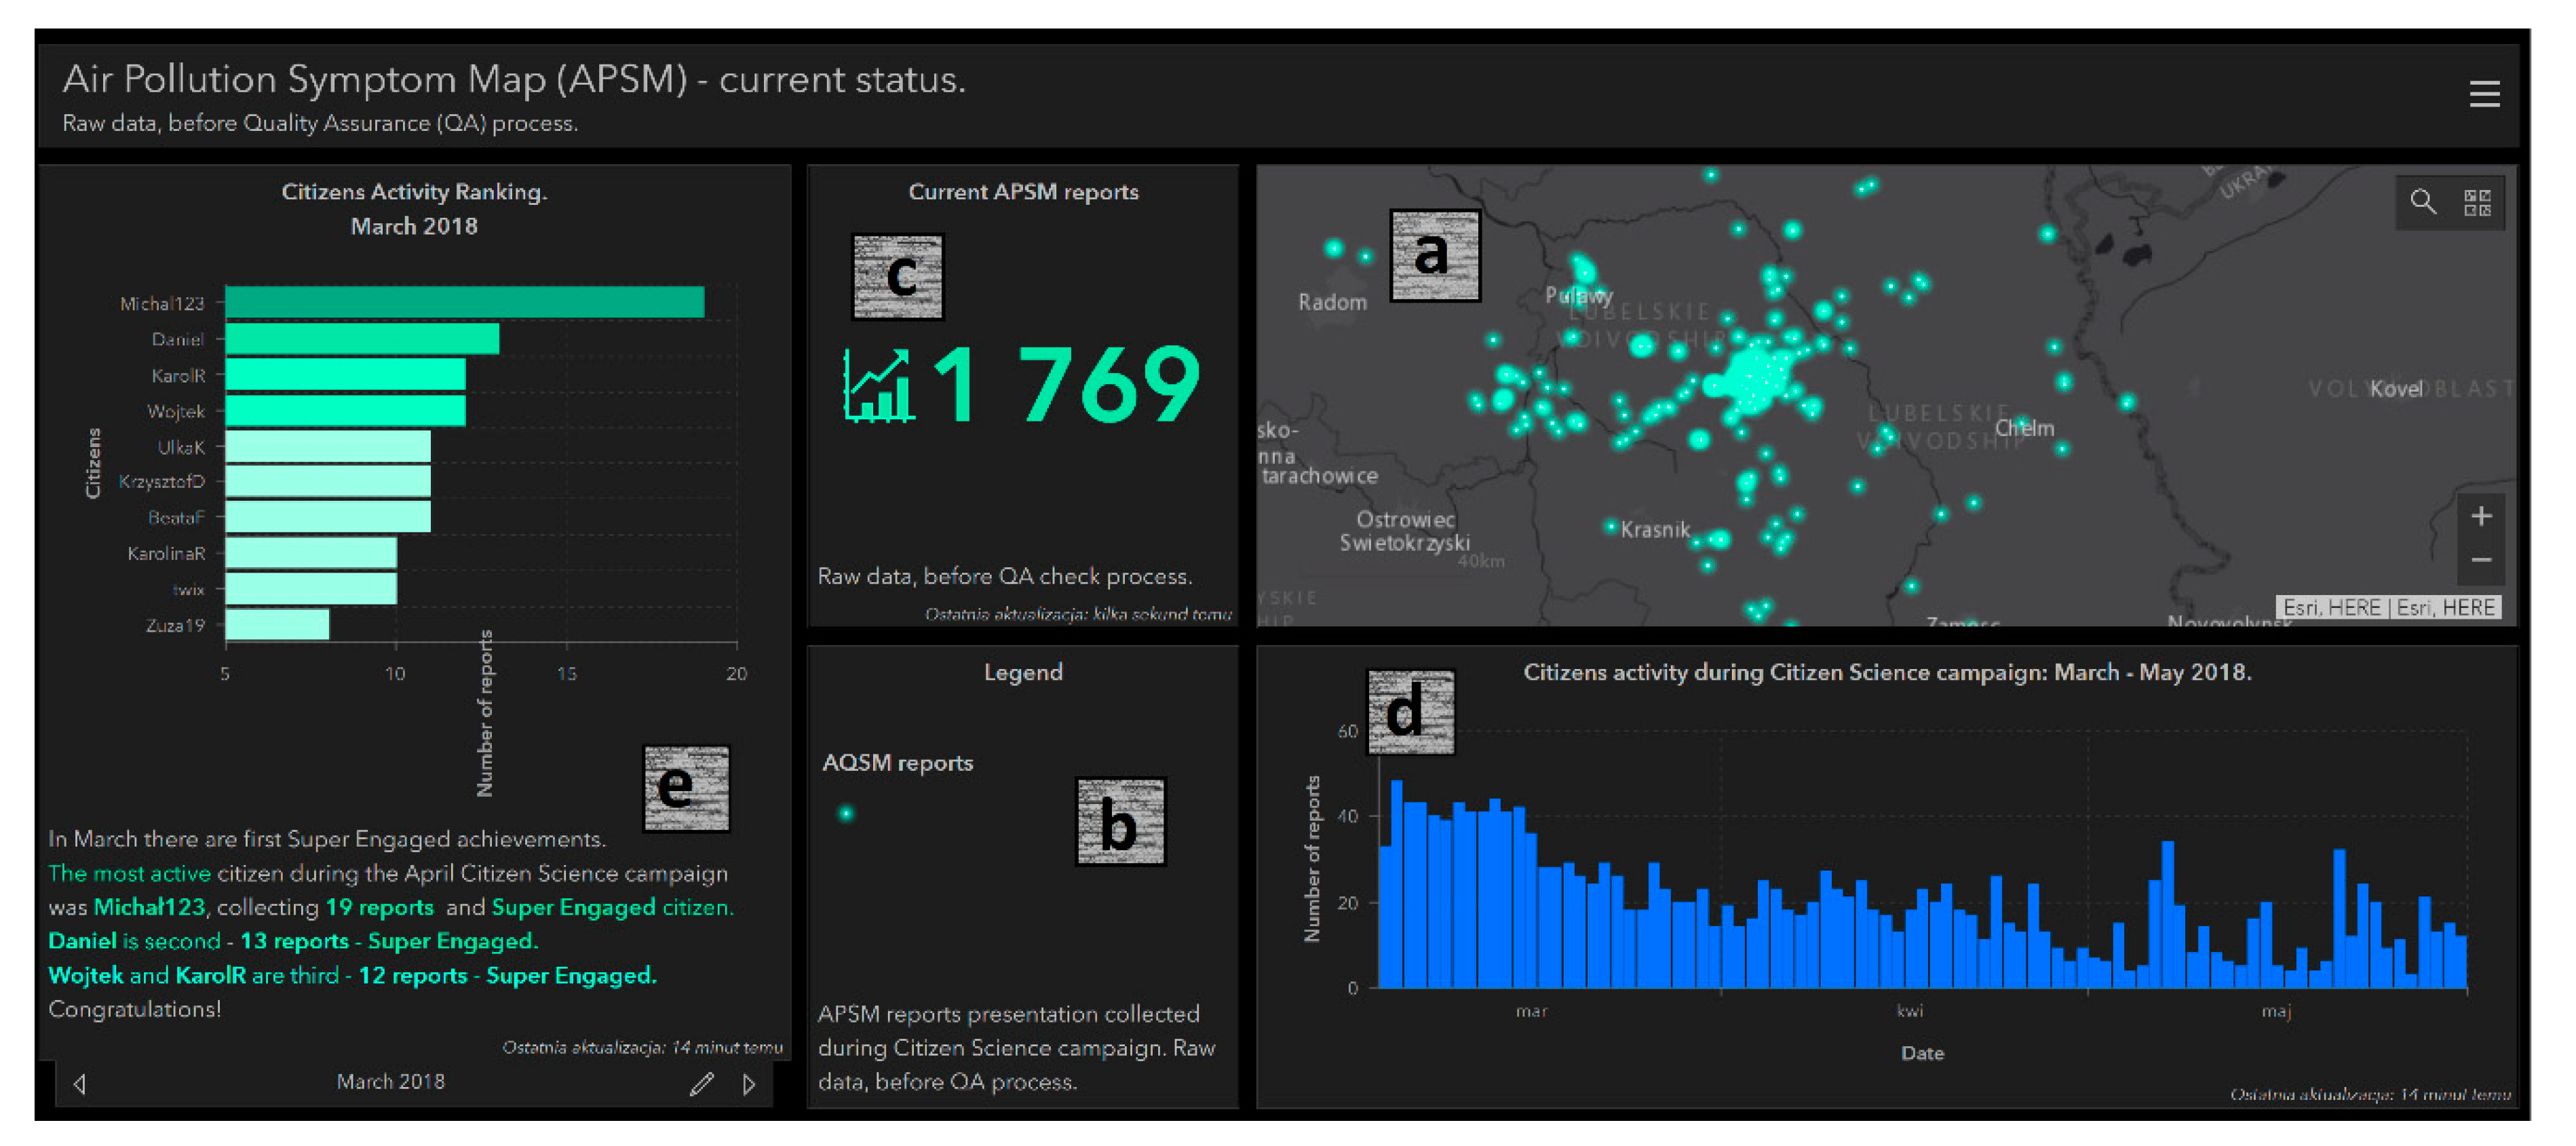
3.1. Data Collection Campaign Outcomes

During the data collection campaign, 1936 APS reports were sent by citizens to the cloud, which were used as the input to the QA-mechanism-developed database. The citizen scientists involved in the APSM project became members of the Citizen Science Community of University of Warsaw (CS-Community-UW; Warsaw, Poland) (https://arcg.is/WeqfK), which was set up to share all project data, materials, and apps in GeoWeb, available at https://arcg.is/1iDD18, in order to provide continuous access to the results. When citizens collected data, their activity was controlled and updated every month in a user activity module implemented in the dashboard app (Section 3.3). Analysis of the activity curve indicated that citizen activity peaked for 11 days at the beginning of the campaign (39–48 reports per day) and then decreased. After this, activity stabilized at between 4 and 29 reports per day, with two peaks of 32 and 34 reports per day (Figure 4). The students were more active than non-academic citizens. The most active student collected 25 reports in April, whereas the most active non-academic citizen collected 7 reports in March.

3.2. Robustness of QA Mechanisms

During the initial stage of data set filtering, 19 outliers with no geolocation were eliminated. Another 68 APS records were excluded as they were duplicate reports at the same geolocation within a short (5 min) interval. The horizontal positioning accuracy varied from 0 to 100 m, where 93% of reports had a horizontal accuracy between 0 and 30 m. We filtered 26 outliers that had a horizontal accuracy error exceeding 100 m, which were rejected. As a result, 1823 reports of the 1936 remained and were used as the object of our logic-based QA implementation study. After the implementation of the QA mechanisms in the database, their robustness was analyzed.
According to Table 4, the three most robust QA mechanisms for our specific case study were: repeating in two variants (more robust, repeating2 (Rp2); less robust, repeating1 (Rp1)) and start-check in the more robust variant (SC2). The repeating2 mechanism excluded 23.1% of reports, repeating1 eliminated 10.6% of reports, and start-check2 eliminated 6.9% of reports. Thus, most data bias resulting from inconsistencies between the first and the repeated question was identified by the repeating mechanism.
Three QA mechanisms—start-check, cross-validation, and repeating—which were implemented in two variants (i.e., less robust and more robust) were analyzed in terms of the report reduction in each variant. For the start-check mechanism, the two variants reduced 71 of the same reports, while start-check2 eliminated 54 more reports than start-check1. Cross-validation1 and cross-validation2 reduced the same 54 reports, while cross-validation2 additionally eliminated 54 observations. For the repeating mechanism, repeating1 and repeating2 were compatible for 194 reports, while repeating2 was 12.5% more robust than repeating1, excluding 228 additional APS reports (Table 5).
The largest data bias was related to the inconsistency between the general SWB question and its repeated query (repeating1: 10.6% and repeating2: 23.1%). This result could have been produced by the inaccuracy of the repeated-question structure or by citizens misunderstanding the question. The start-check2 mechanism rejected 6.9% of reports, which means that the severity symptoms did not align with the general SWB assessment. The sequence mechanism was the least robust (0.9%), indicating that citizens rarely filled in the form automatically, that is, without carefully reading the answers. A high rejection rate was observed using the QA mechanisms start-check2 (6.9%), cross-validation2 (5.9%), and repeating2 (23.1%), which were between 46% and 57% more robust than their alternative variants (start-check1, cross-validation1, and repeating1, respectively). They rejected a higher percentage of reports. Due to its high rejection rate, start-check2 was found to also reject some consistent reports.
Finally, according to the methodology (Section 2), the QA mechanisms were combined into eight QA system variants (QAs1–8; Table 6). Implementing each subsequent QA mechanism changed the database, considering the QA system functions. For this study, the most robust QA systems were QAs8 and QAs7 (28.6%) and QAs2 and QAs5 (27.3%), which best reduced the number of falsely filled in reports in the survey. They increased the quality of the collected data but rejected a percentage of reports that might have contained valid information. As a result, some valuable data would be lost. The least robust were QAs1 (18.3%) and QAs3 (20.0%), which could not identify all the reports with false data, thus decreasing the quality and validity of the research results. As mentioned above, two pairs of QAs variants reduced the same data set and replicated the result database (QAs2 with QAs5; QAs7 with QAs8), thus allowing their interchangeable use. To reduce replication in the results, the studied QA framework was limited to six QAs variants (with QAs5 and QAs7 removed). For another location (i.e., country, continent) and society structure, the robustness ranking of the six QAs variants could be different and the particular QA mechanisms could be more or less effective than in the considered case study in Lublin.

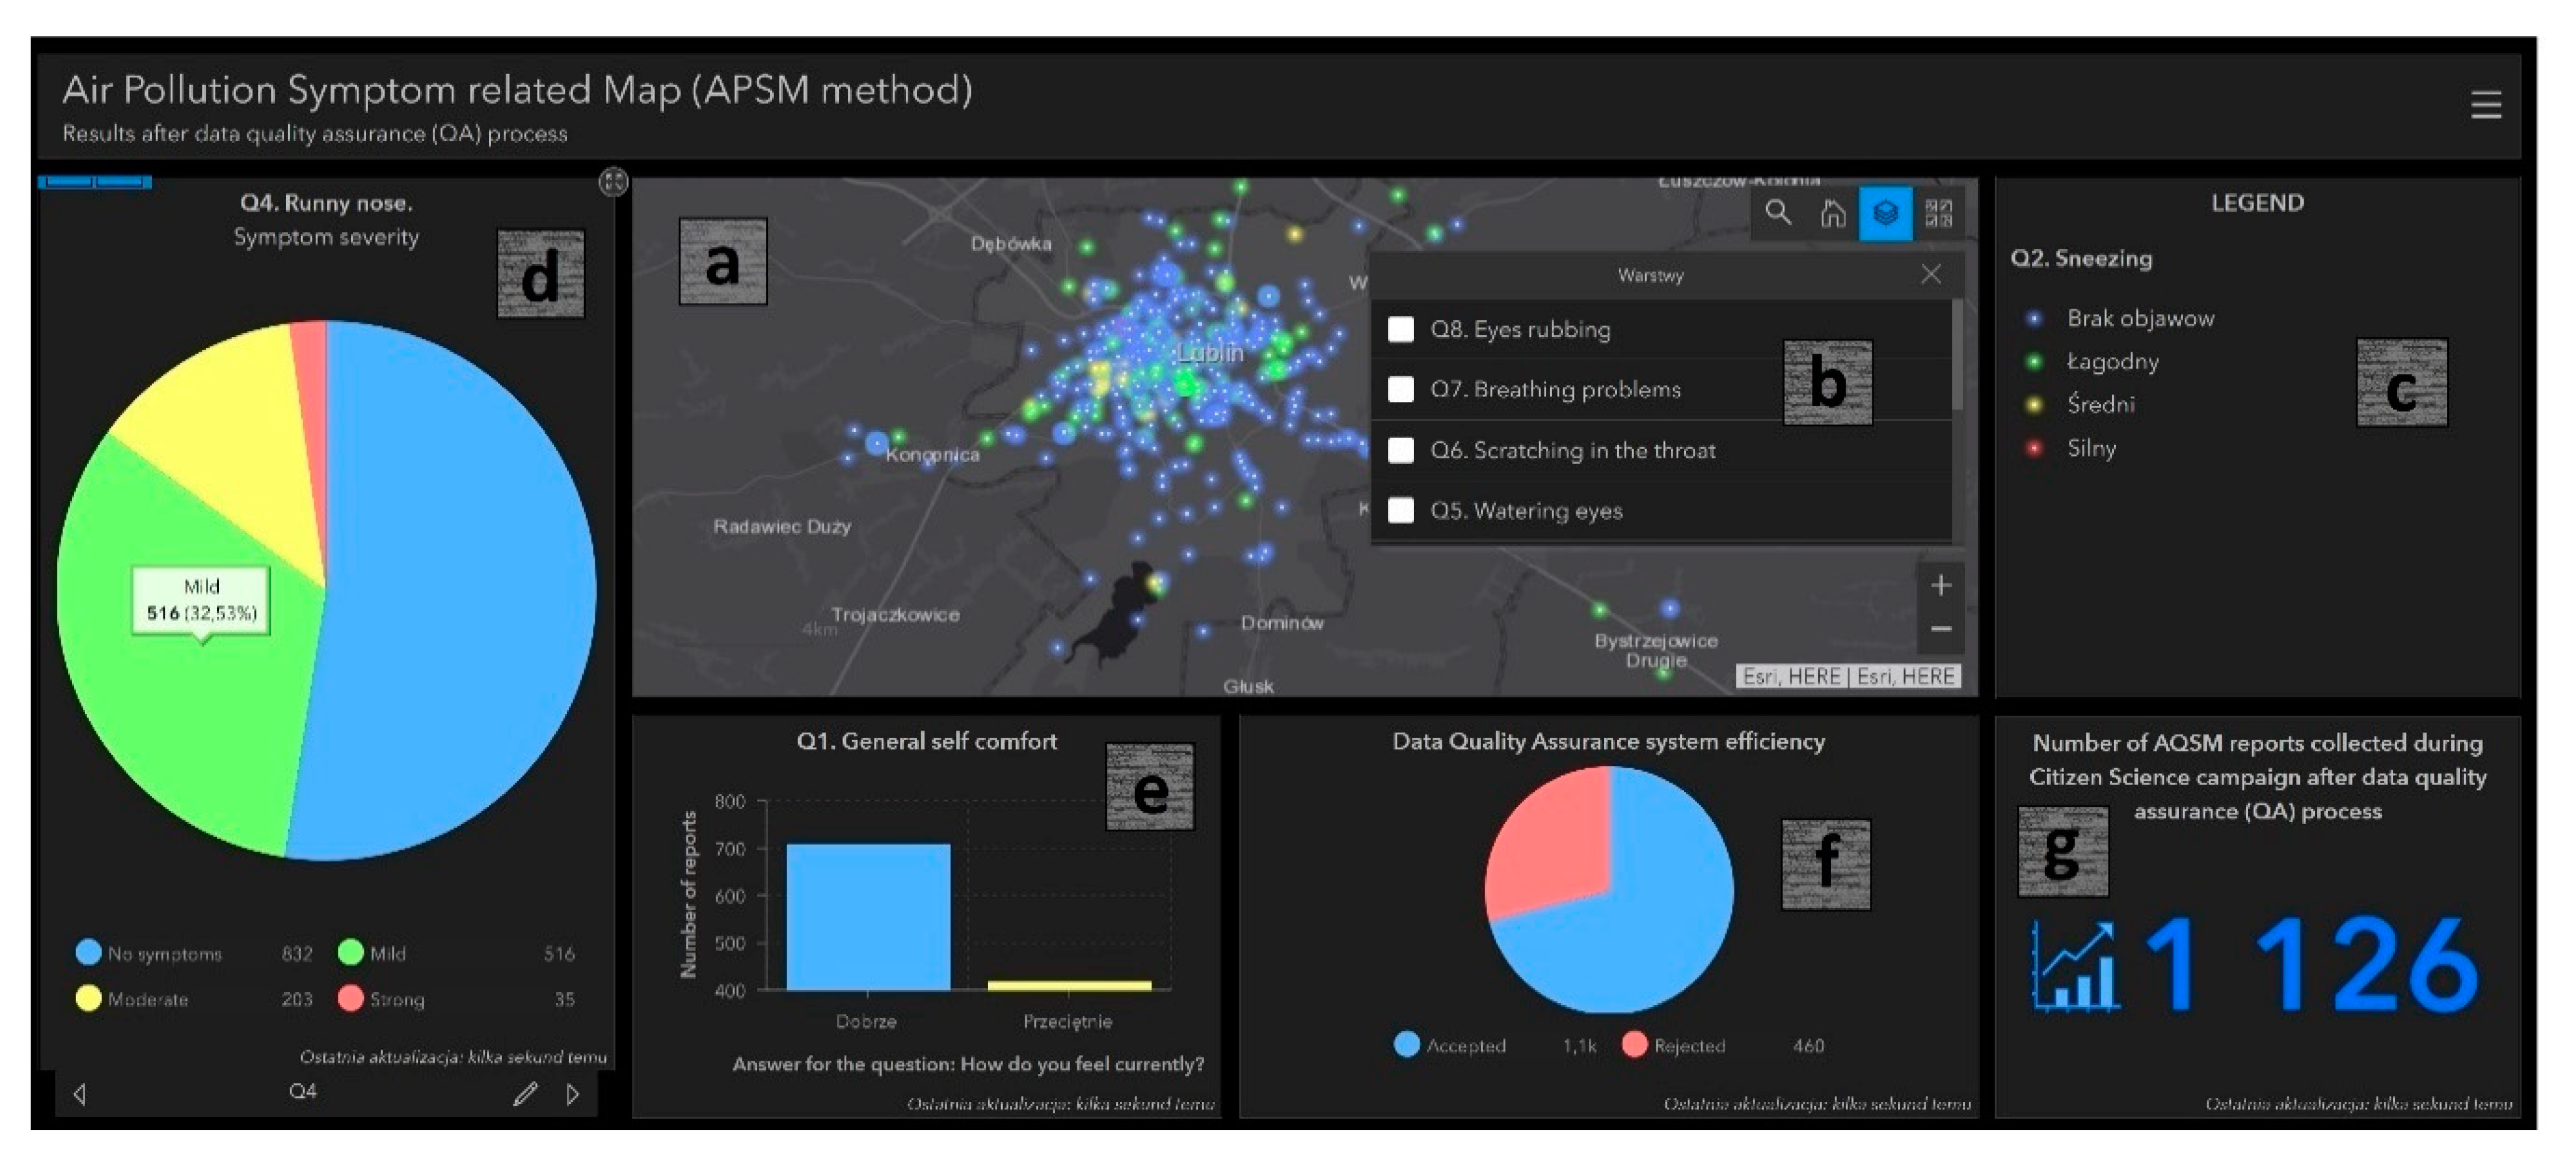
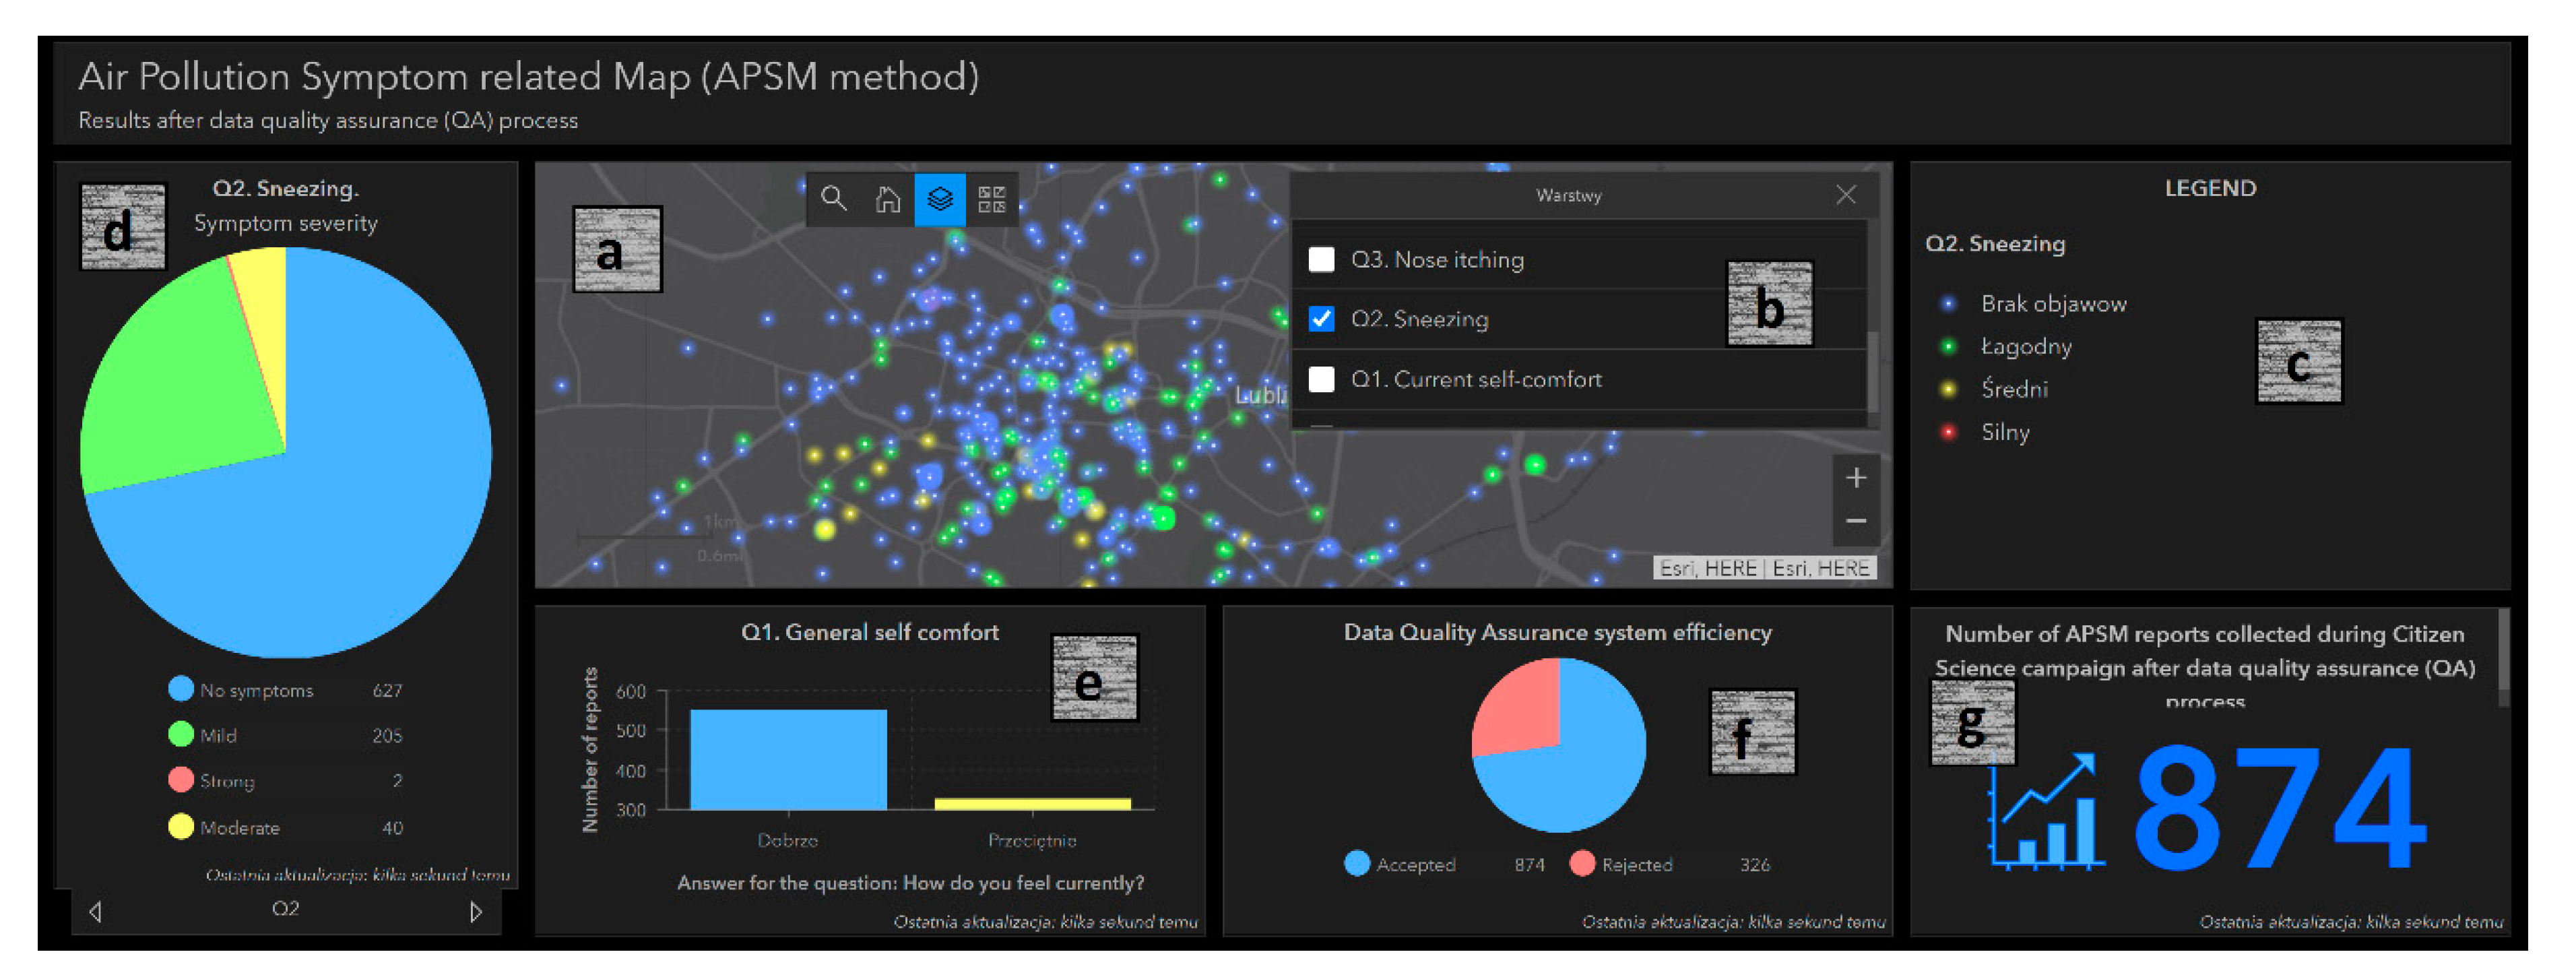
3.3. APSM Results after QA System Implementation

APSM results calculated on the QAs8-checked data set were added to the GeoWeb dashboard app (Figure 5) such that each user could track the APSM data of the whole crowdsourcing campaign, presenting the impact of air pollution on his/her SWB status. From the QAs8-checked database, the most frequently observed health symptom was a runny nose, which was reported in 46.98% surveys during the whole campaign. The least frequently reported symptoms were breathing problems (only 6.92% surveys). The QAs8 had an impact on the percentage of surveys reporting any APS (Table 7). Most surveys reporting breathing problems were rejected, reducing their percentage in the database by 47.34%. The percentage of surveys reporting a runny nose remained almost unchanged, as it increased by 0.86%. The percentage of surveys reporting other symptoms reduced by 14.88% to 35.42%.
The information about the percentage of surveys reporting individual symptom severity values were presented in the dashboard app (Q2–Q8; Figure 5f), which includes additionally the percentage robustness of the QAs8 implemented in the project (Figure 5g).
Moreover, the web application presented the results in terms of the spatial location of eligible symptom-related layers (Q1–Q8; Figure 5a–c), the number of QA-checked reports depending on the spatial extent (Figure 5d), and the general level of citizen comfort (Figure 5e). For more details about the GeoWeb app, see Appendix A.

4. Discussion

In this study, we introduced social innovation into the urban air pollution issue, where citizens act to assess air pollution using their symptoms, thereby extending the paradigm of air pollution. We considered the spatial context; therefore, a map was used to spatially model symptom severity (Figure A5, Appendix A). The web mapping application is public and provides information about air pollution in specific areas of the city such that citizens can learn about which areas could positively or negatively impact their SWB, according to information about the severity of the symptoms observed by the APSM project members within individual months. The air pollution level based on health symptom observations could be compared with other methods, such as satellite observations and in situ measurements. Such in situ ones were described and studied by [81], who compared pollen counts recorded by the European Aeroallergen Network and pollen-induced symptoms reported by pollen allergy sufferers, precisely the Pollen App users’ community. The health symptoms registered by the APSM community can be compared with green pollutants’ concentration levels recorded by the Polish Aerobiological Monitoring Network [102]. In the context of other air pollutants, Sentinel 5p imagery can be taken as a point of comparison, especially because it is served near real time (NRT) [103], although at a more global scale.
Although the potential for using crowdsourced data to monitor urban air pollution was demonstrated here, the minimum report sample can be considered a limitation of the project. Citizen science is an emerging trend in Poland, and so, specific motivation mechanisms need to be elaborated, based on the citizen motivation recommendations developed in other projects [104,105]. As APSM focuses on citizens who are interested in the effect of air pollution on their health and well-being, our study is wider than other projects that are dedicated only to people diagnosed with health problems. This means that the motivation mechanisms involved differ from those that are appropriate for patients (e.g., free medical consultations).
Crowdsourcing projects rely on a suite of methods to boost data quality and account for data bias [20]. To gain better data quality in CS, three-step mechanisms are generally recommended: taking considerations before, during, and after the data collection process [21]. The APSM method, using logic rules to reject inconsistent database entries, was successfully implemented after the data collection process. Depending on the expected data quality level, different mechanisms were tested.
From a practical point of view, the data quality (i.e., completeness, spatial accuracy, thematic resolution, timeliness, and logic consistency) should be suitable for the project purpose. The quality of CS data is expected to be similar to that of the data collected by professionals. According to Wiggins et al. [21], some general solutions for improving crowdsourced data quality include volunteer training (workshops), a large sample size, data filters, data mining algorithms, a qualifying system, voting for the best, reputation scores, online data and metadata sharing, citizen contribution feedback, reuse of data, and replicate studies; however, the purpose of our study was to create a data quality framework.
This confirms that data quality control mechanisms are an indispensable element in any citizen-driven research, hence also being effective in CS activities such as that considered in this paper. The removal of falsely completed surveys increased the collected data’s quality and usefulness. In our research, only 5.8% of data were eliminated due to positioning accuracy, either a lack of geolocation or duplicated reports at the same geolocation. Farman [106] identified 12% of crowdsourced data to have accuracy-related errors. Thus, we conclude that in our sCS, this type of error did not pose a significant problem in terms of data quality; however, subjective data bias definitely does. Still, the problem of human bias in data poses a problem that must always be considered during data analysis. Human bias introduced into data can be mitigated by using clearly stated survey questions, providing additional training, and limiting the scope of the survey. We found that up to 29% of all collected surveys regarding air pollution objectively contained useless or false information. Kosmala et al. [20] reported subjective data bias at levels between 5% and 35%, depending on the simplicity of the tasks assigned to citizens, Hube et al. [107] presented data bias at 15–17% in a crowdsourced data set, and Eickhoff [108] pointed out an accuracy rate reduction of 20% due to cognitive data bias. We recognize that our percentage share of data bias was high, highlighting the absolute necessity of a QA mechanism framework for sCS health-related projects. As QA mechanisms are created through the use of logic rules, they are easy to understand and can be crafted to match particular (expected or observed) error types in collected survey data. We found that QA mechanisms can be used to remove surveys that contain clearly defined errors. Moreover, by choosing a single QA system (Table 3) and combining rejected reports with the username, each user’s quality rank can be calculated. A user who passes the QA system could then be rewarded with trust and reputation statuses. Such citizen trust models have been proposed by Alabri and Hunter [109], who developed a social trust metrics framework, and Langley et al. [110], who applied a reputation model and used a reputation score system to determine the threshold for accepting volunteered data. This should be based, for each citizen, on the ratio of reports accepted by the QA system to the total number of their surveys: the higher the ratio of accepted reports, the higher the level of citizen trust.
The APSM data quality mechanisms implemented after the data collection stage—but referenced to a particular user’s reports—could be used to develop a user motivation system (which, in the current study, was limited only to user activity). Furthermore, the technological implementation of QA systems as cloud services may enable the ranking of user trust and reputation during the data collection process. Then, not only the quantity but also the quality of user reports can be analyzed and their level of reputation could be assessed and presented during the campaign. In large-scale CS projects such as iNaturalist (iNaturalist.org), the trust and reputation of citizens are based on their activity: “The users’ community ensures that data is reliable, but it also gives the opportunity for fellow users to gain knowledge” [111].
In future research, during the data collection process, some new solutions can be implemented, such as GNSS trajectories. Currently, Q10 (Figure 1) requires users to estimate how long they have stayed in a location. Using GNSS or Global System for Mobile Communications (GSM) data to characterize user mobility patterns and analyze user spatial trajectories could increase data quality and make the application smarter. Changes in user trajectories could also result in an individual push notification to maintain or cancel the APS, depending on the change of location. Finally, to gain better data quality, improvements before the data collection stage may also be proposed. APSM was carried out as a Polish case study. As CS has been recognized as an emerging trend in Poland, we found it necessary to promote the sCS concept through the European CS platform (https://eu-citizen.science) and engage citizens in air pollution monitoring by organizing training sessions. What differentiates CS from other VGI activities is the fact that CS can be taken up by any volunteers who have undertaken standardized training. Learning how to observe one’s own symptoms in reaction to air pollution, relating them with air quality information and green pollutant concentration levels, and regular symptom recording were considered prerequisite parameters for ensuring the quality of APSM. The D-NOSES project [7] proved that the sense of smell of individuals can be calibrated through training on odor pollution and workshops exploring odor perception in the D-NOSE method.
In the study, we applied a user activity rank model, which showed that citizen activity decreased over time, which is typical for a CS project [112]. The level of citizen engagement and motivation was the highest at the beginning of the crowdsourcing campaign (100 reports per day), dropping after 14 days. The two peaks in the last month of the field data collection campaign could have resulted from the motivational workshops with an educator where citizens rankings were discussed, thus increasing competition between the citizens (35 and 40 reports per day, May 2018). In summary, for a case study of Lublin or any city of similar size and structure, a citizen group larger than 74 people is needed and regular workshops, as well social media campaigns engaging people to participate directly in the CS group forum, are necessary to maintain their activity.
Due to the intuitive access and operation of the presented tools, such methods and tools are suitable for scientists, educators, and evaluators alike. The ability to reduce data bias in real time is not possible without a programmed web-based mechanism functionality. AGOL-configurable capabilities allow for data filtering, but the filters are too basic for the conditional statement combinations that form the QA mechanisms.
Conveniently, our database was set up on REST services, such that the QA mechanisms and their combinations could be implemented and analyzed using desktop software, in direct connection with AGOL apps, which ensured the stability of the REST service-based data source.

5. Conclusions

In summary, the APSM project was the first research in Europe that focused on assessing air pollution based on the health symptoms of citizens and their subjective well-being. This source of air pollution monitoring could be complementary to other methods. The highly subjective form of the data source could be burdened with data bias and specific errors. Therefore, it requires a QA framework for APSM projects, which was proposed and implemented in this study.
Of the five QA mechanisms employed, the most robust were those aimed at removing inconsistent user answers, which were intentionally repeated in the survey (i.e., the repeating QA mechanism). These results suggest that some of the methods employed might lead to a decrease in user engagement, as some users were not consistent with their own answers in the same survey. This finding may be due to a natural phenomenon associated with the human condition or to a survey questionnaire that lacks user engagement. Future surveys employing sCS as a data source might expect many haphazardly completed user surveys. Analyzing the QAm effectiveness results, we assume that some of the QA mechanisms’ effectiveness can be increased, and we recommend some modifications to the examined QA framework. The sequence mechanism should be additionally enhanced by a functionality measuring how much time it took to fill out the form. This will help capture the user automatism in filling out the survey. Furthermore, the results provided evidence that APS assessment is much easier for citizens than identification of their SWB. This conclusion is confirmed with the level of the repeating mechanism’s robustness, which eliminated the most reports, and was based on the repeated SWB questions. Therefore, we recommend that researchers rather focus on the health symptom questions and not repeat SWB questions in the survey, as it could be too difficult for the citizens to verify. The screening question could be developed in future research as well. Moreover, the QA method for APSM can be extended by the abundance and frequency of the surveys in a close or the same geolocation in the near time. This will be a mechanism that potentially improves the reliability of collected data. If some citizens give very close responses in the same or a close time and location, then the quality of data should have a potentially higher level of trust than those that are not confirmed by any surveys of other citizens.
The focus of our research was not on validation with digital sensors but on elimination of logically inconsistent answers and technologically incorrect objects. However, the APSM method can capture the moment when air pollution changes. The observed health symptom severity can be validated with air pollution concentrations measured by air-quality-monitoring stations. Having information about whether citizens are diagnosed as pollen allergy sufferers, and by collating this information with the current concentration of pollen species, the chance for confirmation of the impact of air pollution on citizen SWB is higher. The completed database has potential for further research to test the thesis, if citizens more sensitive to air pollution provide data of better quality than those who do not report any pollen allergy or other relevant preexisting conditions. Thus, people who are more sensitive to air pollution can be potentially more interested in providing high-quality data than those who have no air-pollution-related health problems. However, understanding the mechanisms underlying citizen scientists’ motivations requires further research.
Citizens, together with scientists, built a reliable model of the impact of air pollution on the well-being of citizens in their city. As a result of our research, we can confirm that not only QA mechanisms but also citizen activity are necessary for CS contribution to geospatial data quality improvement.
Due to the proposed QA framework, the data obtained with regard to the measured air pollution could be output as a spatial model of city well-being.

Author Contributions

Marta Samulowska: project idea, QA method elaboration and development, GeoWeb development; Szymon Chmielewski: project idea, smart cities, crowdsourcing campaign running and evaluation; Edwin Raczko: QA method development, R statistics software implementation; Michał Lupa: allergy symptom mapping idea, QA method verification; Dorota Myszkowska: air quality health symptoms, aerobiology and allergology issues; Bogdan Zagajewski: project idea evaluation, QA method verification. All authors prepared the manuscript. All authors have read and agreed to the published version of the manuscript.

Funding

The publishing costs were covered by the sources of the Polish Ministry of Science and Higher Education (project no. 500-D119-12-1190000).

Institutional Review Board Statement

Not applicable.

Informed Consent Statement

Not applicable.

Data Availability Statement

Not applicable.

Acknowledgments

The authors would like to thank the Esri Poland team. We are also grateful to the editors and anonymous reviewers for their constructive comments and suggestions that helped to improve this manuscript.

Conflicts of Interest

The authors declare no conflict of interest.

Abbreviations

AcronymDefined in SectionMeaning (Section)
CScitizen scienceCitizen-driven research that citizens (non-experts) participate in by cooperating with researchers (Introduction, Section 1.2).
QAmquality assurance mechanismConditional-statement-based mechanism for data bias controlling. Five data quality assurance mechanisms are proposed in this study (Introduction, Section 1.3; Section Materials and Methods, Section 2.2).
QAsquality assurance systemCombinations of data quality assurance mechanisms. In the study, we studied and analyzed eight QAs variants, depending on their robustness levels, QAs1–QAs8 (Materials and Methods, Section 2.2).
GeoWebgeospatial webGeographically related tools and web services for individuals and groups (Abstract, Introduction, Materials and Methods Section 2.3).
SC (SC1, SC2)start-check mechanism in variant 1 and variant 2The start-check mechanism is used to verify the report quality at the beginning of the survey and controls the report quality during the analysis of each symptom severity answer.The mechanism studied and proposed in two variants of robustness (variant 1: less robust; variant 2: more robust) (Materials and Methods, Section 2.2).
Rp (Rp1, Rp2)repeating mechanism in variant 1 and variant 2The repeating mechanism determines the quality of the report, according to other previously asked questions, by asking the same question but in a different way.The mechanism studied and proposed in two variants of robustness (variant 1: less robust; variant 2: more robust) (Materials and Methods, Section 2.2).
Sqsequence mechanismThe sequence mechanism was applied to exclude user automatism in providing answers (Materials and Methods, Section 2.2).
CV (CV1, CV2)cross-validation mechanism in variant 1 and variant 2The cross-validation mechanism was used to reject responses using three essentially related questions.The mechanism studied and proposed in two variants of robustness (variant 1: less robust; variant 2: more robust) (Materials and Methods, Section 2.2).
TCtime-loop check mechanismThe time-loop check mechanism was used to eliminate reports that did not align with the geolocation of the citizens, according to the length of their stay in the place, in comparison to the duration of their symptoms (Materials and Methods, Section 2.2).
SWBsubjective well-beingReflects the philosophical notion of people’s good life, a proxy of their life satisfaction, momentary experiences, and stress (Introduction).
sCShuman-sensed CSCitizen science measurement relying on one of the human senses (Introduction).
APSMair pollution symptom mappingAir pollution monitoring, expressed on the map as the severity of human health symptoms caused by combined factors of anthropogenic and biophysical ambient air pollutants (Introduction).
APSair pollution symptomsHuman health symptoms related to air pollution, caused by combined factors of anthropogenic and biophysical ambient air pollutants (Introduction).
APair pollutionAir pollution refers to six major air pollutants: inhalable particulate matter (PM10), fine particulate matter (PM2.5), ozone (O3), sulfur dioxide (SO2), nitrogen dioxide (NO2), and carbon monoxide (CO) (Introduction).
AQair qualityAir quality refers to the AQI as well as to classifications, opinions, and feelings (including citizens’ experiences) of air- and air-quality-related SWB. However, a consensus about urban air quality terminology has not been reached, and researchers distinguish air pollution through pollen exposure [49] (Introduction).
AQIair quality indexThe AQI tracks six major air pollutants—inhalable particulate matter (PM10), fine particulate matter (PM2.5), ozone (O3), sulfur dioxide (SO2), nitrogen dioxide (NO2), and carbon monoxide (CO)—to describe the air quality with the use of an objective scale (Introduction).
AGOLArcGIS OnlineWebGIS platform by Esri Inc. (Materials and Methods).
Q1–Q12question 1–question 12The 12 questions about air-pollution-related symptoms and factors related to APS, but also additional information about subjective well-being, asked to citizens in the mobile survey (Materials and Methods, Section 2.2).
Con.1–Con.17conditional statement 1–conditional statement 17The 17 conditional statements that, in specific combinations, are the basis of the developed data quality assurance mechanisms (QAm) (Materials and Methods, Section 2.2).
Survey123, cascade, time sliderSurvey123 for ArcGIS mobile app, Esri Story Map Cascade app template, Esri Time Aware app templateConfigurable mobile apps and web app templates based on ArcGIS.
PMparticulate matterA mixture of particle pollution, both solid and liquid droplets found in the ambient air. PM is characterized by particle size and chemical composition. A PM fraction of 2.5 µm or less (PM2.5) is especially important for evaluating health as well as environmental risks (Introduction).

Appendix A. APSM-Dedicated GeoWeb Tools Supporting Quality Assurance

The tools for the APSM project were based on GeoWeb. We used ArcGIS platform components, which were available to the technologist as a puzzle structure, which allowed for direct customization of the applications to implement the APSM assumptions and requirements. For the project, we configured the mobile app and a set of web apps was publicly shared for citizens.

Appendix A.1. Mobile App for Crowdsourcing

The mobile app was based on Survey123 for ArcGIS components and is available at the public link https://arcg.is/0HWXrO. The survey consists of six information pages to facilitate its use and clear navigation (Figure A1a). It is available in two languages, Polish and English (Figure A1b). The app starts with an introduction with a short user guide (Figure A1c) in order to explain the research rules and how to use the survey app (page 1), followed by the user’s basic information (nickname, four-digit code, and student/non-academic status; Figure A1d), helping the users in the citizen group to control the data collection process (page 2). The next pages (3–5) include 12 APSM questions, which are completed with the user’s geolocation and the date of the report (page 6). All obligatory questions are marked with a red star (Figure A1e). The third page focuses only on the general well-being level of the citizens (Figure A1f), which is the basis for the start-check mechanism. Then, the citizens answer questions about their individual symptoms using drop-down lists of answers (Figure A1g). In the summary (page 5), the citizens specify their level of well-being, choosing from a star rating scale, where one star means the lowest and three stars indicate the highest level of well-being (Figure A1h). Then, using the calculator appearance widget, the users report the length they have stayed in their location and the symptoms observed. These values are expressed in minutes, provided for question 11 (Figure A1i). Question 11, regarding the length of the observation of symptoms, is fixed in the app as relevant only when any APS are observed. If Q2–Q7 are answered as “no symptoms,” then Q11 does not appear in the survey. On the last page of the app, a map widget is presented to mark the current location and date (Figure A1j). Here, app users are told that all reports with a horizontal positioning accuracy error greater than 100 m are automatically eliminated, as these values are considered GNSS positioning accuracy outliers. When completing the survey, the user can check the current location status at any time (i.e., latitude, longitude, and horizontal accuracy; Figure A1k). The default date is set to the current date. The geolocation defaults to the current GPS location of the user, as well. When the survey is completed, a bottom-right submit tick is made active, and the report is ready to send to the cloud geodatabase.
Figure A1. Six-page mobile survey app user interface: (a) six-page navigation, (b) button to choose a language, (c) introduction and user guide, (d) user’s basic information, (e) obligatory question mark, (f) general well-being question, (g) health symptom questions, (h) repeated well-being question, (i) length present in the place report, (j) location and date, and (k) current location status.
Ijgi 10 00046 g0a1

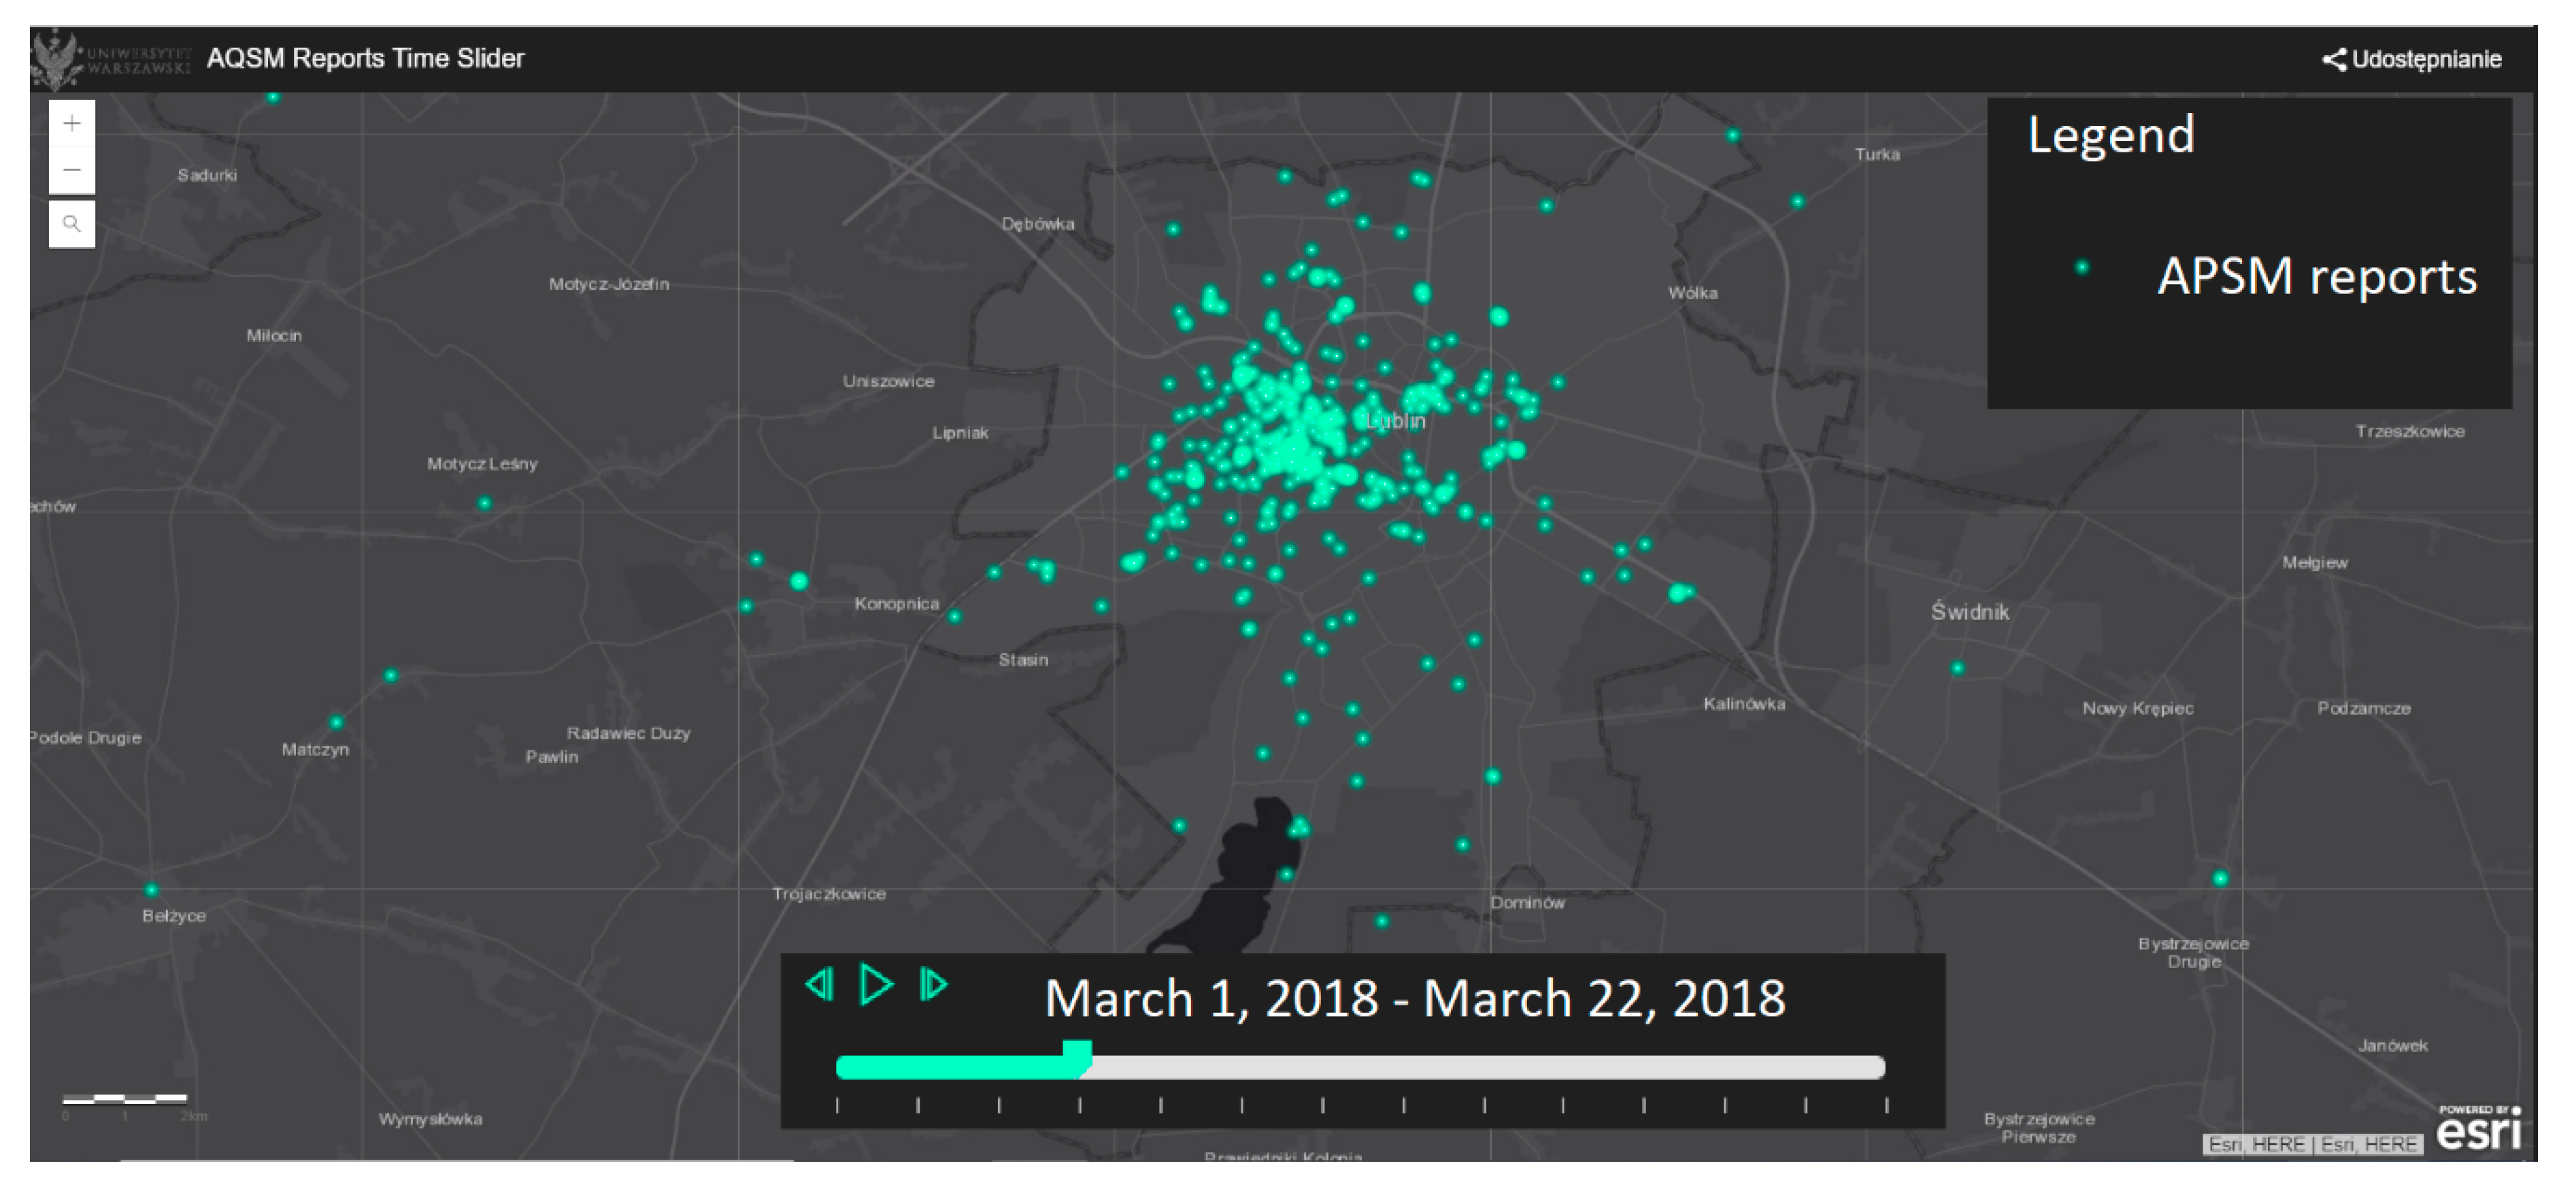
Appendix A.2. APSM: Result Sharing through Web Apps

The resulting web app is available at https://arcg.is/1iDD18 as an open application for each person interested in the project results. The site is primarily used to provide result feedback for the citizens engaged in the study. The app was configured based on the Map Series template and consists of five applications, which can be opened by selecting five buttons: 1, Introduction to the project; 2, Field data collecting app; 3, Real-time data (before logic-based QA check); 4, APSM results (after logic-based QA check); and 5, APSM time slider (Figure A2).
Figure A2. Web application for the APSM project: collection of five applications.
Ijgi 10 00046 g0a2
The first app—Introduction to the project (Figure A3)—is based on the Esri Story Map Cascade template, which is used for building narrative web mapping apps by combining images, maps, and multimedia context with narrative text (https://storymaps-classic.arcgis.com/en/app-list/cascade/). The application has an educational function for the citizens involved. It provides educational materials about air pollution and the APSM project idea, as well as extended mobile and web app tutorials and technical knowledge.
Figure A3. Educational part of the application: cascade story map.
Ijgi 10 00046 g0a3aIjgi 10 00046 g0a3b
Button number 2 links to a web version of the Survey123-based application for data collection.
Application 3 presents the raw data collected before the QA process and contains the operations-dashboard-based interface, which consists of five modules: a map with the raw-data APSM reports collected during the crowdsourcing campaign (Figure A4a); a legend (Figure A4b); an indicator counting the total number of reports (Figure A4c); a histogram of the citizen activity from the beginning of the crowdsourcing campaign to the current moment (Figure A4d), which changes dynamically, according to the map; and a citizen activity ranking, divided for each month and cumulatively (Figure A4e), as described in Section 2.1.
Figure A4. Web mapping application operations dashboard, presenting collected data (before QA check) in real time: (a) map, (b) legend, (c) indicator of current number of the reports, (d) citizen activity histogram, and (e) citizen activity ranking.
Ijgi 10 00046 g0a4
The APSM result application (number 4) is a six-module app that presents the results of the APSM data checked with QAs8, the most robust variant of the QA system. The application includes a map (Figure A5a) with eligible symptom-related layers (Q1–Q8; Figure A5b), a legend for the map (Figure A5c), a pie chart for the severity of each symptom (Q2–Q8) indicated with question-related bookmarks (Figure A5d), a bar chart presenting the level of general citizen comfort (Figure A5e), a pie chart presenting the percentage robustness of the QA system (Figure A5f), and an indicator counting all the QA-checked reports (Figure A5g).
Figure A5. Web mapping application operations dashboard, presenting results of QAs8-checked data: (a) map, (b) selectable layer list, (c) legend, (d) pie chart presenting severity of each air pollution related symptom, (e) bar chart of citizen general comfort, (f) pie chart of QA system robustness, and (g) indicator of QA-checked reports changing according to the map extent.
Ijgi 10 00046 g0a5
The time slider app (number 5) is based on the Esri Time Aware configurable template. It includes a map of point-symbolized QA-checked reports accompanied by a time slider tool, which displays the increase in collected data over the entire duration of the crowdsourcing campaign. The time slider can move automatically (with a play button) or can be moved manually to the required date (Figure A6).
Figure A6. Time slider app following the data collection process over time.
Ijgi 10 00046 g0a6

References

  1. Laffan, K. Every breath you take, every move you make: Visits to the outdoors and physical activity help to explain the relationship between air pollution and subjective wellbeing. Ecol. Econ. 2018, 147, 96–113. [Google Scholar] [CrossRef]
  2. Kim-Prieto, C.; Diener, E.; Tamir, M.; Scollon, C.; Diener, M. Integrating the Diverse Definitions of Happiness: A Time-Sequential Framework of Subjective Well-Being. J. Happiness Stud. 2005, 6, 261–300. [Google Scholar] [CrossRef]
  3. Ferreira, S.; Akay, A.; Brereton, F.; Cuñado, J.; Martinsson, P.; Moro, M.; Ningal, T.F. Life satisfaction and air quality in Europe. Ecol. Econ. 2013, 88, 1–10. [Google Scholar] [CrossRef]
  4. Signoretta, P.E.; Buffel, V.; Bracke, P. Mental wellbeing, air pollution and the ecological state. Health Place 2019, 57, 82–91. [Google Scholar] [CrossRef]
  5. Yigitcanlar, T.; Kamruzzaman, M.; Foth, M.; Sabatini-Marques, J.; da Costa, E.; Ioppolo, G. Can cities become smart without being sustainable? A systematic review of the literature. Sustain. Cities Soc. 2019, 45, 348–365. [Google Scholar] [CrossRef]
  6. Giffinger, R.; Fertner, C.; Kramar, H.; Meijers, E. City-Ranking of European Medium-Sized Cities; Centre of Regional Science: Vienna, Austria, 2007; p. 28. [Google Scholar]
  7. Arias, R.; Capelli, L.; Díaz, C. A new methodology based on citizen science to improve environmental odour management. Chem. Eng. Trans. 2018, 68, 7–12. [Google Scholar] [CrossRef]
  8. Bastl, K.; Kmenta, M.; Geller-Bernstein, C.; Berger, U.; Jäger, S. Can we improve pollen season definitions by using the symptom load index in addition to pollen counts? Environ. Pollut. 2015, 204, 109–116. [Google Scholar] [CrossRef]
  9. Dutta, J.; Chowdhury, C.; Roy, S.; Middya, A.I.; Gazi, F. Towards Smart City. In Proceedings of the 18th International Conference on Distributed Computing and Networking—ICDCN’17, Hyderabad, India, 4–7 January 2017; ACM Press: New York, NY, USA, 2017; pp. 1–6. [Google Scholar] [CrossRef]
  10. Feng, C.; Tian, Y.; Gong, X.; Que, X.; Wang, W. MCS-RF: Mobile crowdsensing–based air quality estimation with random forest. Int. J. Distrib. Sens. Netw. 2018, 14. [Google Scholar] [CrossRef] [Green Version]
  11. Zupančič, E.; Žalik, B. Data Trustworthiness Evaluation in Mobile Crowdsensing Systems with Users’ Trust Dispositions’ Consideration. Sensors 2019, 19, 1326. [Google Scholar] [CrossRef] [PubMed] [Green Version]
  12. Castell, N.; Kobernus, M.; Liu, H.-Y.; Schneider, P.; Lahoz, W.; Berre, A.J.; Noll, J. Mobile technologies and services for environmental monitoring: The Citi-Sense-MOB approach. Urban Clim. 2015, 14, 370–382. [Google Scholar] [CrossRef]
  13. Komarkova, J.; Novak, M.; Bilkova, R.; Visek, O.; Valenta, Z. Usability of GeoWeb Sites: Case Study of Czech Regional Authorities Web Sites. In Business Information Systems; Springer: Berlin/Heidelberg, Germany, 2007; pp. 411–423. ISBN 9783540720348. [Google Scholar] [CrossRef]
  14. Haklay, M. Citizen Science and Volunteered Geographic Information: Overview and Typology of Participation. In Crowdsourcing Geographic Knowledge; Sui, D., Elwood, S., Goodchild, M., Eds.; Springer: Dordrecht, The Netherlands, 2013; pp. 105–122. ISBN 9789400745872. [Google Scholar] [CrossRef]
  15. Jankowski, P.; Czepkiewicz, M.; Zwoliński, Z.; Kaczmarek, T.; Młodkowski, M.; Bąkowska-Waldmann, E.; Mikuła, Ł.; Brudka, C.; Walczak, D. Geoweb Methods for Public Participation in Urban Planning: Selected Cases from Poland. In Geospatial Challenges in the 21st Century; Koutsopoulos, K., de Miguel González, R., Donert, K., Eds.; Springer Nature: Cham, Switzerland, 2019; pp. 249–269. [Google Scholar] [CrossRef]
  16. Goodchild, M.F. Citizens as Voluntary Sensors: Spatial Data Infrastructure in the World of Web 2.0. Int. J. Spatial Data Infrastruct. Res. 2007, 2, 24–32. [Google Scholar]
  17. Moreri, K.K.; Fairbairn, D.; James, P. Volunteered geographic information quality assessment using trust and reputation modelling in land administration systems in developing countries. Int. J. Geogr. Inf. Sci. 2018, 32, 931–959. [Google Scholar] [CrossRef] [Green Version]
  18. Capineri, C.; Haklay, M.; Huang, H.; Antoniou, V.; Kettunen, J.; Ostermann, F.; Purves, R. (Eds.) European Handbook of Crowdsourced Geographic Information; Ubiquity Press: London, UK, 2016; p. 474. ISBN 9781909188792. [Google Scholar]
  19. Kamp, J.; Oppel, S.; Heldbjerg, H.; Nyegaard, T.; Donald, P.F. Unstructured citizen science data fail to detect long-term population declines of common birds in Denmark. Divers. Distrib. 2016, 22, 1024–1035. [Google Scholar] [CrossRef]
  20. Kosmala, M.; Wiggins, A.; Swanson, A.; Simmons, B. Assessing data quality in citizen science. Front. Ecol. Environ. 2016, 14, 551–560. [Google Scholar] [CrossRef] [Green Version]
  21. Wiggins, A.; Newman, G.; Stevenson, R.D.; Crowston, K. Mechanisms for Data Quality and Validation in Citizen Science. In Proceedings of the 2011 IEEE Seventh International Conference on e-Science Workshops, Stockholm, Sweden, 5–8 December 2011; IEEE: Piscataway, NJ, USA, 2011; pp. 14–19. [Google Scholar] [CrossRef]
  22. Bishr, M.; Mantelas, L. A trust and reputation model for filtering and classifying knowledge about urban growth. GeoJournal 2008, 72, 229–237. [Google Scholar] [CrossRef]
  23. Grewling, Ł.; Frątczak, A.; Kostecki, Ł.; Nowak, M.; Szymańska, A.; Bogawski, P. Biological and Chemical Air Pollutants in an Urban Area of Central Europe: Co-exposure Assessment. Aerosol Air Qual. Res. 2019, 19, 1526–1537. [Google Scholar] [CrossRef] [Green Version]
  24. Sheng, N.; Tang, U.W. The first official city ranking by air quality in China—A review and analysis. Cities 2016, 51, 139–149. [Google Scholar] [CrossRef]
  25. WHO. Air Quality Guidelines—Particulate Matter, Ozone, Nitrogen Dioxide and Sulphur Dioxide; WHO Europe Publication: Geneva, Switzerland, 2005; pp. 67–105. [Google Scholar]
  26. Enemark, S.; Rajabifard, A. Spatially Enabled Society. Geoforum Perspekt. 2011, 10, 1–8. [Google Scholar] [CrossRef]
  27. Ionita, A.; Visan, M.; Niculescu, C.; Popa, A. Smart Collaborative Platform for eLearning with Application in Spatial Enabled Society. Procedia Soc. Behav. Sci. 2015, 191, 2097–2107. [Google Scholar] [CrossRef] [Green Version]
  28. Liu, H.; Li, Q.; Yu, D.; Gu, Y. Air Quality Index and Air Pollutant Concentration Prediction Based on Machine Learning Algorithms. Appl. Sci. 2019, 9, 4069. [Google Scholar] [CrossRef] [Green Version]
  29. Liang, J. Chemical Modeling for Air Resources; Academic Press, Elsevier: Oxford, UK, 2013; p. 298. ISBN 9780124081352. [Google Scholar] [CrossRef]
  30. Kelly, F.J.; Fussell, J.C. Air pollution and public health: Emerging hazards and improved understanding of risk. Environ. Geochem. Health 2015, 37, 631–649. [Google Scholar] [CrossRef] [PubMed] [Green Version]
  31. Zwozdziak, A.; Sówka, I.; Willak-Janc, E.; Zwozdziak, J.; Kwiecińska, K.; Balińska-Miśkiewicz, W. Influence of PM1 and PM2.5 on lung function parameters in healthy schoolchildren—A panel study. Environ. Sci. Pollut. Res. 2016, 23, 23892–23901. [Google Scholar] [CrossRef] [PubMed]
  32. Bastl, K.; Berger, M.; Bergmann, K.-C.; Kmenta, M.; Berger, U. The medical and scientific responsibility of pollen information services. Wien. Klin. Wochenschr. 2017, 129, 70–74. [Google Scholar] [CrossRef] [PubMed]
  33. Joseph, E.P.; Jackson, V.B.; Beckles, D.M.; Cox, L.; Edwards, S. A citizen science approach for monitoring volcanic emissions and promoting volcanic hazard awareness at Sulphur Springs, Saint Lucia in the Lesser Antilles arc. J. Volcanol. Geotherm. Res. 2019, 369, 50–63. [Google Scholar] [CrossRef]
  34. Baldacci, S.; Maio, S.; Cerrai, S.; Sarno, G.; Baïz, N.; Simoni, M.; Annesi-Maesano, I.; Viegi, G. Allergy and asthma: Effects of the exposure to particulate matter and biological allergens. Respir. Med. 2015, 109, 1089–1104. [Google Scholar] [CrossRef] [Green Version]
  35. Di Menno di Bucchianico, A.; Brighetti, M.A.; Cattani, G.; Costa, C.; Cusano, M.; De Gironimo, V.; Froio, F.; Gaddi, R.; Pelosi, S.; Sfika, I.; et al. Combined effects of air pollution and allergens in the city of Rome. Urban For. Urban Green. 2019, 37, 13–23. [Google Scholar] [CrossRef]
  36. McInnes, R.N.; Hemming, D.; Burgess, P.; Lyndsay, D.; Osborne, N.J.; Skjøth, C.A.; Thomas, S.; Vardoulakis, S. Mapping allergenic pollen vegetation in UK to study environmental exposure and human health. Sci. Total Environ. 2017, 599–600, 483–499. [Google Scholar] [CrossRef] [Green Version]
  37. Robichaud, A.; Comtois, P. Environmental factors and asthma hospitalization in Montreal, Canada, during spring 2006–2008: A synergy perspective. Air Qual. Atmos. Health 2019, 12, 1495–1509. [Google Scholar] [CrossRef] [Green Version]
  38. Werchan, B.; Werchan, M.; Mücke, H.-G.; Gauger, U.; Simoleit, A.; Zuberbier, T.; Bergmann, K.-C. Spatial distribution of allergenic pollen through a large metropolitan area. Environ. Monit. Assess. 2017, 189, 169. [Google Scholar] [CrossRef]
  39. Bédard, A.; Sofiev, M.; Arnavielhe, S.; Antó, J.M.; Garcia-Aymerich, J.; Thibaudon, M.; Bergmann, K.C.; Dubakiene, R.; Bedbrook, A.; Onorato, G.; et al. Interactions between air pollution and pollen season for rhinitis using mobile technology: A MASK-POLLAR study. J. Allerg. Clin. Immun. 2020, 8, 1063–1073.e4. [Google Scholar] [CrossRef]
  40. Connors, J.P.; Lei, S.; Kelly, M. Citizen Science in the Age of Neogeography: Utilizing Volunteered Geographic Information for Environmental Monitoring. Ann. Assoc. Am. Geogr. 2012, 102, 1267–1289. [Google Scholar] [CrossRef]
  41. Eitzel, M.V.; Cappadonna, J.L.; Santos-Lang, C.; Duerr, R.E.; Virapongse, A.; West, S.E.; Kyba, C.C.M.; Bowser, A.; Cooper, C.B.; Sforzi, A.; et al. Citizen Science Terminology Matters: Exploring Key Terms. Citiz. Sci. Theory Pract. 2017, 2, 1. [Google Scholar] [CrossRef] [Green Version]
  42. Silvertown, J. A new dawn for citizen science. Trends Ecol. Evol. 2009, 24, 467–471. [Google Scholar] [CrossRef] [PubMed]
  43. Dickinson, J.L.; Zuckerberg, B.; Bonter, D.N. Citizen Science as an Ecological Research Tool: Challenges and Benefits. Annu. Rev. Ecol. Evol. Syst. 2010, 41, 149–172. [Google Scholar] [CrossRef] [Green Version]
  44. Kar, B.; Sieber, R.; Haklay, M.; Ghose, R. Public Participation GIS and Participatory GIS in the Era of GeoWeb. Cartogr. J. 2016, 53, 296–299. [Google Scholar] [CrossRef] [Green Version]
  45. Bonney, R.; Balard, H.; Jordan, R.; McCallie, E.; Phillips, T.; Shirk, J.; Wilderman, C.C. Public Participation in Scientific Research: Defining the Field and Assessing Its Potential for Informal Science Education; A CAISE Inquiry Group Report; Center for Advancement of Informal Science Education (CAISE): Washington, DC, USA, 2009; p. 58. Available online: http://www.birds.cornell.edu/citscitoolkit/publications/CAISE-PPSR-report-2009.pdf (accessed on 14 August 2019).
  46. Loreto, V.; Haklay, M.; Hotho, A.; Servedio, V.D.P.; Stumme, G.; Theunis, J.; Tria, F. Participatory Sensing, Opinions and Collective Awareness; Springer: Cham, Switzerland, 2017; p. 405. [Google Scholar] [CrossRef]
  47. Grey, F. The Age of Citizen Cyberscience; CERN Courier, IOP Publishing: Bristol, UK, 2009; Available online: http://cerncourier.com/cws/article/cern/38718 (accessed on 31 May 2017).
  48. Guo, B.; Wang, Z.; Yu, Z.; Wang, Y.; Yen, N.Y.; Huang, R.; Zhou, X. Mobile Crowd Sensing and Computing. ACM Comput. Surv. 2015, 48, 1–31. [Google Scholar] [CrossRef]
  49. Capponi, A.; Fiandrino, C.; Kantarci, B.; Foschini, L.; Kliazovich, D.; Bouvry, P. A Survey on Mobile Crowdsensing Systems: Challenges, Solutions, and Opportunities. IEEE Commun. Surv. Tutor. 2019, 21, 2419–2465. [Google Scholar] [CrossRef] [Green Version]
  50. Haklay, M.; Basiouka, S.; Antoniou, V.; Ather, A. How Many Volunteers Does it Take to Map an Area Well? The Validity of Linus’ Law to Volunteered Geographic Information. Cartogr. J. 2010, 47, 315–322. [Google Scholar] [CrossRef] [Green Version]
  51. English, P.B.; Richardson, M.J.; Garzón-Galvis, C. From Crowdsourcing to Extreme Citizen Science: Participatory Research for Environmental Health. Annu. Rev. Public Health 2018, 39, 335–350. [Google Scholar] [CrossRef] [Green Version]
  52. Nimbalkar, P.M.; Tripathi, N.K. Space-time epidemiology and effect of meteorological parameters on influenza-like illness in Phitsanulok, a northern province in Thailand. Geospat. Health 2016, 11. [Google Scholar] [CrossRef] [Green Version]
  53. Sheppard, S.A.; Terveen, L. Quality is a verb. In Proceedings of the 7th International Symposium on Wikis and Open Collaboration—WikiSym ’11, Mountain View, CA, USA, 3–5 October 2011; ACM Press: New York, NY, USA, 2011; p. 29. [Google Scholar] [CrossRef]
  54. Lin, Y.-P.; Deng, D.; Lin, W.-C.; Lemmens, R.; Crossman, N.D.; Henle, K.; Schmeller, D.S. Uncertainty analysis of crowd-sourced and professionally collected field data used in species distribution models of Taiwanese moths. Biol. Conserv. 2015, 181, 102–110. [Google Scholar] [CrossRef]
  55. Parrish, J.K.; Burgess, H.; Weltzin, J.F.; Fortson, L.; Wiggins, A.; Simmons, B. Exposing the Science in Citizen Science: Fitness to Purpose and Intentional Design. Integr. Comp. Biol. 2018, 58, 150–160. [Google Scholar] [CrossRef] [PubMed]
  56. Fritz, S.; Fonte, C.; See, L. The Role of Citizen Science in Earth Observation. Remote Sens. 2017, 9, 357. [Google Scholar] [CrossRef] [Green Version]
  57. Maantay, J. Asthma and air pollution in the Bronx: Methodological and data considerations in using GIS for environmental justice and health research. Health Place 2007, 13, 32–56. [Google Scholar] [CrossRef]
  58. Keddem, S.; Barg, F.K.; Glanz, K.; Jackson, T.; Green, S.; George, M. Mapping the urban asthma experience: Using qualitative GIS to understand contextual factors affecting asthma control. Soc. Sci. Med. 2015, 140, 9–17. [Google Scholar] [CrossRef]
  59. Palmer, J.R.B.; Oltra, A.; Collantes, F.; Delgado, J.A.; Lucientes, J.; Delacour, S.; Bengoa, M.; Eritja, R.; Bartumeus, F. Citizen science provides a reliable and scalable tool to track disease-carrying mosquitoes. Nat. Commun. 2017, 8, 916. [Google Scholar] [CrossRef] [Green Version]
  60. Penza, M.; Suriano, D.; Pfister, V.; Prato, M.; Cassano, G. Urban Air Quality Monitoring with Networked Low-Cost Sensor-Systems. Proceedings 2017, 1, 573. [Google Scholar] [CrossRef] [Green Version]
  61. Kankanamge, N.; Yigitcanlar, T.; Goonetilleke, A.; Kamruzzaman, M. Can volunteer crowdsourcing reduce disaster risk? A systematic review of the literature. Int. J. Disaster Risk Reduct. 2019, 35, 101097. [Google Scholar] [CrossRef]
  62. Choi, J.; Hwang, M.; Kim, G.; Seong, J.; Ahn, J. Supporting the measurement of the United Nations’ sustainable development goal 11 through the use of national urban information systems and open geospatial technologies: A case study of south Korea. Open Geospatial Data Softw. Stand. 2016, 1, 1. [Google Scholar] [CrossRef] [Green Version]
  63. Chmielewski, S.; Samulowska, M.; Lupa, M.; Lee, D.; Zagajewski, B. Citizen science and WebGIS for outdoor advertisement visual pollution assessment. Comput. Environ. Urban Syst. 2018, 67, 97–109. [Google Scholar] [CrossRef]
  64. Flanagin, A.J.; Metzger, M.J. The credibility of volunteered geographic information. GeoJournal 2008, 72, 137–148. [Google Scholar] [CrossRef]
  65. Antoniou, V.; Skopeliti, A. Measures and indicators of VGI quality: An overview. ISPRS Ann. Photogramm. Remote Sens. Spat. Inf. Sci. 2015, II-3/W5, 345–351. [Google Scholar] [CrossRef] [Green Version]
  66. Wu, P.; Ngai, E.W.T.; Wu, Y. Toward a real-time and budget-aware task package allocation in spatial crowdsourcing. Decis. Support Syst. 2018, 110, 107–117. [Google Scholar] [CrossRef]
  67. Foody, G.; See, L.; Fritz, S.; Moorthy, I.; Perger, C.; Schill, C.; Boyd, D. Increasing the Accuracy of Crowdsourced Information on Land Cover via a Voting Procedure Weighted by Information Inferred from the Contributed Data. ISPRS Int. J. Geo-Inf. 2018, 7, 80. [Google Scholar] [CrossRef] [Green Version]
  68. Gillooly, S.E.; Zhou, Y.; Vallarino, J.; Chu, M.T.; Michanowicz, D.R.; Levy, J.I.; Adamkiewicz, G. Development of an in-home, real-time air pollutant sensor platform and implications for community use. Environ. Pollut. 2019, 244, 440–450. [Google Scholar] [CrossRef] [PubMed]
  69. Kosmidis, E.; Syropoulou, P.; Tekes, S.; Schneider, P.; Spyromitros-Xioufis, E.; Riga, M.; Charitidis, P.; Moumtzidou, A.; Papadopoulos, S.; Vrochidis, S.; et al. hackAIR: Towards Raising Awareness about Air Quality in Europe by Developing a Collective Online Platform. ISPRS Int. J. Geo-Inf. 2018, 7, 187. [Google Scholar] [CrossRef] [Green Version]
  70. Commodore, A.; Wilson, S.; Muhammad, O.; Svendsen, E.; Pearce, J. Community-based participatory research for the study of air pollution: A review of motivations, approaches, and outcomes. Environ. Monit. Assess. 2017, 189, 378. [Google Scholar] [CrossRef]
  71. International Organization for Standardization. ISO 19157: Geographic Information—Data Quality; International Organization for Standardization: Geneva, Switzerland, 2013. [Google Scholar]
  72. Fonte, C.C.; Antoniou, V.; Bastin, L.; Estima, J.; Arsanjani, J.J.; Bayas, J.-C.L.; See, L.; Vatseva, R. Assessing VGI Data Quality. In Mapping and the Citizen Sensor; Foody, G., See, L., Fritz, S., Mooney, P., Olteanu-Raimond, A.-M., Fonte, C.C., Antoniou, V., Eds.; Ubiquity Press: London, UK, 2017; pp. 137–163. [Google Scholar] [CrossRef] [Green Version]
  73. Chehregani, A.; Majde, A.; Moin, M.; Gholami, M.; Ali Shariatzadeh, M.; Nassiri, H. Increasing allergy potency of Zinnia pollen grains in polluted areas. Ecotoxicol. Environ. Saf. 2004, 58, 267–272. [Google Scholar] [CrossRef]
  74. D’Amato, G.; Holgate, S.T.; Pawankar, R.; Ledford, D.K.; Cecchi, L.; Al-Ahmad, M.; Al-Enezi, F.; Al-Muhsen, S.; Ansotegui, I.; Baena-Cagnani, C.E.; et al. Meteorological conditions, climate change, new emerging factors, and asthma and related allergic disorders. A statement of the World Allergy Organization. World Allergy Organ. J. 2015, 8, 25. [Google Scholar] [CrossRef] [Green Version]
  75. Karatzas, K.D. Informing the public about atmospheric quality: Air pollution and pollen. Allergo J. 2009, 18, 212–217. [Google Scholar] [CrossRef]
  76. Sofiev, M.; Bergmann, K.C. Allergenic Pollen; Sofiev, M., Bergmann, K.-C., Eds.; Springer: Dordrecht, The Netherlands, 2013; ISBN 978-94-007-4880-4. [Google Scholar] [CrossRef]
  77. Bonney, R.; Cooper, C.B.; Dickinson, J.; Kelling, S.; Phillips, T.; Rosenberg, K.V.; Shirk, J. Citizen Science: A Developing Tool for Expanding Science Knowledge and Scientific Literacy. Bioscience 2009, 59, 977–984. [Google Scholar] [CrossRef]
  78. Ring, J.; Krämer, U.; Schäfer, T.; Behrendt, H. Why are allergies increasing? Curr. Opin. Immunol. 2001, 13, 701–708. [Google Scholar] [CrossRef]
  79. Harlin, J.; Kloetzer, L.; Patton, D.; Leonhard, C. Turning students into citizen scientists. In Citizen Science; UCL Press: London, UK, 2018; pp. 410–428. [Google Scholar] [CrossRef]
  80. Seymour, V.; Haklay, M. Exploring Engagement Characteristics and Behaviours of Environmental Volunteers. Citiz. Sci. Theory Pract. 2017, 2, 5. [Google Scholar] [CrossRef]
  81. Kmenta, M.; Bastl, K.; Jäger, S.; Berger, U. Development of personal pollen information—the next generation of pollen information and a step forward for hay fever sufferers. Int. J. Biometeorol. 2014, 58, 1721–1726. [Google Scholar] [CrossRef] [PubMed]
  82. Samoliński, B.; Raciborski, F.; Lipiec, A.; Tomaszewska, A.; Krzych-Fałta, E.; Samel-Kowalik, P.; Walkiewicz, A.; Lusawa, A.; Borowicz, J.; Komorowski, J.; et al. Epidemiologia Chorób Alergicznych w Polsce (ECAP). Alergol. Pol. Polish J. Allergol. 2014, 1, 10–18. [Google Scholar] [CrossRef]
  83. Galesic, M.; Bosnjak, M. Effects of Questionnaire Length on Participation and Indicators of Response Quality in a Web Survey. Public Opin. Q. 2009, 73, 349–360. [Google Scholar] [CrossRef]
  84. Malhotra, N.K. Questionnaire design and scale development. In The Handbook of Marketing Research: Uses, Misuses, and Future Advances; Grover, R., Vriens, M., Eds.; SAGE Publications Inc.: Thousand Oaks, CA, USA, 2006; p. 720. ISBN 1-4129-0997-X. [Google Scholar] [CrossRef] [Green Version]
  85. Krosnick, J.A.; Presser, S. Question and Questionnaire Design. In Handbook of Survey Research, 2nd ed.; Wright, J.D., Marsden, P.V., Eds.; Elsevier: San Diego, CA, USA, 2009; p. 81. [Google Scholar]
  86. Weijters, B.; Baumgartner, H.; Schillewaert, N. Reversed item bias: An integrative model. Psychol. Methods 2013, 18, 320–334. [Google Scholar] [CrossRef] [Green Version]
  87. Bousquet, J.; Bewick, M.; Arnavielhe, S.; Mathieu-Dupas, E.; Murray, R.; Bedbrook, A.; Caimmi, D.P.; Vandenplas, O.; Hellings, P.W.; Bachert, C.; et al. Work productivity in rhinitis using cell phones: The MASK pilot study. Allergy 2017, 72, 1475–1484. [Google Scholar] [CrossRef]
  88. Albuam, G.; Oppenheim, A.N. Questionnaire Design, Interviewing and Attitude Measurement. J. Mark. Res. 1993, 30, 393. [Google Scholar] [CrossRef]
  89. Garbarski, D.; Schaeffer, N.C.; Dykema, J. The effects of response option order and question order on self-rated health. Qual. Life Res. 2015, 24, 1443–1453. [Google Scholar] [CrossRef] [Green Version]
  90. Schaeffer, N.C.; Presser, S. The Science of Asking Questions. Annu. Rev. Soc. 2003, 29, 65–88. [Google Scholar] [CrossRef] [Green Version]
  91. Boynton, P.M.; Greenhalgh, T. Selecting, designing, and developing your questionnaire. BMJ 2004, 328, 1312–1315. [Google Scholar] [CrossRef] [PubMed] [Green Version]
  92. Arvidsson, M.B.; Lowhagen, O.; Rak, S. Allergen specific immunotherapy attenuates early and late phase reactions in lower airways of birch pollen asthmatic patients: A double blind placebo-controlled study. Allergy 2004, 59, 74–80. [Google Scholar] [CrossRef] [PubMed]
  93. Galli, S.J.; Tsai, M.; Piliponsky, A.M. The development of allergic inflammation. Nature 2008, 454, 445–454. [Google Scholar] [CrossRef] [PubMed] [Green Version]
  94. Gauvreau, G.M.; El-Gammal, A.I.; O’Byrne, P.M. Allergen-induced airway responses. Eur. Respir. J. 2015, 46, 819–831. [Google Scholar] [CrossRef] [Green Version]
  95. Skoner, D.P. Allergic rhinitis: Definition, epidemiology, pathophysiology, detection, and diagnosis. J. Allergy Clin. Immunol. 2001, 108, S2–S8. [Google Scholar] [CrossRef]
  96. Ferguson, B.J. Influences of Allergic Rhinitis on Sleep. Otolaryngol. Neck Surg. 2004, 130, 617–629. [Google Scholar] [CrossRef]
  97. Kampa, M.; Castanas, E. Human health effects of air pollution. Environ. Pollut. 2008, 151, 362–367. [Google Scholar] [CrossRef]
  98. D’Amato, G.; Liccardi, G.; D’Amato, M.; Cazzola, M. Outdoor air pollution, climatic changes and allergic bronchial asthma. Eur. Respir. J. 2002, 20, 763–776. [Google Scholar] [CrossRef]
  99. Couper, M.P.; Traugott, M.W.; Lamias, M.J. Web Survey Design and Administration. Public Opin. Q. 2001, 65, 230–253. [Google Scholar] [CrossRef]
  100. Ganassali, S. The influence of the design of web survey questionnaires on the quality of responses. Surv. Res. Methods 2008, 2, 21–32. [Google Scholar] [CrossRef]
  101. Lupa, M.; Samulowska, M.; Chmielewski, S.; Myszkowska, D.; Czarnobilska, E. A concept of webgis pollen allergy mapping. In Proceedings of the 17th International Multidisciplinary Scientific GeoConference Surveying Geology and Mining Ecology Management, Albena, Bulgaria, 29 June–5 July 2017; SGEM: Sofia, Bulgaria, 2017; pp. 1141–1148. [Google Scholar] [CrossRef]
  102. Kubik-Komar, A.; Piotrowska-Weryszko, K.; Weryszko-Chmielewska, E.; Kuna-Broniowska, I.; Chłopek, K.; Myszkowska, D.; Puc, M.; Rapiejko, P.; Ziemianin, M.; Dąbrowska-Zapart, K.; et al. A study on the spatial and temporal variability in airborne Betula pollen concentration in five cities in Poland using multivariate analyses. Sci. Total Environ. 2019, 660, 1070–1078. [Google Scholar] [CrossRef] [PubMed]
  103. Caspari, G.; Donato, S.; Jendryke, M. Remote sensing and citizen science for assessing land use change in the Musandam (Oman). J. Arid Environ. 2019, 171, 104003. [Google Scholar] [CrossRef]
  104. Nov, O.; Arazy, O.; Anderson, D. Dusting for science. In Proceedings of the 2011 iConference on iConference’11, Seattle, WA, USA, 8–11 February 2011; ACM Press: New York, NY, USA, 2011; pp. 68–74. [Google Scholar] [CrossRef]
  105. McCrory, G.; Veeckman, C.; Claeys, L. Citizen Science Is in the Air—Engagement Mechanisms from Technology-Mediated Citizen Science Projects Addressing Air Pollution. In Lecture Notes in Computer Science, 10673; Springer: Cham, Switzerland, 2017; pp. 28–38. [Google Scholar] [CrossRef]
  106. Farman, J. Infrastructures of Mobile Social Media. Soc. Media Soc. 2015, 1. [Google Scholar] [CrossRef] [Green Version]
  107. Hube, C.; Fetahu, B.; Gadiraju, U. Understanding and Mitigating Worker Biases in the Crowdsourced Collection of Subjective Judgments. In Proceedings of the 2019 CHI Conference on Human Factors in Computing Systems—CHI ’19, Glasgow, UK, 4–9 May 2019; ACM Press: New York, NY, USA, 2019; pp. 1–12. [Google Scholar] [CrossRef]
  108. Eickhoff, C. Cognitive Biases in Crowdsourcing. In Proceedings of the Eleventh ACM International Conference on Web Search and Data Mining—WSDM ’18, Los Angeles, CA, USA, 5–9 February 2018; ACM Press: New York, NY, USA, 2018; pp. 162–170. [Google Scholar] [CrossRef]
  109. Alabri, A.; Hunter, J. Enhancing the Quality and Trust of Citizen Science Data. In Proceedings of the 2010 IEEE Sixth International Conference on e-Science, Brisbane, Australia, 7–10 December 2010; IEEE: Piscataway, NJ, USA, 2010; pp. 81–88. [Google Scholar] [CrossRef]
  110. Langley, S.A.; Messina, J.P.; Moore, N. Using meta-quality to assess the utility of volunteered geographic information for science. Int. J. Health Geogr. 2017, 16, 40. [Google Scholar] [CrossRef] [Green Version]
  111. Nowak, M.M.; Dziób, K.; Ludwisiak, Ł.; Chmiel, J. Mobile GIS applications for environmental field surveys: A state of the art. Glob. Ecol. Conserv. 2020, 23, e01089. [Google Scholar] [CrossRef]
  112. Geoghegan, H.; Dyke, A.; Pateman, R.; West, S.; Everett, G. Understanding Motivations for Citizen Science; Final Report on Behalf of the UK Environmental Observation Framework; University of Reading, Stockholm Environment Institute (University of York) and University of the West of England; UK Centre for Ecology & Hydrology, Lancaster Environment Centre: Lancaster, UK, May 2016; pp. 1–4. Available online: http://www.ukeof.org.uk/resources/citizen-science-resources/citizenscienceSUMMARYReportFINAL19052.pdf (accessed on 12 November 2018).
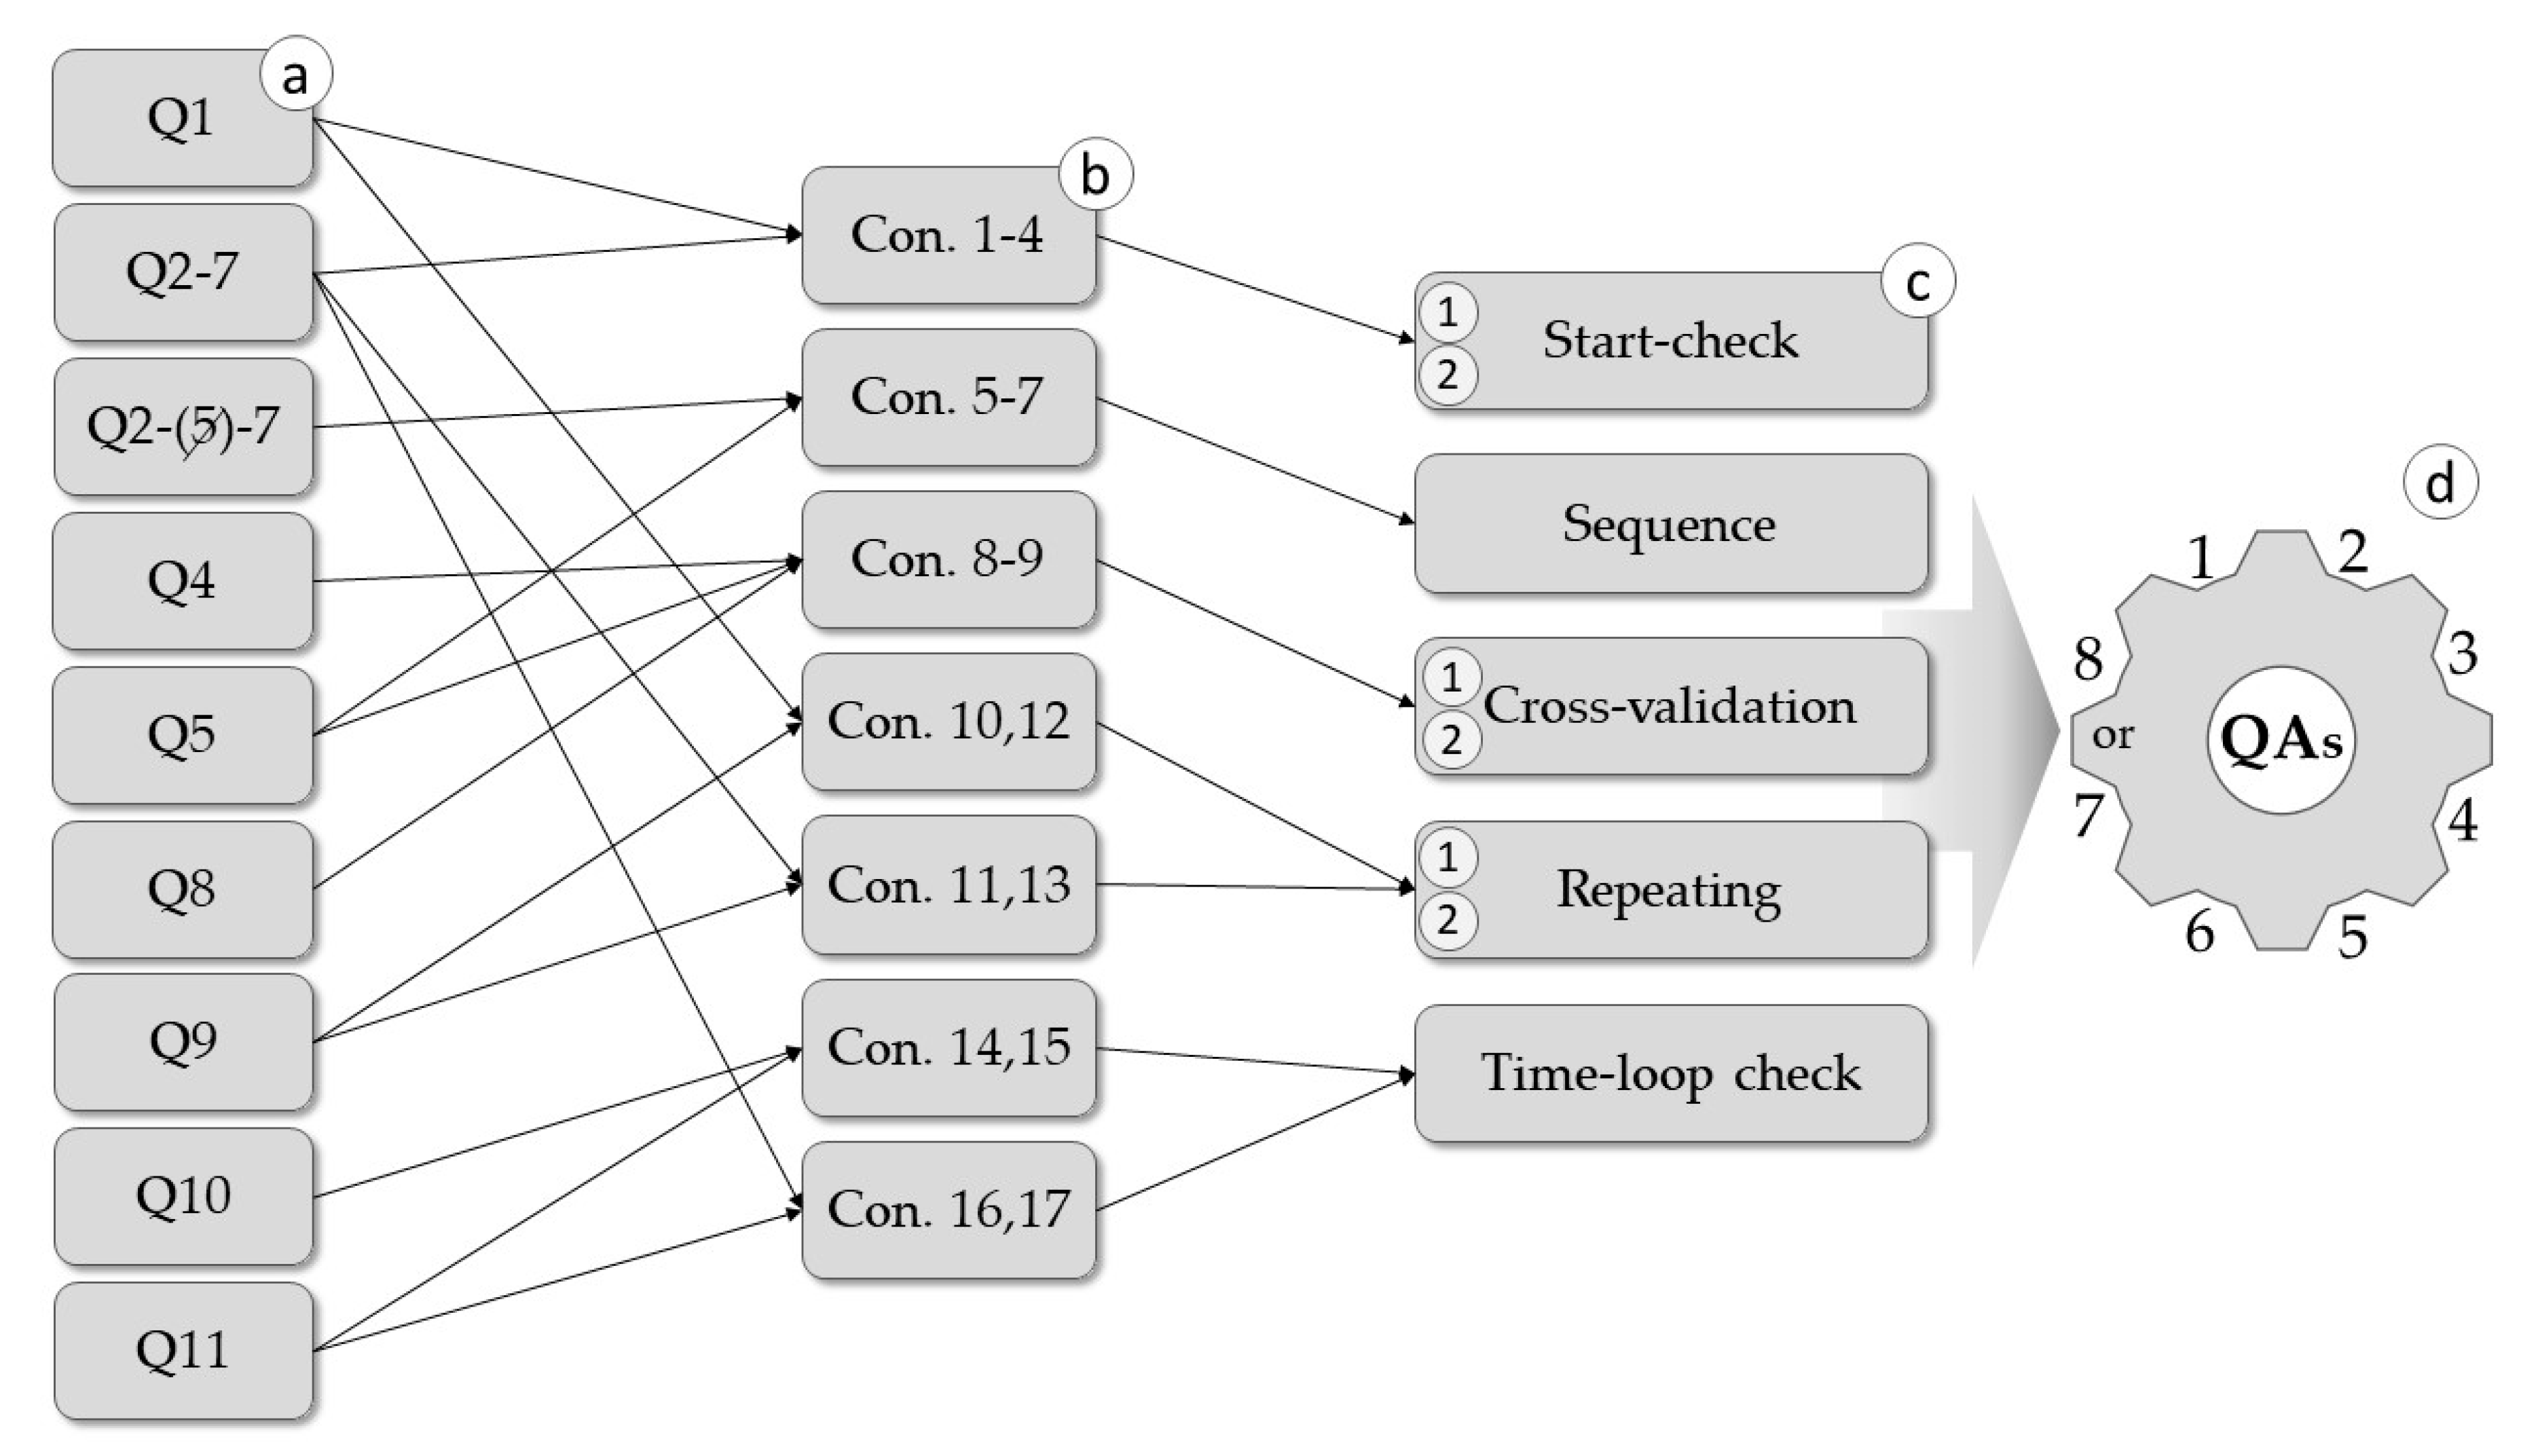
Figure 1. The flowchart of the air pollution symptom mapping (APSM) questionnaire: (a) the user-screening question about pollen allergy as well as an individual nickname and survey four-digit code assigned to the users’ profile, (b) the introducing question about subjective well-being (asked at the very beginning of the survey), (c) the set of seven close-ended questions about individual symptoms (question no 8 was answered, “Seldom,” “Quite often,” “Very often,” or “I do not rub eyes”), (d) closing questions about subjective well-being, and (e) time and geographical location recording.
Ijgi 10 00046 g001
Figure 2. The four-tier structure of the data quality assurance (QA) framework: (a) set of logically related questions with number-coded answers, (b) conditional statements being the primary logical-based formula, (c) combination of several conditional statements creating a QA mechanism tier, and (d) combining mechanisms creating an advanced QA system.
Ijgi 10 00046 g002
Figure 3. Geospatial web architecture implemented for the APSM project: (A) mobile survey app for field data collection, (B) web app with educational and training materials, (C) dashboard app for monitoring the data collection process and presenting APSM results, and (D) quality assurance module.
Ijgi 10 00046 g003
Figure 4. Citizen activity curves during the field data collection campaign.
Ijgi 10 00046 g004
Figure 5. Web mapping dashboard app presenting results of QA-checked data using QAs8: (a) map, (b) layer list, (c) legend, (d) pie chart of citizen symptom severity, (e) bar chart of citizen general comfort, (f) pie chart of QA system robustness, and (g) indicator of QA-checked reports.
Ijgi 10 00046 g005
Table 1. Conditional (Con.) statements, the basis of the quality assurance (QA) mechanisms.
Conditional Statement NumberLogic Formula
Con.1 i f [ ( Q 1 = 0 )   o r   ( ( Q 1 = 1 )   a n d   ( a n y ( Q 2 : Q 7 ) = 3 ) ) ]   t h e n   f a l s e ,
Con.2 i f [ ( Q 1 = 0 )   o r   ( ( Q 1 = 3 )   a n d   ( a l l ( Q 2 : Q 7 ) 3 ) ) ]   t h e n   f a l s e ,
Con.3 i f [ ( Q 1 = 0 )   o r   ( ( Q 1 = 1 )   a n d   ( a n y ( Q 2 : Q 7 ) > 1 ) ) ]   t h e n   f a l s e ,
Con.4 i f [ ( Q 1 = 0 )   o r   ( ( Q 1 = 3 )   a n d   ( a l l ( Q 2 : Q 7 ) 3 ) ) ]   t h e n   f a l s e ,
Con.5 i f [ a l l ( ( Q 2 : Q 4 )   o r   ( Q 6 : Q 7 ) ) = 1 )   a n d   ( Q 5 = 3 ) ]   t h e n   f a l s e ,
Con.6 i f [ a l l ( ( Q 2 : Q 4 )   o r   ( Q 6 : Q 7 ) ) = 3 )   a n d   ( Q 5 = 1 ) ]   t h e n   f a l s e ,
Con.7 i f [ a l l ( ( Q 2 : Q 4 )   o r   ( Q 6 : Q 7 ) ) = 0 )   a n d   ( Q 5 = 2 ) ]   t h e n   f a l s e ,
Con.8 i f [ ( ( Q 5 = 0 )   a n d   ( Q 8 = 3 ) )   o r   ( ( Q 4 = 0 )   a n d   ( Q 8 = 3 ) ) ]   t h e n   f a l s e ,
Con.9 i f [ ( ( Q 5 = 0 )   a n d   ( Q 8 0 ) )   o r   ( ( Q 4 = 0 )   a n d   ( Q 8 0 ) ) ]   t h e n   f a l s e ,
Con.10 i f [ ( ( Q 9 = 1 )   a n d   ( Q 1 = 3 ) )   o r   ( ( Q 9 = 3 )   a n d   ( Q 1 = 1 ) ) ]   t h e n   f a l s e ,
Con.11 i f [ ( ( Q 9 = 1 )   a n d   ( a n y ( Q 2 : Q 7 ) = 3 ) )   o r   ( ( Q 9 = 3 )   a n d   ( a l l ( Q 2 : Q 7 ) 3 ) ) ]   t h e n   f a l s e ,
Con.12 i f [ ( ( Q 9 = 1 )   a n d   ( Q 1 1 ) ) o r   ( ( Q 9 = 2 )   a n d   ( Q 1 2 ) )   o r   ( ( Q 9 = 3 )   a n d   ( Q 1 3 ) ) ]   t h e n   f a l s e ,
Con.13 i f [ ( ( Q 9 = 1 )   a n d   ( ( a n y ( Q 2 : Q 7 ) = 3 )   o r   ( a n y ( Q 2 : Q 7 ) = 2 ) ) ) o r  
o r   ( ( Q 9 = 3 )   a n d   ( a l l ( Q 2 : Q 7 ) 3 ) ) ]   t h e n   f a l s e ,
Con.14 i f ( Q 11 Q 10 )   t h e n   f a l s e ,
Con.15 i f [ ( Q 11 = 1 )   o r   ( Q 11 > 120 ) ]   t h e n   f a l s e ,
Con.16 i f [ ( a l l ( Q 2 : Q 7 ) = 0 )   a n d   ( Q 11 0 ) ]   t h e n   f a l s e ,
Con.17 i f [ ( a l l ( Q 2 : Q 7 ) 0 )   a n d   ( Q 11 = 0 ) ]   t h e n   f a l s e .
Table 2. QA mechanisms implemented in the citizen air-pollution-related symptoms questionnaire, with less (1) and more (2) robust variants.
QA MechanismQA Mechanism CodeQA Mechanism Components:
Conditional Statement Combination
Start-check (SC)SC1Con.1 or Con.2
SC2Con.3 or Con.4
Sequence (Sq)SqCon.5 or Con.6 or Con.7
Cross-validation (CV)CV1Con.8
CV2Con.9
Repeating (Rp)Rp1Con.10 or Con.11
Rp2Con.12 or Con.13
Time-loop check (TC)TCCon.14 or Con.15 or Con.16 or Con.17
Table 3. QA system variants applied for air pollution symptom mapping (APSM).
QA System (QAs) VariantQA System Components: QA Mechanism Combination
QAs1SC1 or Sq or CV1 or Rp1 or TC
QAs2SC1 or Sq or CV1 or Rp2 or TC
QAs3SC1 or Sq or CV2 or Rp1 or TC
QAs4SC2 or Sq or CV1 or Rp1 or TC
QAs5SC2 or Sq or CV1 or Rp2 or TC
QAs6SC2 or Sq or CV2 or Rp1 or TC
QAs7SC1 or Sq or CV2 or Rp2 or TC
QAs8SC2 or Sq or CV2 or Rp2 or TC
Table 4. QA mechanism robustness.
QA MechanismReportsQA Mechanism Robustness Rank
NameCodeAcceptedRejectedTotalRejected
(% of Total)
Start-checkSC117527118233.95
SC2169812518236.93
SequenceSq18061718230.98
Cross-validationCV117695418233.06
CV2171610718235.94
RepeatingRp11629194182310.62
Rp21401422182323.11
Time-loop checkTC17715218232.97
Table 5. QA mechanism variant compatibility.
Start-Check2Cross-Validation2Repeating2
AcceptedRejectedAcceptedRejectedAcceptedRejected
Start-check1Accepted169854
Rejected071
Cross-validation1Accepted 171653
Rejected 054
Repeating1Accepted 1401228
Rejected 0194
Table 6. QA system variant robustness.
QA System VariantQA Mechanisms CombinationReportsQA System Robustness Rank
AcceptedRejectedTotalRejected
(% of total)
QAs1SC1 or Sq or CV1 or Rp1 or TC1490333182318.36
QAs2SC1 or Sq or CV1 or Rp2 or TC1325498182327.32
QAs3SC1 or Sq or CV2 or Rp1 or TC1459364182320.05
QAs4SC2 or Sq or CV1 or Rp1 or TC1445378182320.74
QAs5SC2 or Sq or CV1 or Rp2 or TC1325498182327.32
QAs6SC2 or Sq or CV2 or Rp1 or TC1422401182322.03
QAs7SC1 or Sq or CV2 or Rp2 or TC1302521182328.61
QAs8SC2 or Sq or CV2 or Rp2 or TC1302521182328.61
Table 7. QAs8 impact on the percentage of surveys with reported air-pollution-related symptoms.
% of Surveys with Reported SymptomsQAs8 Impact on the Results
Raw DataQAs8-Checked Data
Sneezing29.9825.52−0.149
Nose itching30.2721.98−0.274
Runny nose46.5846.980.009
Watering eyes26.7721.52−0.196
Scratching in the throat22.7314.68−0.542
Breathing problems13.146.92−0.473
Publisher’s Note: MDPI stays neutral with regard to jurisdictional claims in published maps and institutional affiliations.

