
Seismic Damage Semantics on Post-Earthquake LOD3 Building Models Generated by UAS


Department of Geography, University of the Aegean, 81000 Mytilene, Greece
*
Author to whom correspondence should be addressed.
ISPRS Int. J. Geo-Inf. 2021, 10(5), 345; https://0-doi-org.brum.beds.ac.uk/10.3390/ijgi10050345
Submission received: 30 March 2021
/
Revised: 10 May 2021
/
Accepted: 14 May 2021
/
Published: 18 May 2021
(This article belongs to the Special Issue Geospatial Semantics Applications)
Abstract
:In a post-earthquake scenario, the semantic enrichment of 3D building models with seismic damage is crucial from the perspective of disaster management. This paper aims to present the methodology and the results for the Level of Detail 3 (LOD3) building modelling (after an earthquake) with the enrichment of the semantics of the seismic damage based on the European Macroseismic Scale (EMS-98). The study area is the Vrisa traditional settlement on the island of Lesvos, Greece, which was affected by a devastating earthquake of Mw = 6.3 on 12 June 2017. The applied methodology consists of the following steps: (a) unmanned aircraft systems (UAS) nadir and oblique images are acquired and photogrammetrically processed for 3D point cloud generation, (b) 3D building models are created based on 3D point clouds and (c) 3D building models are transformed into a LOD3 City Geography Markup Language (CityGML) standard with enriched semantics of the related seismic damage of every part of the building (walls, roof, etc.). The results show that in following this methodology, CityGML LOD3 models can be generated and enriched with buildings’ seismic damage. These models can assist in the decision-making process during the recovery phase of a settlement as well as be the basis for its monitoring over time. Finally, these models can contribute to the estimation of the reconstruction cost of the buildings.
Keywords:
post-earthquake; LOD3; CityGML; semantics; 3D building models; 3D point cloud; UAS; seismic damage1. Introduction
Over the past few years, 3D representation of spatial objects from buildings to whole cities has become increasingly important for a better understanding of the modern world. Three-dimensional models are digital objects that represent urban spatial data of the Earth’s surface [1]. There has been a wide development in the usage of 3D models and 3D geovisualization in a variety of applications such as navigation, urban planning, energy planning, landscape planning, 3D cadastre, real estate, public participation, construction, tourism, facilities management, environmental simulations, Smart Cities applications and disaster management [2,3,4]. Three-dimensional models had the disadvantage that they only serve as graphical or geometrical models ignoring semantics and topology. These models could only be used for visualization purposes, but not for thematic queries, analysis tasks, and spatial data mining [5]. In semantic 3D modelling, besides the topology and geometry, the semantics of 3D objects are established, and thus, the objects of the urban landscape are classified and their spatial and thematic properties are described. The semantics are important for the structural complexity of urban objects. City objects can be semantically enriched and divided into their structural components with their attributes and their correlations [6]. Based on these, CityGML has been developed. CityGML is an international standard created by the Open Geospatial Consortium (OGC) and it is based on XML format for the storage, representation and exchange of 3D models [5,7,8,9]. In CityGML, standard, semantic, spatial and geometrical properties of building models are organized in five levels of detail (LOD), from LOD0 to LOD4, where models become increasingly accurate and detailed [7]. Analytically, a building in LOD0 is represented by 2.5D footprints. LOD1 is a generalized block model with walls, without any roof structures. LOD2 is a model with walls and various types of roof structure. LOD3 is a detailed model with openings (windows and doors) and different roof structures. Finally, LOD4 is a LOD3 model that includes detailed indoor geometries [9,10,11].
Natural disasters such as earthquakes can cause casualties, devastating impacts in urban areas and financial loss. As defined by the Disaster Management Cycle, activities, programmes and measures can be conducted before (pre-disaster), during (disaster occurrence) and after a disaster (post-disaster). The post-disaster phases are response, recovery and reconstruction [12]. Earthquakes are unavoidable; however, disaster management has evolved through the years. When an earthquake strikes, damage assessment is the primary source for obtaining information, regarding the extent of damage and its spatial spread [13]. Ground-based and remote sensing-based assessments are the two major methods for evaluating damaged buildings. The post-earthquake damage assessment of the structures is executed through field surveys. However, these methods are time-consuming, occasionally dangerous and often it is impossible to access the affected area [14].
Remote sensing techniques (spaceborne and airborne) are used in a variety of applications and have been proven to be very efficient for rapid data collection after an earthquake. For many years, synthetic aperture radar (SAR) and light detection and ranging (LIDAR) technologies have been used for damage detection [15,16,17,18,19,20]. In recent years, some studies have proposed deep learning approaches for post-disaster building damage detection [21,22]. A low cost, accurate and safe method for gathering the damage information of the whole affected area is UAS [23,24]. UAS technology is used immediately after a disaster or for monitoring during the recovery phase, as it provides high-resolution images or videos and several studies suggest that they are ideal for these situations [24,25,26,27,28,29]. UAS, alongside the utilization of structure-from-motion (SfM) and multi-view stereo (MVS) algorithms, produce high-resolution 3D point clouds [30]. According to Tu et al. [25], the use of UAS images in the detection of damaged buildings is an efficient tool in the decision-making process. Furthermore, the combination of nadir and oblique images provide damage information of the entire affected building, both for the roof and the walls [31]. Vetrivel et al. [32], with the use of UAS, generated 3D point clouds to obtain damage information on buildings.
Building damage is measured by grades according to the European Macroseismic Scale 1998 (EMS-98) [33] and is categorized into five main groups. The classification of damage to masonry and reinforced concrete buildings is as follows: i. grade 1—negligible to slight damage; ii. grade 2—moderate damage; iii. grade 3—substantial to heavy damage; iv. grade 4—very heavy damage; v. grade 5—destruction.
Although the post-earthquake UAS survey provides high-resolution and geometrically accurate 3D data, their use still focuses on 2D mapping for damage detection. On the other hand, the 3D visualization of buildings affected by an earthquake can assist in the decision-making process. Three-dimensional models and 3D visualization are communication tools more effective than 2D maps in disaster management [34]. Three-dimensional modelling has been applied in a variety of studies but is restricted to visualization purposes only [35,36,37,38,39]. Regarding the generation of CityGML building models in disaster management, there are few approaches. CityGML models were used for seismic vulnerability assessment and analysis in the research of Redweik et al. [40]. Colucci et al. [41] converted an HBIM model of an earthquake-damaged cultural heritage building into a LOD3 CityGML format model.
In general, most studies concern the generation of LOD2 and LOD3 building models, where CityGML models of lower levels of detail (LOD1 and LOD2) can be generated semi or fully automatically and are more widely available, unlike LOD3 models, which are restricted [42]. UAS technology has evolved and the data acquisition is efficient and accurate for the generation of LOD2 building models at a city block scale. However, on a building scale for LOD3 building models, there are still challenges in the data acquisition process [43]. Detailed LOD3 building models are not easily generated since modelling the geometrical features on the exterior surfaces (windows, doors, balconies, etc.) is difficult. Furthermore, the acquisition of these outer elements usually is carried out by employing multi-source techniques, which is time-consuming and more expensive. Nevertheless, more detailed 3D models are usually not necessary, and they can be summarized inside a set of attributes to a simple geometric element. The main approach for generating LOD3 building models from scratch is the use of 3D point clouds [42,44]. Prieto et al. [45] presented a methodology according to which a point cloud was used to generate a 3D model that was transformed into CityGML. Gruen et al. [46] generated a LOD3 model from UAS and LiDAR point clouds. Malihi et al. [47] reconstructed a LOD3 model using dense UAS point clouds.
Regarding semantic modelling, Saran et al. [48] presented a data acquisition technique of a building, which was modelled with Google SketchUp and transformed into CityGML where the semantic characteristics for energy were enriched.
This study aims to present the methodology for the generation of LOD3 building models from 3D point clouds generated by SfM from acquired UAS images and the semantic enrichment of the seismic damage based on the European Macroseismic Scale (EMS-98). The contribution of this article is based on the fact, that 3D modelling and semantic enrichment of the seismic damage in buildings becomes possible, by utilizing UAS systems as well as geoinformatics methods, e.g., the CityGML standard. Analytically, affected buildings can be 3D modelled and transformed into CityGML and the seismic damage recorded in the individual sections of the buildings can be integrated into the CityGML through its extension and the corresponding ontological structure created which is based on the EMS-98. Primarily, CityGML LOD3 building models are created from the 3D point clouds, derived from the processing of high-resolution UAS data and then acquiring their semantic structure as parts of the building, such as walls, roofs and openings (doors and windows). Subsequently, each part of the building including the walls and roof is enriched with seismic damage. In this way, it is possible to record the seismic damage not only in the whole building, as it has been applied so far, but also to be distributed in each part of the building separately. The study was applied in the Vrisa traditional settlement, on the island of Lesvos, Greece, which was affected by a devastating earthquake of Mw = 6.3 on 12 June 2017.
2. Materials and Methods
2.1. Study Area
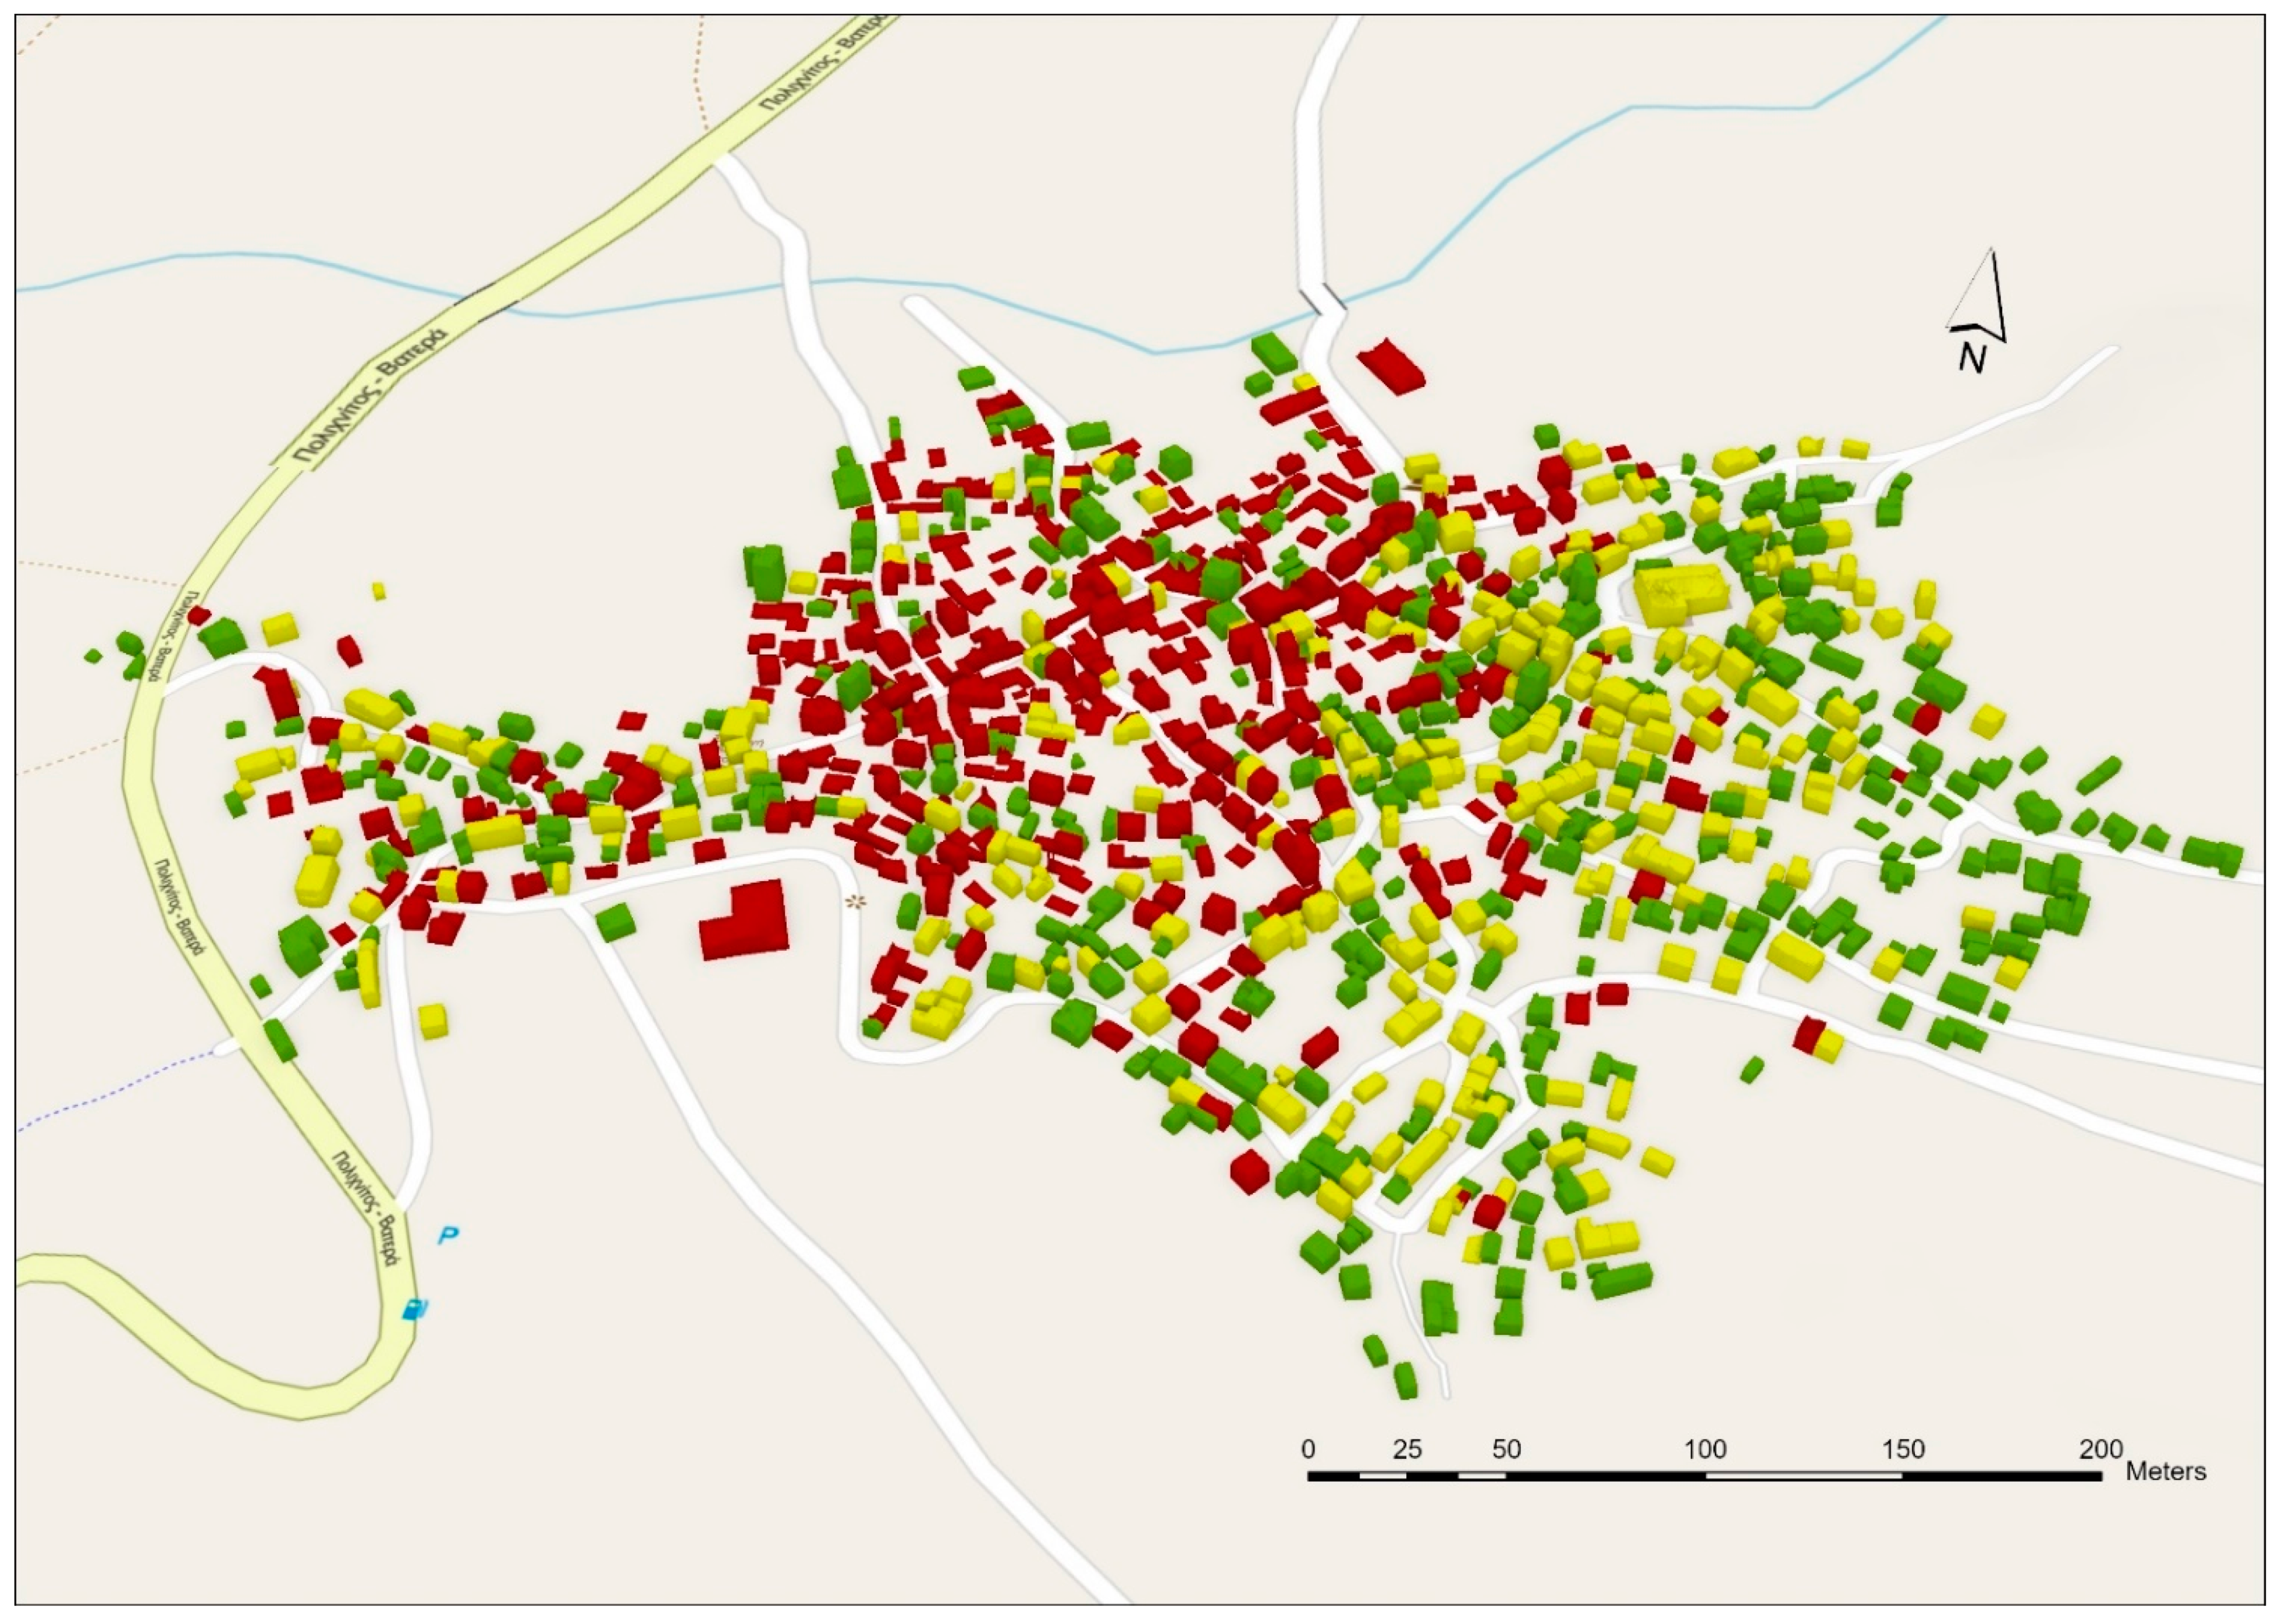
The traditional settlement of Vrisa, Lesvos, Greece, was severely damaged by the catastrophic earthquake of 12 June 2017. Up until today, more than 350 traditional buildings have been demolished due to their significant degree of damage and more than 200 buildings with moderate seismic damage have been repaired. The buildings of the settlement are mostly masonry buildings, single-story and two-story with tiled roofs (only nine buildings are three-story). Several buildings also have a basement and as a result, their heights range from 4.5 m (single-story with tiled roof) to 7.5 m (two-story with roof). Their three-dimensional modelling in Level of Detail 2 (LOD2) was performed using the digital surface model (DSM) and the orthophoto map that were created by processing high-resolution images captured by UAS. The LOD2 buildings were generated in a part of the Vrisa settlement consisting of 80 buildings using the footprints of the buildings, digital surface models (DSMs), a digital elevation model (DEM) and orthophoto maps of the area (Figure 1) [49,50]. On 7 October 2020, high-resolution images of the entire settlement of Vrisa were collected for the creation of 3D points clouds and then were utilized in the 3D modelling of the settlement at LOD2. The integration of seismic damage in LOD2 models was based on the categorization of Earthquake Planning and Protection Organization (EPPO) [51] in three classes, “green—safe for use”, “yellow—unsafe for use” and “red—dangerous for use”, as shown in Figure 1.
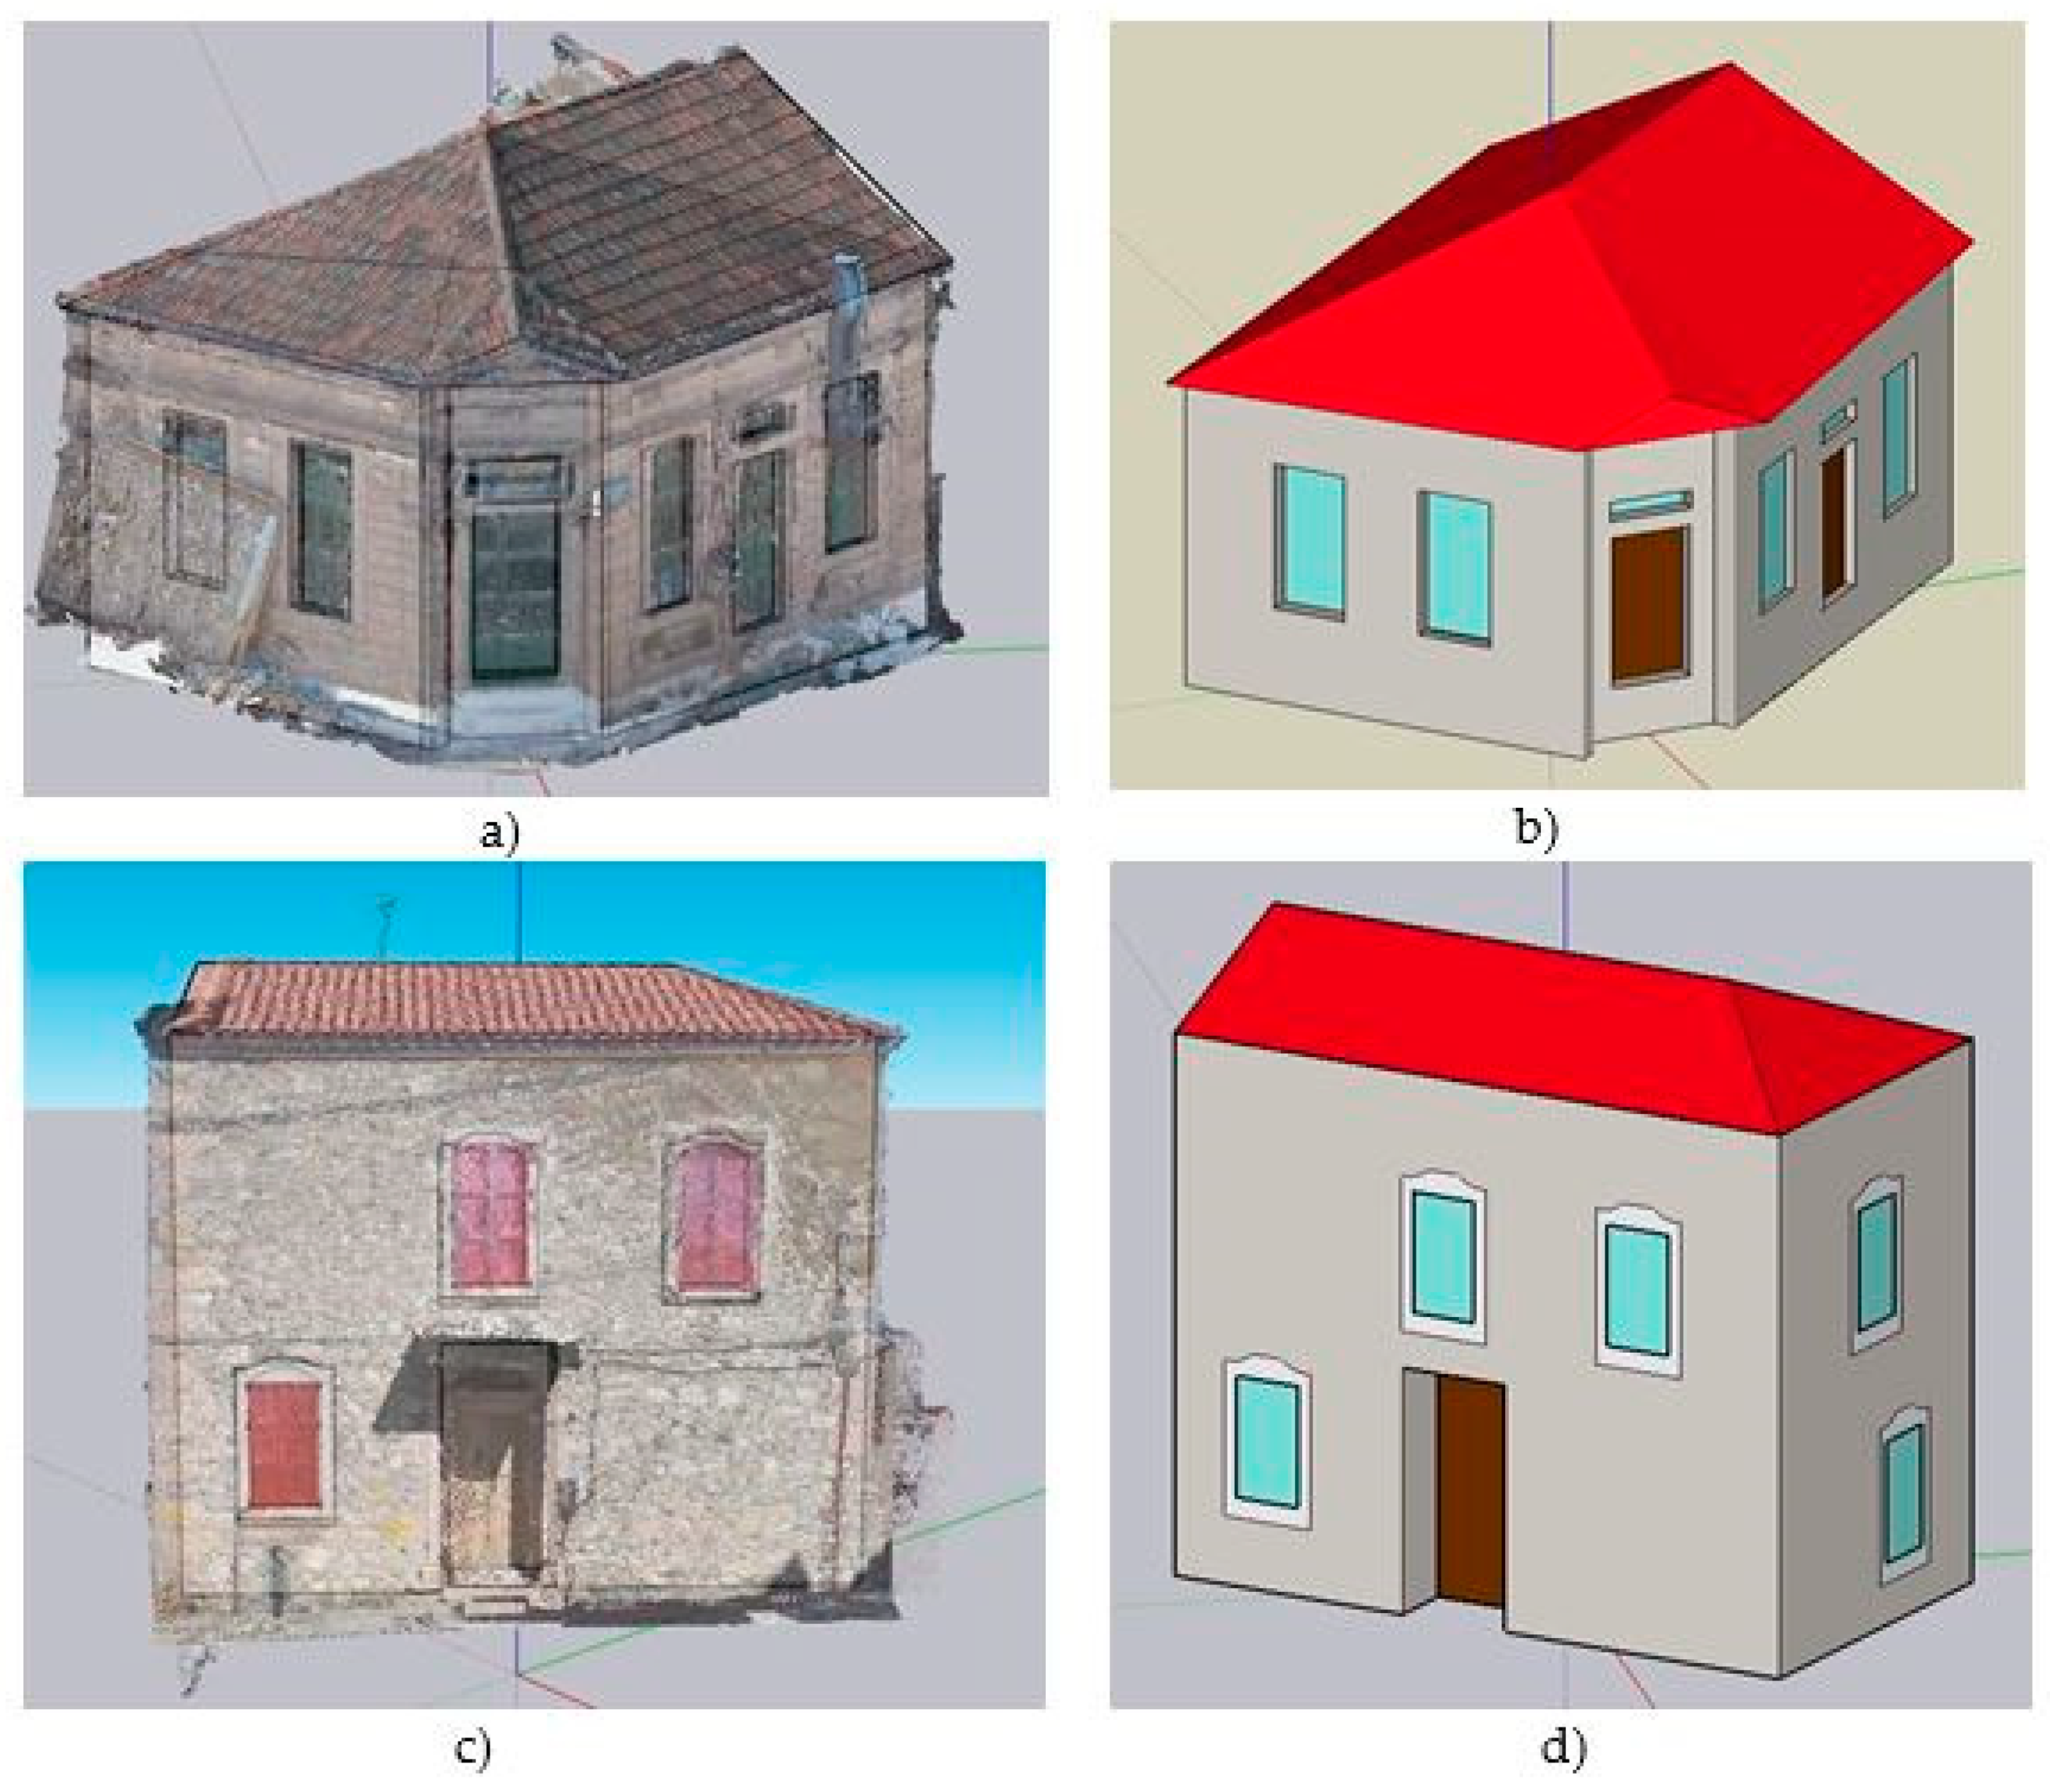
For the present study, two traditional buildings of the settlement were selected based on their morphological and structural characteristics to be modelled at LOD3, using 3D point clouds produced by the processing of nadir/oblique imagery of manual UAS flights. Specifically, building A is a stone-built one-story cafe with a complex tiled roof. It is a corner building that is in contact with two other buildings. It consists of two doors—one serving as the main entrance with the dimensions 2.26 × 1.12 m and the other, on the other facade, with the dimensions 1 × 2.20 m—and two windows (dimensions 1 × 2.10 m) on each facade. The height of the building is 4.72 m and the height of the roof is 2.07 m. The seismic damage of the building is located on the walls and consists of hair-line cracks. Building Β is a stone-built two-story residence with a tiled roof that is in contact with one other building. It consists of one main door (dimensions 3.26 × 1.50 m) and 10 windows (dimensions 0.90 × 1.60 m) on the facades. The height of the building is 7.18 m and the height of the roof is 1.08 m. The seismic damage of the building is located both on the walls and on the roof. In particular, the damage consists of diagonal cracks in three walls, serious failure of one wall and partial structural failure of the roof.
2.2. Methodology
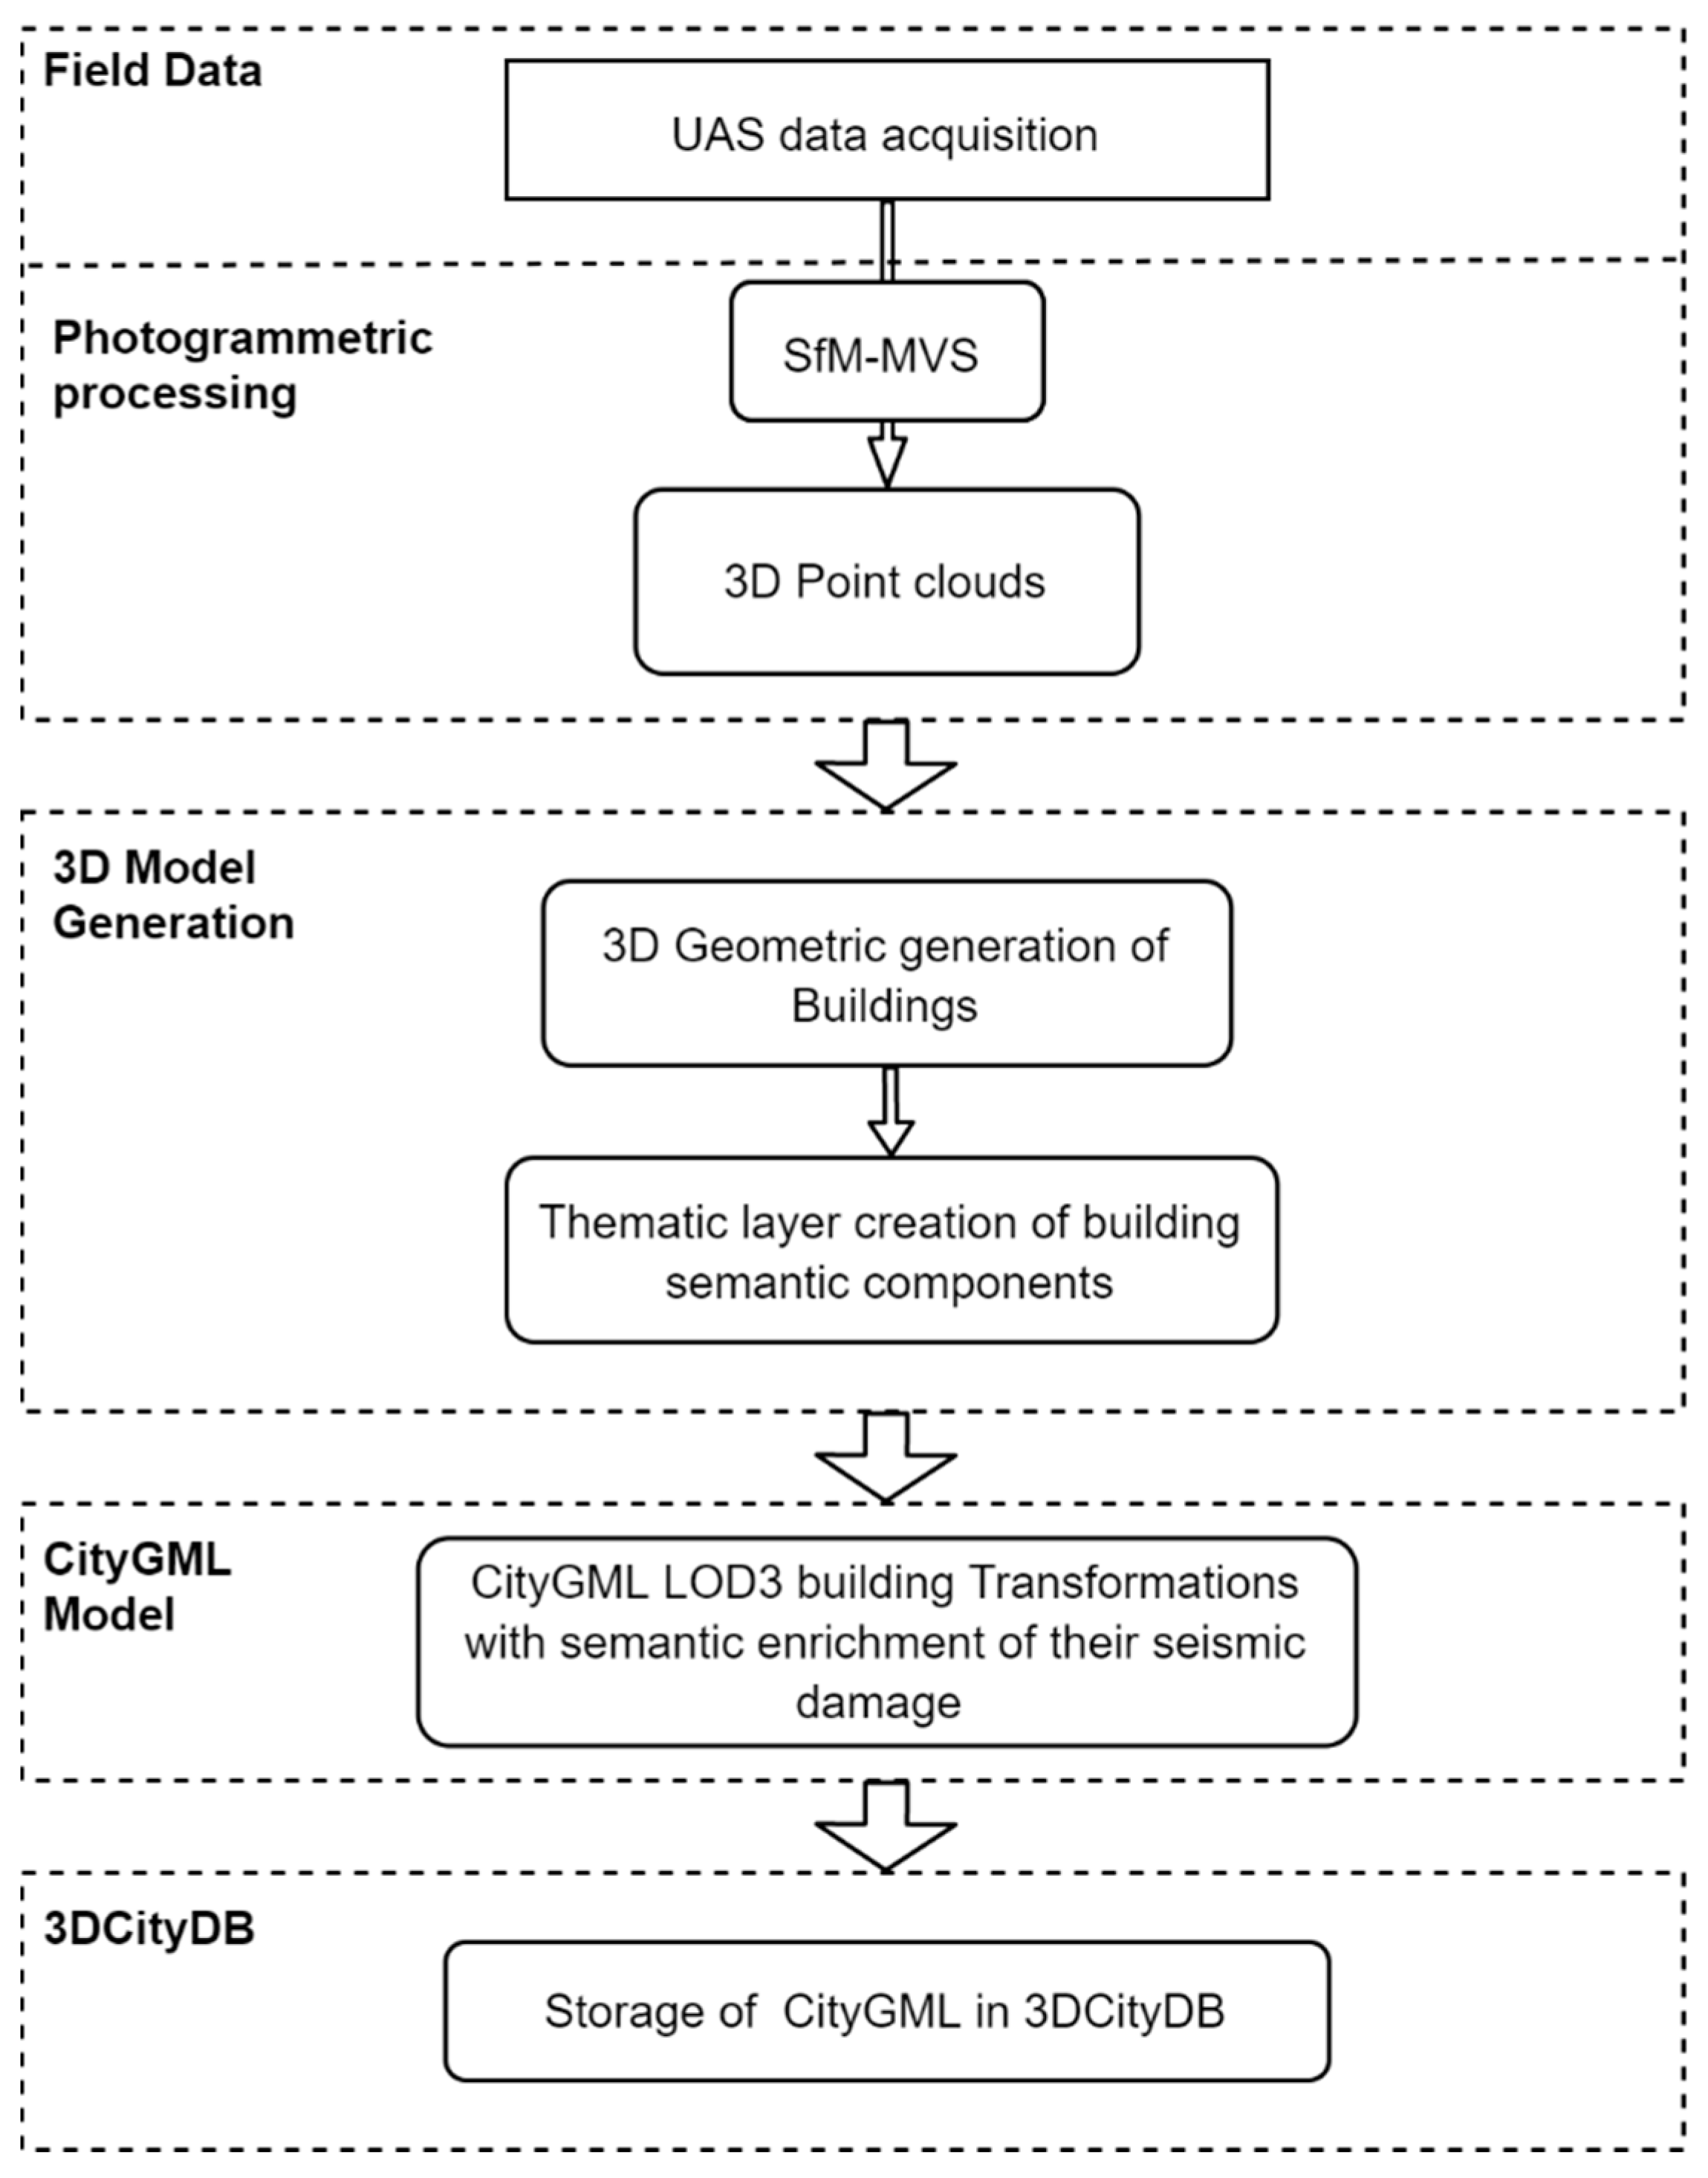
The workflow of this study is presented in Figure 2 and consists of five steps: (i) UAS data acquisition from manual flights around the buildings, (ii) photogrammetric processing of the acquired data, (iii) LOD3 building models generation, (iv) CityGML model transformation with semantic enrichment of their seismic damage and (v) storage of the models in 3DCityDB.
2.2.1. UAS Data Acquisition
In this study, two UAS flights were performed aiming to collect the appropriate images for 3D model building generation. The flights were conducted manually because the flight height was low, and there were many obstacles around the buildings. During these flights, nadir and oblique high-resolution images of the two selected buildings were acquired for the generation of 3D point clouds. The flight parameters are presented in Table 1. Both UAS flights were conducted on 7 October 2020 at 30 m flight height with a nadir and oblique camera angle and a ground sample distance (GSD) of 0.9 cm/pix. A total area of 272 m2 was mapped and the flight duration was 10 min for building A while for building B, a total area of 152 m2 was mapped and the flight duration was 12 min. As a result, 90 high-resolution images were acquired for building A and 95 for building B.
2.2.2. Photogrammetric Processing for 3D Point Cloud Generation
The first step is the quality control of the images, which involves the image quality index (IQI). Through this check, all acquired images presented IQI > 0.7 and were further processed. For the generation of high-resolution 3D point clouds, structure-from-motion (SfM) and multi-view stereo (MVS) algorithms were used in Agisoft Metashape Version 1.6 software [52]. In particular, image alignment was performed by SfM, which uses Sift and RANSAC algorithms, resulting in a sparse 3D point cloud. Subsequently, the dense point cloud was generated by the MVS algorithm.
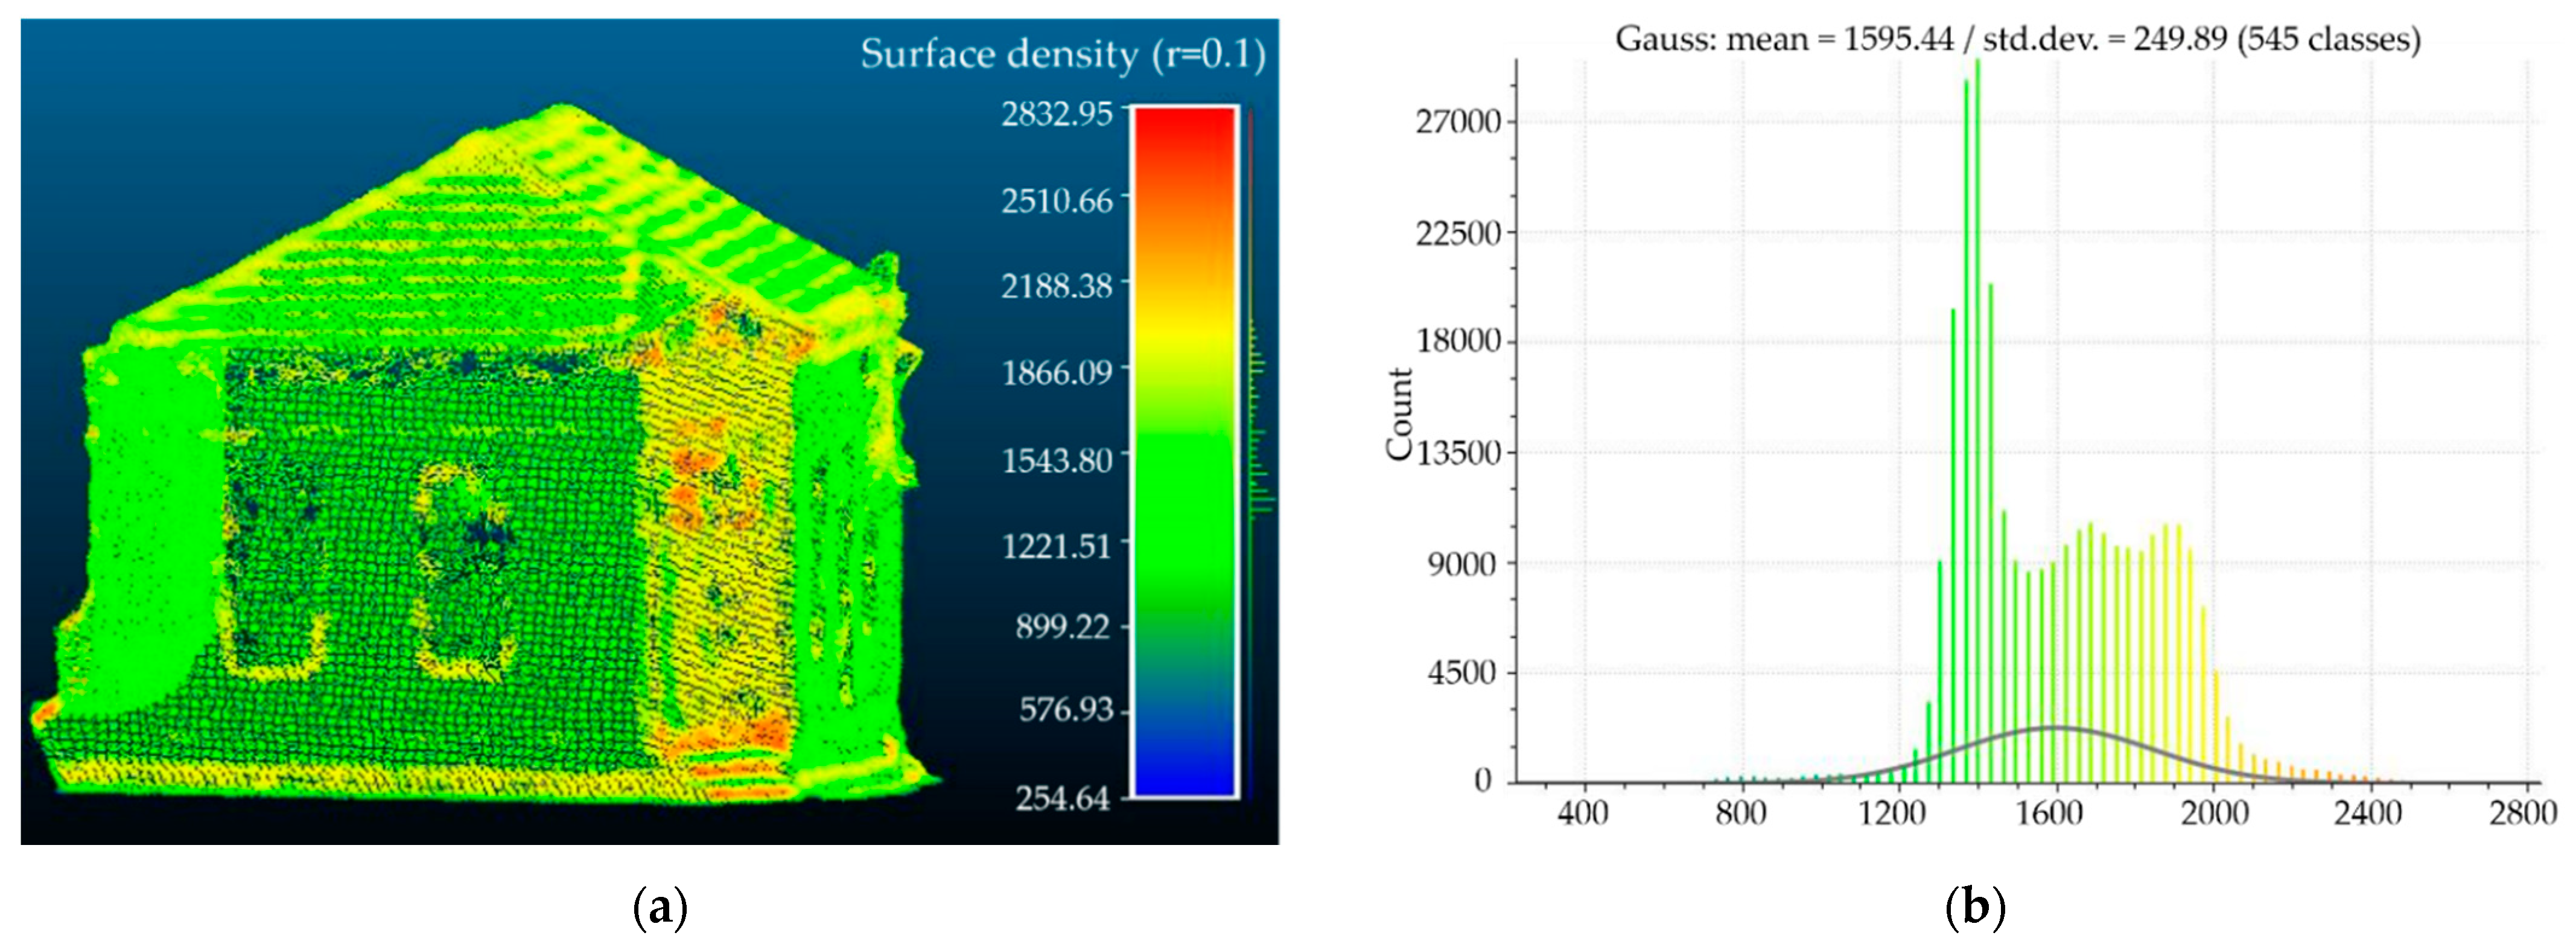
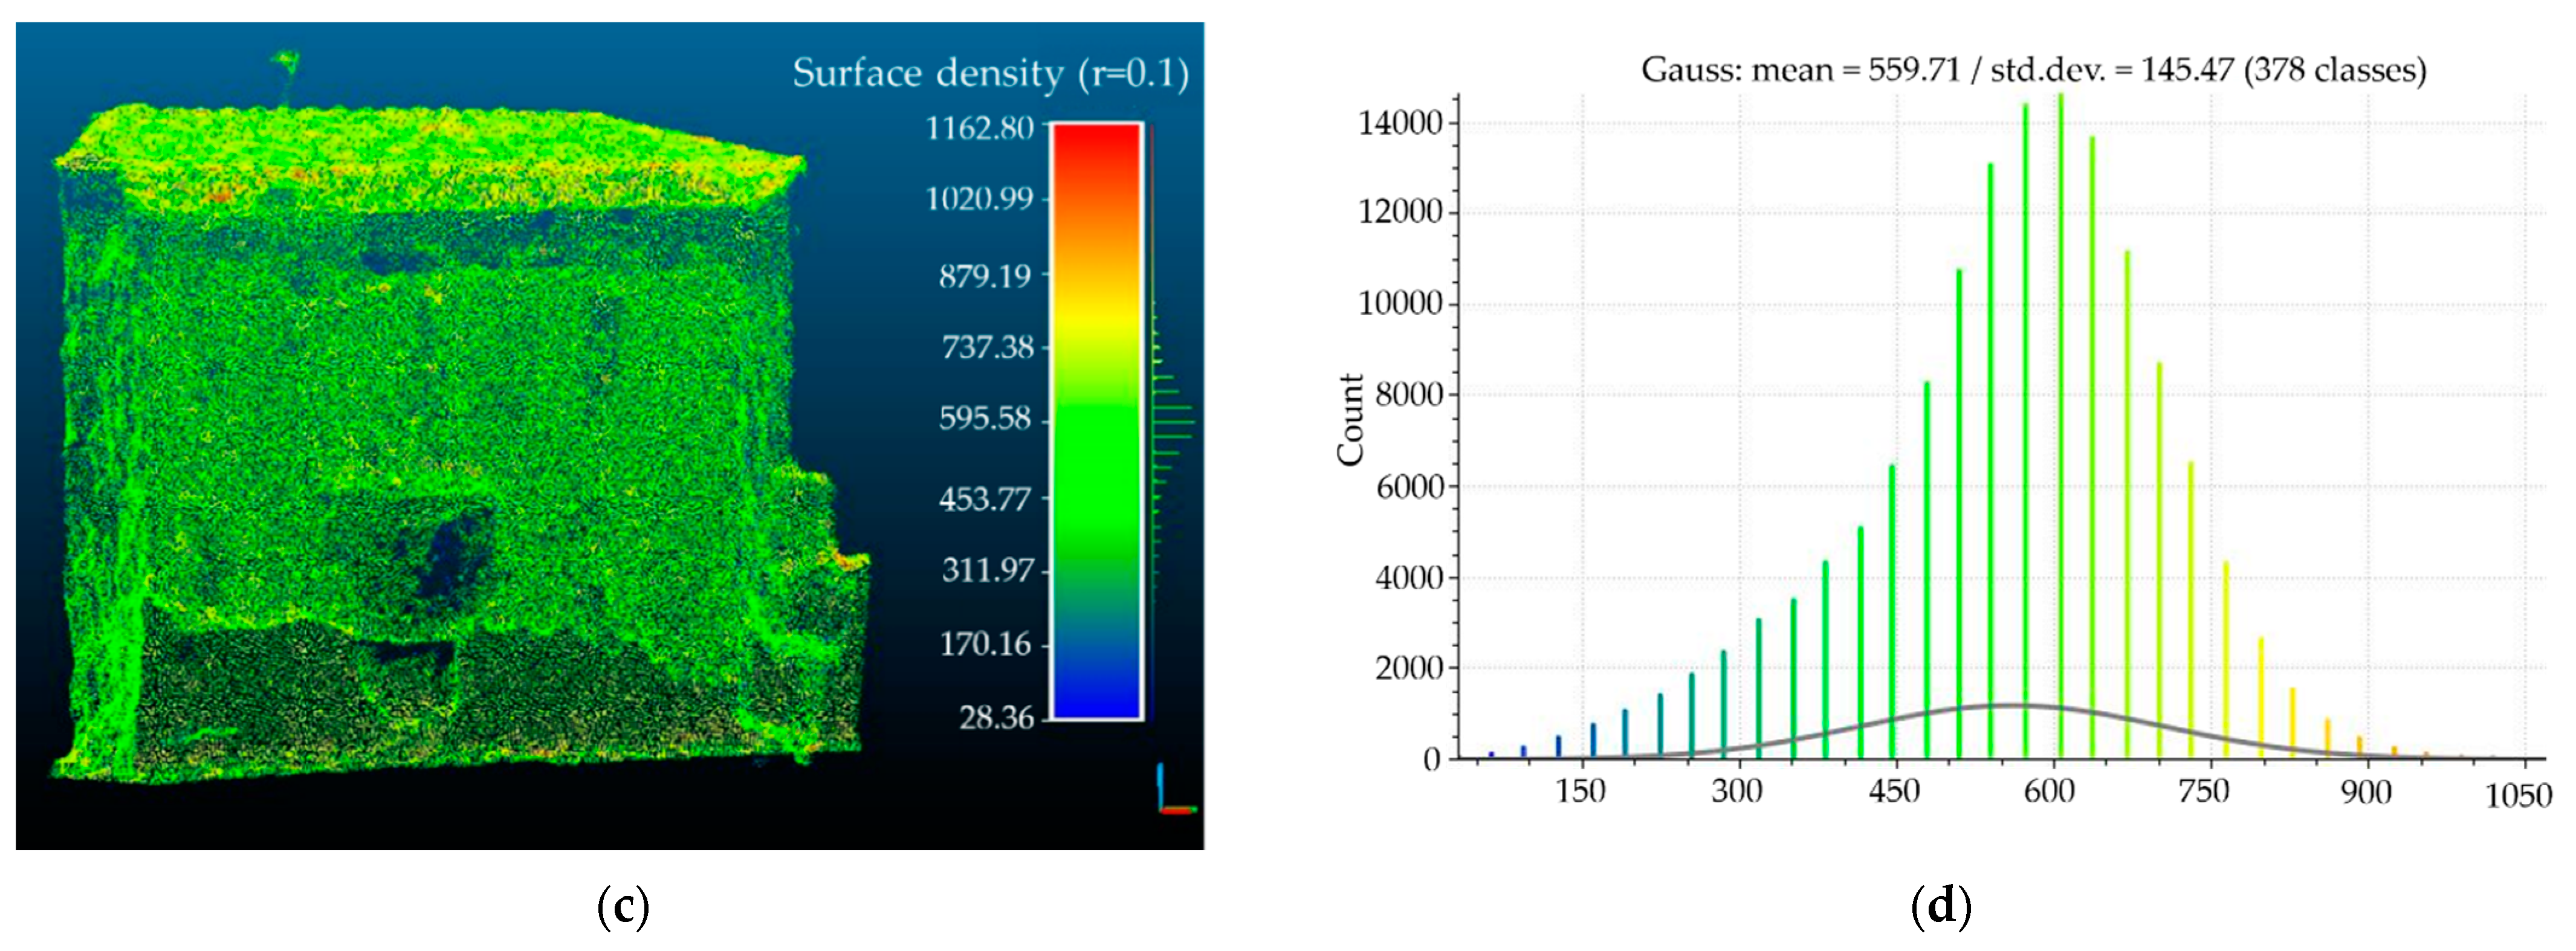
The results obtained from this process were 3D point clouds of the two buildings. Specifically, the point cloud of building A consists of 296522 points and building B consists of 142801 points. The density is estimated by counting for each point the number of neighbors N (inside a sphere of radius R). In our case, the surface density of point clouds for both buildings presents a normalized distribution. As shown in Figure 3b, the majority of building A points have a range of neighbors 1300–1900 (R = 0.1 m, mean = 1595) and the standard deviation is 249.89. For building B, most points have a range of neighbors 500–700 (R = 0.1 m, mean = 559) and the standard deviation is 145.47 (Figure 3d). Finally, in some smaller parts of the buildings, there are gaps in the areas which could not be covered by images (i.e., under the roofs, cornices and adjoining buildings).
2.2.3. Three-Dimensional Model Generation
There is a wide range of techniques and methods that lead to 3D modelling of urban structures. Three-dimensional modelling can be created automatically or manually, is a time-consuming process and can be performed with a modelling software. In this study, Trimble SketchUp Pro was selected because it is a user-friendly 3D modelling software and it can export the models to a various common 3D data formats such as 3Dstudio format (.3ds), SketchUp (.skp), Collada (.dae), KML (Keyhole Markup Language)/KMZ and VRML (.wrl) [53]. It is used for a wide range of applications, such as architectural and engineering design, and is more oriented to detailed 3D building design. It provides full ability for the design of entire buildings, both the outer and inner parts.
More specifically, SketchUp Pro 2020 was used for the design of the two 3D building models from their corresponding 3D point clouds. The modelling approach was conducted manually and requires some familiarity and time to produce a geometrically correct 3D building. Initially, a plug-in called “Trimble Scan Essentials” was installed for the import and manipulation of the point clouds and the models were digitized on the boundaries of each building point cloud. The point clouds used were dense enough and provided the ability for the accurate design of the dimensions (5–10 cm accuracy), size and shape of each building. Every part of the building was designed according to the entity it represents, such as walls, roof, etc. The modelling was carried out according to CityGML standards and each geometry was organized into layers referring to the specific thematic class. The thematic layer creation of each building’s semantic components was realized for LOD3 specifications and were WallSurface, RoofSurface, GroundSurface, Door and Window. The layers created were labelled as WallSurface1, WallSurface2, etc. for every building. Thus, two 3D building models were generated based on measurements of the 3D point clouds, concerning their geometry, accurate heights and dimensions (doors, windows) (Figure 4). Finally, the models were exported in “.3ds” and “.skp” formats for further processing.
2.2.4. CityGML Model
Real-world objects such as buildings may be decomposed into parts (rooms, wall surfaces, doors, windows, etc.) according to their usage or building part type. This information can be ontologically modelled in entities, attributes and relations and can be used by different users in several applications. For the transformation of the 3D models into the CityGML format, two different approaches were followed:
- FME Workbench module;
- CityEditor plug-in for immediate conversion at LOD3.
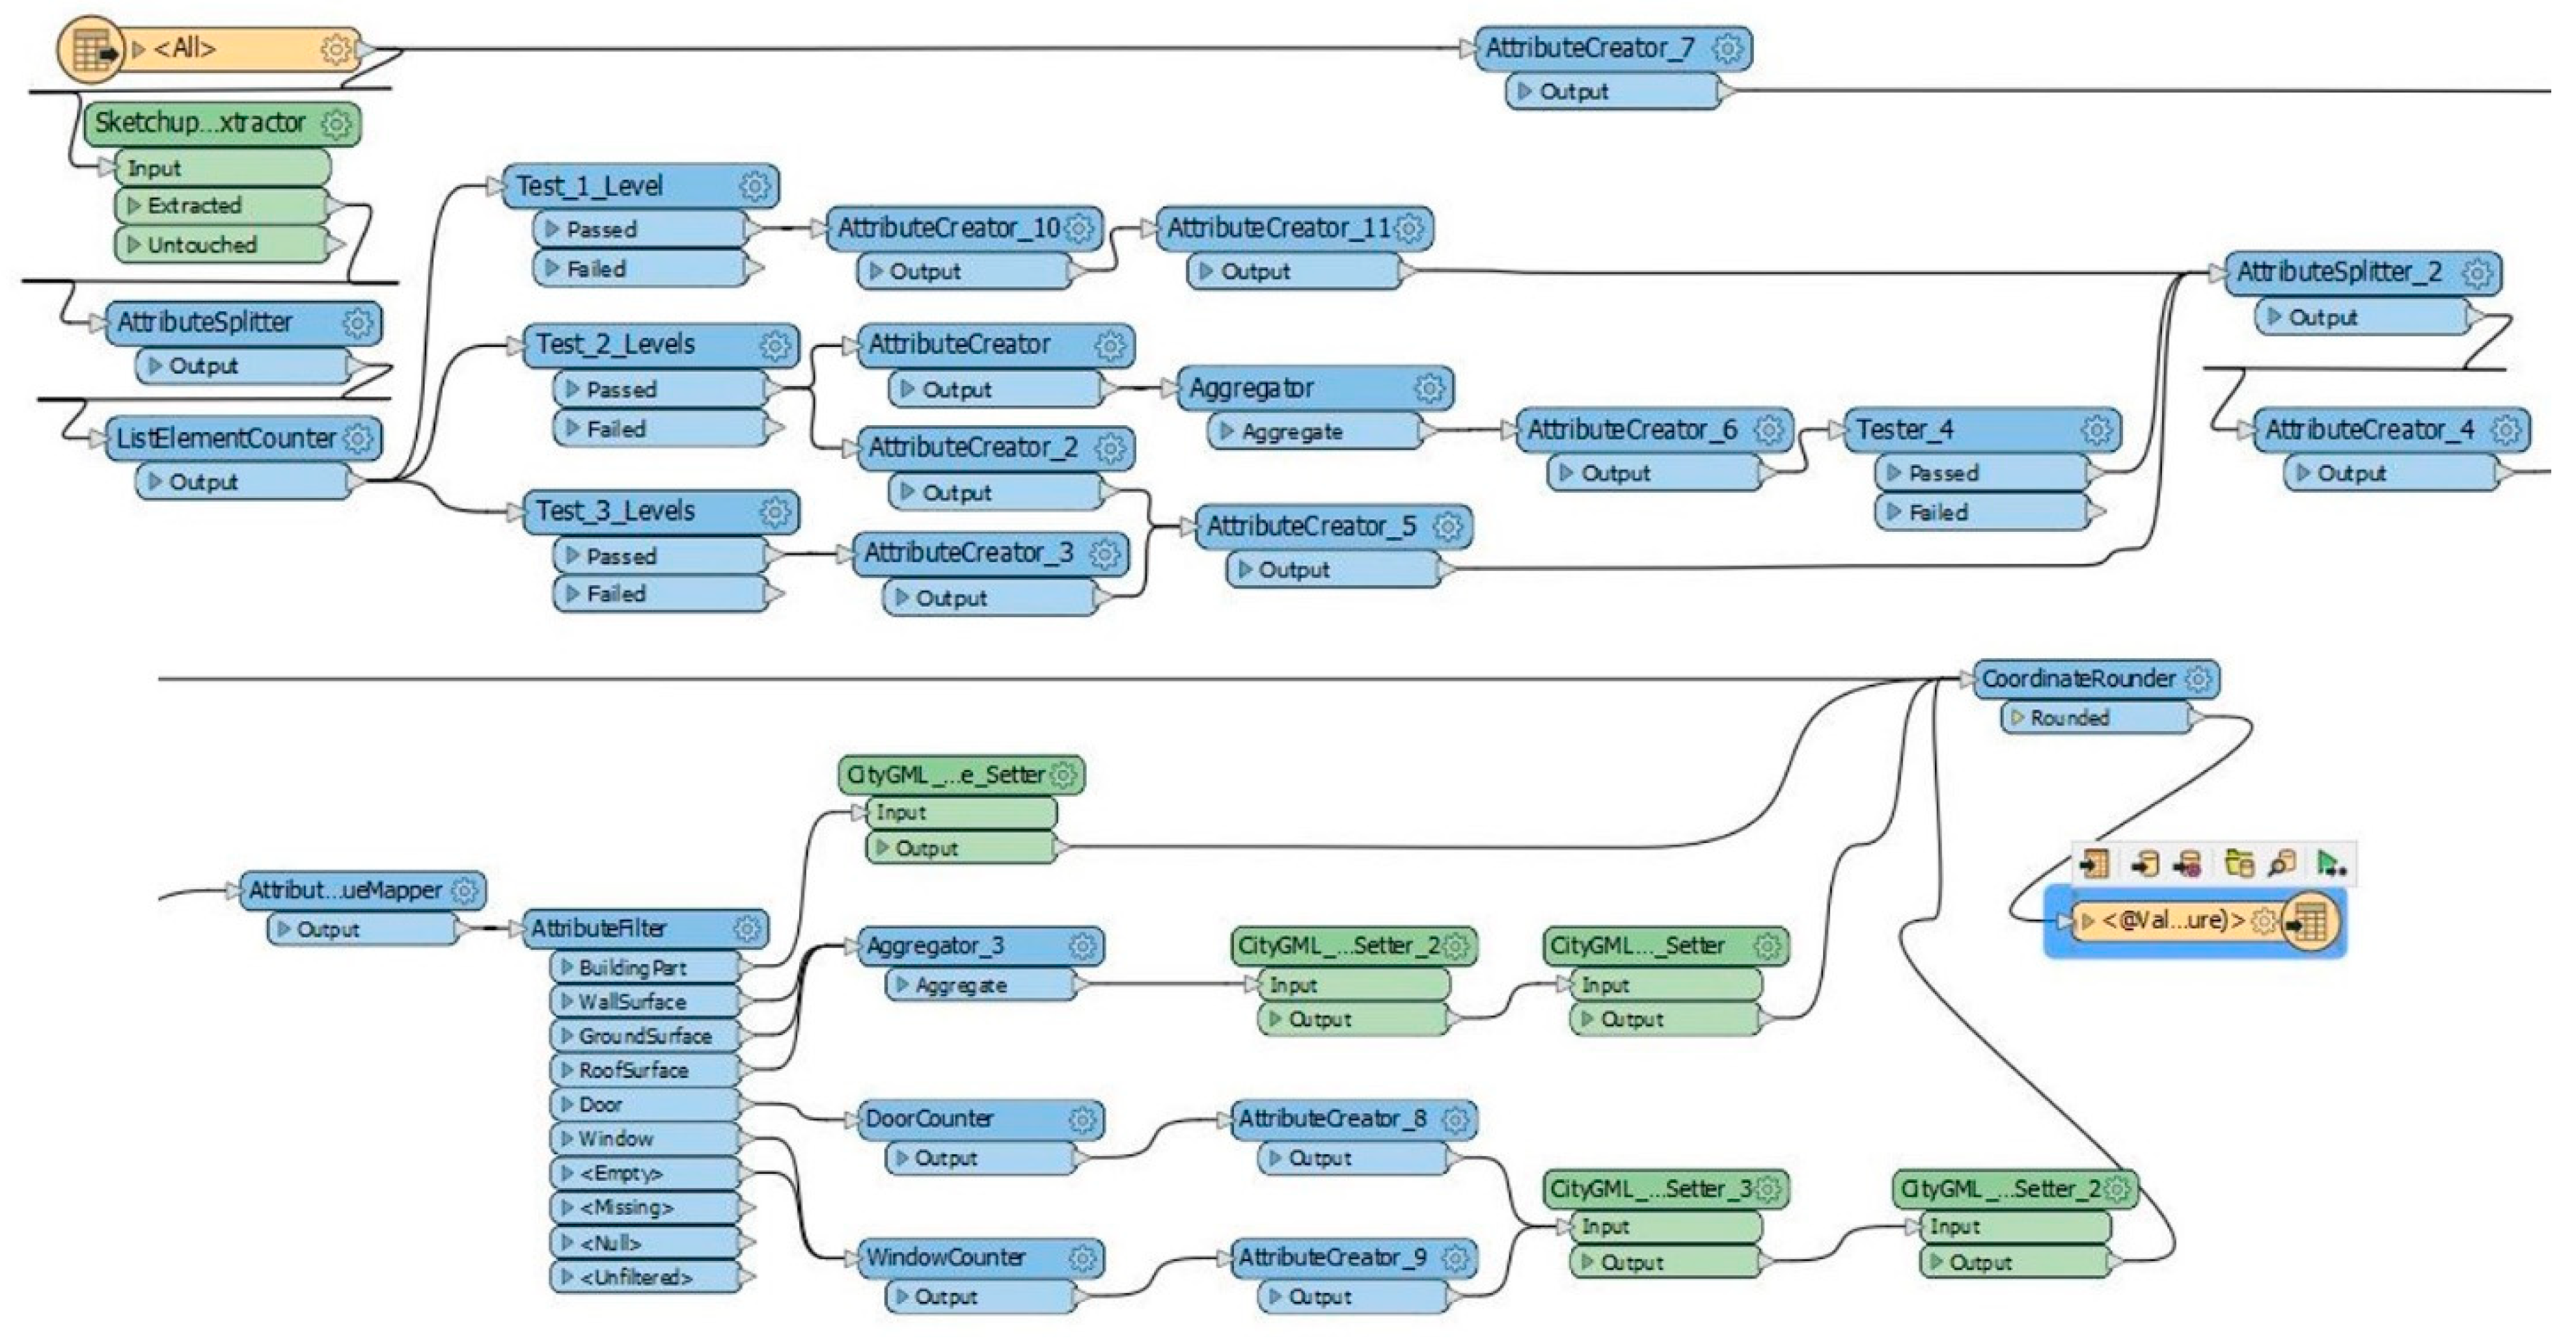
For the first approach, the FME by Safe Software [54] was used for the transformation of SketchUp models into the CityGML format. Thematic models prepared in SketchUp were exported in “.3ds” format to be processed in FME Workbench (Figure 5). FME Desktop 2021 supports several formats for interoperability, data conversion, transformation, integration and validation. Firstly, a SketchUp Reader was implemented for the CityGML LOD3 transformation. Subsequently, a “transformer” was used to restore the SketchUp layers and extract them based on the different layers by trait “SketchUp _layer_name”. Several transformers were used to perform some processes, such as converting a list of values into an FME list attribute, performing quality testing on data, creating new features and assigning unique IDs to generated features. Furthermore, the different categories of buildings that were separated were WallSurface, RoofSurface, GroundSurface, Door and Window. Afterwards, “lodMultiSurface”, “CityGMLGeometryType” and “CityGMLRole” were set. Finally, the CityGML LOD3 models for the buildings were obtained.
For the second approach, the “CityEditor” plugin of SketchUp was utilized to transform the 3D buildings of “.skp” format into the CityGML format. Every entity of a building must be classified to specific feature classes and the attributes of the buildings must be enriched. CityEditor allows the import of CityGML models, editing, and specifying the type of each designed surface (CityGML SurfaceType)—ground (GroundSurface), roof (RoofSurface) or wall (WallSurface)—for every level of detail. Finally, CityEditor exports the CityGML models with their attributes.
More specifically, for the semantic, topological and geometric translation into the CityGML format, each entity of the building was processed and each part of the building was grouped based on its thematic CityGML SurfaceType. Thus, walls were grouped in WallSurface, roofs in RoofSurface and grounds in GroundSurface, while doors and windows (openings) were categorized as GroupType. Subsequently, for every group type, the LOD value was declared as LOD3 and the geometry type such as lodMultiSurface. Additionally, the WallSurface, RoofSurface and GroundSurface for every model were defined as BoundarySurfaces, while each opening was defined as the Opening Boundary SurfaceType of its wall. Once this process was completed, all surfaces of each building were collected separately and defined as a building object accompanied by an ID code by selecting “Make Component”. As a result, when the CityGML format was exported, and each building was distinct and composed of its surfaces. The BoundarySurfaceType ID was assigned to both the wall opening and the wall itself and the rest of the surfaces were automatically settled. Then, the models were georeferenced via the GeoLocation tool by choosing four points of each model and entering the known coordinates (acquired from the corresponding point cloud) of the specific points, thereby georeferencing an entire model.
Semantic Enrichment of Seismic Building Damage
To enable the semantic enrichment of the CityGML models with the seismic damage suffered by the individual parts of the buildings, the ontology of seismic damage grades was created based on EMS-98 for masonry buildings. More specifically, this ontology includes the following categories of damage in the main parts of the building, which are the walls and the roof (Figure 6):
- Wall Damage Grade 1: Negligible to slight damage on walls with the following subclasses:
- 1.1 Hair-line cracks in very few walls.
- 1.2 Fall of small pieces of plaster only.
- 1.3 Fall of loose stones from upper parts of buildings in very few cases.
- Wall Damage Grade 2: Moderate damage on walls with the following subclasses:
- 2.1 Cracks in many walls.
- 2.2 Diagonal cracks in many walls.
- 2.3 Fall of fairly large pieces of plaster.
- Wall Damage Grade 3: Substantial to heavy damage on with the following subclasses:
- 3.1 Large and extensive cracks in most walls.
- 3.2 Diagonal large and extensive cracks in most walls.
- 3.3 Failure of individual non-structural elements (partitions, gable walls).
- Wall Damage Grade 4: Very heavy damage on walls with the following subclasses:
- 4.1 Serious failure of walls.
- 4.2 Loss of connection between external walls.
- Wall Damage Grade 5: Destruction of walls with the following subclasses:
- 5.1 Total collapse.
- 5.2 Near-total collapse.
- Roof Damage Grade 1: Negligible to slight damage on roofs with one subclass:
- 1.4 Fall of roof tiles.
- Roof Damage Grade 2: Moderate damage on roofs with one subclass:
- 2.4 Partial collapse of chimneys.
- Roof Damage Grade 3: Substantial to heavy damage on roofs with the following subclasses:
- 3.4 Roof tiles detach.
- 3.5 Chimneys fracture at the roofline.
- Roof Damage Grade 4: Very heavy damage on roofs with one subclass:
- 4.3 Partial structural failure of roofs.
- Roof Damage Grade 5: Destruction of roofs with the following subclasses:
- 5.1 Total collapse.
- 5.2 Near-total collapse.
In this study, a Unified Modelling Language (UML)-based approach was implemented. Geo-information objects can be defined by a UML class diagram with their properties, relationships and semantics providing sufficient means to record the meaning of objects [55].
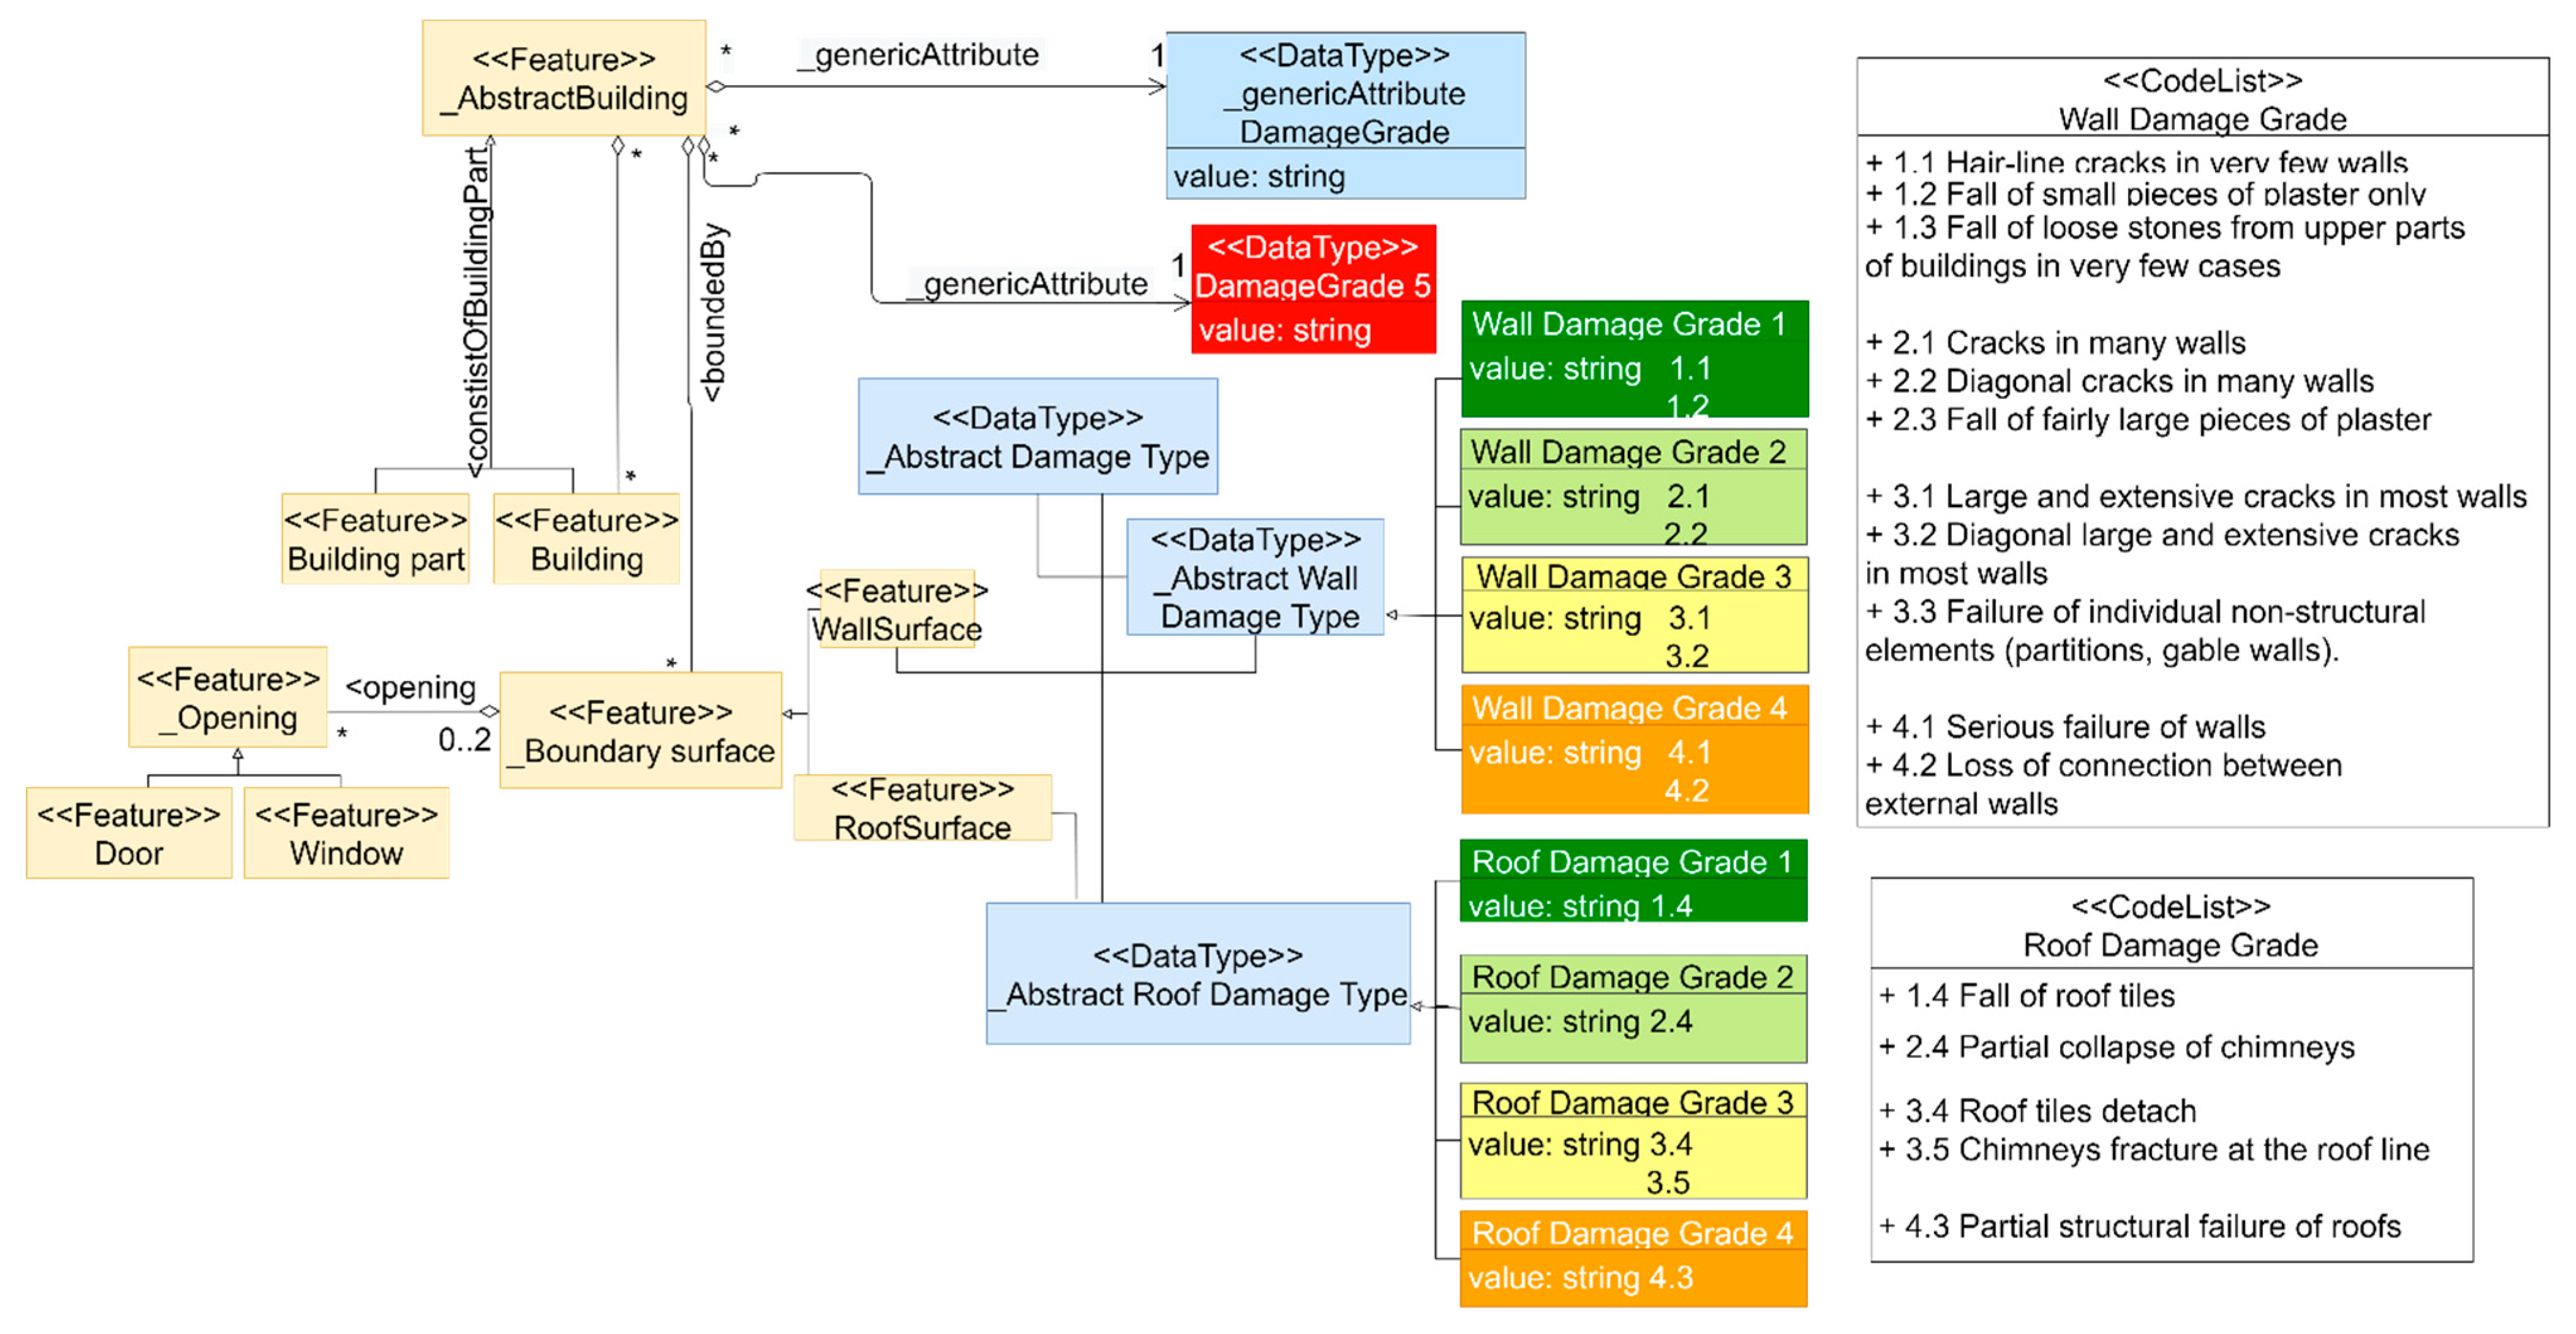
Figure 7 demonstrates a UML class diagram of the CityGML feature structure of basic semantic LOD3 building model. The basic class of the model of a building is AbstractBuilding, which consists of the two classes: Building and BuildingPart. A Building or BuildingPart is described by optional properties (function, use, class, year of construction and demolition, roof type, measured height, etc.) inherited from AbstractBuilding. Building and BuildingPart surfaces can be represented as semantic objects. BoundarySurface is the abstract superclass of these semantic objects and is further decomposed into thematic features, e.g., WallSurface and RoofSurface. Openings in BoundarySurface objects are represented by thematic objects such as doors and windows.
In CityGML, Generic is one of the thematic modules that enables a data model to be extended and consists of Generic City Object and Generic Attribute classes. A new object named DamageGrade was added as a Generic Attribute to integrate new attributes into the model. The data type of a new attribute inside Generic Attribute can be Integer, Double, URI, String. The DamageGrade is decomposed into five classes of grades according to EMS-98 and each of these classes is further classified into four Wall Damage Grades and Roof Damage Grades. Thus, the feature class of WallSurface contains one or more Wall Damage Grades and RoofSurface class contains Roof Damage Grades.
By utilizing this UML structure, we manually attributed every feature for each layer classified in SketchUp to enrich the seismic damage of the buildings.
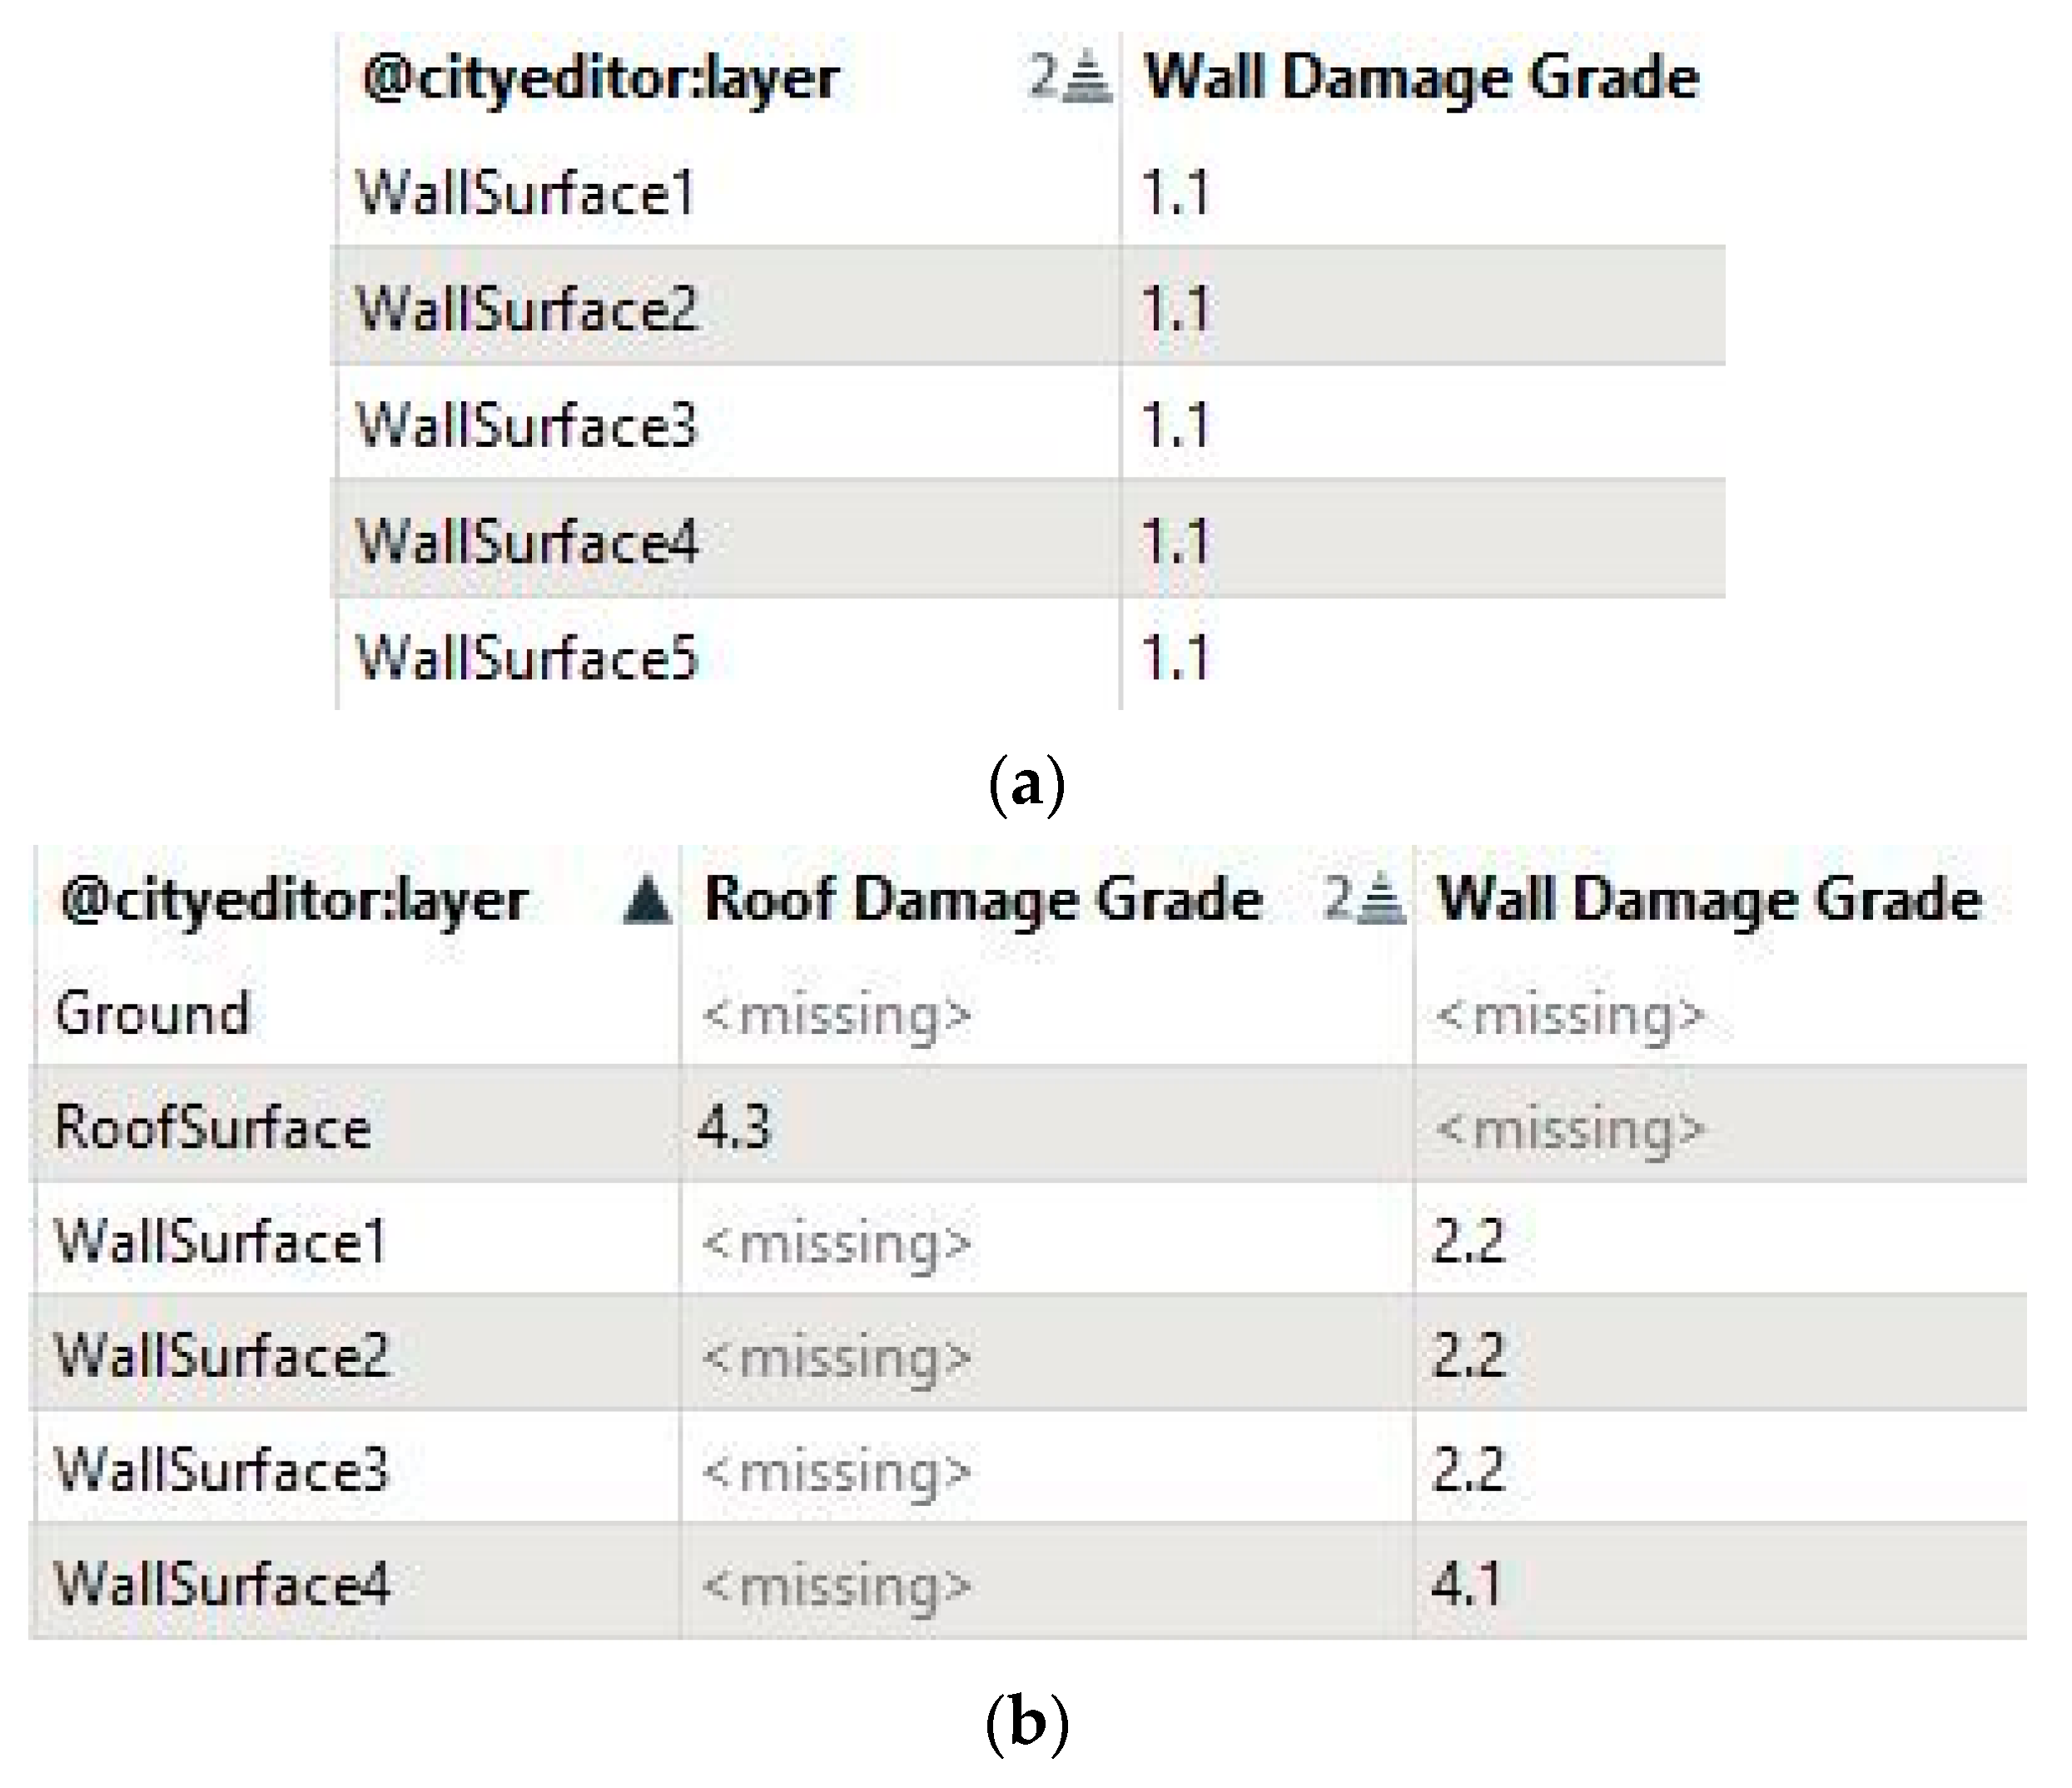
The next step is the enrichment of the attributes for each GroupType and this was executed with the CityEditor tools for displaying, editing, adding and deleting attributes. The attributes are subdivided into the categories Standard (CityGML-specific attributes) and Generic (generic attributes of various data types). Firstly, the standard attributes (model name, roof type, class, measure height and usage) were added. The usage of buildings A and B was ¨Café¨ and ¨Property¨, respectively. Both roof types consisted of ceramic roof tiles. Secondly, in the category of generic attributes, new fields were created for the semantic enrichment of the building’s seismic damage. At this stage, attribute fields named “Damage Grade” for the entire building, “Wall Damage Grade” for the walls and “Roof Damage Grade” for the roofs were created and the values were imported. The seismic damage was visually inspected from the point clouds of each building and the damage grades related to each building’s walls and roof were added according to EMS-98. In more detail, the damage of the buildings is reflected in 3D point clouds. The clouds present gaps which, depending on their size, refer to small or large detachments/collapses in parts of the masonry or the roof, while the existence of gaps with a linear arrangement, e.g., cracks, is due to cracks in the walls. Subsequently, for building A, all walls have cracks; thus, each wall was characterized with grade 1.1. (hair-line cracks in walls). Building B, as inspected from the point cloud, has a serious failure in the west wall, so “WallSurface 4” was characterized with grade 4.1. The rest of the walls have diagonal cracks; thus, each wall was characterized with grade 2.2. Additionally, the roof of building B was characterized with grade 4.3 (partial structural failure of roofs). Furthermore, building A was grouped in its entirety and characterized with Grade 1 (negligible to slight damage), while building B was characterized with Grade 4 (very heavy damage). The final models were exported in CityGML.
2.2.5. Three-Dimensional City Database Storage
For the storing, representation and management of the LOD3 CityGML building models, 3D City Database (3DCityDB) [56] was utilized. It is an open-source geodatabase on top of a spatial relational database management system such as PostgreSQL. The 3DCityDB schema implements the CityGML standard and supports five different LODs. The database includes rich semantics of objects, hierarchical structure and urban objects of different scales, which are not only used for visualization but also analysis tasks. A basic tool is the “3DCityDB-Importer-Exporter” for the connection and communication between the 3DCityDB and the PostgreSQL database, which provides full support for CityGML and can export models to CityGML and KML/COLLADA file types to enable the visualization of database elements in a wide range of applications. Furthermore, this tool is used to determine that the data correspond to the OGC standard CityGML 2.0.
In this research, “3DCityDB-Importer-Exporter” was used with the implementation of PostGIS. First, a new database was created in PostgreSQL with the help of its tool, pgAdmin 4, with the name “Vrisa_Buildings” using the “PostGIS” template, which is enhanced with PostGIS functions suitable for spatial data processing. Subsequently, the “Vrisa_Buildings” database structure was created based on the 3DCityDB template. More specifically, this process created 45 additional standard tables of different spatial entities in the existing database “Vrisa_Buildings” in the schema “public” according to the 3DCityDB standard. Following this, the database was enriched with all the necessary spatial and descriptive information regarding buildings A and B. Finally, the LOD3 CityGML building models were imported in the database through “3DCityDB-Importer” and the geometrical and topological information of the CityGML models were registered in the appropriate fields of the respective database tables.
3. Results
3.1. Three-Dimensional Building Point Clouds by Using UAS Images
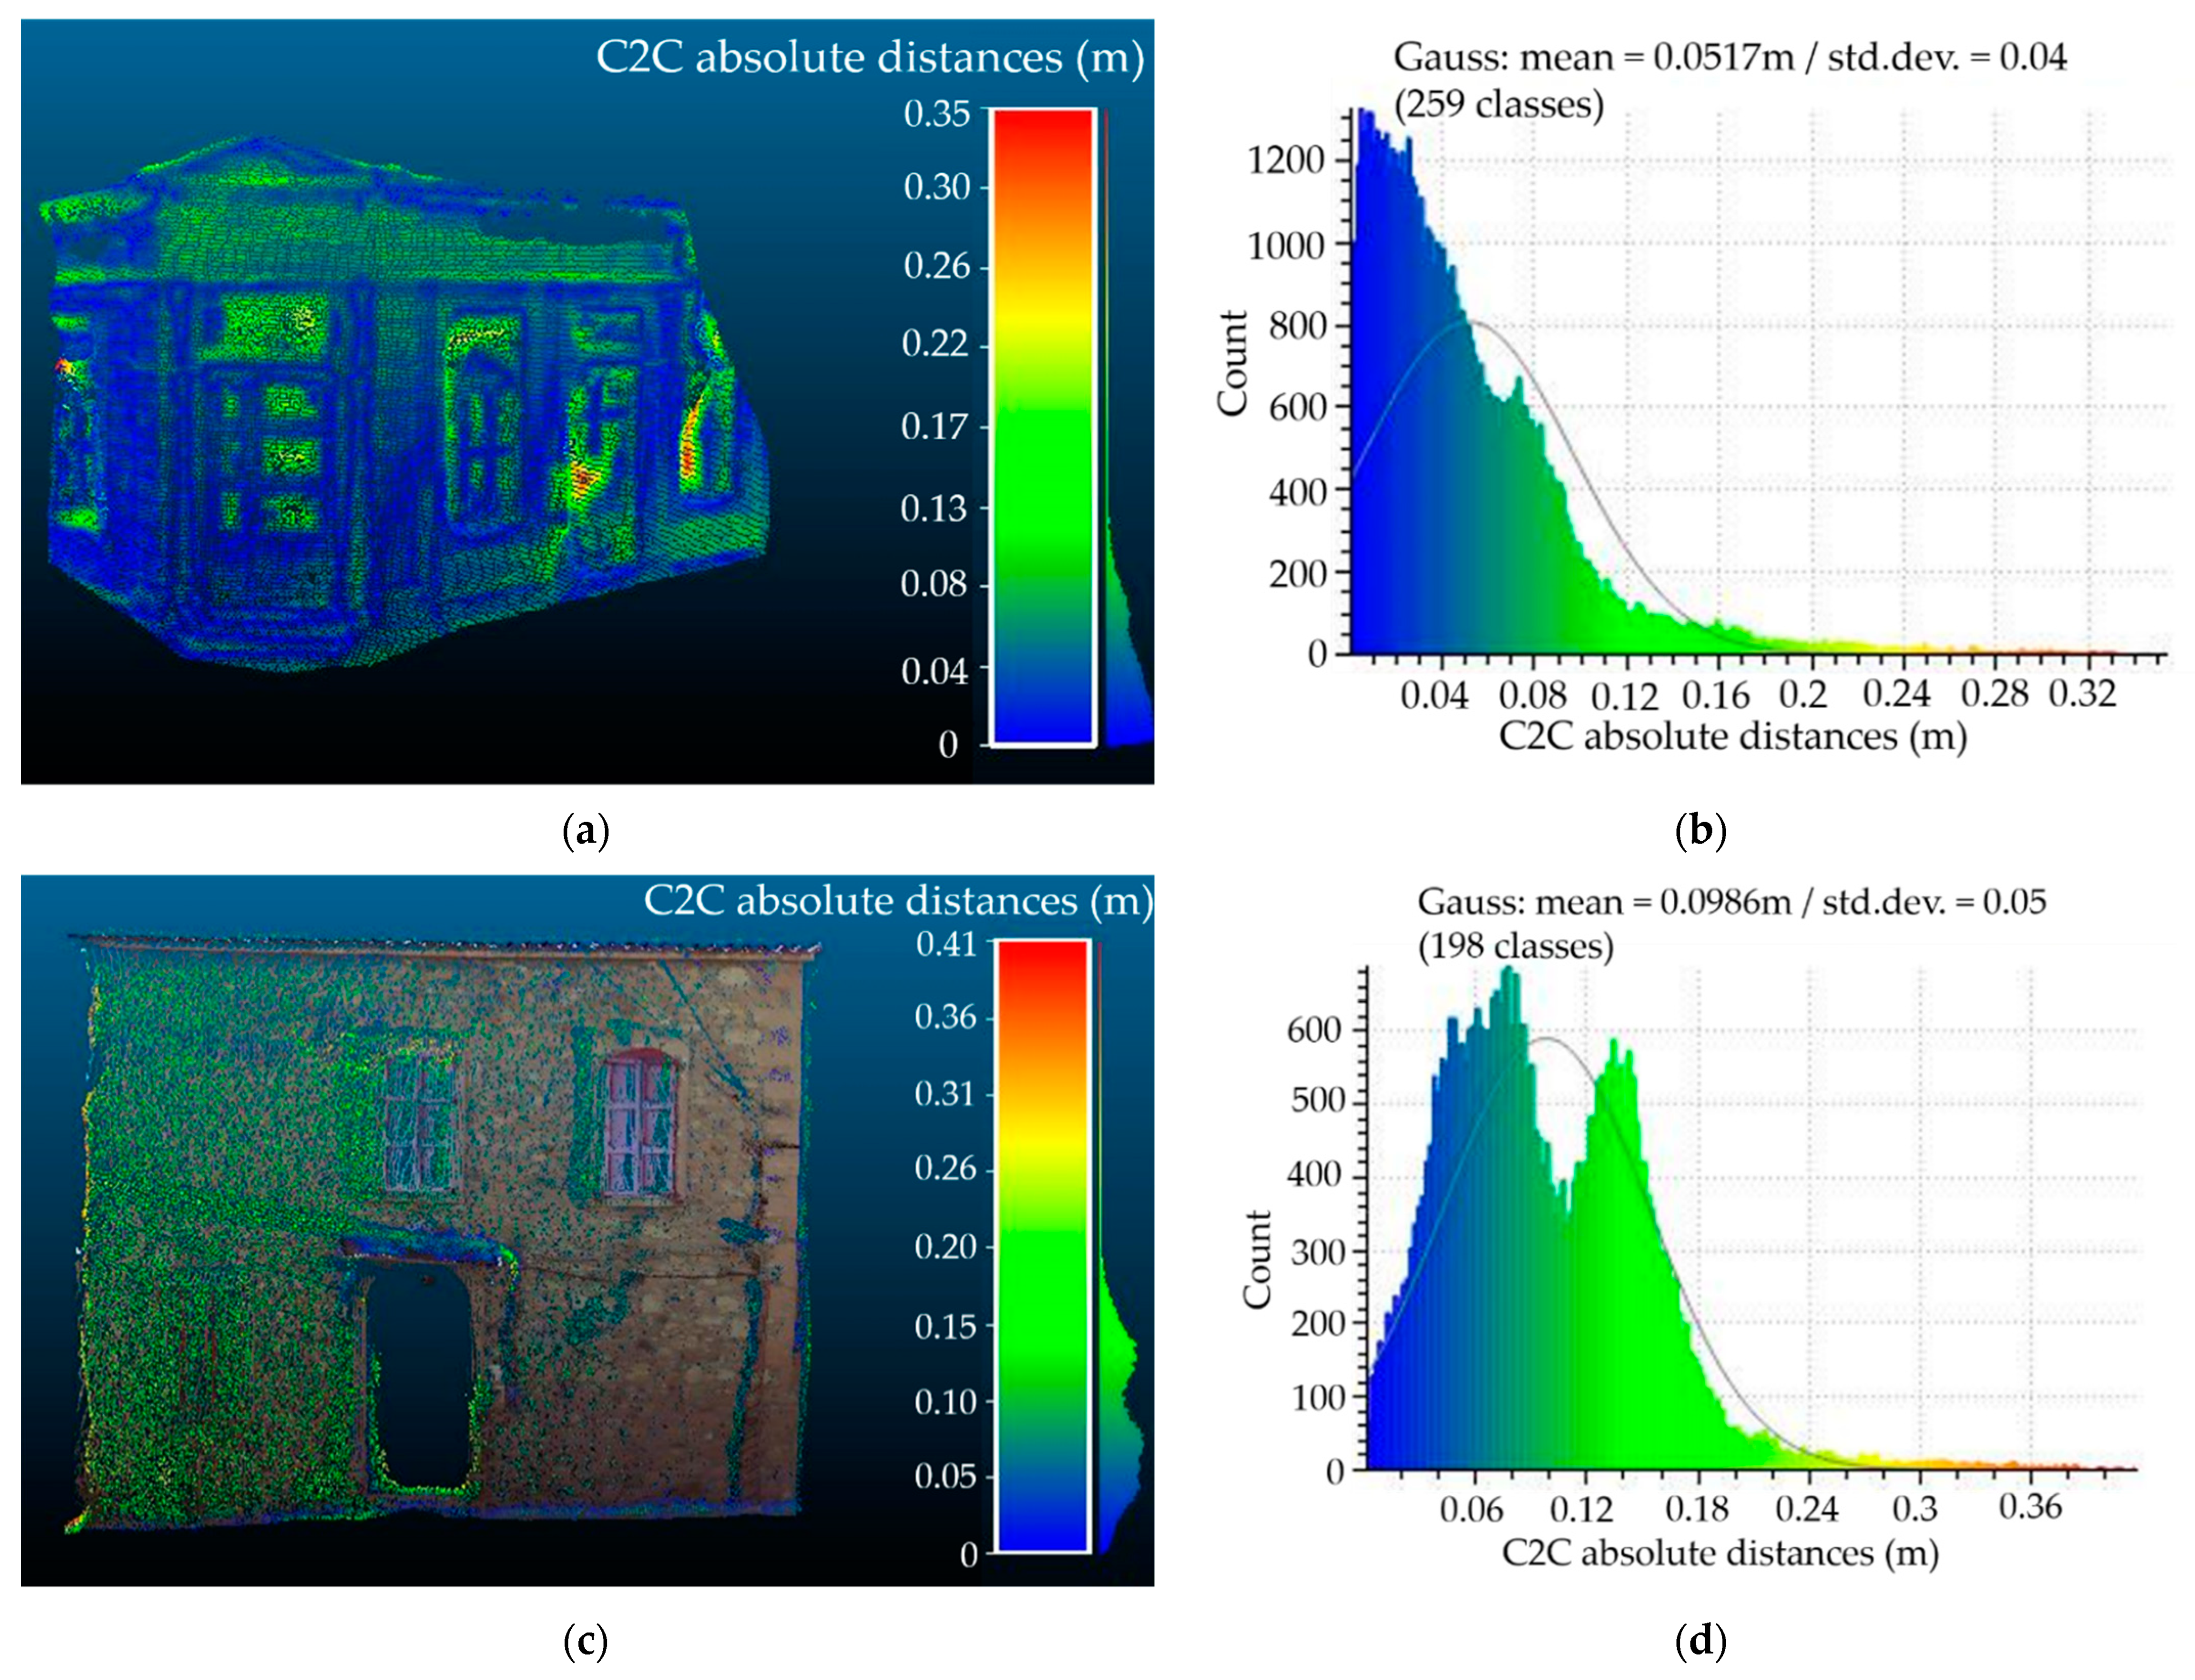
To generate the LOD3 models of the two buildings in the Vrisa settlement, UAS images with a GSD of 0.9 cm/pix were collected from a flight height of 30 m. These images were processed to produce 3D point clouds. The evaluation of the point clouds created by the processing of vertical and oblique images was conducted in comparison with the terrestrial laser scanner (TLS) point cloud. It was acquired by a survey performed with the use of the phase-shift laser scanner FARO Focus 3D, which took place from 13 June 2017 to 6 July 2017 [57]. Point clouds generated by TLS are the most reliable data source for checking the accuracy of UAS results [58]. The method cloud-to-cloud distance (CCD) is applied to compare clouds of the same geographical area that have occurred either at different times to monitor changes, or with different processing methods to evaluate the quality of their results. The most common way to calculate the distances between points from two clouds is the “nearest neighbor distance”. For each point in the comparative cloud, the method looks for the point closest to the reference cloud and calculates the Euclidean distance between them. If the reference point cloud is dense enough, then the approximation of the distance from the comparative cloud is acceptable. If the reference cloud is not dense enough, the distance to the nearest neighbor may sometimes not be accurate enough. Thus, a comparison of the point clouds in the selected two buildings was performed by applying the CCD method, using a reference cloud for the corresponding point cloud from TLS. The results of the comparisons show that the largest number of points of the cloud resulting from image processing are 5 cm for building A and 9 cm for building B, distances from the corresponding clouds of the TLS (Figure 8), which makes the methodology followed satisfactory and with reliable results.
3.2. LOD3 CityGML Models with the Semantic Enrichment of Seismic Damage
The LOD3 models of the buildings were successfully constructed using SketchUp based on 3D point cloud data. Three-dimensional geometries of the buildings digitized from point clouds are very accurate and correct. SketchUp Pro provides powerful tools and procedures, such as object snapping, grouping of features with similar attributes and interactive viewing (Section Plane) for cost and time efficiency, flexibility of use, accuracy in geometry and productivity. Features have been well organized into layers in SketchUp, while the CityEditor tool semi-automatically transformed the procedure of CityGML, saving time and avoiding geometrical incoherency at LOD3.
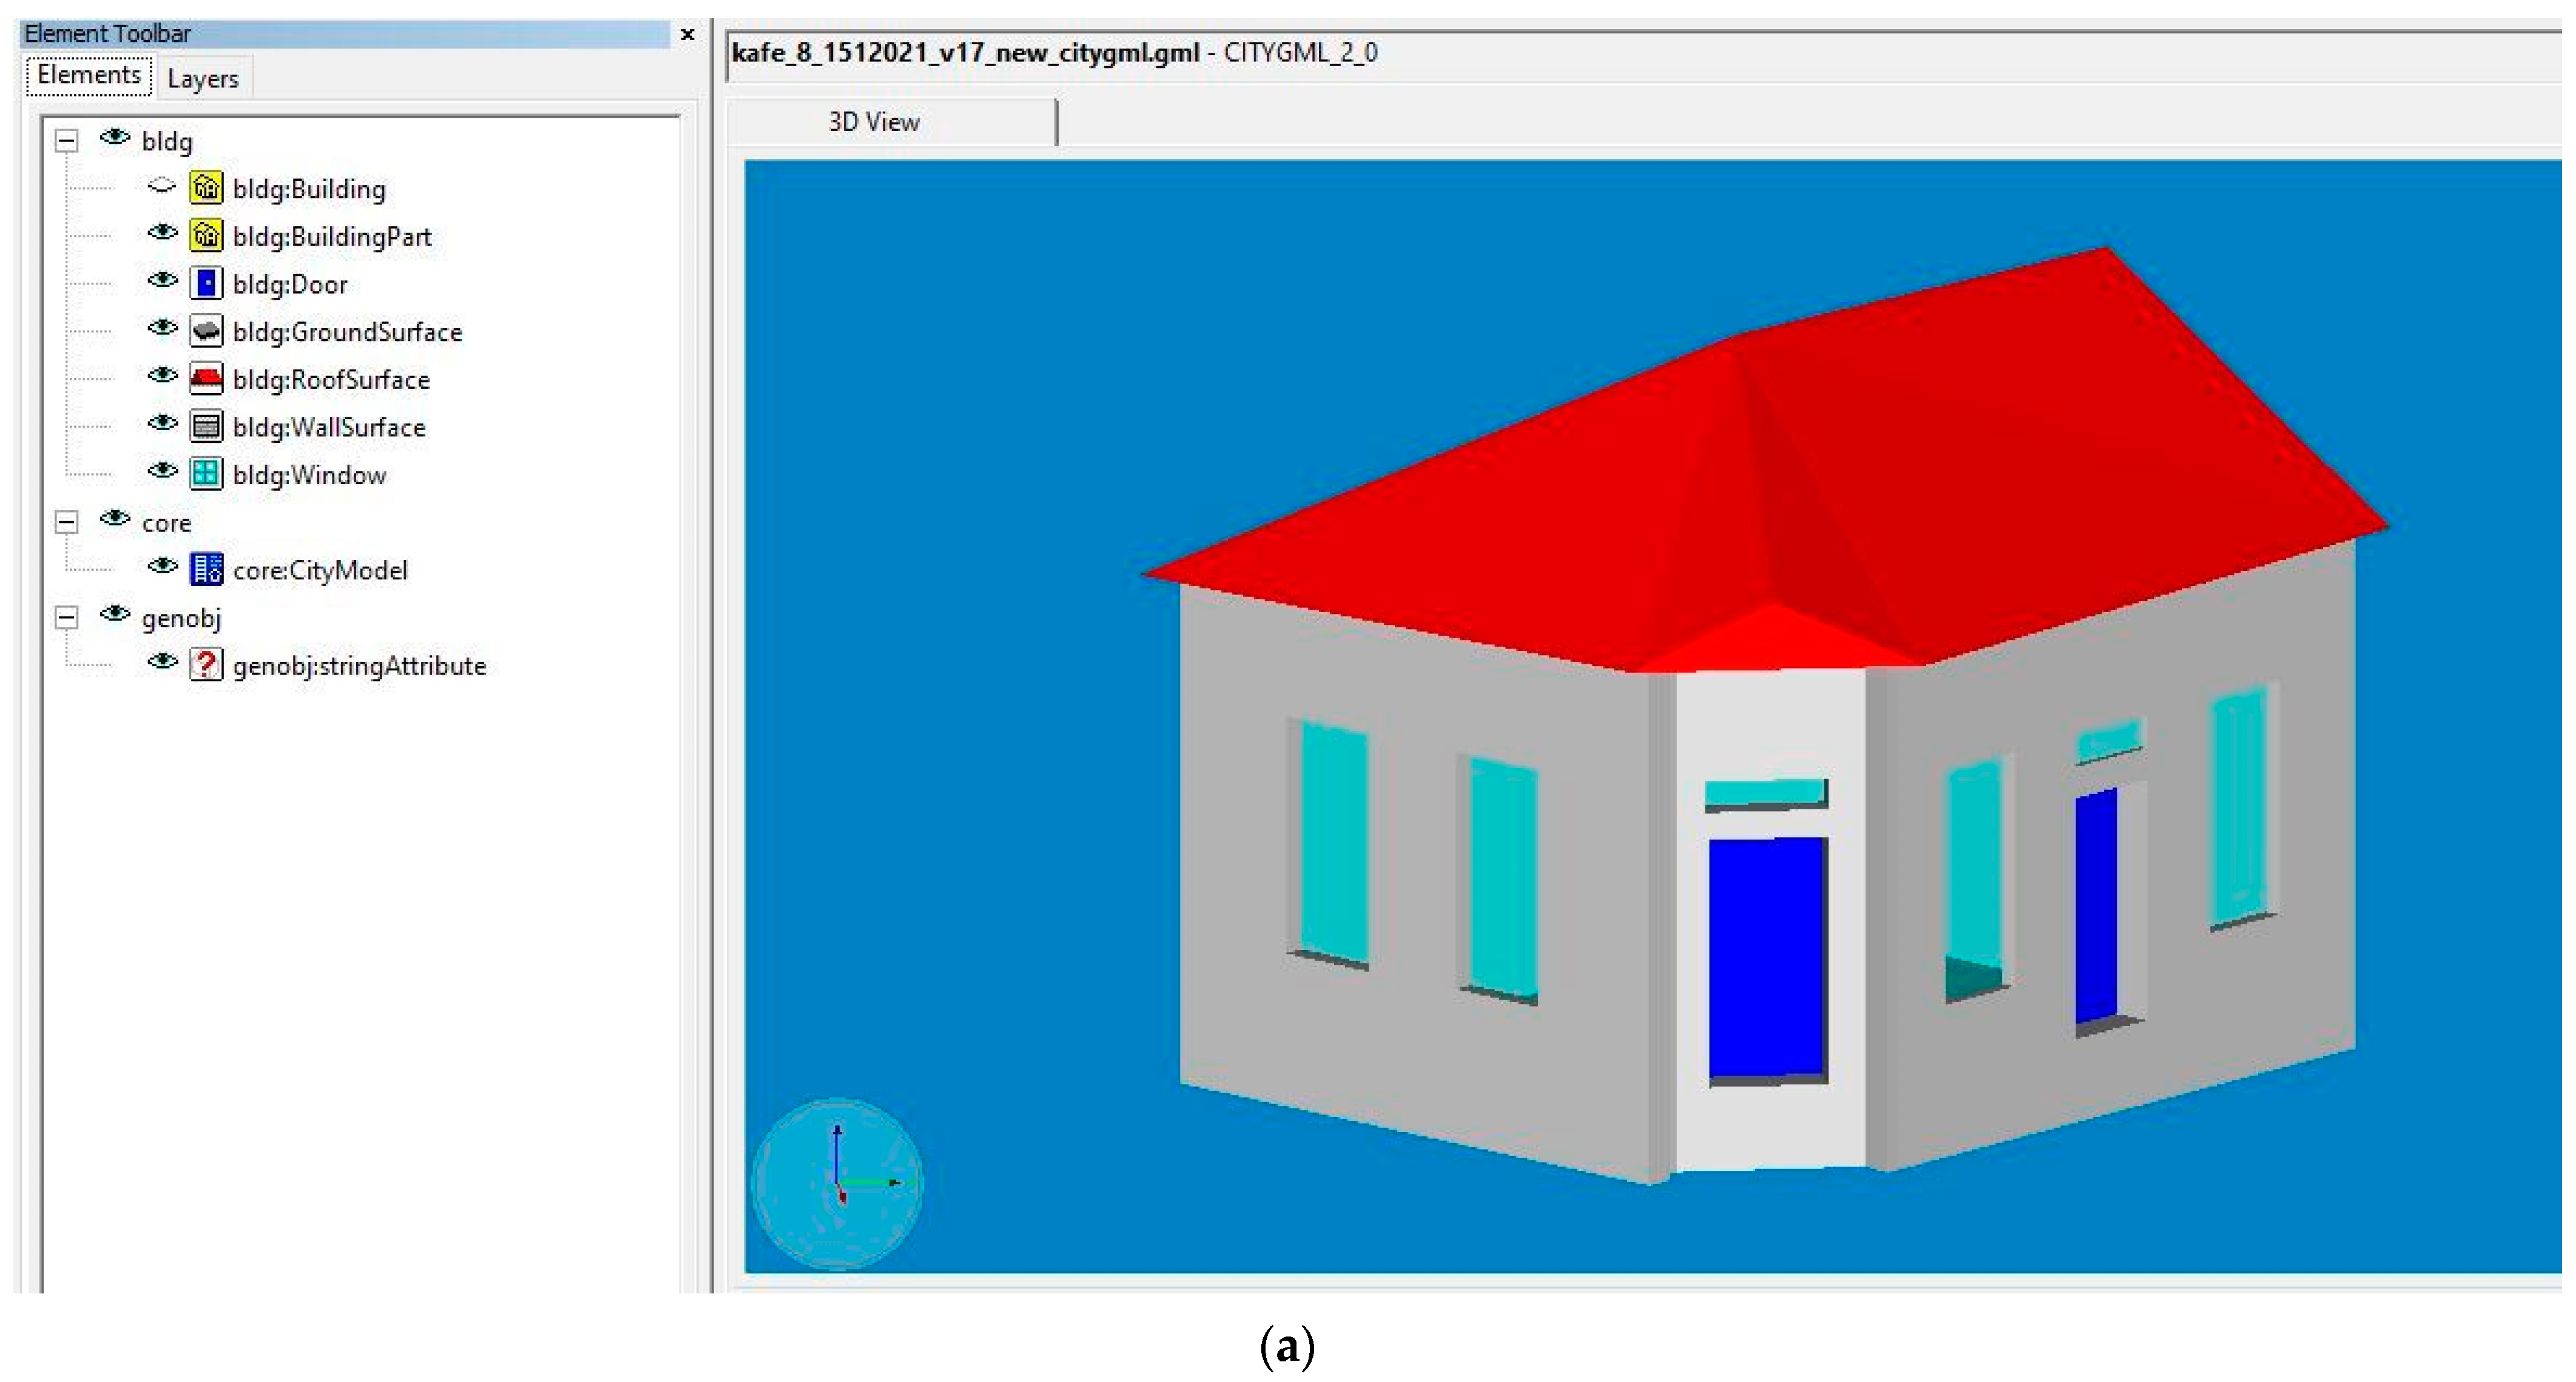
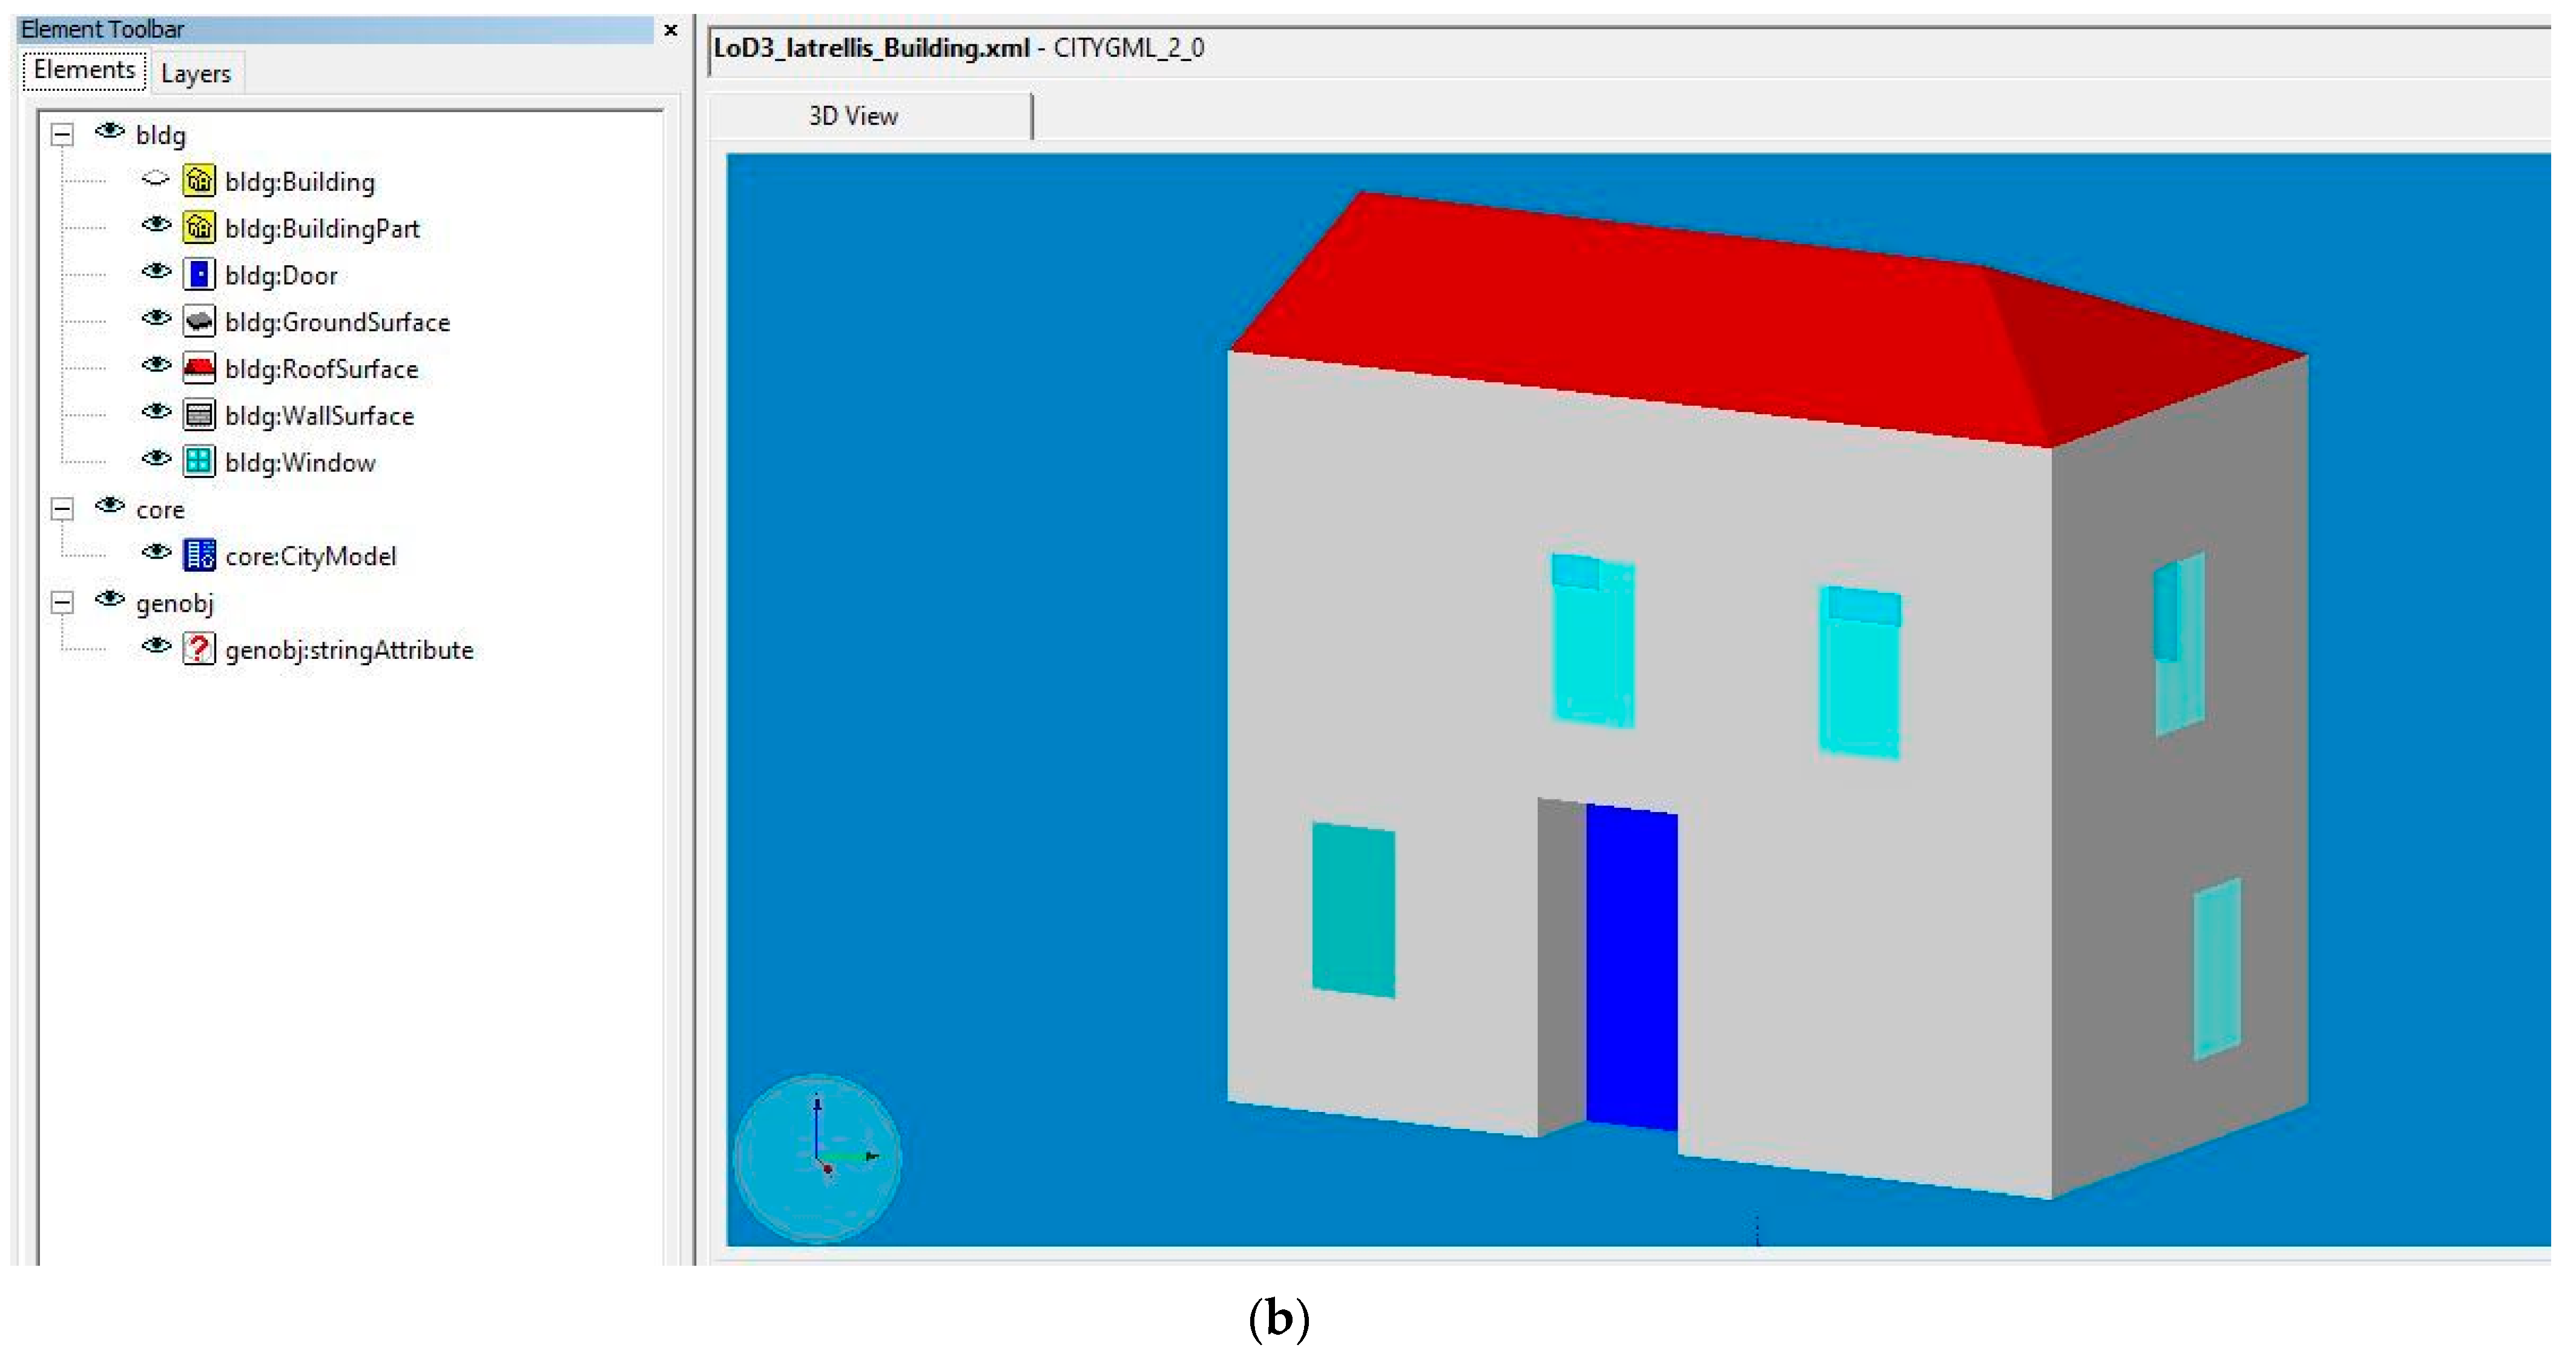
The building installation semantic component is stored in the BuildingInstallation element as lod3Geometry with GML: MultiSurface, GML: surfaceMember, GML: Polygon and GML: LinearRing as child elements. On similar lines, building surface bounding components such as WallSurface, RoofSurface and GroundSurface are stored as lod3MultiSurface geometries. The opening semantic components (Door and Window) of the building are also stored as lod3MultiSurface geometries with a hierarchy of GML: MultiSurface, GML: surfaceMember, GML: Polygon, GML: LinearRing and GML: posList as child elements inside bldg: opening parent element. The seismic damage was added for every part of the building affected by earthquake according to EMS-98. More specifically, for building A, all walls were characterized with grade 1.1, and for building B, one wall was characterized with grade 4.1 and the rest with grade 2.2. The roof of building B was characterized with grade 4.3 (Figure 9). Figure 10 includes the LOD3 CityGML building models with semantic layers rendered in FZK viewer, showing the summary of semantic features of buildings
4. Discussion
The objective of this study was the generation of LOD3 building models from 3D point clouds derived by the photogrammetric processing of UAS images, their transformation to CityGML and their enrichment with the seismic damage semantics. For this purpose, manual UAS flights were performed in low flight heights above and around two selected buildings to acquire high-resolution nadir and oblique images. From the present work, it appears that for the design of the 3D model of a traditional building, a minimum quantity of nadir/oblique images is required (less than 100 images) that can be achieved with a low-cost UAS, as well as in a short time (approximately 10 min.). In some rare cases encountered in the settlement, more images and longer flight times were required. The 3D modelling of the buildings depends on the geometrically accurate, complete and high-density 3D point clouds. The generation of the 3D point cloud from the images is a widely used and efficient computer vision method. Its processing time depends on the number of images and the available computing power used. Indicatively, the time required for building A was 1 h, and for building B 1 h and 20 min. As shown in the results, the point clouds produced after the SFM-MVS processing were found to be of high density and accurately represented (5–10 cm) all external components (e.g., roof, chimney, walls, doors, windows, etc.) and therefore can be used to create LOD3 models. In some cases, parts of the building that could not be captured in the photos created gaps in the point clouds. This problem was solved by creating 3D mesh where these gaps were filled. It is worth noting that, most of the time, manual flight is required due to the low flight height in a densely populated urban environment.
Subsequently, 3D modelling of the buildings was executed through Trimble SketchUp Pro by a drawing approach from 3D point clouds. More analytically, a drawing approach of the boundaries of the point clouds was selected, starting from the ground surface to roof surface. Three-dimensional modelling in LOD3 for buildings depends on various factors such as user experience, cloud density and building complexity (number of windows, doors, etc.). In particular, for building A, the roof was more complicated and needed more time to be modelled compared to the other parts of the building. Furthermore, the building consisted of five walls, four windows and two doors that required considerable time for modelling. The geometry of building B was regular; however, it consisted of 4 walls, 10 windows and 1 door. Hence, the same time was required for each building to be modelled (approximately 1 h). The point clouds obtained through UAS present a difficulty regarding the 3D design, as in some places there are gaps, bumps or they are sparser compared to the available TLS. Another issue worth noting is that it is difficult to design a building that has suffered severe damage (collapse of roof, walls, etc.) in 3D.
For the transformation of the 3D models into the CityGML format, two different approaches were used. The first approach was carried out through the FME software, which is a time-consuming process and requires familiarity with the manipulation of the data to be transformed into CityGML. The second approach was carried out through the CityEditor plug-in, which is easy to use and a less time-consuming process. Nevertheless, the advantage of the first approach is that it can lead to an automated process for the transformation of more than one building into the CityGML format compared to the second approach, which is a manual process for every building separately. The models were designed, layered and transformed into CityGML based on elements such as Wall, Ground, Roof, Window and Door. LOD3 buildings are graphically, geometrically and semantically represented. The geometric information is size, volume, shape and height, while non-geometric information is name, usage and damage grade data that can be read directly from the models.
Regarding the semantic enrichment of seismic building damage, the most difficult and time-consuming part was the classification of damage grades in every part of the buildings. The ontology structure of EMS-98 damage grades was based on the UML class diagram. Every part of each building is represented as a semantic object, where a new object named “DamageGrade” is added (subclassified in Wall Damage Grades and Roof Damage Grades) according to EMS-98. This approach is an attempt to automate the classification process of damage grades for masonry buildings for semantic modelling in CityGML LOD3. The semantic enrichment of seismic damage in the parts of the buildings was attributed via the CityEditor, based on 3D point clouds. The denser the point cloud, the more visible the damage, which leads to a faster enrichment of the parts of the buildings. Furthermore, major damage is more visible (damage grade 3 and above) in 3D point clouds, thus making their rendering process easier. However, smaller damage (such as cracks) can be seen in the acquired images, but their semantic enrichment is time-consuming. Specifically, building A had hair-line cracks in walls (damage grade 1) which were difficult to identify in the point cloud, in contrast with building B which had a serious failure of one wall (damage grade 4), cracks in the other walls (damage grade 2) and partial structural failure of the roof (damage grade 4). The overall assessment of the walls and roofs in terms of damage could be considered as contribution towards damage assessment and reconstruction based on spatio-semantic and damage characteristics of buildings. A disadvantage of the method is the fact that it does not indicate the exact location of damage on the surfaces (walls, roofs).
For future work, several potentials can be mentioned. Firstly, according to data used for the 3D modelling in LOD3, a fusion of 3D point clouds derived by TLS and UAS could produce more accurate and dense point clouds. However, this would mean a significant increase in cost and time for the data collection phase. On the contrary, the 3D modelling phase would be significantly improved concerning the time required because a denser 3D point cloud facilitates the process of 3D design for a detailed LOD3 building (more detailed doors, windows, etc.). Secondly, in the future, a more detailed description of seismic damage in a 3D environment could be realized (such as by using texture, etc.). The seismic damage semantics could also be extended to all other building categories beyond masonry. Finally, for the semantic seismic damages enrichment, the extension of the CityGML model could be implemented via the Dynamizer ADE (Application Domain Extension).
5. Conclusions
This paper presents a methodology that utilizes UAS data from low flight height (20m–30m) to accurately generate (5–10 cm accuracy) 3D point clouds suitable for 3D modelling of CityGML LOD3 building models affected by an earthquake with the enrichment of their seismic damage semantics. High-resolution nadir and oblique images were acquired and processed, and 3D point clouds of two seismically damaged buildings were produced. These 3D point clouds were used to generate LOD3 models of two buildings and subsequently, they were transformed into the CityGML standard. Finally, with the proposed method, the individual parts of the buildings were enriched with the semantics of seismic damage.
Depending on the external characteristics of the buildings, gaps in the point clouds are likely to appear, complicating the modelling process. Three-dimensional modelling of buildings with the use of 3D point clouds from low flight height UAS images is capable for the 3D design of buildings in LOD3 with semantic modelling according to the CityGML standard. The CityGML extension with the integration of seismic damage semantics in the individual parts of the buildings according to EMS-98 can be a new means of more efficient recording, visualization and analysis of the effects of an earthquake in a traditional settlement. This approach can be used as an expeditious method in the post-emergency phase of an earthquake and deliver CityGML LOD3 models enriched with seismic damage, which can assist in the decision-making process for the recovery phase of a settlement as well as be the basis for its monitoring over time. Finally, they can contribute to the estimation of the reconstruction cost of the buildings. The semantic modelling can be further extended to include seismic damage to the interior of buildings related to modelling at the LOD4 level.
Author Contributions
Conceptualization, Konstantinos Chaidas; Data curation, Konstantinos Chaidas, George Tataris and Nikolaos Soulakellis; Funding acquisition, Konstantinos Chaidas and George Tataris; Methodology, Konstantinos Chaidas, George Tataris and Nikolaos Soulakellis; Supervision, Nikolaos Soulakellis; Visualization, Konstantinos Chaidas; Writing—original draft, Konstantinos Chaidas; Writing—review & editing, Konstantinos Chaidas, George Tataris and Nikolaos Soulakellis. All authors have read and agreed to the published version of the manuscript.
Funding
This research is funded in the context of the project “Development of 3D semantic models in 3D mapping and geo-visualization of earthquake effects in a traditional settlement” (MIS 5047141) under the call for proposals “Supporting researchers with an emphasis on new researchers” (EDULLL 103). The project is co-financed by Greece and the European Union (European Social Fund-ESF) by the Operational Programme Human Resources Development, Education and Lifelong Learning 2014–2020.
Acknowledgments
The authors would like to thank Athanasios Chatzipoulios for the English language proofreading. We also thank the anonymous reviewers for their constructive suggestions and comments, which helped in improving the manuscript.
Conflicts of Interest
The authors declare no conflict of interest.
References
- Stadler, A.; Kolbe, T.H. Spatio-semantic coherence in the integration of 3D city models. In Proceedings of the 5th International ISPRS Symposium on Spatial Data Quality (ISSDQ), Enschede, The Netherlands, 13–15 June 2007. [Google Scholar]
- Gröger, G.; Kolbe, T.; Nagel, C.; Häfele, K.-H. OGC City Geography Markup Language (CityGML) En-coding Standard; Open Geospatial Constrium: Wayland, MA, USA, 2012. [Google Scholar]
- Biljecki, F.; Stoter, J.; Ledoux, H.; Zlatanova, S.; Çöltekin, A. Applications of 3D City Models: State of the Art Review. ISPRS Int. J. Geo-Inf. 2015, 4, 2842–2889. [Google Scholar] [CrossRef] [Green Version]
- Biljecki, F.; Ledoux, H.; Stoter, J. An improved LOD specification for 3D building models. Comput. Environ. Urban Syst. 2016, 59, 25–37. [Google Scholar] [CrossRef] [Green Version]
- Gerhard, G.; Kolbe, T.H.; Nagel, C.; Häfel, K.-H. OGC City Geography Markup Language (CityGML) Encoding Standard, Version 2.0, OGC. Available online: https://portal.opengeospatial.org/files/?artifact_id=47842 (accessed on 19 November 2020).
- Dimopoulou, E.; Tsiliakoua, E.; Kosti, V.; Floros, G.; Labropoulos, T. Investigating integration possibilities between 3D modeling techniques. In Proceedings of the 9th 3DGeoInfo Conference 2014-Proceedings, Dubai, United Arab Emerites, 11–13 November 2014. [Google Scholar]
- Kolbe, T.H.; Gröger, G.; Plümer, L. CityGML: Interoperable Access to 3D City Models. In Geo-Information for Disaster Management; Oosterom, P., Zlatanova, S., Fendel, E.M., Eds.; Springer: Berlin/Heidelberg, Germany, 2005; pp. 883–899. [Google Scholar]
- Kolbe, T.H. Representing and exchanging 3D city models with CityGML. In Lecture Notes in Geoinformation and Cartography; Lee, J., Zlatanova, S., Eds.; Springer: Berlin/Heidelberg, Germany, 2009; pp. 15–31. ISBN 9783540873945. [Google Scholar]
- Gröger, G.; Plümer, L. CityGML-Interoperable semantic 3D city models. ISPRS J. Photogramm. Remote Sens. 2012, 71, 12–33. [Google Scholar] [CrossRef]
- Biljecki, F.; Ledoux, H.; Stoter, J.; Zhao, J. Formalisation of the level of detail in 3D city modelling. Comput. Environ. Urban Syst. 2014, 48, 1–15. [Google Scholar] [CrossRef] [Green Version]
- Tang, L.; Ying, S.; Li, L.; Biljecki, F.; Zhu, H.; Zhu, Y.; Yang, F.; Su, F. An application-driven LOD modeling paradigm for 3D building models. ISPRS J. Photogramm. Remote Sens. 2020, 161, 194–207. [Google Scholar] [CrossRef]
- Khan, H.; Vasilescu, L.G.; Khan, A. Disaster Management Cycle–a Theoretical Approach. Manag. Mark. J. 2008, 6, 43–50. [Google Scholar]
- Kim, W.; Kerle, N.; Gerke, M. Mobile augmented reality in support of building damage and safety assessment. Nat. Hazards Earth Syst. Sci. 2016, 16, 287–298. [Google Scholar] [CrossRef] [Green Version]
- Kerle, N. Remote Sensing Based Post-Disaster Damage Mapping with Collaborative Methods. In Intelligent Systems for Crisis Management; Zlatanova, S., Peters, R., Dilo, A., Scholten, H., Eds.; Springer: Berlin/Heidelberg, Germany, 2013; pp. 121–133. ISBN 978-3-642-33217-3. [Google Scholar]
- Matsuoka, M.; Yamazaki, F. Use of satellite SAR intensity imagery for detecting building areas damaged due to earthquakes. Earthq. Spectra 2004, 20, 975–994. [Google Scholar] [CrossRef]
- Matsuoka, M.; Yamazaki, F. Building damage mapping of the 2003 Bam, Iran, earthquake using Envisat/ASAR intensity imagery. Earthq. Spectra 2005, 21, 1–5. [Google Scholar] [CrossRef]
- Brunner, D.; Lemoine, G.; Bruzzone, L. Earthquake Damage Assessment of Buildings Using VHR Optical and SAR Imagery. IEEE Trans. Geosci. Remote Sens. 2010, 48, 2403–2420. [Google Scholar] [CrossRef] [Green Version]
- Dong, L.; Shan, J. A comprehensive review of earthquake-induced building damage detection with remote sensing techniques. ISPRS J. Photogramm. Remote Sens. 2013, 84, 85–99. [Google Scholar] [CrossRef]
- Plank, S. Rapid Damage Assessment by Means of Multi-Temporal SAR—A Comprehensive Review and Outlook to Sentinel-1. Remote Sens. 2014, 6, 4870–4906. [Google Scholar] [CrossRef] [Green Version]
- Hajeb, M.; Karimzadeh, S.; Matsuoka, M. SAR and LIDAR datasets for building damage evaluation based on support vector machine and random forest algorithms—A case study of Kumamoto earthquake, Japan. Appl. Sci. 2020, 10, 8932. [Google Scholar] [CrossRef]
- Ghaffarian, S.; Kerle, N.; Pasolli, E.; Arsanjani, J.J. Post-disaster building database updating using automated deep learning: An integration of pre-disaster OpenStreetMap and multi-temporal satellite data. Remote Sens. 2019, 11, 2427. [Google Scholar] [CrossRef] [Green Version]
- Tilon, S.; Nex, F.; Kerle, N.; Vosselman, G. Post-disaster building damage detection from earth observation imagery using unsupervised and transferable anomaly detecting generative adversarial networks. Remote Sens. 2020, 12, 4193. [Google Scholar] [CrossRef]
- Huang, H.; Long, J.; Yi, W.; Yi, Q.; Zhang, G.; Lei, B. Method and application of using unmanned aerial vehicle for emergency investigation of single geo-hazard. Nat. Hazards Earth Syst. Sci. Discuss. 2017, 1–28. [Google Scholar] [CrossRef]
- Dominici, D.; Alicandro, M.; Massimi, V. UAV photogrammetry in the post-earthquake scenario: Case studies in L’Aquila. Geomat. Nat. Hazards Risk 2017, 8, 87–103. [Google Scholar] [CrossRef] [Green Version]
- Tu, J.; Li, D.; Feng, W.; Han, Q.; Sui, H. Detecting damaged building regions based on semantic scene change from multi-Temporal high-resolution remote sensing images. ISPRS Int. J. Geo-Inf. 2017, 6, 131. [Google Scholar] [CrossRef] [Green Version]
- Yamazaki, F.; Kubo, K.; Tanabe, R.; Liu, W. Damage assessment and 3d modeling by UAV flights after the 2016 Kumamoto, Japan earthquake. In Proceedings of the International Geoscience and Remote Sensing Symposium (IGARSS), Fort Worth, TX, USA, 23–28 July 2017; pp. 3182–3185. [Google Scholar]
- Calantropio, A.; Chiabrando, F.; Sammartano, G.; Spanò, A.; Teppati Losè, L. UAV strategies validation and remote sensing data for damage assessment in post-disaster scenarios. Int. Arch. Photogramm. Remote Sens. Spat. Inf. Sci 2018, 42, 121–128. [Google Scholar] [CrossRef] [Green Version]
- Soulakellis, N.; Vasilakos, C.; Chatzistamatis, S.; Kavroudakis, D.; Tataris, G.; Papadopoulou, E.-E.; Papakonstantinou, A.; Roussou, O.; Kontos, T. Post-Earthquake Recovery Phase Monitoring and Mapping Based on UAS Data. ISPRS Int. J. Geo Inf. 2020, 9, 447. [Google Scholar] [CrossRef]
- Xu, Z.; Yang, J.; Peng, C.; Wu, Y.; Jiang, X.; Li, R.; Zheng, Y.; Gao, Y.; Liu, S.; Tian, B. Development of an UAS for post-earthquake disaster surveying and its application in Ms7.0 Lushan Earthquake, Sichuan, China. Comput. Geosci. 2014, 68, 22–30. [Google Scholar] [CrossRef]
- Westoby, M.J.; Brasington, J.; Glasser, N.F.; Hambrey, M.J.; Reynolds, J.M. “Structure-from-Motion” photogrammetry: A low-cost, effective tool for geoscience applications. Geomorphology 2012, 179, 300–314. [Google Scholar] [CrossRef] [Green Version]
- Kerle, N.; Nex, F.; Gerke, M.; Duarte, D.; Vetrivel, A. UAV-Based Structural Damage Mapping: A Review. ISPRS Int. J. Geo-Inf. 2019, 9, 14. [Google Scholar] [CrossRef] [Green Version]
- Vetrivel, A.; Gerke, M.; Kerle, N.; Vosselman, G. Identification of damage in buildings based on gaps in 3D point clouds from very high resolution oblique airborne images. ISPRS J. Photogramm. Remote Sens. 2015, 105, 61–78. [Google Scholar] [CrossRef]
- Grünthal, G. (Ed.) European Macroseismic Scale 1998; European Center for Geodynamics and Seismology: Walferdange, Luxembourg, 1998; Volume 15, ISBN 2879770084. [Google Scholar]
- Redweik, P.; Costa, P.T.; Boas, I.V.; Santos, T. Seismic Vulnerability Analysis in 3D City Models (3DCM). In Proceedings of the ICUR 2016-The International Conference on Urban Risks, Lisbon, Portugal, 30 June–2 July 2016; pp. 409–416. [Google Scholar]
- Shen, Y.; Wu, L.; Li, Z.; Li, X. 3D visualization of seismic buildings in Yushu earthquake for disaster management. In Proceedings of the 2010 International Conference on Multimedia Technology, ICMT 2010, Ningbo, China, 29–31 October 2010. [Google Scholar]
- Yamazaki, F.; Matsuda, T.; Denda, S.; Liu, W. Construction of 3D models of buildings damaged by earthquakes using UAV aerial images. In Proceedings of the Tenth Pacific Conference on Earthquake Engineering Building an Earthquake-Resilient Pacific, Sydney, Australia, 6–8 November 2015. [Google Scholar]
- Achille, C.; Adami, A.; Chiarini, S.; Cremonesi, S.; Fassi, F.; Fregonese, L.; Taffurelli, L. UAV-based photogrammetry and integrated technologies for architectural applications—methodological strategies for the after-quake survey of vertical structures in Mantua (Italy). Sensors 2015, 15, 15520–15539. [Google Scholar] [CrossRef] [PubMed] [Green Version]
- Chiabrando, F.; Di Lolli, A.; Patrucco, G.; Spanò, A.; Sammartano, G.; Teppati Losè, L. Multitemporal 3D modelling for cultural heritage emergency during seismic events: Damage assesment of s. Agostino church in Amatrice (RI). In Proceedings of the ISPRS-International Archives of the Photogrammetry, Remote Sensing and Spatial Information Sciences, Florence, Italy, 22–24 May 2017; Volume XLII-5/W1, pp. 69–76. [Google Scholar]
- Poli, D.; Moe, K.; Legat, K.; Toschi, I.; Lago, F.; Remondino, F. Use of vertical aerial images for semi-oblique mapping. In Proceedings of the ISPRS-International Archives of the Photogrammetry, Remote Sensing and Spatial Information Sciences, Hannover, Germany, 6–9 June 2017; Volume XLII-1/W1, pp. 493–498. [Google Scholar]
- Redweik, P.; Teves-Costa, P.; Vilas-Boas, I.; Santos, T. 3D City Models as a Visual Support Tool for the Analysis of Buildings Seismic Vulnerability: The Case of Lisbon. Int. J. Disaster Risk Sci. 2017, 8, 308–325. [Google Scholar] [CrossRef] [Green Version]
- Colucci, E.; de Ruvo, V.; Lingua, A.; Matrone, F.; Rizzo, G. HBIM-GIS integration: From IFC to cityGML standard for damaged cultural heritage in a multiscale 3D GIS. Appl. Sci. 2020, 10, 1356. [Google Scholar] [CrossRef] [Green Version]
- Wen, X.; Xie, H.; Liu, H.; Yan, L. Accurate Reconstruction of the LoD3 Building Model by Integrating Multi-Source Point Clouds and Oblique Remote Sensing Imagery. ISPRS Int. J. Geo-Inf. 2019, 8, 135. [Google Scholar] [CrossRef] [Green Version]
- Soon, K.H.; Khoo, V.H.S. CityGML modelling for Singapore 3D national mapping. In Proceedings of the ISPRS-International Archives of the Photogrammetry, Remote Sensing and Spatial Information Sciences, Melbourne, Australia, 26–27 October 2017; Volume XLII-4/W7, pp. 37–42. [Google Scholar]
- Akmalia, R.; Setan, H.; Majid, Z.; Suwardhi, D.; Chong, A. TLS for Generating Multi-LOD of 3D Building Model; IOP Conference Series: Earth and Environmental Science; IOP Publishing: Bristol, UK, 2014; Volume 18. [Google Scholar]
- Prieto, I.; Izkara, J.L.; Delgado, F.J. From point cloud to web 3D through CityGML. In Proceedings of the 2012 18th International Conference on Virtual Systems and Multimedia, Milan, Italy, 2–5 September 2012; IEEE: Milan, Italy, 2012; pp. 405–412. [Google Scholar]
- Gruen, A.; Schubiger, S.; Qin, R.; Schrotter, G.; Xiong, B.; Li, J.; Ling, X.; Xiao, C.; Yao, S.; Nuesch, F. Semantically enriched high resolution LoD 3 building model generation. In Proceedings of the International Archives of the Photogrammetry, Remote Sensing and Spatial Information Sciences-ISPRS Archives, Singapore, 24–27 September 2019; Volume 42, pp. 11–18. [Google Scholar]
- Malihi, S.; Valadan Zoej, M.J.; Hahn, M.; Mokhtarzade, M.; Arefi, H. 3D Building Reconstruction Using Dense Photogrammetric Point Cloud. In Proceedings of the ISPRS-International Archives of the Photogrammetry, Remote Sensing and Spatial Information Sciences, Prague, Czech Republic, 12–19 July 2016; Volume XLI-B3, pp. 71–74. [Google Scholar]
- Saran, S.; Wate, P.; Srivastav, S.K.; Krishna Murthy, Y.V.N. CityGML at semantic level for urban energy conservation strategies. Ann. GIS 2015, 21, 27–41. [Google Scholar] [CrossRef]
- Chaidas, K.; Tataris, G.; Soulakellis, N. Post-earthquake 3D building model (LOD2) generation from UAS imagery: The case of Vrisa traditional settlement, Lesvos, Greece. In Proceedings of the ISPRS-International Archives of the Photogrammetry, Remote Sensing and Spatial Information Sciences, Safranbolu, Turkey, 7–8 October 2020; Volume XLIV-4/W3-, pp. 165–172. [Google Scholar]
- Tataris, G.; Soulakellis, N.; Chaidas, K. Multitemporal 3D mapping of post-earthquake recovery phase with UAS: Case study Vrisa, lesvos, Greece. In Proceedings of the ISPRS Annals of Photogrammetry, Remote Sensing and Spatial Information Sciences, Sydney, Australia, 30 November–3 December 2020; Volume VI-3/W1-20, pp. 123–130. [Google Scholar]
- Post Earthquake Damage and Usability Assessment of Buildings: Further Development and Applications. Final report. European Commission—D.G. Environment, Civil Protection—EPPO. Available online: http://ec.europa.eu/echo/files/civil_protection/civil/act_prog_rep/peadab.pdf (accessed on 21 March 2021).
- Agisoft Agisoft Metashape User Manual. Available online: https://www.agisoft.com/ (accessed on 4 February 2021).
- Google SketchUp 3D Design Software 3D Modeling on the Web SketchUp. Available online: https://www.sketchup.com (accessed on 19 January 2021).
- Safe Software|FME|Data Integration Platform. Available online: https://www.safe.com/ (accessed on 24 January 2021).
- Van den Brink, L.; Stoter, J.; Zlatanova, S. UML-based approach to developing a citygml application domain extension. Trans. GIS 2013, 17, 920–942. [Google Scholar] [CrossRef]
- Yao, Z.; Nagel, C.; Kunde, F.; Hudra, G.; Willkomm, P.; Donaubauer, A.; Adolphi, T.; Kolbe, T.H. 3DCityDB-a 3D geodatabase solution for the management, analysis, and visualization of semantic 3D city models based on CityGML. Open Geospat. Data Softw. Stand. 2018, 3, 1–26. [Google Scholar] [CrossRef] [Green Version]
- Soulakellis, N.; Chatzistamatis, S.; Vasilakos, C.; Tataris, G.; Papakonstantinou, A.; Kavroudakis, D.; Topouzelis, K.; Roussou, O.; Kalloniatis, C.; Papadopoulou, E.E.; et al. Synergistic exploitation of geoinformation methods for post-earthquake 3D mapping of Vrisa traditional settlement, Lesvos island, Greece. In Proceedings of the GeoInformation for Disaster Management (Gi4DM), Istanbul, Turkey, 18–21 March 2018; Volume XLII-3/W4, pp. 491–498. [Google Scholar]
- Chatzistamatis, S.; Kalaitzis, P.; Chaidas, K.; Chatzitheodorou, C.; Papadopoulou, E.E.; Tataris, G.; Soulakellis, N. Fusion of TLS and UAV photogrammetry data for post-earthquake 3D modeling of a cultural heritage church. In Proceedings of the ISPRS-International Archives of the Photogrammetry, Remote Sensing and Spatial Information Sciences, Istanbul, Turkey, 18–21 March 2018; Volume XLII-3/W4, pp. 143–150. [Google Scholar]
Figure 1.
The study area of the Vrisa settlement with LOD2 buildings based on the categorization of EPPO in 3 classes: i. red—dangerous for use; ii. yellow—unsafe for use; iii. green—safe for use. Up until today, the majority (>90%) of “red buildings” have been demolished while more than 80% of the “yellow buildings” have been repaired.

Figure 2.
The workflow of the methodology implemented consists of five steps.

Figure 3.
Point cloud density: (a) Building A, the majority of points present a range of neighbors 1300–1900, (b) histogram of density (mean = 1595 and standard deviation = 249.89), (c) building B, the majority of points present a range of neighbors 500–700, (d) histogram of density (mean = 559 and standard deviation = 145.47).


Figure 4.
Three-dimensional building model generation: (a) point cloud of building A, (b) LOD3 model of building A designed in SketchUp, (c) point cloud of building B and (d) LOD3 model of building B designed in SketchUp.
Figure 4.
Three-dimensional building model generation: (a) point cloud of building A, (b) LOD3 model of building A designed in SketchUp, (c) point cloud of building B and (d) LOD3 model of building B designed in SketchUp.

Figure 5.
FME Workbench, transformation of SketchUp models into the CityGML format.

Figure 6.
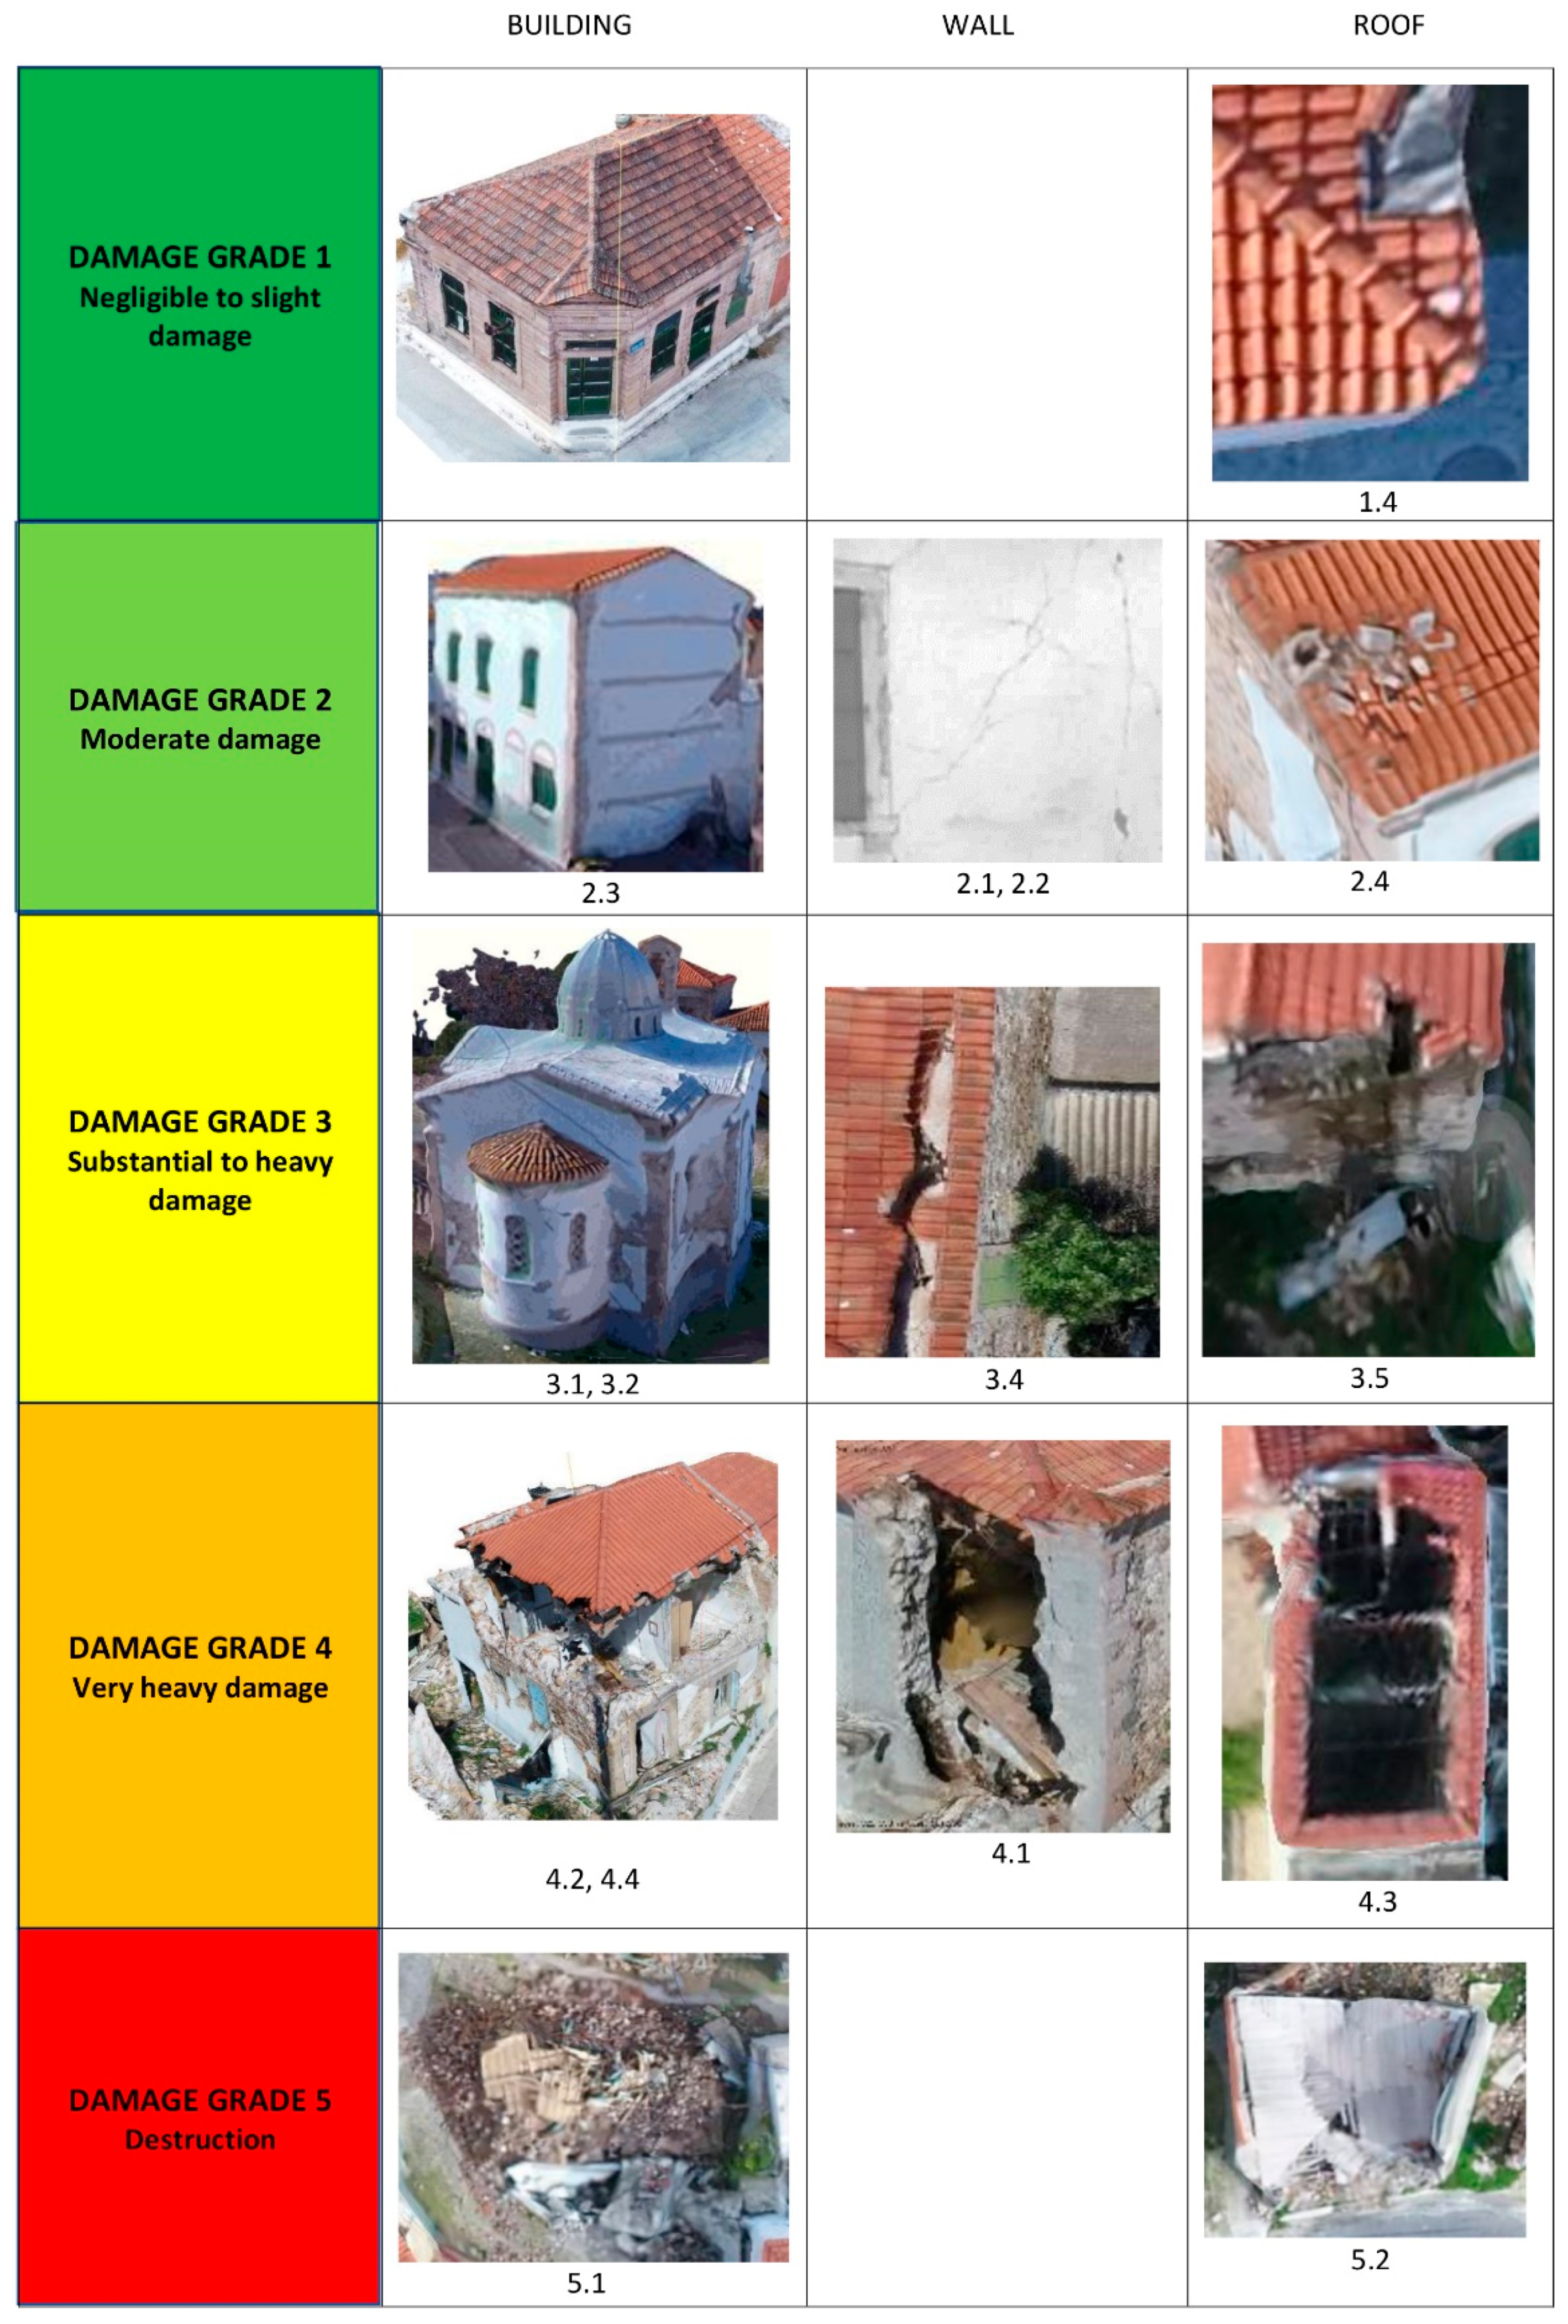
Categorization of seismic damage at the level of buildings, walls and roofs according to EMS-98 as shown in several 3D models created by processing UAS images. The subcategories of these grades on the walls: 2.1 Cracks in many walls, 3.1 Large and extensive cracks in most walls, 3.2 Diagonal large and extensive cracks in most walls, 3.3 Failure of individual non-structural elements (partitions, gable walls), 4.1 Serious failure of walls and 5.1 Total collapse. The subcategories of these on the roofs are: 1.4 Fall of roof tiles, 2.4 Partial collapse of chimneys, 3.4 Roof tiles detach, 4.3 Partial structural failure of roofs and 5.1 Total collapse.
Figure 6.
Categorization of seismic damage at the level of buildings, walls and roofs according to EMS-98 as shown in several 3D models created by processing UAS images. The subcategories of these grades on the walls: 2.1 Cracks in many walls, 3.1 Large and extensive cracks in most walls, 3.2 Diagonal large and extensive cracks in most walls, 3.3 Failure of individual non-structural elements (partitions, gable walls), 4.1 Serious failure of walls and 5.1 Total collapse. The subcategories of these on the roofs are: 1.4 Fall of roof tiles, 2.4 Partial collapse of chimneys, 3.4 Roof tiles detach, 4.3 Partial structural failure of roofs and 5.1 Total collapse.

Figure 7.
UML class diagram of the CityGML feature structure of basic semantic LOD3 building model, extended with DamageGrades.
Figure 7.
UML class diagram of the CityGML feature structure of basic semantic LOD3 building model, extended with DamageGrades.

Figure 8.
Cloud-to-cloud distance method results: (a) mean distance is 5 cm for building A, (b) histogram of the results (standard deviation = 0.04), (c) mean distance is 9 cm for building B, (d) histogram of the results (standard deviation = 0.05).
Figure 8.
Cloud-to-cloud distance method results: (a) mean distance is 5 cm for building A, (b) histogram of the results (standard deviation = 0.04), (c) mean distance is 9 cm for building B, (d) histogram of the results (standard deviation = 0.05).

Figure 9.
(a) Wall damage grades for building A were 1.1. (b) For building B, one wall was characterized with Wall damage 4.1 and the rest with grade 2.2, and the roof was characterized with grade 4.3.
Figure 9.
(a) Wall damage grades for building A were 1.1. (b) For building B, one wall was characterized with Wall damage 4.1 and the rest with grade 2.2, and the roof was characterized with grade 4.3.

Figure 10.
LOD3 CityGML building models with semantic layers rendered in FZK viewer for (a) building A and (b) building B.
Figure 10.
LOD3 CityGML building models with semantic layers rendered in FZK viewer for (a) building A and (b) building B.


Table 1.
Flight planning parameters for UAS data acquisition.
| Buildings | Building-A | Building-B | |
|---|---|---|---|
| Flight | Date | 7 October 2020 | 7 October 2020 |
| Duration | 10 min | 12 min | |
| Height | 30 m | 30 m | |
| Camera angle | Nadir/oblique | Nadir/oblique | |
| GSD | 0.9 cm/pix | 0.9 cm/pix | |
| Number of nadir images | 20 | 35 | |
| Number of oblique images | 70 | 60 | |
| Total area | 272 m2 | 152 m2 |
Publisher’s Note: MDPI stays neutral with regard to jurisdictional claims in published maps and institutional affiliations. |
© 2021 by the authors. Licensee MDPI, Basel, Switzerland. This article is an open access article distributed under the terms and conditions of the Creative Commons Attribution (CC BY) license (https://creativecommons.org/licenses/by/4.0/).
Share and Cite
MDPI and ACS Style
Chaidas, K.; Tataris, G.; Soulakellis, N. Seismic Damage Semantics on Post-Earthquake LOD3 Building Models Generated by UAS. ISPRS Int. J. Geo-Inf. 2021, 10, 345. https://0-doi-org.brum.beds.ac.uk/10.3390/ijgi10050345
AMA Style
Chaidas K, Tataris G, Soulakellis N. Seismic Damage Semantics on Post-Earthquake LOD3 Building Models Generated by UAS. ISPRS International Journal of Geo-Information. 2021; 10(5):345. https://0-doi-org.brum.beds.ac.uk/10.3390/ijgi10050345
Chicago/Turabian StyleChaidas, Konstantinos, George Tataris, and Nikolaos Soulakellis. 2021. "Seismic Damage Semantics on Post-Earthquake LOD3 Building Models Generated by UAS" ISPRS International Journal of Geo-Information 10, no. 5: 345. https://0-doi-org.brum.beds.ac.uk/10.3390/ijgi10050345
Note that from the first issue of 2016, this journal uses article numbers instead of page numbers. See further details here.