1. Introduction
Urban tourism has been expanding globally over the last few decades [
1]. The current mobility [
2] and the world tourism dynamics are in constant change and, at the same time, they are heavily structuring the trajectories of cities [
3]. In this context, governments have relied on strategic planning to shape cities to be more touristic. However, these changes usually focus on a healthy tourist without mobility problems.
Accessibility and tourism affect each other, and therefore the study and improvement of one of them involves the development of the other [
4]. The concept of urban accessibility can be understood as the possibility that a person with any ability can reach and use places, as well as carry out activities of interest without barriers [
5] and it is one of the most strategic factors in economic models. Some of research has managed to build accessibility indexes that can generally capture transport access to an area [
6], understanding that accessibility is driven by good infrastructure [
7]. As already mentioned, accessibility has great impact on a key economic driving sector such as tourism [
8]. Many scientific studies focus on tourist trends, proposing theories about their behavior to predict even their seasonality [
9,
10]. Within the different typologies of tourism, the following research refers to cultural tourism, studying behavior through images of geolocation techniques to even propose tourist routes within the different cities [
11].
Extrapolation of the concept of network and its application for the understanding of urban networks is widely accepted and occupies a prominent place. Thus, there are examples about the study of networks in the categorization of the structures of the city [
12] and analysis of connectivity in cities [
13,
14] among others.
The study of complex network theory continues to be a challenge in research given a large number of applications in many fields, such as economics, biology, communication, transportation. An increasing amount of research supports the implementation of this theory, reaffirming the great importance that nodes within a network can have and the significance of the possible paths that prevail in it [
15,
16,
17]. Complex network theory continues to be developed with the concepts, algorithms, methods, and models proposed in real network analyses [
18,
19].
For the analysis of the relevance of the role of nodes within the network in network theory, the most commonly used tools have been the centrality measures [
20,
21]. There exist many investigations on the concept of centrality however, the presence of data in the study of centrality in networks is relatively recent [
22,
23,
24]. In [
22], the authors defined a novel centrality measure, called the Adapted PageRank Algorithm (APA) that establishes a node classification that takes into account the topology and data associated with the nodes.
Studies concerning the impact of accessibility on the organization of the pedestrian network, the location and distribution of activities, as well as urban services, focusing on the elderly [
25,
26] should be noted. Currently, studies of this relationship are generally divided into two aspects. The first one is based on concepts of gravitation/spatial interaction [
27] and the other, on its usefulness for consumption [
28,
29,
30]. With some of these studies, networks have been carried out that are capable of modeling and predicting tourist activity to analyze deficiencies and propose improvements in it [
31].
Moreover, the result of having a World Heritage status has boosted tourism in many cities around the world. A large number of tourists and the side effects, such as the overcrowding of the main spaces in the city, are resulting in the need to develop new strategies to protect heritage assets. One of these cities is Avila (Spain). This city won the first-ever European award for disabled-friendly cities (Access City Award in 2011) with different policies to improve the city through accessible resources [
32] or transport cards [
33].
In [
34], the author analyzes the accessibility of the city attending all special conditions of disabled people to improve access to hotels, restaurants, monuments, etc. However, it is interesting to complement this work with the accessibility of the streets of the city, because there is a lack of strategies about this topic, and is personalized to all people with mobility restrictions. Moreover, these strategies have to incorporate solutions to some problems such as over-tourism, conflicts between residential and tourist uses, and mobility problems. In this paper we propose a novel algorithm for labeling the difficulty of the streets of a city using accessibility parameters such as the slope of a street, the existence of railings, sidewalks, or stairs, etc. In addition, we show a numerical example of the city of Avila, locating the most inaccessible areas of the city using centrality measures and analyzing the effects in terms of accessibility to the commerce and services of the city. Finally, we show how the restoration of some of the city streets could affect the accessibility and commercial impact.
2. Materials
2.1. Data Acquisition
Data was obtained using OpenStretMap (OSM) [
35] and Overpass-turbo [
36]. The extracted data, such as roads, secondary roads, etc., are tied to the highway tag. From OSM, we extract information about the city as the location of stairs, commercial business, length of all streets, type of pavement, and other useful information. All this data is reviewed with manual labeling from fieldwork activities. With Microsoft’s Bing Maps [
37] service, the heights of a location given by its coordinates have been extracted. With this information, the slope of the streets in all its sections has been self-calculated. In addiction, the Shuttle Radar Topography Mission (SRTM) data was used to obtain the height of a point in the city, and the efficiency was compared using information obtained with data extracted from a third source, Strava, a popular website used to track users activity via GPS-enabled devices. The result is similar and we decided to use Bing Maps data.
2.2. Accessibility: Parameters
Allowing all people to move around the city (e.g., walking or on wheelchairs), which reduces the use of cars and promotes public transport, are policies that can improve life in a city. In regards to tourism, making the city more accessible could positively affect the economy so as to help all people arrive at a business easily.
However, there are some obstacles or situations that entail mobility problems in different streets. For example, irregular pavement or an excessive slope are architectural barriers to access the different areas in a city. In this paper, we attend to the following problems: (i) Stairs, which pose a terminal obstacle for people with several mobility problems, (ii) slopes or ramps, that do not exceed 1:20, even preferably less, (iii) railings, whose existence will make a slope or a set of stairs more accessible, (iv) sidewalk, whose width should be at least 2.6 m plus wheelchair dimensions, and (v) ground or pavement, where bad conditions, or an irregular state could affect people with mobility problems.
2.3. Commercial and Tourism: Parameters
The data collected for the realization of this study belong to the number and geolocation of shops, hostels, hotels, bars, and businesses related to the tourism sector. The database has been carried out in detail for each of the streets belonging to the historical part of the city center. The accessibility measures for the different streets analyzed have also been integrated into the database. As previously described, the objective is to find the implication of the accessibility of different streets for a city’s economic and tourist development.
3. Methods and Procedure
In this section, we explain the proposed algorithm for labeling the difficulty of a city’s streets using accessibility parameters such as the slope of a street, the existence of railings, sidewalks, or stairs, etc. First, we show the APA Centrality measure to classify the streets of a city. Then, we explain the labeling of the difficulty estimation value of each street.
3.1. Centrality Measure
In this subsection, we briefly describe the measure of centrality used to classify the streets of the city.
The Adapted PageRank Algorithm (APA [
22]) was proposed in 2012. This algorithm is an adaptation of the PageRank model for spatial networks with data, and it was initially thought of for urban street networks. The APA model is based on the construction of a matrix
that has two terms, one related to the topology of the graph and the second one related to the information of the network:
The eigenvector of the matrix provides a classification of the network nodes according to the connectivity and presence of data.
3.2. Accessibility Limits
A city has different problems attending to accessibility limits, such as big slopes, stairs, uneven ground, cobblestone floor, inadequate, or nonexistent sidewalks, etc. All of these types add to the mobility problems of each tourist (use of wheelchairs, baby carriages, and older people with different mobility limitations) producing constraint paths or streets that certain types of people can not visit. To identify and classify the streets of a city according to some types of limitations or parameters, an algorithm is proposed.
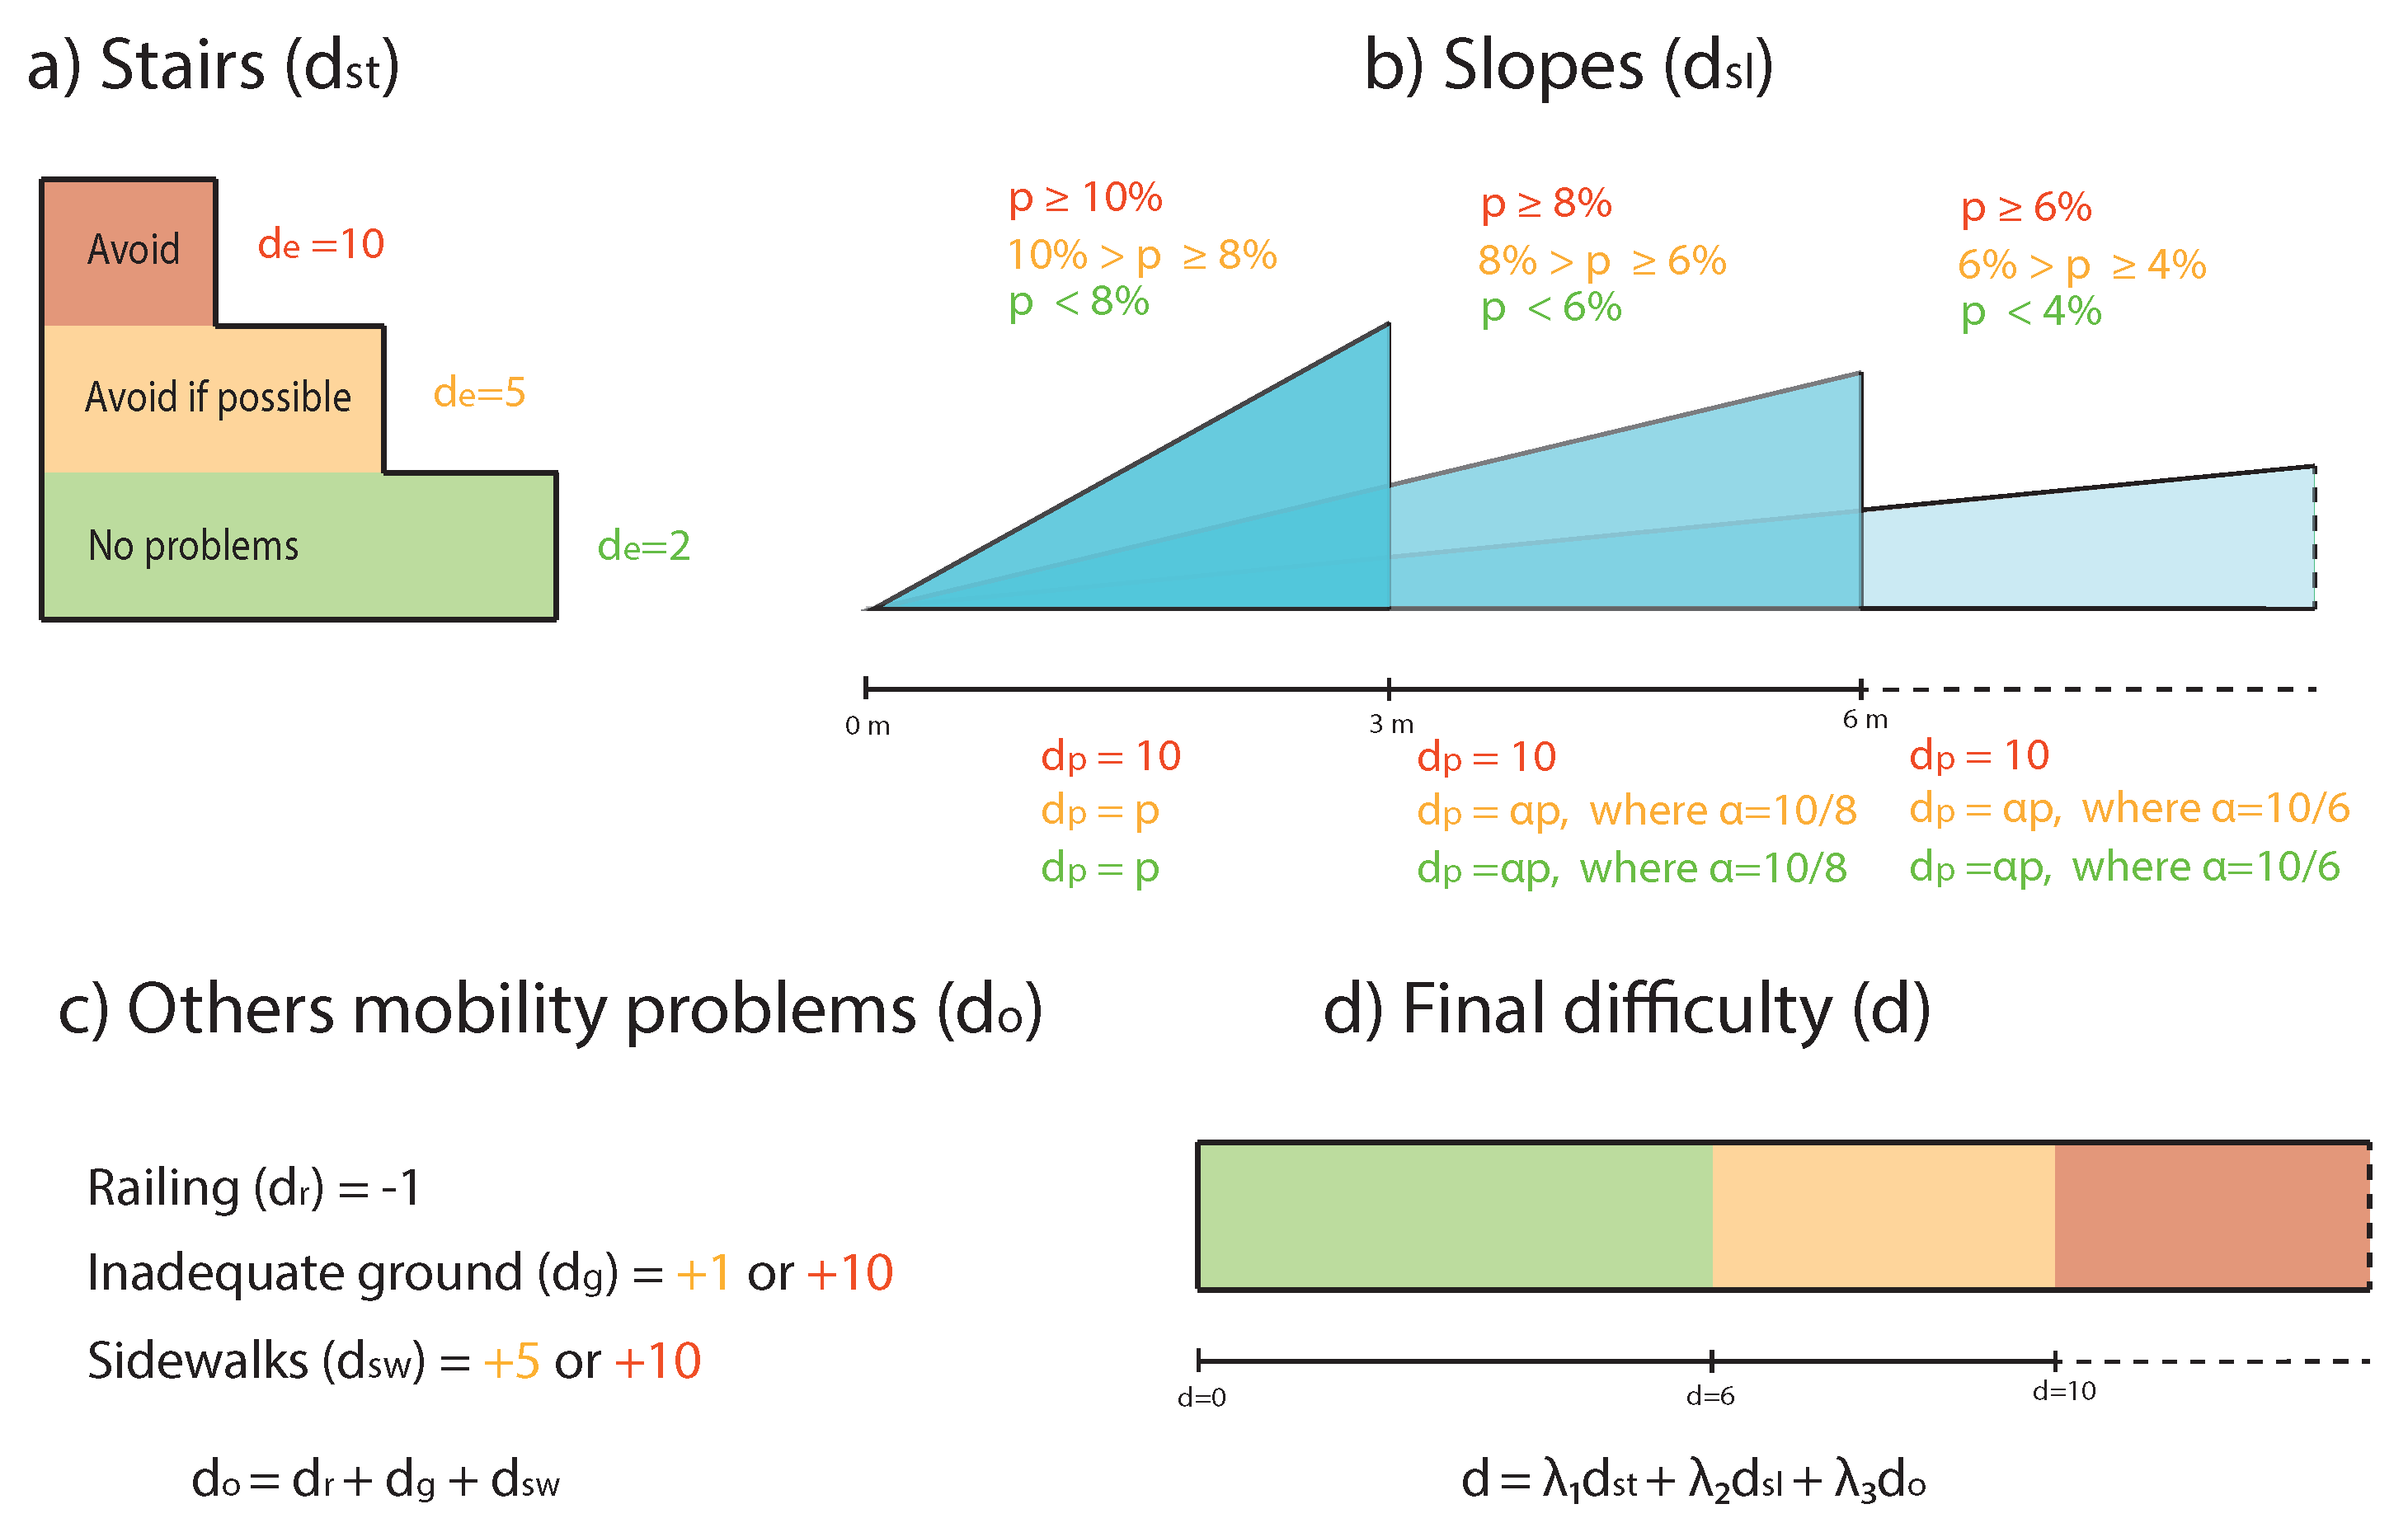
In
Figure 1, we show the decisions made about the labeling of street difficulty:
3.2.1. Stairs Difficulty Estimation ()
Following the specifications of stairs in [
38], we estimate three levels of stairs difficulty ordered by color, using the indications of the users (see
Figure 1a):
Avoid stairs: This difficulty level is the most restrictive. It indicates all people that can not use stairs (e.g., people in wheelchairs, or people who prefer the option of avoiding all stairs). All streets in this level have been registered as inaccessible paths (the difficulty of the street is );
Avoid if possible: This difficulty level means that a person can use stairs, but it is better not to use them if possible, due to mobility problems. All people belonging to this level prefer not to use stairs (e.g., people with a baby carriage or people who have selected this option). All streets in this level have been registered as moderate-difficulty paths (the difficulty of the street is );
No mobility problems: This difficulty level means that there are no stairs constraints. People can use all kind of stairs. All streets in this level are low difficulty paths (the difficulty of the street is ).
3.2.2. Slope Difficulty Estimation ()
When attending to architectural design considerations, ramps are a problem because building or monument entrances could be inaccessible due to the difference between indoor and outdoor levels. Governments and organizations work on policies to improve the accessibility of these places. However, the slopes o streets affect people with mobility constraints.
Many streets with an elevated slope result in inaccessible routes due to differences in level. In
Table 1, we show the maximum recommended slope of a ramp, following the specifications of Technical Accessibility Code of Spain Buildings [
38], and their associated difficulty based on a parameter
that represents the ration between length and slope obtained from the maximum ramp permitted for this code (see
Figure 1b).
With respect to the ratio , we select different values according to the maximum value of the range of the slope in each level. If we select the minimum value of the range (0.6 and 0.4 in orange and green levels, respectively) we will reduce the threshold of the difficulty of a street and more streets will labeled with less difficulty.
3.2.3. Others Mobility Problems
There are other obstacles in streets that directly affect the mobility of people with limitations of movements. Regarding the ground, an inadequate floor (cobblestone floor, bad condition floor, etc.) could limit the access of many people, such as a person with a wheelchair. Moreover, the conditions of sidewalks are crucial. If a street has no sidewalks, or their conditions are irregular, the use of these streets is restricted. Moreover, we have labeled as problematic streets other cases such as the kerb height of sidewalks, which can be a major obstacle for wheelchair users. In the case of a pedestrian street or a living street, there is no difficulty in terms of sidewalks (if the pavement is irregular, the difficulty is applied in this category). If a street where there are stairs or a ramp has a railing, that helps to improve the mobility of the people and the difficulty of the street is reduced.
In
Table 2, we show the assigned values of these obstacles. We can observe that railings are the only element that reduces the accumulative difficulty (see
Figure 1c).
3.2.4. Final Difficulty Estimation (D)
To calculate the final difficulty of a street, we sum all partial values of mobility problems as follows:
The parameters , and represent a weighting of the different restoration levels. With these parameters we could control the state of different elements of a city (e.g., if a sidewalk can not be restored, we assume a value of 1).
We propose 3 accessibility levels, labeled by color (see
Figure 1d), to represent the accessibility of the streets. With respect to the mobility restrictions for a specific person, we specify another three levels from a low restrictive level, when a person has few mobility problems (e.g., a person who can use stairs), to a high restrictive level, when a person has several mobility restrictions (e.g., a person who can not use stairs). In
Table 3, we can see the accessibility levels, the final decision, and users characteristics of different streets. For instance, a street labeled with a final difficulty of 12, will be an inaccessible street that only healthy people can use.
4. Experiments and Results
4.1. Constructing Urban City Networks
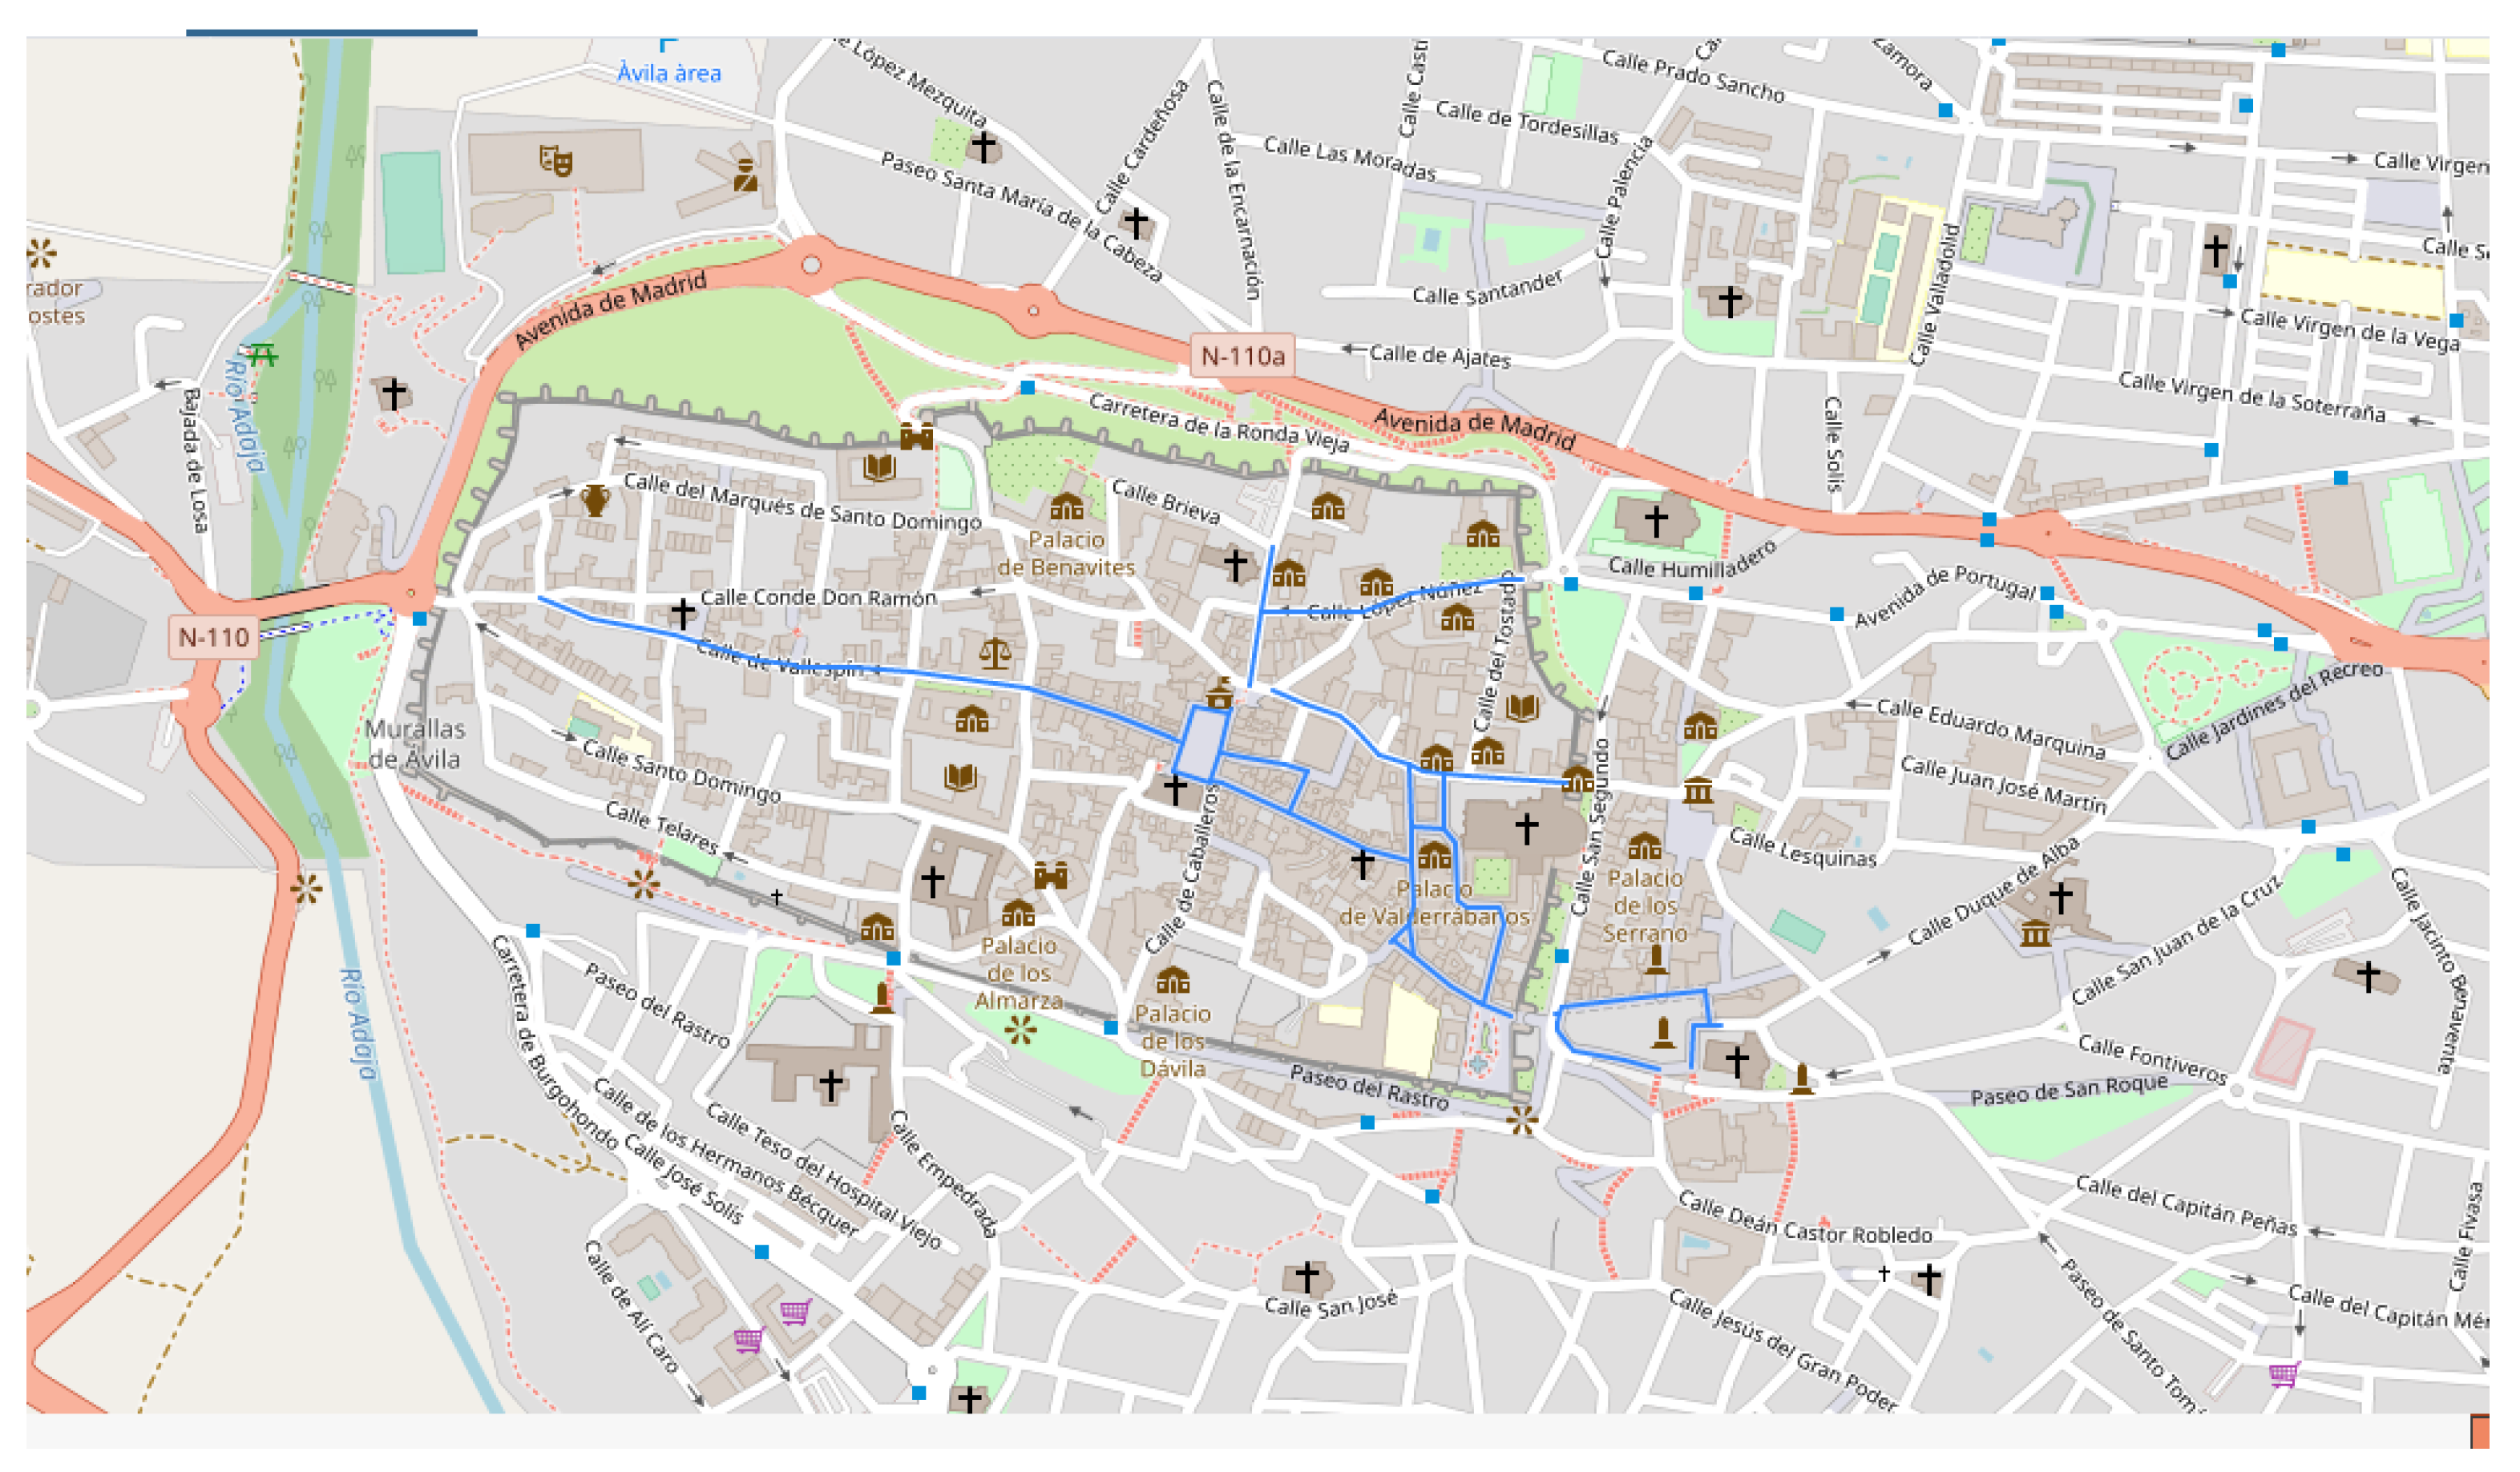
In this section, we study a case study: The city of Avila, Spain. Is an awarded city in terms of accessibility.
The construction of its accessibility and commerce networks is shown. Note that both networks are undirected because we focus on the difficulty of the streets independent of the direction of the path, and we are interested in the commerce information of them. Testing different values of lambda, as , we observe that few streets have been affected (e.g., only seven streets will change from a red level color to orange, and studying these streets, the accessibility labeled could be wrong). For that, we assume the lambda parameter is equal to the unit because the city can not be strongly restored due to its historical restrictions (UNESCO World Heritage City). With respect to the ratio , we have tested the maximum value (0.8 and 0.6 in orange and green levels, respectively) and the minimum value of the range (0.6 and 0.4). However, in our case study, there are no differences (only two streets will change from the red to orange level, and we see as the state of both streets could be ambiguous).
4.1.1. Accessibility Network
Given a list of final difficulties of streets or partial sections of these streets, we construct a network through a primary graph as follows. Let , an undirected weighted graph where V is the set of n nodes, representing the intersections between streets, E is the set of e edges or streets, and W is a weighted matrix, which contains the difficulty values of all streets (D).
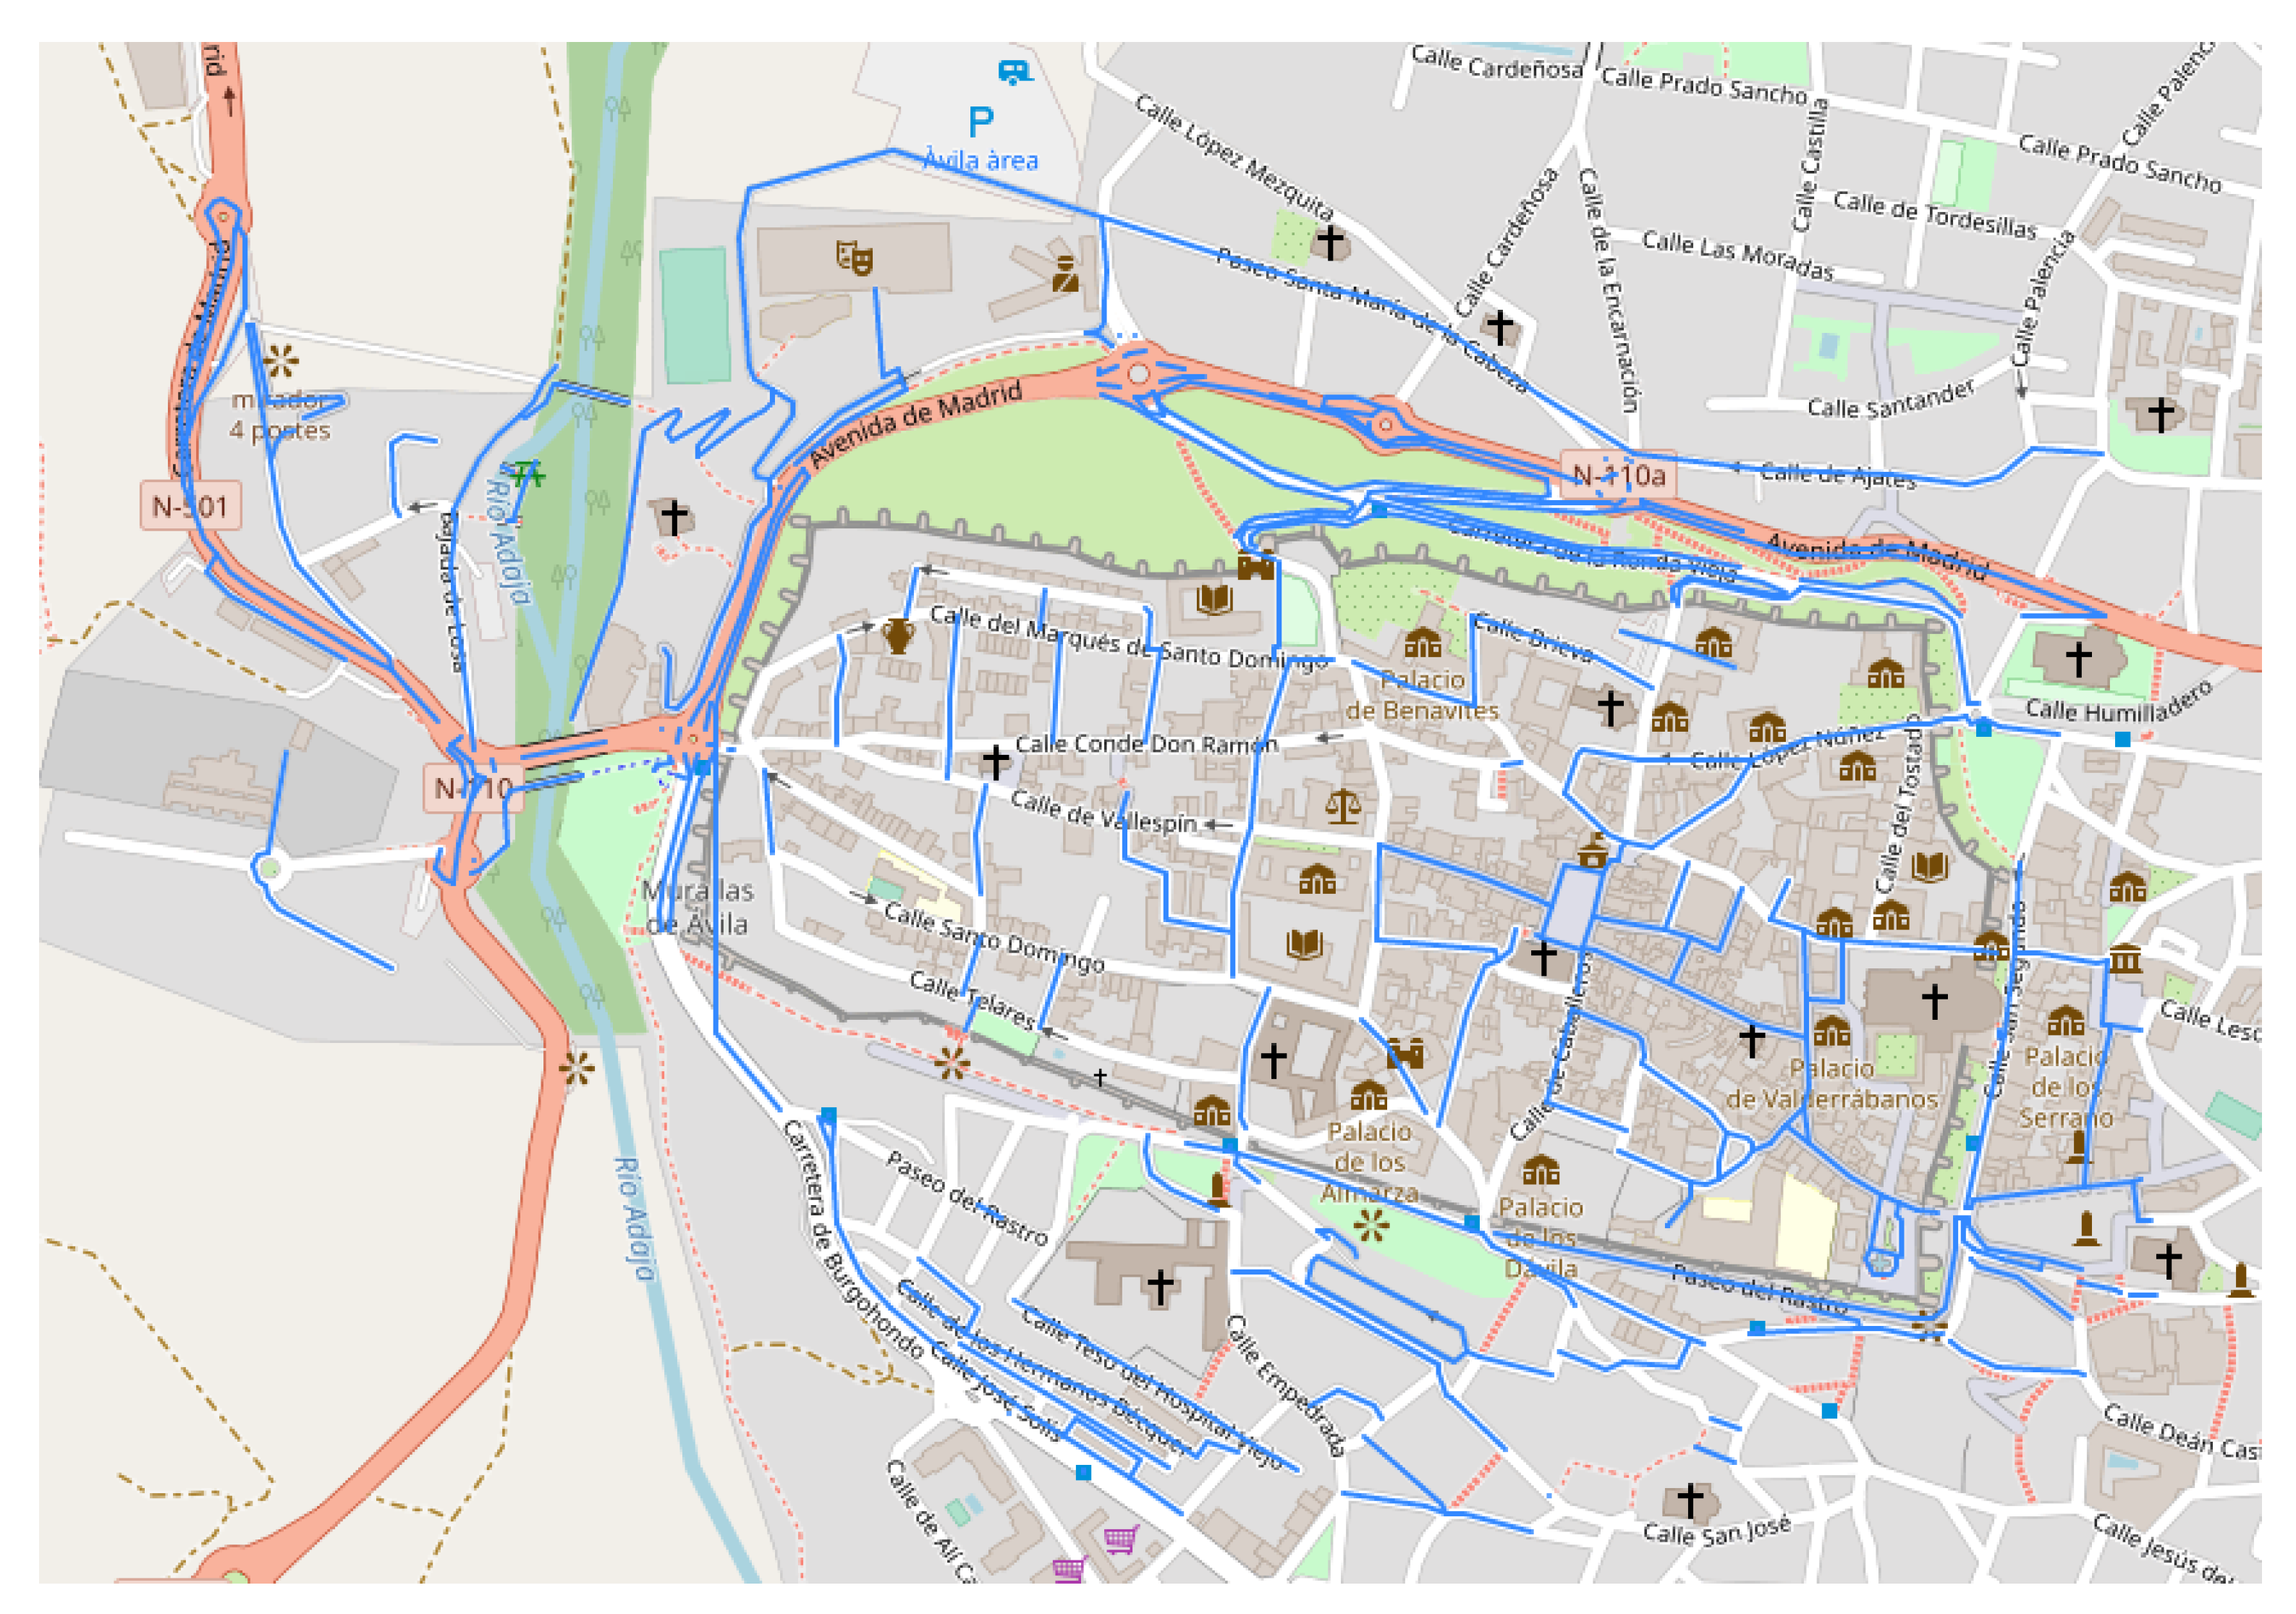
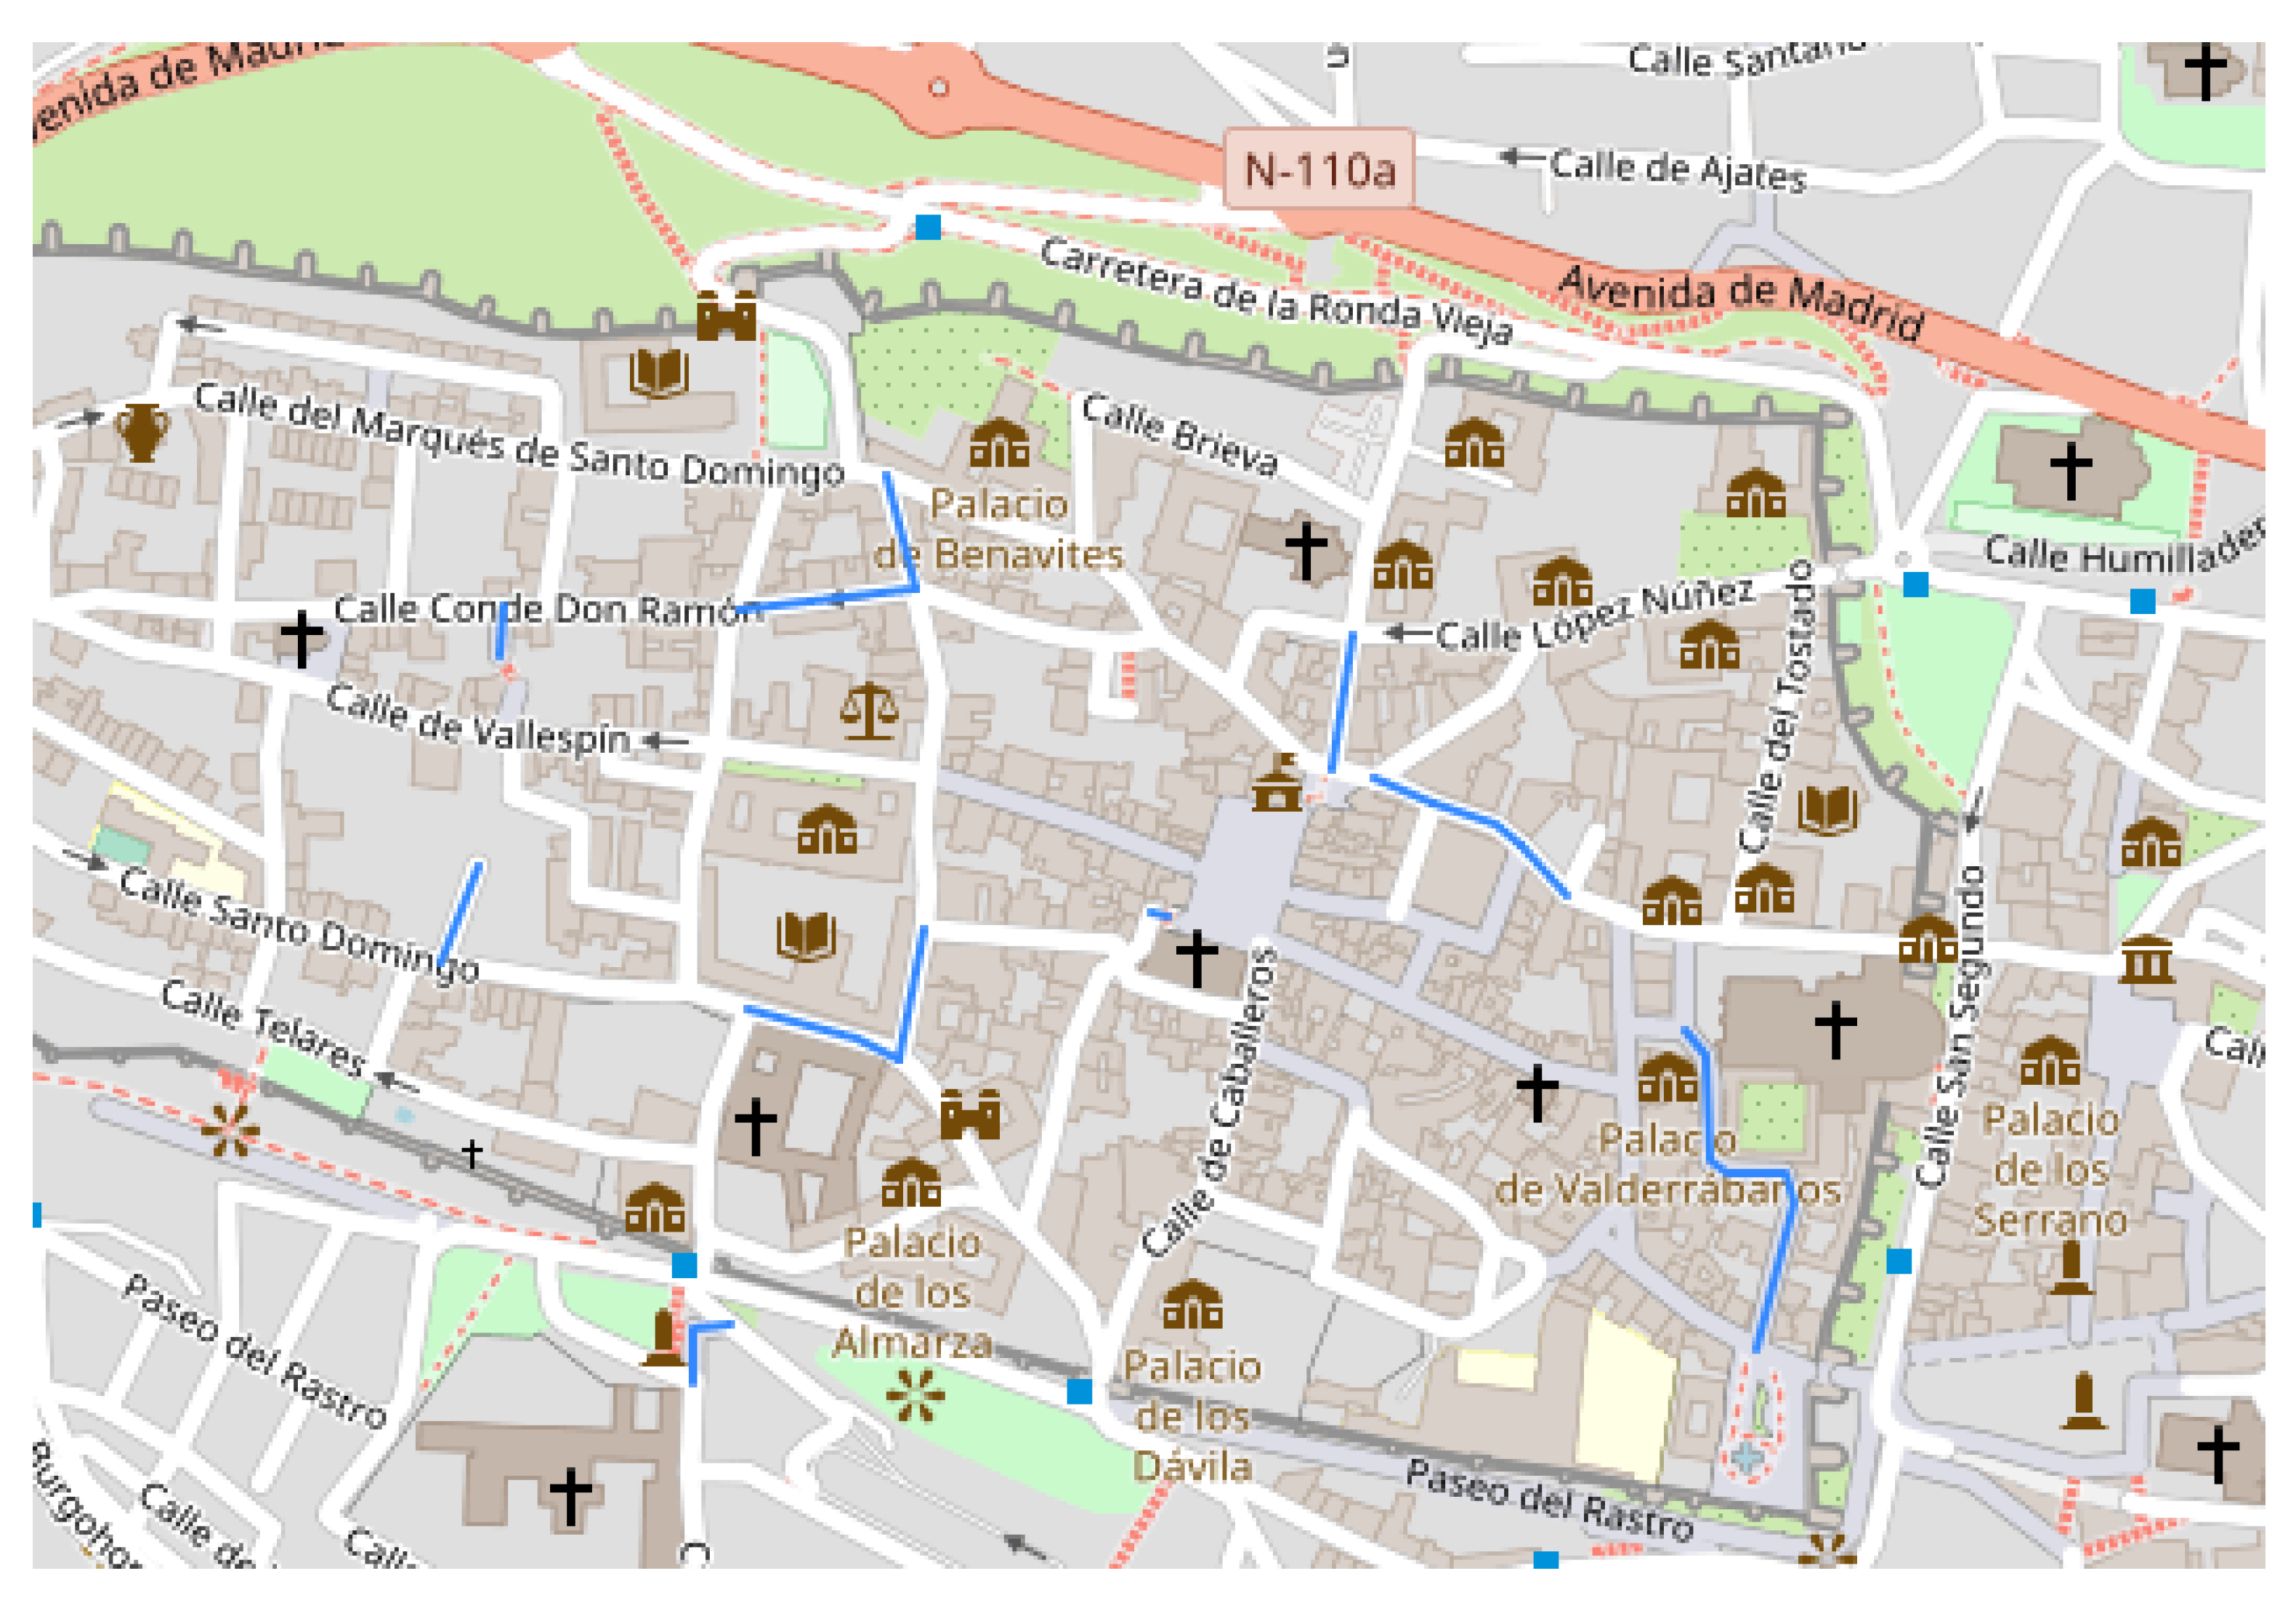
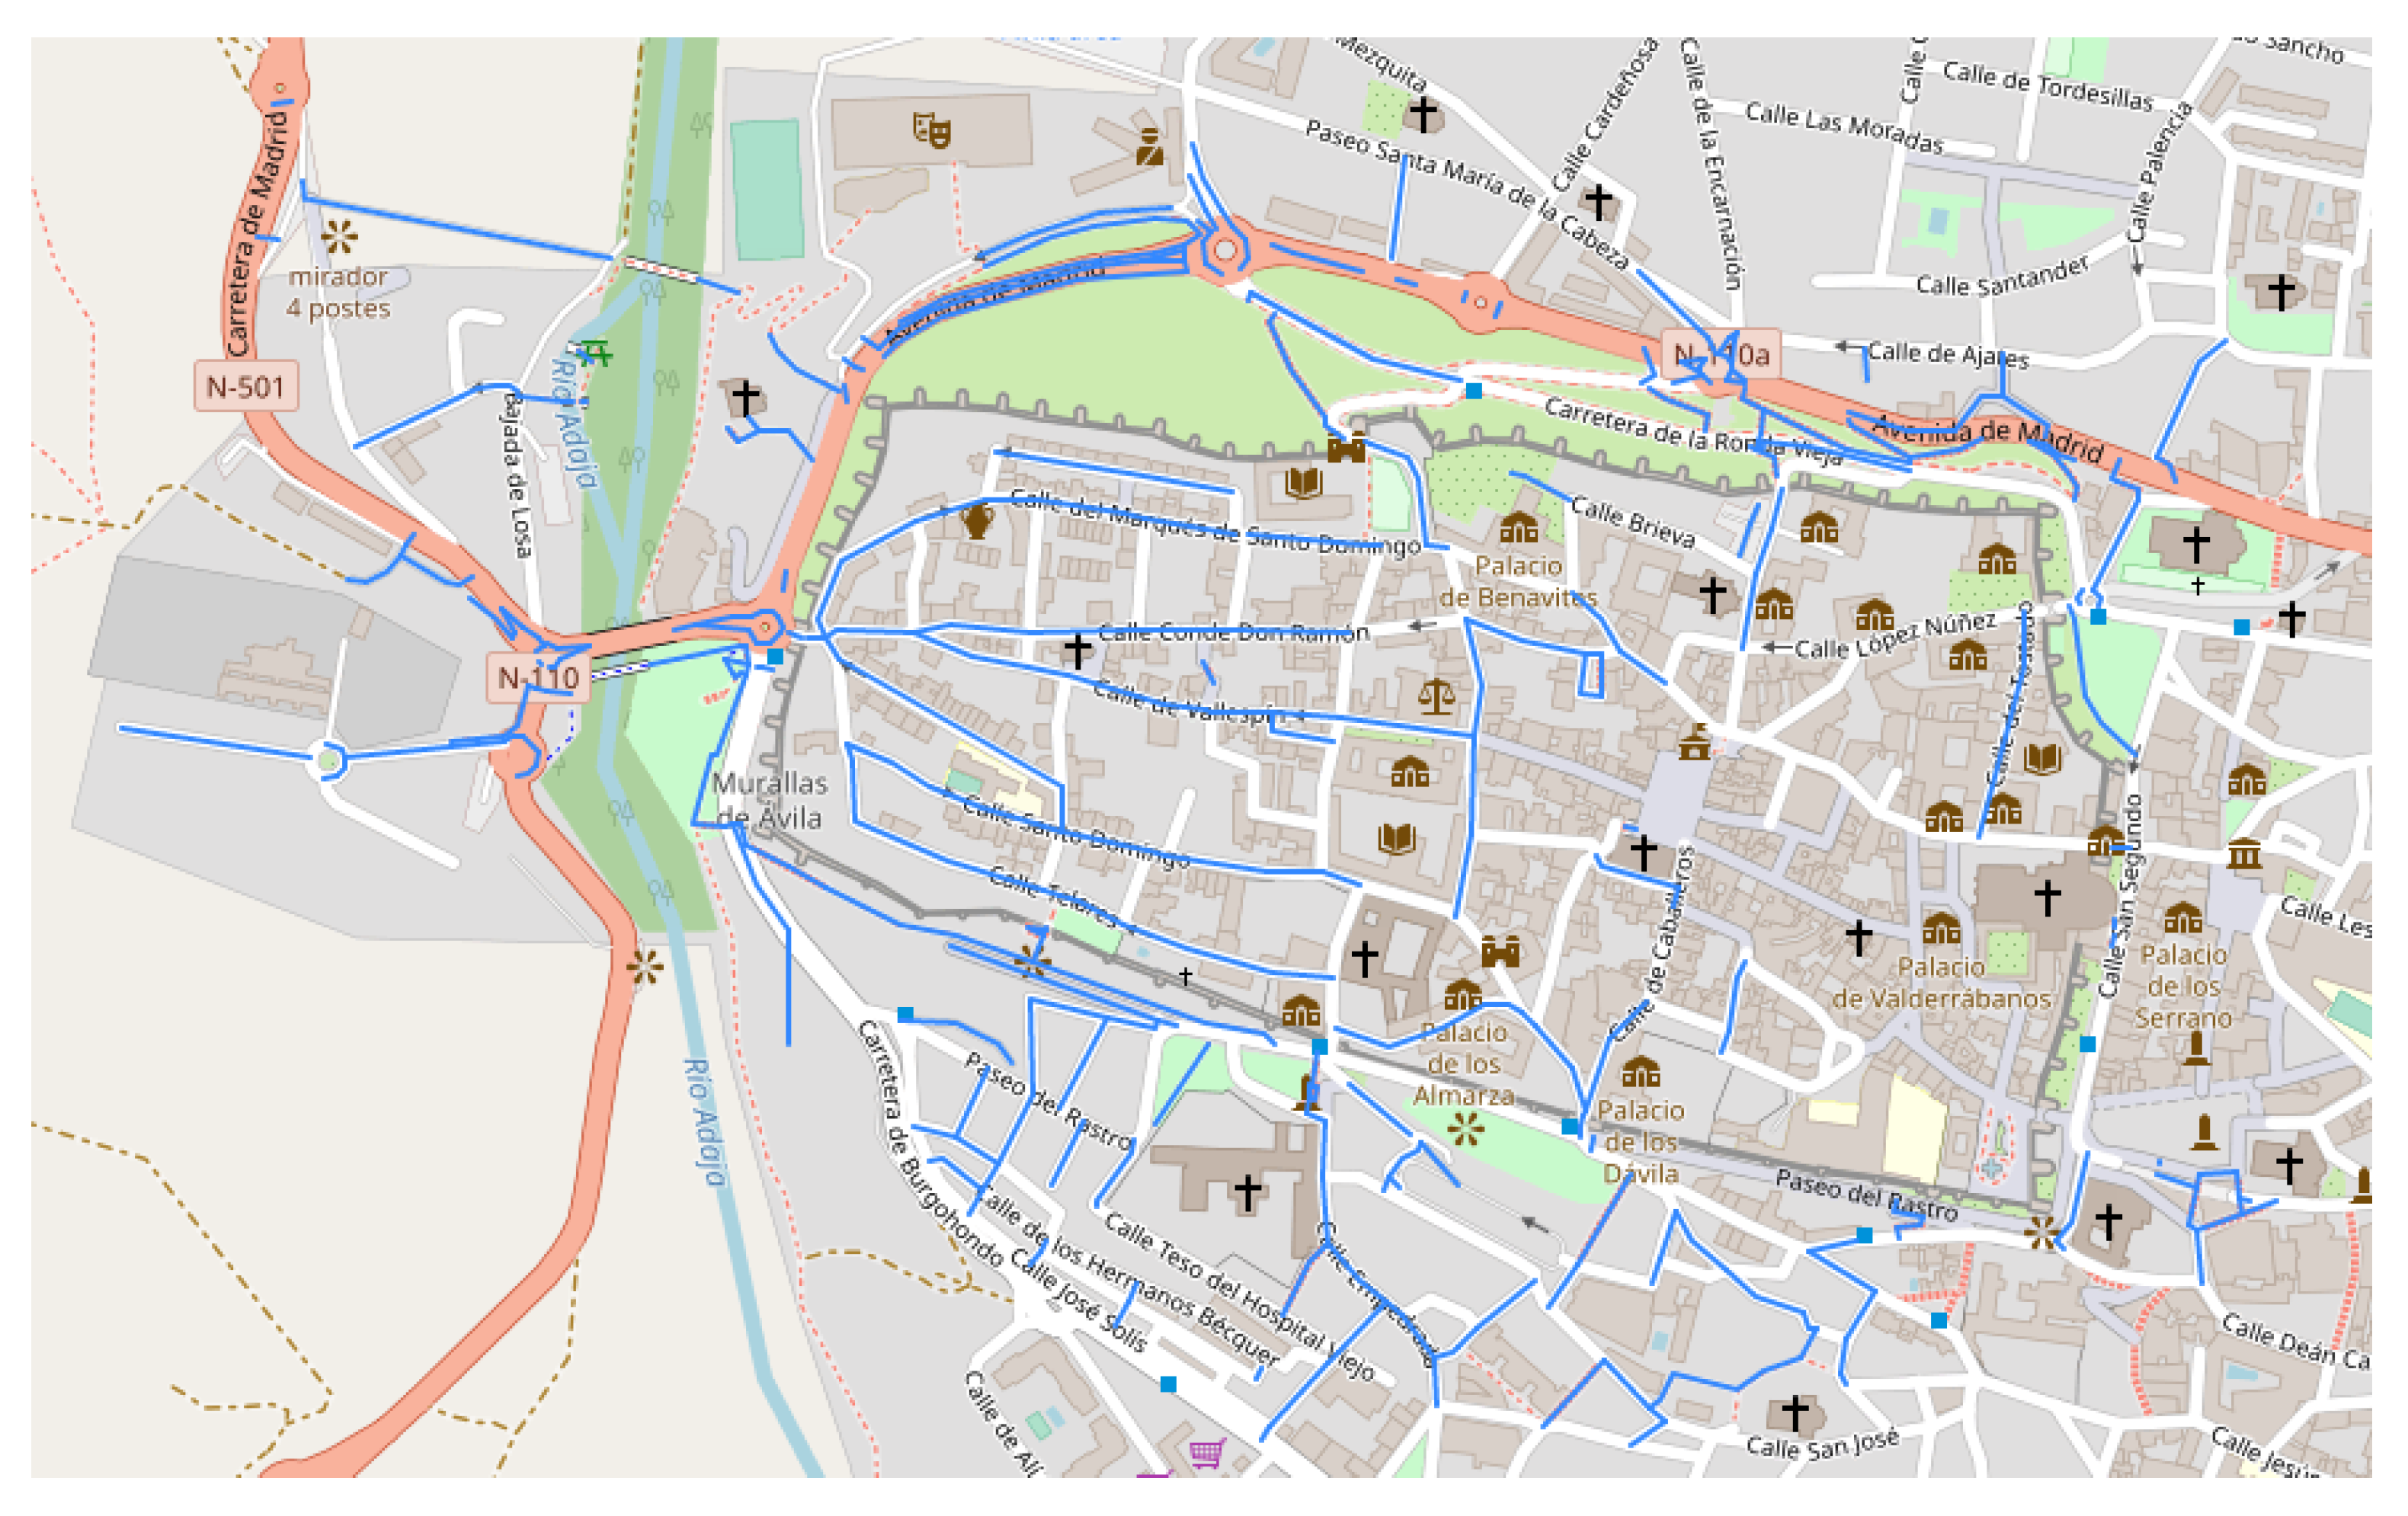
We create three different graphs representing the accessibility according to the different constrained mobility levels: (i) Low, a graph with the accessible streets that all people could use (see
Figure 2), (ii) moderate, adding to accessible streets some problematic streets (see
Figure 3) that people with moderate mobility could use, and (iii) high, where all inaccessible streets (see
Figure 4) have been removed, and only people without mobility constraints could access.
4.1.2. Commercial Network
In
Figure 5, we show the street with the most commercial businesses in the studied area of the city. We list, in
Table 4, the top streets regarding the number of businesses.
Given a list of the commercial businesses of every street, we construct a primary graph
(undirected weighted graph) where
V is the set of
n nodes, representing the intersections between streets,
E is the set of
e edges (streets), and
W is a weighted matrix, which contains the sum of all commercial businesses of each street (explained in
Section 2.2).
4.2. Detecting Main Commercial and Touristic Areas
First, from the commercial graph
, we applied the APA algorithm with the aim to classify the nodes of the network. We rank all nodes in terms of this centrality to detect the main areas of the city.
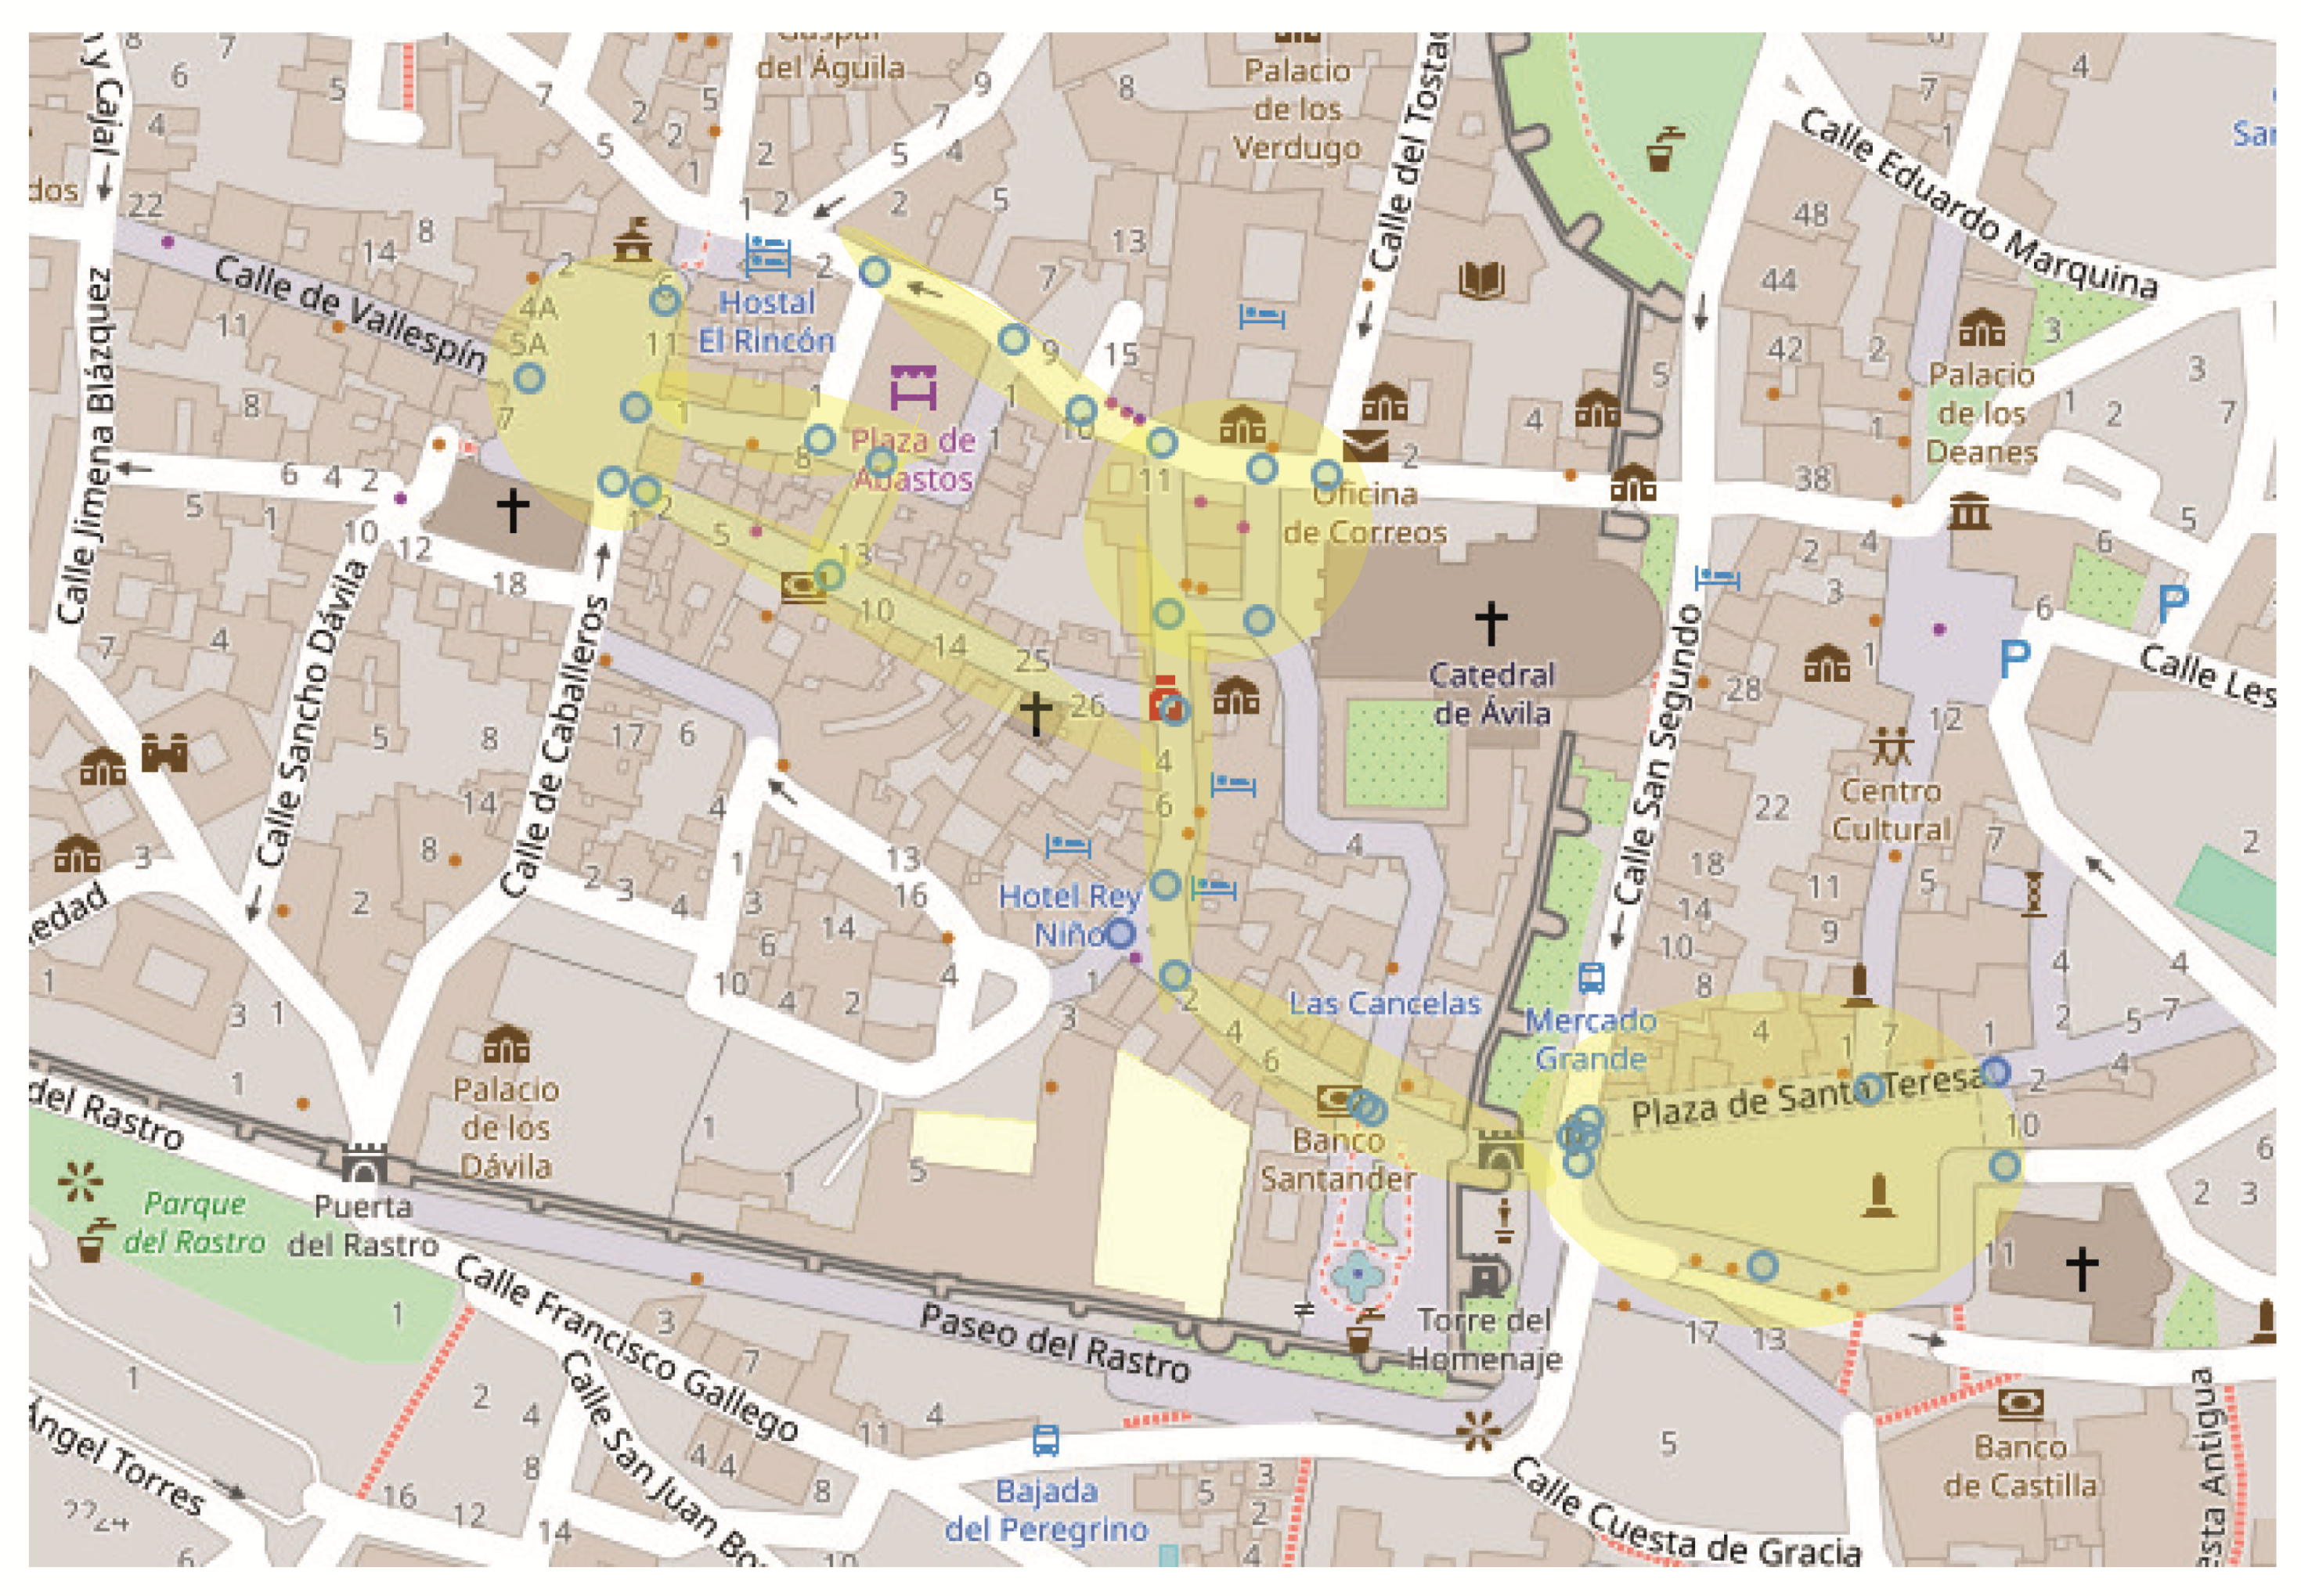
Table 5 presents the top 10 APA ranking of commercial areas from the point of view of the APA centrality index. Note that we calculate the importance of a street from the centrality values of all included nodes in each street. In addiction, we can show the map of the city (
Figure 6), drawing in blue the nodes with a high centrality value, that represent the main commercial streets of the city in terms of this measure, and highlighting, in yellow, the main areas of commercial business.
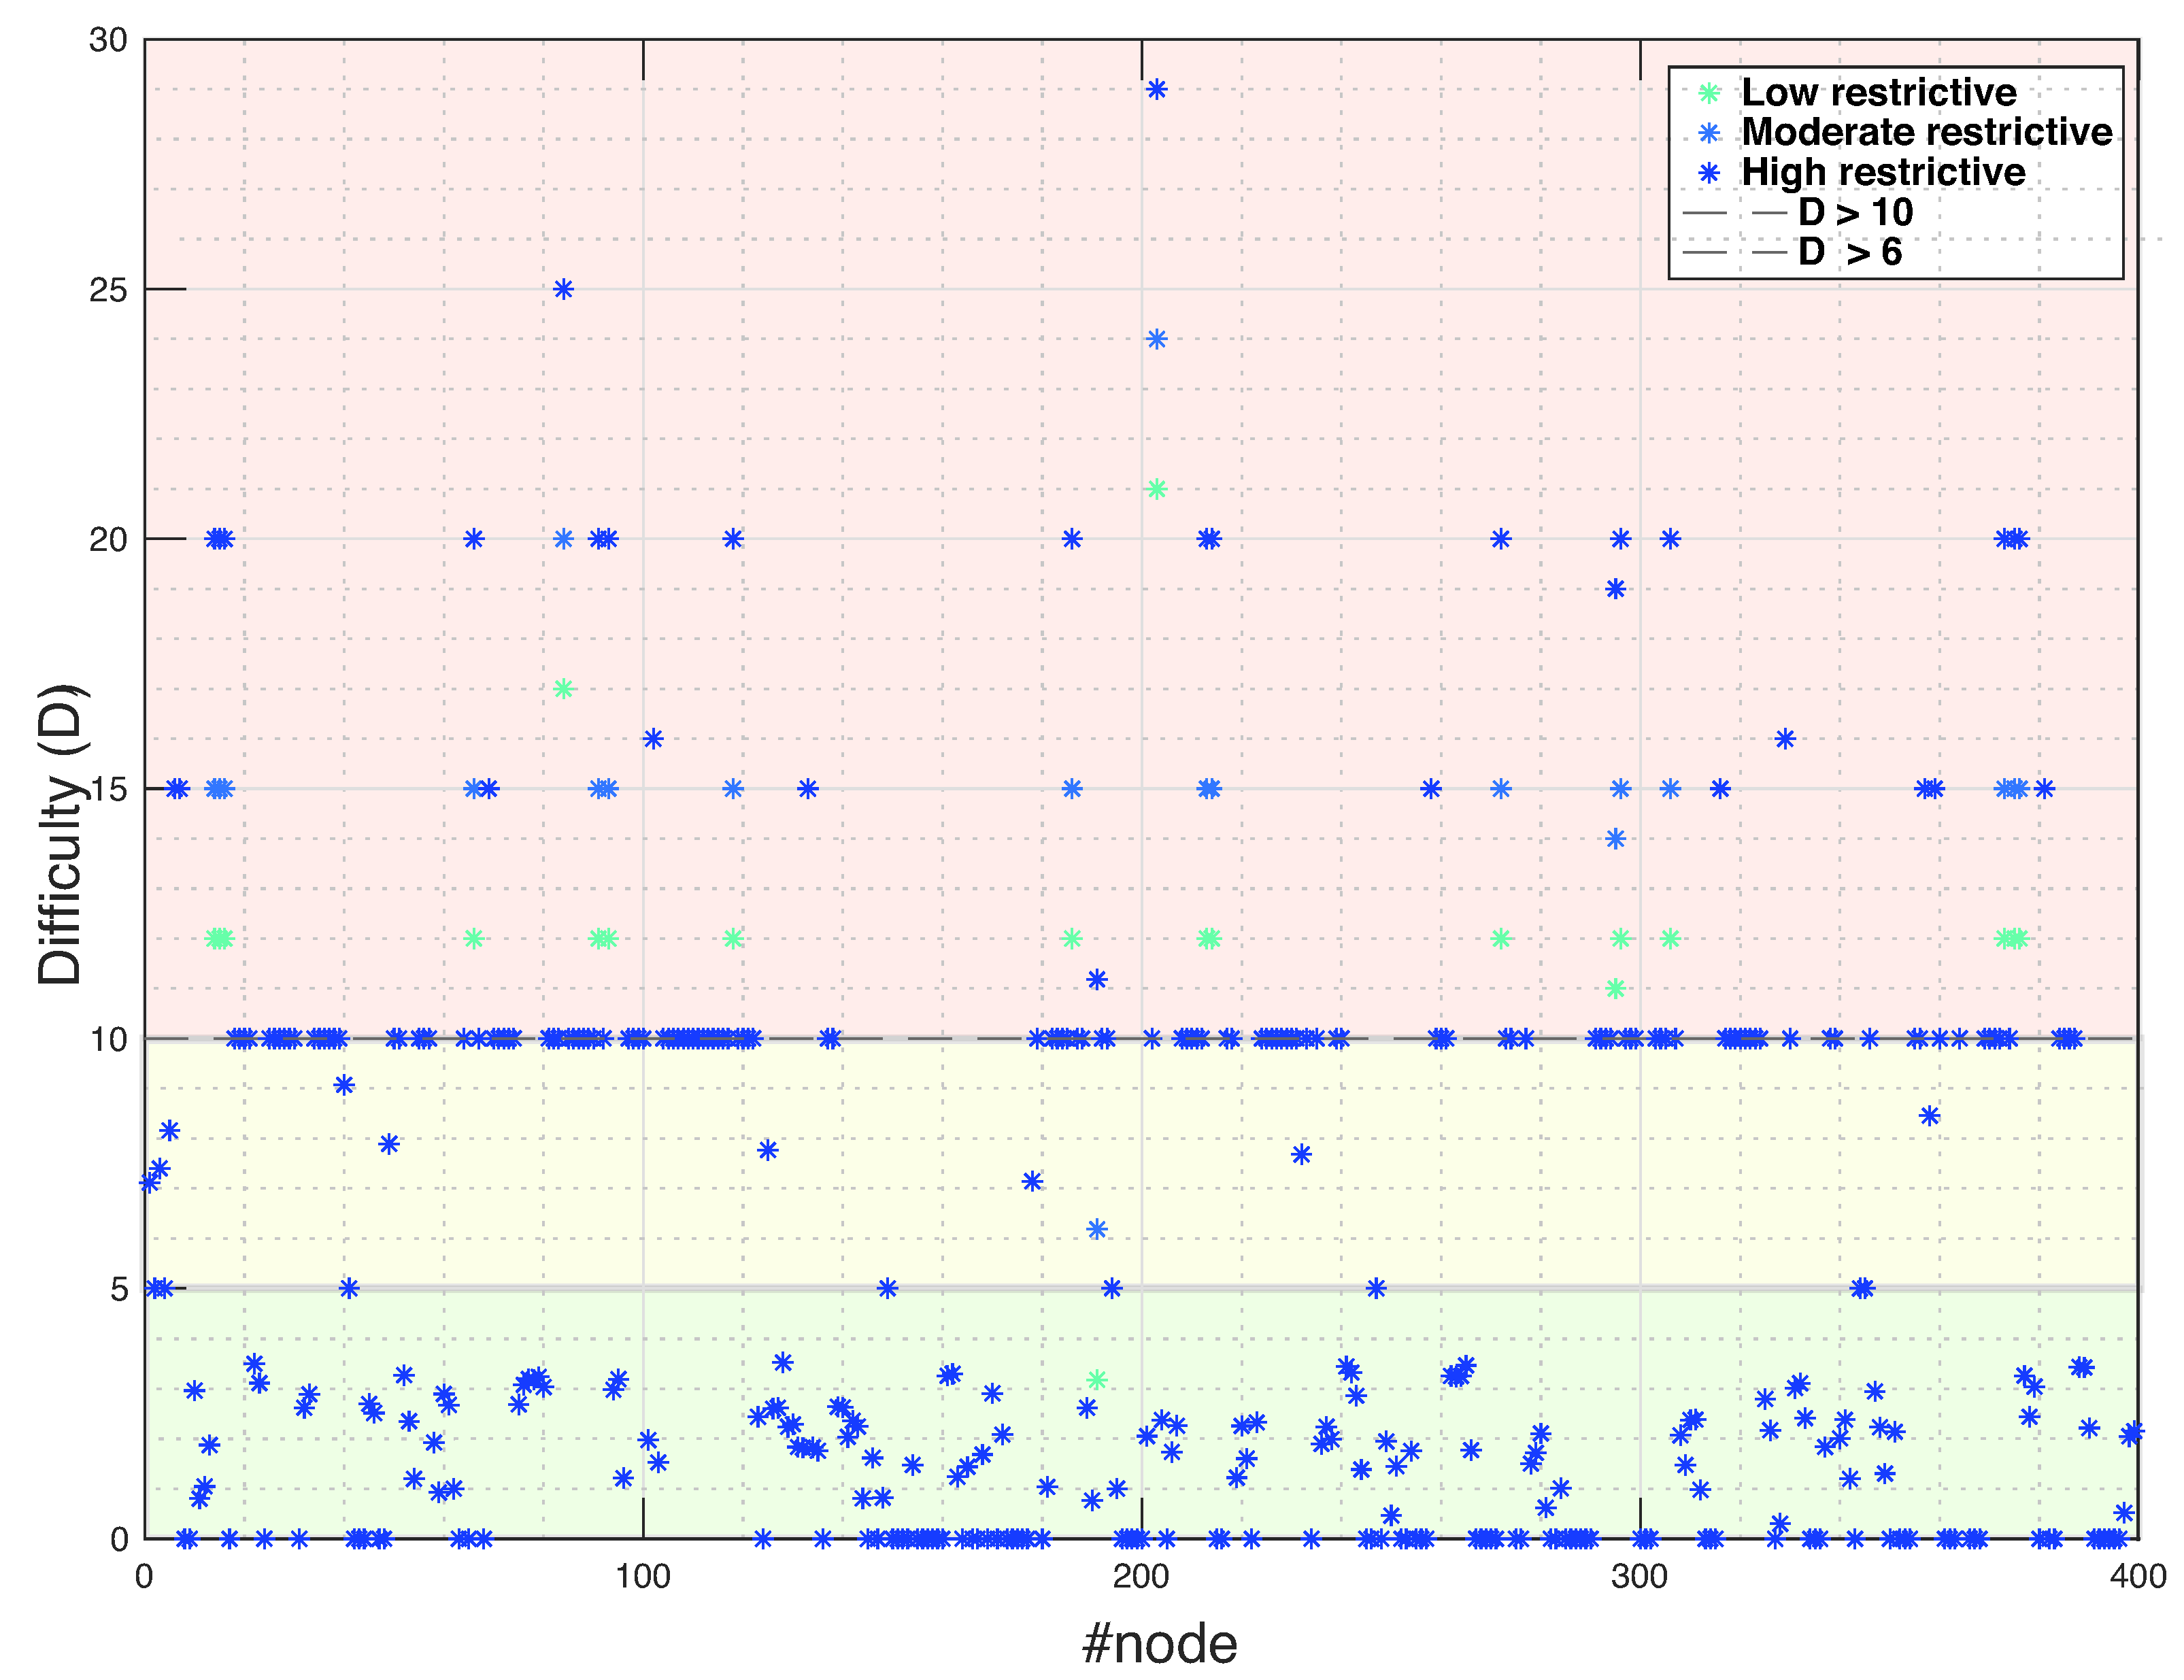
4.3. Detecting Accessibility Problems
In this section, we construct three different networks according to the three levels of difficulty of urban accessibility (see
Table 3). In
Figure 7, we show the difficulty of all the streets keeping in mind the mobility restrictions of the people. From the original network, we remove all edges in the primal graph that exceed a certain threshold (5 or 10).
With the aim to evaluate the impact of the accessibility we present, in
Table 6, different configurations in terms of different mobility constraints and the accessibility level. The changes in the characteristics of the network result in less density and possible paths (worse connectivity, a reduced average degree) than the original graph. Note that, in this table, the first row shows the network with all streets that a person with low mobility restrictions could access.
4.4. How to Increase the Touristic Impact: Densifying the Network
Following the results obtained in
Table 6, it is possible to evaluate the inaccessible businesses in a case study where the mobility constraints are low.
In
Table 7, we can see that a quarter (
) of the businesses of the city are located on accessible streets for people without major restrictions in mobility, but people with high mobility problems can not access them. Moreover,
of them are inaccessible for all people with any mobility problem (they are only accessible for healthy people).
Some streets could be made more accessible through different actions such as improving the pavement (
), adding a railing (
), and improving or adding the sidewalks (
). In
Table 8, we show the number of streets whose accessibility difficulty is slightly higher than the thresholds. For example, for a person with low mobility restrictions, if we restore a street by adding a railing, we can make four streets more accessible, even one of the streets will be fully accessible. Improving the pavement or the sidewalks of 282 streets will be more accessible (orange accessibility level), and 58 of them will be completely accessible (green accessibility level).
After the restoration of previous streets, the network is denser than the original, and the number of the commercial inaccessible businesses is reduced from
to
with a slight restoration and to
with a moderate restoration in the best case (see
Table 9). With a strong restoration of the city, almost all business will be accessible by most of the people (
).
Finally, we show a case study of the restoration of three streets: Calle del Tostado, Calle de Caballeros, and Calle de la Cruz Vieja. After studying these streets, we propose the following actions:
To widen a sidewalk in Calle del Tostado, reducing its accessibility difficulty to 0. There are two restaurants and a hotel located on the street;
To widen a sidewalk in a small stretch of street Calle de Caballeros, reducing its accessibility difficulty to 0. There are seven businesses, a restaurant and a hotel located on the street;
To add appropriate sidewalks in Calle de la Cruz Vieja, reducing its accessibility difficulty to . There are two restaurants, a hostel, and a business located on the street.
According to these changes, we recalculate the connectivity of the city with APA centrality measure, and we show how the average centrality of different streets changes and the impact that this produces in terms of accessibility on different areas of the city: Historic and commercial streets of the city. Then, in
Table 10, a comparison of the average of the APA centrality of main streets of the city in terms of accessibility before and after the restoration of the selected three streets are presented. The second column is the impact of the restoration calculating the difference of the averages between APA centrality measures of the main streets (historical area) before and after restoration and the third column is similar to the second column however by taking the main commercial streets (see
Table 5).
For instance, the impact of the restoration (for people with low mobility problems) of these three streets is an improvement of 12.9% (centrality) in the streets belonging to the historic area and 4.71% in the streets more important in terms of business.
From these results, we can see the advantages of the restoration of some streets. Moreover, if we adapt several streets of the city we achieve an improvement of their accessibility and reduce the number of inaccessible businesses. We have a more connected city (a denser graph, and a uniform degree of all streets), which means more equal accessibility to the main streets of the city, where the tourist could take more possible paths and access more businesses in the city.
5. Discussion
In this paper, we focus on studying the accessibility of all people that visit a city with some mobility restrictions and its effects in other aspects, such as the economy (accessibility to all businesses of a city). For that, the proposed algorithm measures the difficulty of each street attending to the existence of stairs, slopes, railings, and the state of sidewalks and the pavement. This difficulty has different parameters to allow change for the restoration possibilities of the streets in a city, and we choose the values of these parameters following the specifications of the Technical Accessibility Code of Spain Buildings.
Concerning parameters that represent the restoration levels (lambda in Equation (
1)), these values help to control the state of restoration of different elements of a city. If we select a low value, it means that we relax the difficulty with respect to the thresholds. In our case study, in theory, the best value is the unit because it is difficult to restore a historical area of the city of Avila. To test this hypothesis, we probe a smaller value of lambda (0.8) and we observe few changes (only seven streets will change from the red level color to orange), and comparing with manual labeling, these streets could be wrong. For that, the best value in our case study is 1.
After constructing the urban and commercial networks, we applied the APA algorithm to the commercial graph, with the aim of ranking the nodes. As a result,
Table 5 presents the top 10 APA ranking of commercial areas.
Focusing on the impact of accessibility,
Table 6 shows different configurations in terms of different mobility constraints and accessibility levels. It can be observed that changes in the characteristics of the network result in less density than the original graph. Then, following the results obtained in that Table, we evaluate the inaccessible businesses where the mobility constraints are low.
Table 7 show that a quarter (
) of the businesses of the city are located on inaccessible streets for people with high mobility problems. Moreover,
of them are only accessible for healthy people.
Our following step is to study how to increase the accessibility of some streets through different actions such as improving the pavement, adding a railing, and improving or adding the sidewalks. It can be seen in
Table 9 that after the restoration of some streets, the network is denser than the original, and the number of commercial inaccessible businesses is reduced from
to
with a slight restoration and to
with a moderate restoration in the best case. With a strong restoration of the city, almost all businesses will be accessible.
Finally, we go into more detail by analyzing how the improving of the accessibility of three streets could affect the entire city. To demonstrate this, we recalculate the connectivity of the city with APA centrality measure of the main streets of the city in terms of accessibility before and after the restoration (see
Table 10). An analysis of the aforementioned table shows that adapting several streets of the city, it is possible to have a more connected city in terms of accessibility.
6. Conclusions
The methodology proposed in this work highlights the importance of restoring some streets in a city, which produces an improvement in the accessibility of a city, and in addition, commerce and tourism benefit. Although the concept is clear, the main problem is the limitations in changes on areas of a historic city, because of heritage laws which make a strong restoration impossible. As a result of that, we focus on demonstrating how a simple improvement of two or three streets (e.g., installing railings) could positively affect the accessibility of a city. Another detected problem is the length of a path: Our method can obtain a personalized path for each person with accessibility problems, but this path could be different to the shortest route. That is, this methodology gives priority to a less difficult path even if it is longer than the shortest path.
We propose a methodology for labeling the estimated difficulty of all streets of a city in terms of different parameters of accessibility, such as stairs, the slopes of a street, the existence of railings, the state of a sidewalk, or irregular grounds.
In our experiments, focused on a case study of the city of Avila (Spain). By labeling the difficulty, we generate the network of accessibility for different mobility constraints. We study the most important areas in terms of the number of businesses using the APA centrality index, and compare it with the network of accessibility to show the inaccessible zones of a city, wherein the worse case (43.01%) shows the impossibility of people with mobility problems accessing 25.42% of commerce in the city.
Finally, we show a simulated situation where three streets are restored. The results show how accessibility (12.90% in the city center) and commercial impact (4.71%) are improved.


