Article

An Efficient, Platform-Independent Map Rendering Framework for Mobile Augmented Reality

1
SuperMap Software Co., Ltd., Beijing 100015, China
2
Institute of Geographic Sciences and Natural Resources Research, Chinese Academy of Sciences, Beijing 100101, China
3
State Key Laboratory of Remote Sensing Science, Aerospace Information Research Institute, Chinese Academy of Sciences, Beijing 100094, China
*
Author to whom correspondence should be addressed.
Co-first author, these authors contributed equally to this work.
ISPRS Int. J. Geo-Inf. 2021, 10(9), 593; https://0-doi-org.brum.beds.ac.uk/10.3390/ijgi10090593
Submission received: 22 June 2021 / Revised: 21 August 2021 / Accepted: 3 September 2021 / Published: 8 September 2021
(This article belongs to the Special Issue Geovisualization and Map Design)

Abstract

:
With the extensive application of big spatial data and the emergence of spatial computing, augmented reality (AR) map rendering has attracted significant attention. A common issue in existing solutions is that AR-GIS systems rely on different platform-specific graphics libraries on different operating systems, and rendering implementations can vary across various platforms. This causes performance degradation and rendering styles that are not consistent across environments. However, high-performance rendering consistency across devices is critical in AR-GIS, especially for edge collaborative computing. In this paper, we present a high-performance, platform-independent AR-GIS rendering engine; the augmented reality universal graphics library (AUGL) engine. A unified cross-platform interface is proposed to preserve AR-GIS rendering style consistency across platforms. High-performance AR-GIS map symbol drawing models are defined and implemented based on a unified algorithm interface. We also develop a pre-caching strategy, optimized spatial-index querying, and a GPU-accelerated vector drawing algorithm that minimizes IO latency throughout the rendering process. Comparisons to existing AR-GIS visualization engines indicate that the performance of the AUGL engine is two times higher than that of the AR-GIS rendering engine on the Android, iOS, and Vuforia platforms. The drawing efficiency for vector polygons is improved significantly. The rendering performance is more than three times better than the average performances of existing Android and iOS systems.

1. Introduction

Augmented reality (AR) is an interactive technology that overlays graphical digital information over the physical world. Its main purpose is to combine real-world and virtual information in a manner that provides real-time interaction. More precisely, users receive additional information such as images, sounds, and text that create illusions related to the real world [1,2].
Current AR technologies tend to provide end users and professionals with accessible and innovative applications such as entertainment, advertising, and a variety of other professional applications. Developers can create AR applications that place digital information about businesses into a user’s field of view. For example, a digital description of a building is applied directly to a user’s view. Some AR frameworks such as ARkit, ARCore, and Vuforia can be used to make the AR experiences more easily available to a wider set of users and provide registration and tracking techniques. However, it is challenging to combine AR virtual information with our view of the physical world properly [3]. This challenge differs from issues associated with traditional visualization techniques, where the content to be displayed is well known. To achieve better AR visualization experiences, we must study the key issues in AR visualization implementations that are targeted towards a wider audience than the typical audience of researchers and AR experts.
In geographic information science (GIScience) and related domains, combining AR and GIS to form an augmented reality geospatial information system (AR-GIS) can provide unique opportunities to enhance spatial experiences. This helps to advance applications in planning, analysis, urban development, and other geosciences in a transparent and intuitive way [4,5]. Several studies have shown the high value of AR in earth science. In post-disaster assessments, AR can measure and interpret damaged structures [6]. In virtual travel, AR can be used to display a virtual model of a web interface and indoor and outdoor environments [7,8]. In geoheritage applications, images of four volcanic geological relics were converted into three-dimensional animations and an AR application was developed that attracted the interest of young viewers towards earth sciences [9]. AR can help non-experts to understand processes without first acquiring a heavy professional background in GIScience [10].
Immersive visualization of geographic data has been used widely in recent years. Game engines such as Unity3D support spatial data integration and enable the use of popular AR Software Development Kits (ARKit, ARCore, etc.) to develop spatial AR and Virtual Reality (VR) applications via extension plugins [11,12,13,14,15]. Traditional GIS vendors such as ESRI have recently started to integrate AR and VR capabilities into their GIS products [16,17,18].
It is important to note that research and development of such applications still focuses on hardware and software implementations, with less focus on visualization, especially when hardware-based computing resources are limited [19,20,21]. Another common deficiency in existing solutions is that AR-GIS systems often rely on various platform-specific graphics libraries or operating systems and therefore rendering implementations can differ across various platforms. This leads to performance degradation or rendering styles that are not consistent across environments. However, consistent high-performance rendering across devices is critical in AR-GIS, especially for edge collaborative computing.
The main contribution of this paper is the presentation of an efficient, platform-independent map-rendering framework that uses several visualization algorithms to solve the issues above. We develop a pre-caching strategy, optimized spatial-index querying, and a Graphic Processing Unit (GPU)-accelerated vector-drawing algorithm to improve rendering efficiency. Moreover, we design the cross-platform architecture, including storage, scheduling, and application modules, to provide a consistent AR-GIS rendering style across platforms.

2. Related Work

2.1. Augmented Reality Visualization

Visualization in AR is concentrated on the mapping from virtual data to visual representations. Additionally, it also focuses on spatial relationships and interactions between the physical world and raw (virtual) data [3]. It determines how to combine the physical world and virtual data into 3D images, which are then calculated using 3D–2D algorithms to produce final 2D images. One important aspect of AR visualization is the combination of real and virtual information. If a traditional visualization pipeline is used for AR visualization, it should be modified to reflect a combination of real and virtual information [11]. Based on continued AR development, Keil et al. [22] revised their initial survey to highlight how AR systems require a good registration process that can align virtual and physical objects accurately. Adding registration information to the original pipeline requires providing camera images that represent the environment in the video-transparent AR interface, enabling extraction of environmental information captured in the image, and performing specialized composition steps that reflect the characteristics of AR visualization. In particular, the original rendering step is replaced with a composition step that addresses the need to combine different AR visualization-related source data. In summary, the visualization in AR differs from the traditional visual definition because it uses a combination of the data to be displayed and information about the user’s actual physical environment. In this regard, it should be noted that this work deliberately excludes the problems and challenges of specific AR displays such as space ARs, video transparent displays, and optically transparent displays. For example, using an optically transparent display to implement an AR interface presents its own challenges. Issues regarding these specific displays are discussed in other studies [23,24].
Virtual environment visualization and interaction techniques have been studied in depth [25,26,27]. There are several AR-related studies that have outlined the expression and interaction of virtual data on different platforms [1,20], but work on the classification and analysis of AR visualization technology in terms of cross-platform consistency is very limited. There is little work available on cross-platform AR-related visual topics. Willett et al. [28] defined general AR data representation and representation concepts, and studied the relationship between data, the physical environment, and data representation. However, the visualization method depends on the hardware environment of the embedded platform. Zollmann et al. [3] outlined AR visualization techniques and defined the categories and methods of common AR representation and these corresponding patterns. However, these methods lack further performance analysis and cross-platform research. Although they have deeply summarized of AR visualization technology, there is still no research related to architectural systems, cross-platform consistency and performance analysis of systematic research of this domain.

2.2. Augmented Reality and GIS Visualization

As the world’s leading provider of GIS products, Esri has been developing their Windows-based software product ArcGIS for decades. The map-rendering engine depends on the Windows graphics device interface (GDI) graphics library. This makes subsequent cross-platform development difficult [29]. With increasing demand for cross-platform products, the implementation of map rendering engines for ArcGIS Runtime SDK products varies between operating systems. Moreover, various operating systems optimize map-engine performance, resulting in various types of dependence on operating system-specific optimization algorithms. This is not conducive to producing consistent map-rendering effects or providing consistent map-rendering performance across platforms.
Specifically, ArcGIS only supports the AR function of 3D scene. It does not support 2D map visualization (including vectors, image maps, network maps, etc.) in AR. Additionally, it does not support real-time ground-proximity visualization and AR effects. It does not support 2D and 3D integrated visualization and real scene associated map visualization for AR. ArcGIS does not support high-performance AR feature visualization (minimization of I/O time consumption). Thus, it is difficult to achieve fast display performance without operational delays. It also does not support multi-cache and parallel graphics processing unit acceleration. Lag occurs when the ArcGIS map data volume is large [23]. Mapbox AR does not support 2D and 3D integrated AR map visualization, does not support ground-proximity visualization, does not support Web browser AR map symbol visualization, and does not support iOS operating system AR map symbol visualization [11,24].
The Open Graphics Library (OpenGL) is proposed for drawing 2D and 3D vector graphics. The application programming interface (API) is designed to interact with graphics processing units (GPUs) for hardware-accelerated rendering [30]. The OpenGL specification describes an abstract API that draws 2D and 3D graphics. Although the API has many language bindings and can be implemented entirely using software, its design is mainly hardware-based and independent of language and platform. OpenGL supports AR 2D and 3D integrated rendering, consistent cross-platform rendering, cross-device and cross-browser hardware acceleration, and unified-style high-volume data batch rendering [29]. Because OpenGL is only a graphical image-rendering library, it focuses on computer graphics as the basic element of encapsulation. It is not designed for AR-GIS map symbolization and mapping, as it does not address packaging of map layers, object avoidance, map management, or other issues. It also does not include AR map wrappers for real scene mapping, spatial modeling masking, or other scenarios [31,32]. Therefore, it is not possible to display large-scale map data directly. It cannot manage map scene data scheduling, cannot display complex map symbols using text- or annotation-type displays, does not support virtual building masking display in AR, and does not support accurate calibration of map symbol data in a real-scale AR display.

3. Materials and Methods

An efficient, platform-independent AR map rendering engine (the augmented-reality universal graphics library (AUGL) engine) is proposed in this paper. The AUGL map-rendering engine consists of a variety of GPU-based rendering strategies, including parallel GPU rendering strategies and cache pool reuse strategies, which are discussed in the subsequent sections in this chapter.
The AUGL engine integrates various rendering strategies based on the OpenGL graphics library. It can draw each map layer via the hierarchical rendering method and save the processed layer results. Finally, it overlays these results to complete the AR map rendering process.
As a method of connecting applications and operating systems, the AUGL engine can display spatial objects on a screen without any platform-specified functions. Based on the OpenGL graph libraries, the AUGL engine is detailed by a unified framework that formally describes the map symbol drawing approaches and map data exchange interfaces. The AUGL engine framework is implemented by the OpenGL for Embedded Systems (OpenGL ES) graphics library in the Android and iOS operating systems, the WebGL graphics library in Web browsers, and the OpenGL graphics library on Desktop GIS. The platform-independent specification ensures AUGL engine interoperability and consistency across different implementations so that users and developers need not worry about the different characteristics of the underlying hardware platform. All of the graphical mapping elements (points, lines, polygons, texts, and effects) are drawn in the same manner and constitute elements of a unified style on every platform. The platform-independent AR map symbol visualization architecture proposed in this paper is shown in Figure 1.

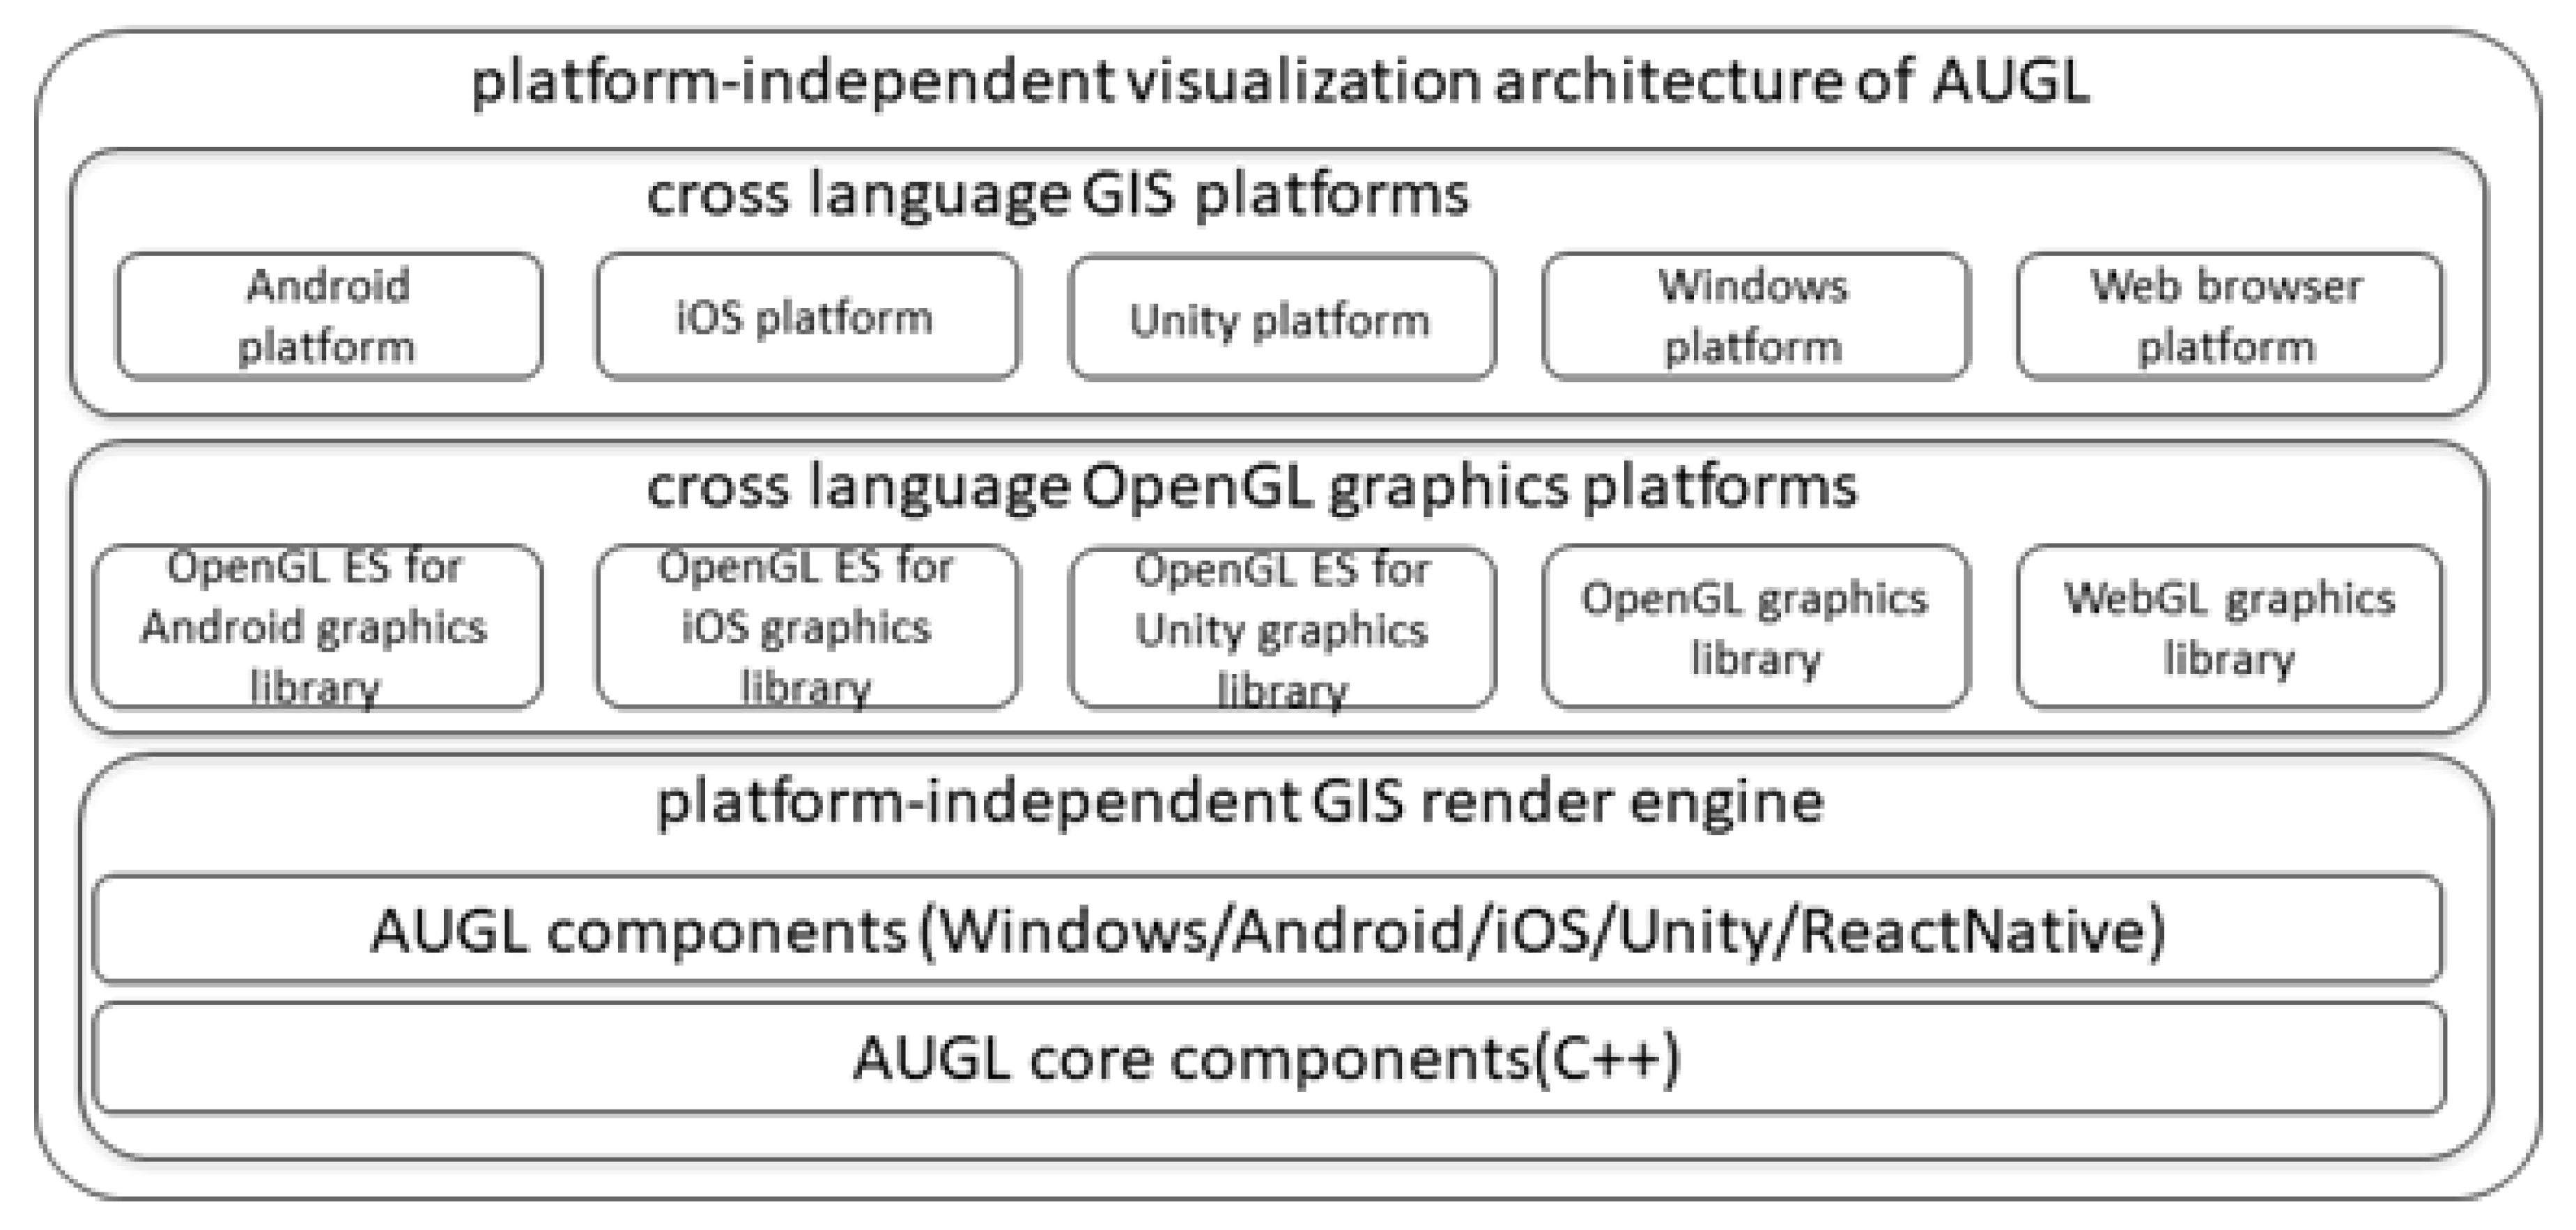
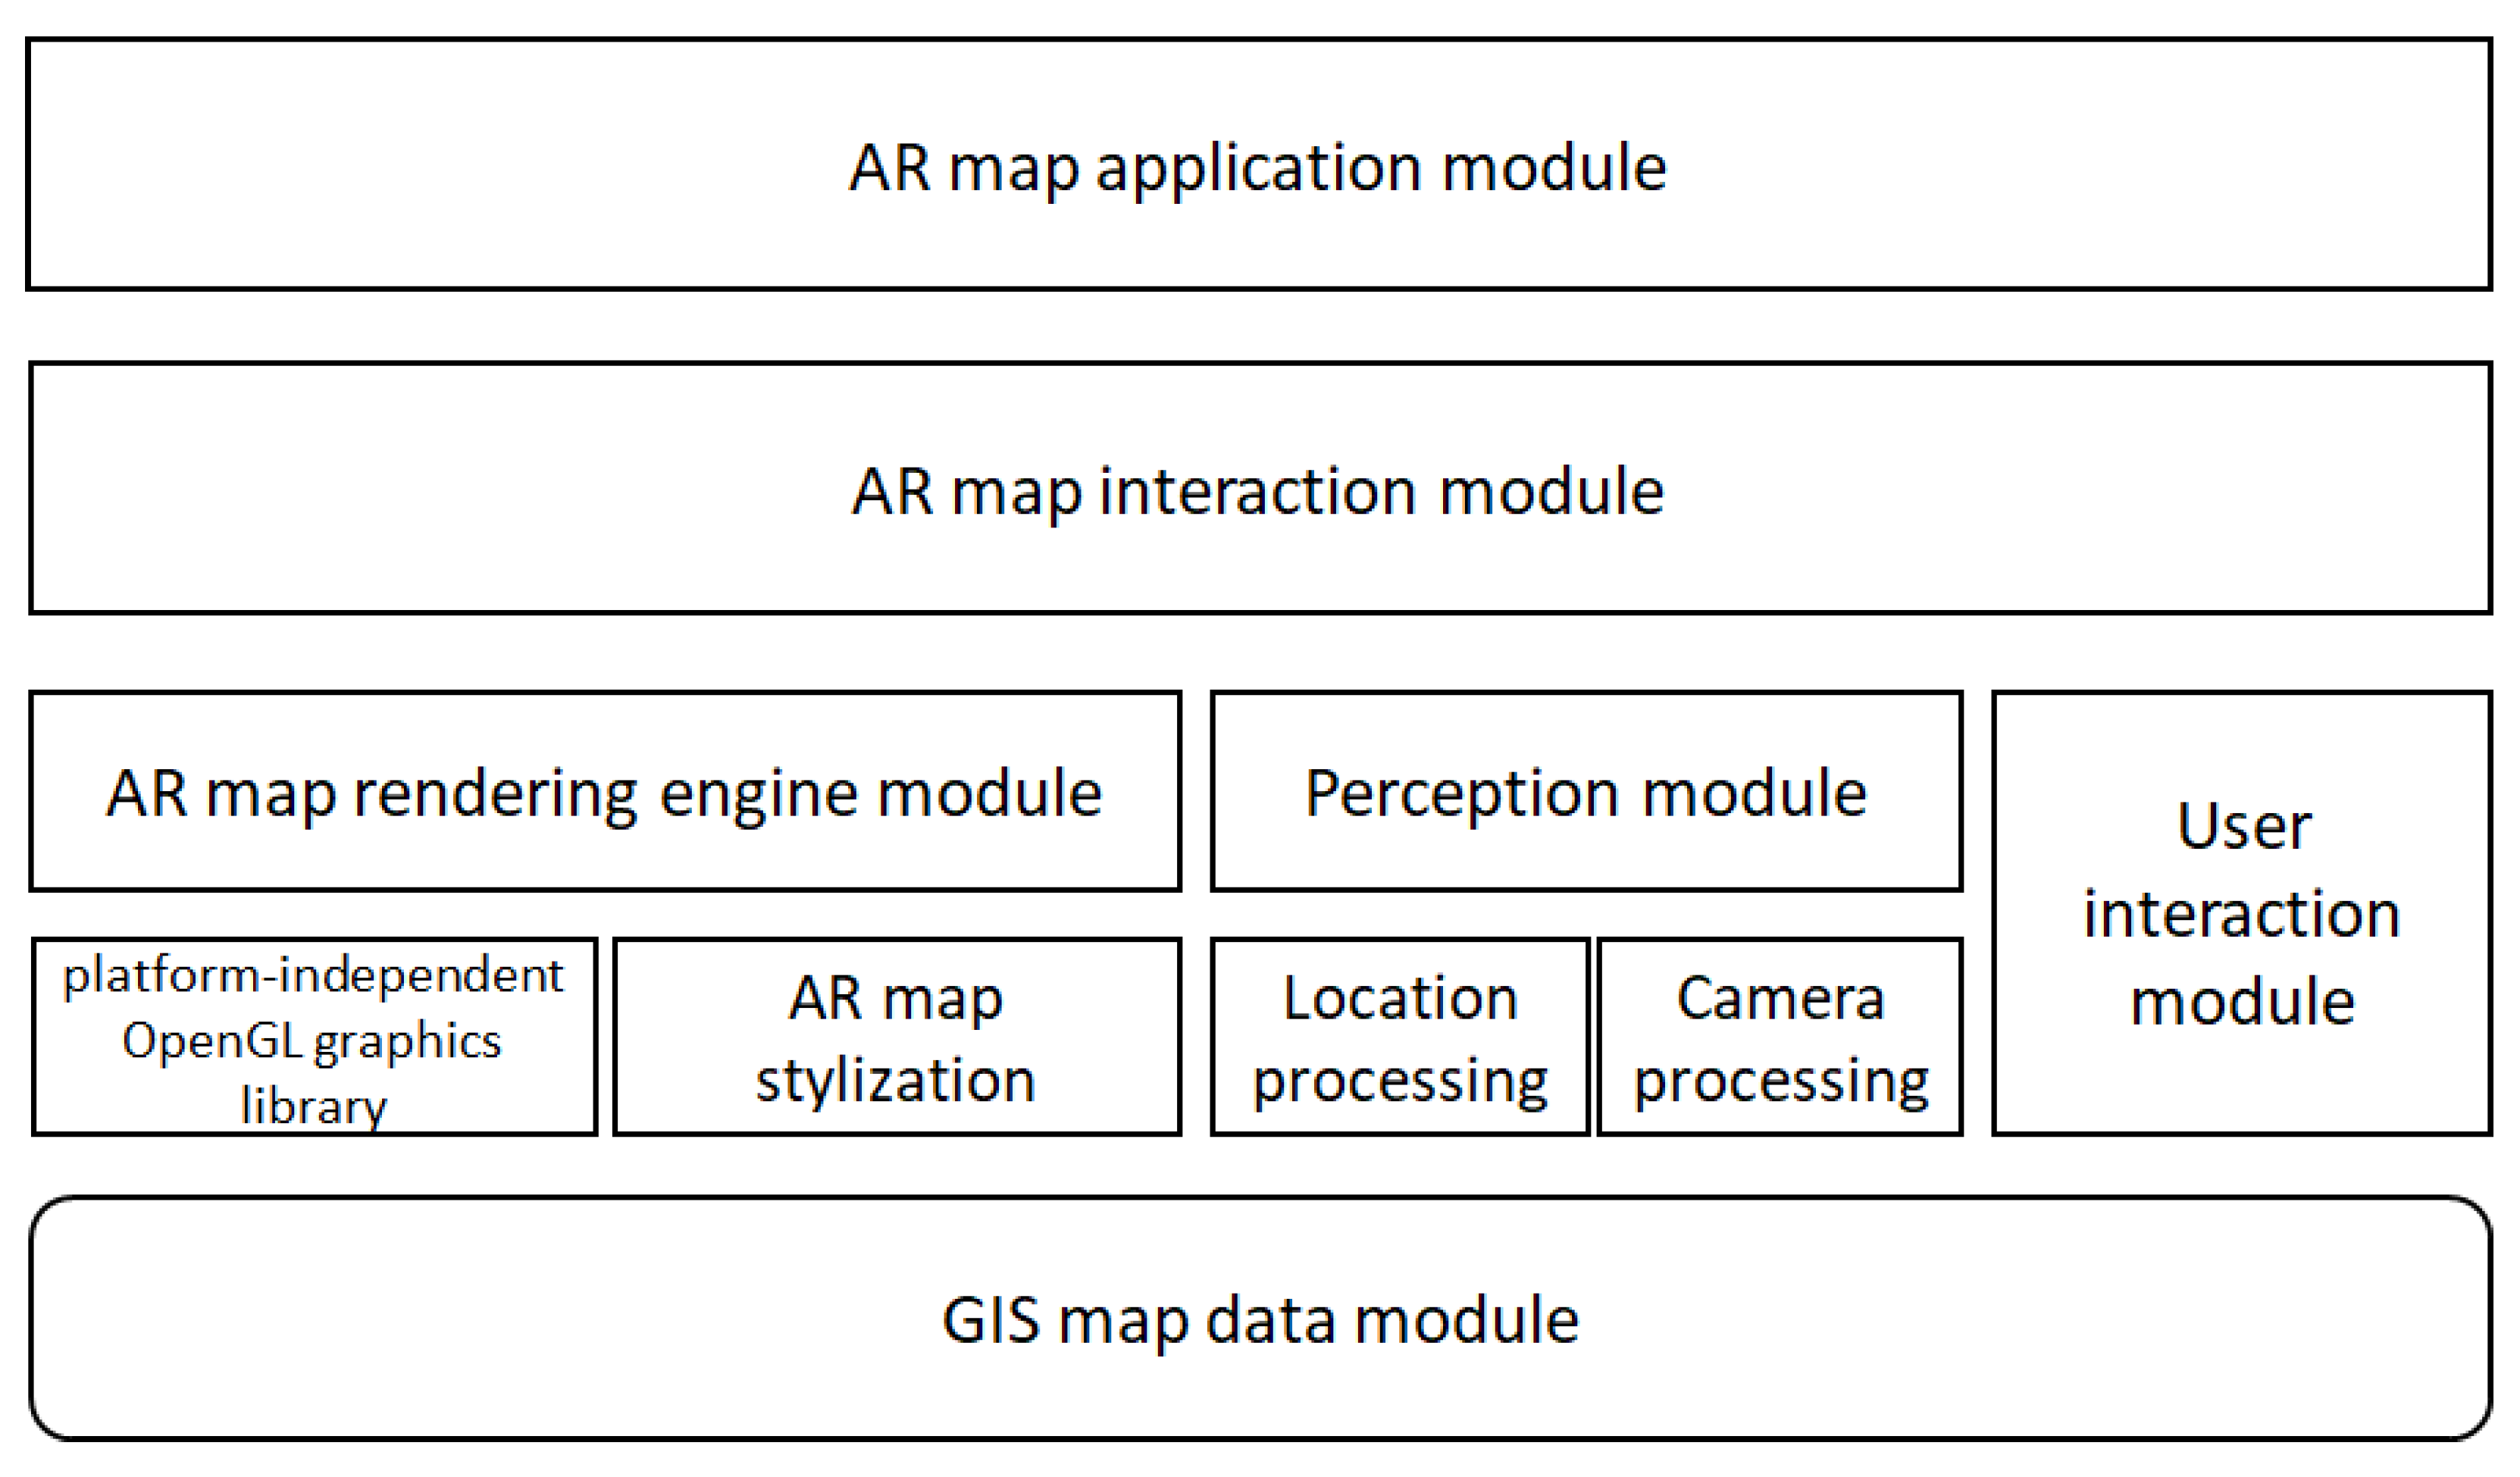
3.1. Architecture of the Augmented-Reality Universal Graphics Library Engine

AR map visualization requires the same data set as conventional map visualization, with dynamic content and metadata information: vector data set, terrain data set, 3D model with or without texture, point cloud and so on. However, because it mainly processes the window area data of the current position, it will be relatively light at the data level. The display content is more complex and lifelike, and the color processing and collection details of virtual elements achieve the effect of augmented reality visualization. Current AR devices, especially mobile Augmented Reality, have limited real-time processing power. In practice, AR-rendered map symbols are always “attached” efficiently and in real time to the corresponding real objects (ground, walls, top of buildings, river surfaces, underground surfaces, etc.), which remains a key issue.
In this paper, in order to consider the specific input information from MAR devices, compared with the traditional classical GIS architecture, our key requirements for AR-GIS include virtual reality combined rendering of occlusion and visibility processing, cross platform consistent map rendering, real-time positioning and camera sensing, user interaction based on pinhole camera model, etc.
Several high-performance spatial computation methods are used to help the AUGL engine provide an efficient rendering process. First, retrieval is accelerated by using dynamically updated spatial database index hit technology (a scheduling technique to improve the retrieval efficiency of spatial index) and dictionary texture caching technology. Second, map octopus tree dynamic memory cache pool technology is implemented to update the cache in real time. Update operation is triggered when the geographic range or stylization of the map symbol data changes.
The modules of AR-GIS rendering engine (AUGL) include a GIS data module, AR map rendering engine module, perception module, user interaction module, AR map interaction module, AR map application module and so on. The architecture of this method is shown in Figure 2.
The sensing module includes two sub modules: location processing and camera processing. The location processing is responsible for estimating the geographical position, velocity and direction of objects in 3D through GNSS. In order to estimate position, GNSS uses a set of satellites and ground stations orbiting the earth. At present, four main systems have been put into use, including GPS of the United States, GLONASS of Russia, Galileo of the European Union and Beidou of China. In this paper, AUGL is compatible with the above four positioning systems and takes advantage of the above GNSS system. Because the geographical location accuracy of GNSS is affected by many errors, including ionosphere, building reflection, etc., in order to eliminate these errors, the AUGL positioning module supports access to the high-precision differential system, uses the most advanced RTK and PPP technology of precise point positioning, and connects the high-precision receiver through Bluetooth, which can achieve centimeter-level accuracy. At the same time, in order to achieve the purpose of low power consumption, strong autonomy and convenient portability, it supports access to high-precision consumer mobile devices (e.g., Huawei P40 and mi11 ultra). Without connecting any receiver, the accuracy can reach centimeter level [33,34]. This is used for positioning and azimuth estimation (3D absolute coordinates, pitch angle, yaw angle, roll angle). Camera processing is responsible for acquiring 6-DOF through attitude estimation of equipment motion. During this period, centimeter-level relative attitude information is obtained in real time according to camera parameters (mainly external parameter changes). These accurate 6-DOF relative attitude information is fused with absolute position obtained by location processing to ensure that the equipment in motion can acquire high-precision coordinate reference in real time, it is a prerequisite to generate enhanced image to realize the facility of accurately depicting the real world through AR.
The GIS map data module is responsible for parsing geospatial data in an MAR (mobile augmented reality) scene into a data format that the AR map rendering engine module can organize hierarchically. It is mainly responsible for reading, converting, registering and other parsing operations of spatial data, and encodes the parsing results into a unified layer data unit of AR map. The data of this module include vectors, rasters, 3D spatial data (3D vectors,3D networks, voxel grids, etc.), RTSP service, text address data, picture and video recorded by mobile phone camera or UAV camera, etc. These data types will meet the conditions of AR map rendering after parsing.
The AR map rendering engine module is used to parse the output of AR map data module into OpenGL recognizable format, and render the visualization results of corresponding symbol types according to the rules of map stylization. It includes two sub modules: cross platform OpenGL graphics library and AR map symbol processing. The cross platform OpenGL graphics library is responsible for unifying the rendering algorithms of multiple language platforms (Android, iOS, Web, unity, etc.), triangulating and occlusion culling the spatial geometric data, converting all geographic coordinate data into vertex data in the future, and packaging them into batch cell objects to be drawn. The AR map stylization sub module is responsible for the batch unit objects output from the OpenGL graphics library. According to the map rules [35,36], it carries out the stylized objects such as symbols for area, lines, points, annotations, vector tiles and grid tile symbols and image symbols, and calls on the graphics library API operation to render these stylized objects as visual data. Finally, the OpenGL state machine is used to control the data exchange API of the rendering pipeline, and the visualization results are displayed on the screen.
The AR map interaction module is responsible for calculating and responding to the interactive operations generated by the user interaction module according to the location data generated by the positioning and camera module. When combined with AR, the classic mouse or touchpad controller is replaced by the user movement tracked by AR devices. Additionally, this kind of map visualization usually needs absolute positioning relative to the global earth frame, so user interaction needs to accurately handle the absolute attitude of AR devices. These operations include screen gestures (pitch, zoom in, zoom out, rotate, pan, select, double-click, capture, magnifying glass, etc.) and customized button commands (local redraw, global redraw, add, delete, modify, query, geometry edit, etc.). The module supports the encapsulation of these operations into events, and provides active notification methods. The combination of these methods can facilitate users to complete tasks.

3.2. High-Performance AR-GIS Rendering Engine Parallel Computation

The need to visualize large amounts of data in map windows is growing rapidly [37] as display technologies and devices such as high-definition (HD) mobile screens, large LCD/LED screens, HD projectors, display walls, and immersive virtual environments are increasingly used in geospatial applications to visualize large spatial areas with rich details. On the other hand, the age of big data has made vast amounts of geospatial data widely available for use in a variety of GIS applications that require real-time or near real-time responses to solve complicated geographic problems. Therefore, high-performance map visualization is essential not only for online map services, but also for offline geospatial computing.
In this paper, we use a variety of methods to achieve high-performance spatial computing in the rendering process. On the one hand, spatial database index hit technology based on dynamic update and dictionary texture cache technology is used to speed up the retrieval process. On the other hand, in order to update the cache in real time, the map octopus tree dynamic memory cache pool technology is implemented, and the update operation is triggered when the geographic range and style of map symbol data change.

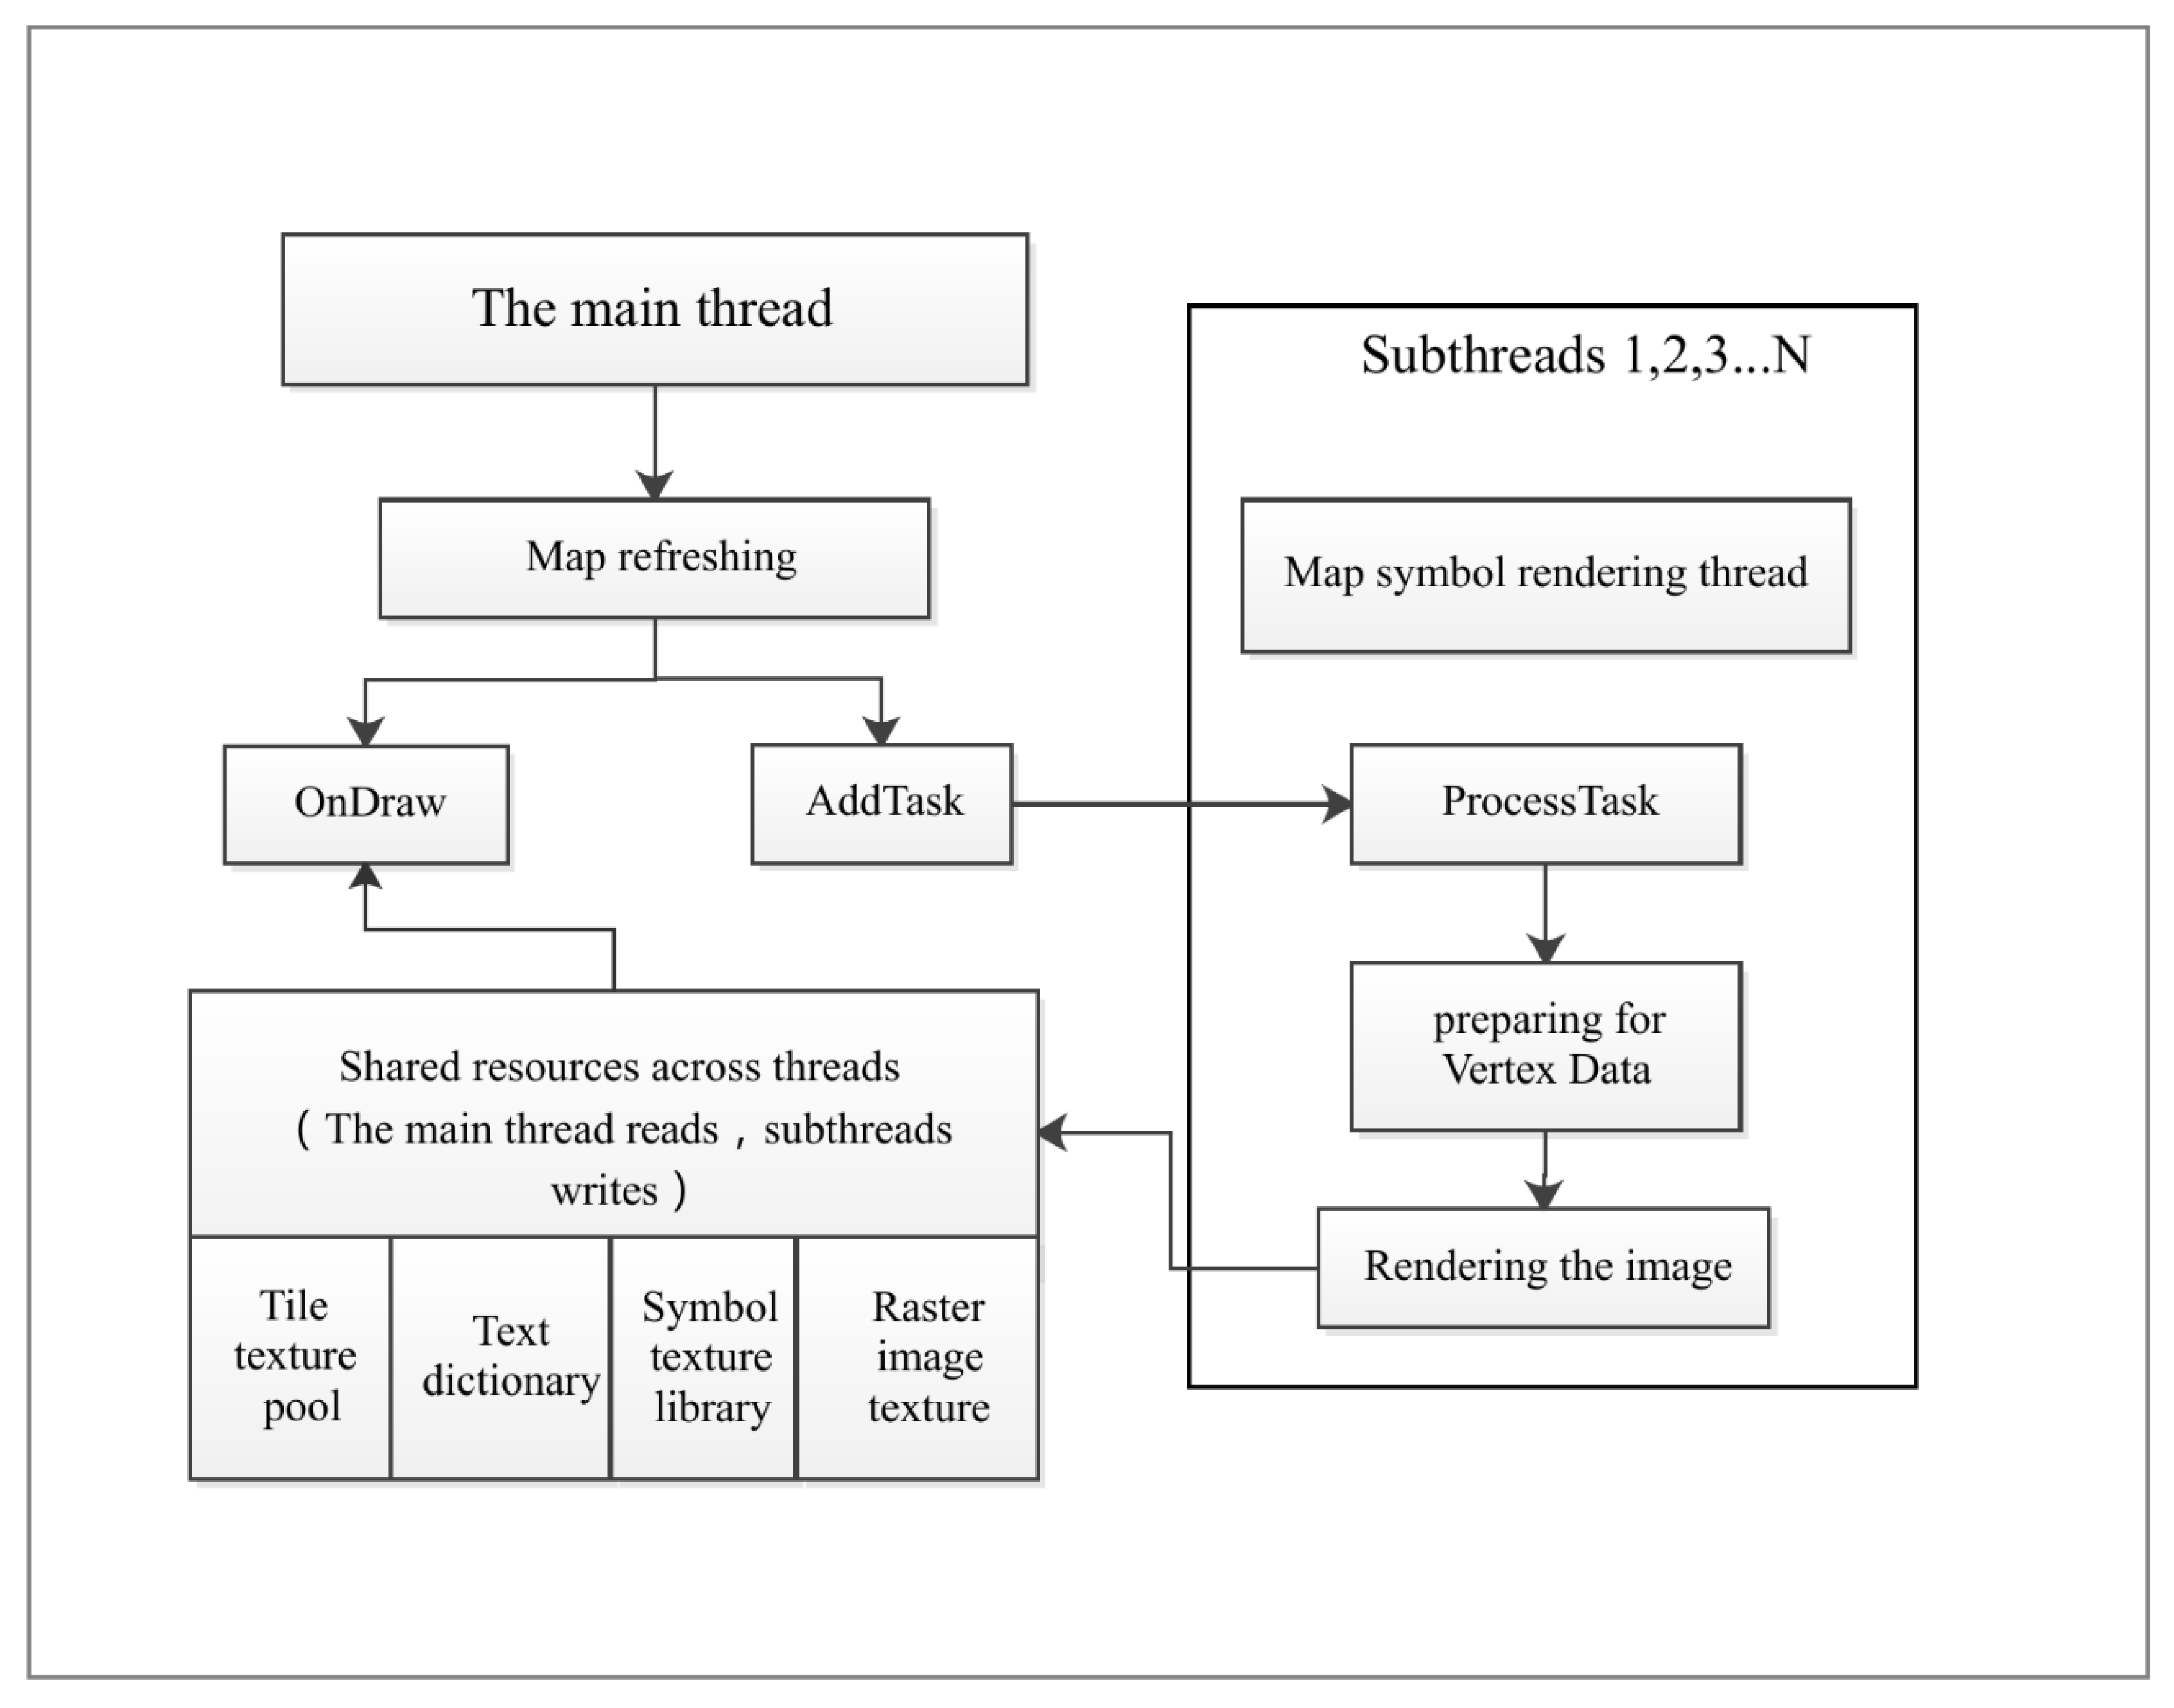
3.2.1. AR-GIS Map Symbol Parallel Processing Framework

Parallel computing is an efficient way to process some tasks via multi-threaded or parallel processes. The computing nodes used in parallel computation are connected via a network and can achieve parallel data transmission acceleration and computational efficiency. Parallel GIS technology applies parallel computing technology to parallel storage, query, retrieval, and processing of massive annotation data, and provides the ability to process massive spatial geographic data by establishing software systems with fast response speeds and high operational efficiency. A new generation of multi-core, parallel high-performance computing integrated with high-performance parallel rendering computing technology and algorithms has become an area of interest in GIS mapping [38].
In order to take full advantage of the mobile augmented reality (MAR) spatial adaptive decomposition method, we have developed a rendering parallelization framework for AR map symbols in multi-core environments (Figure 3). When the first drawing task is generated, the framework generates multiple data layers for different symbolization levels based on the original data. These layers include the vector layer, raster layers, text layers and other layers. The data structure for rendering layers is the symbolic data. It contains the rendering behaviors and some useful information for drawing geometries and raster objects (e.g., categories of symbol for spatial data, the collection of coordinates, the drawing style). Spatial data are acquired for each data level within the current AR viewport location map, and multiple uniformly distributed grid symbol data are created. These data are distributed to different drawing sub-threads through the adaptive decomposition method, and the drawing sub-thread launches the AR map symbol processing, and queries, retrieves, transforms and renders the corresponding characteristics of the data in the grid. The drawing results are sent to the shared resource thread for aggregation and stored in the buffer pool. The shared resource thread is responsible for sending the drawing results to the main thread when the main thread map is refreshed or when the customizer is triggered. The main thread loads the sub-image results of these AP maps, and merge all the sub-image textures into the final view displayed in the AR viewport. Additionally, the entire process of parallel drawing of AR map symbols is completed.
The generation and drawing of symbolized data in each grid is completed in the drawing sub-thread. Therefore, any operation of the main thread will not increase overhead to the visualization task of the drawing sub-thread. At the same time, since the display and update of the symbolized data in each grid are completed in the main thread, time-consuming operations such as query, retrieval, conversion and rendering of the drawing sub-threads will not increase the amount of calculation to the display of the main thread’s visualization results.
Moreover, to accelerate application of the coordinate conversion process to large volumes of AR map symbols, the GPU is used instead of the CPU to perform vertex transformations of texts. This reduces the time overhead associated with transferring large amounts of geographic coordinates from the host memory to the GPU device. In this article, we use multiple subtasks processed by multiple computation units to draw map symbols in parallel. Examples include transformation of map symbols from geographic coordinates to OpenGL Render Object [39] in a multi-threaded manner using multiple CPUs and transformation from a OpenGL Render Object to screen coordinates by using multiple GPUs (multiple cores) to perform sub-processes and thus reduce computing time. Although parallel computing has been widely used in GIS software [40,41,42], this paper proposes a combined parallel computing method of multi CPU and GPU multi-core to accelerate the conversion of geographic coordinate data.
The parallelization framework provides a general platform for accelerating the visualization of various map symbol data and for quick responses to real-time map visualization view interaction requests for large amounts of data.

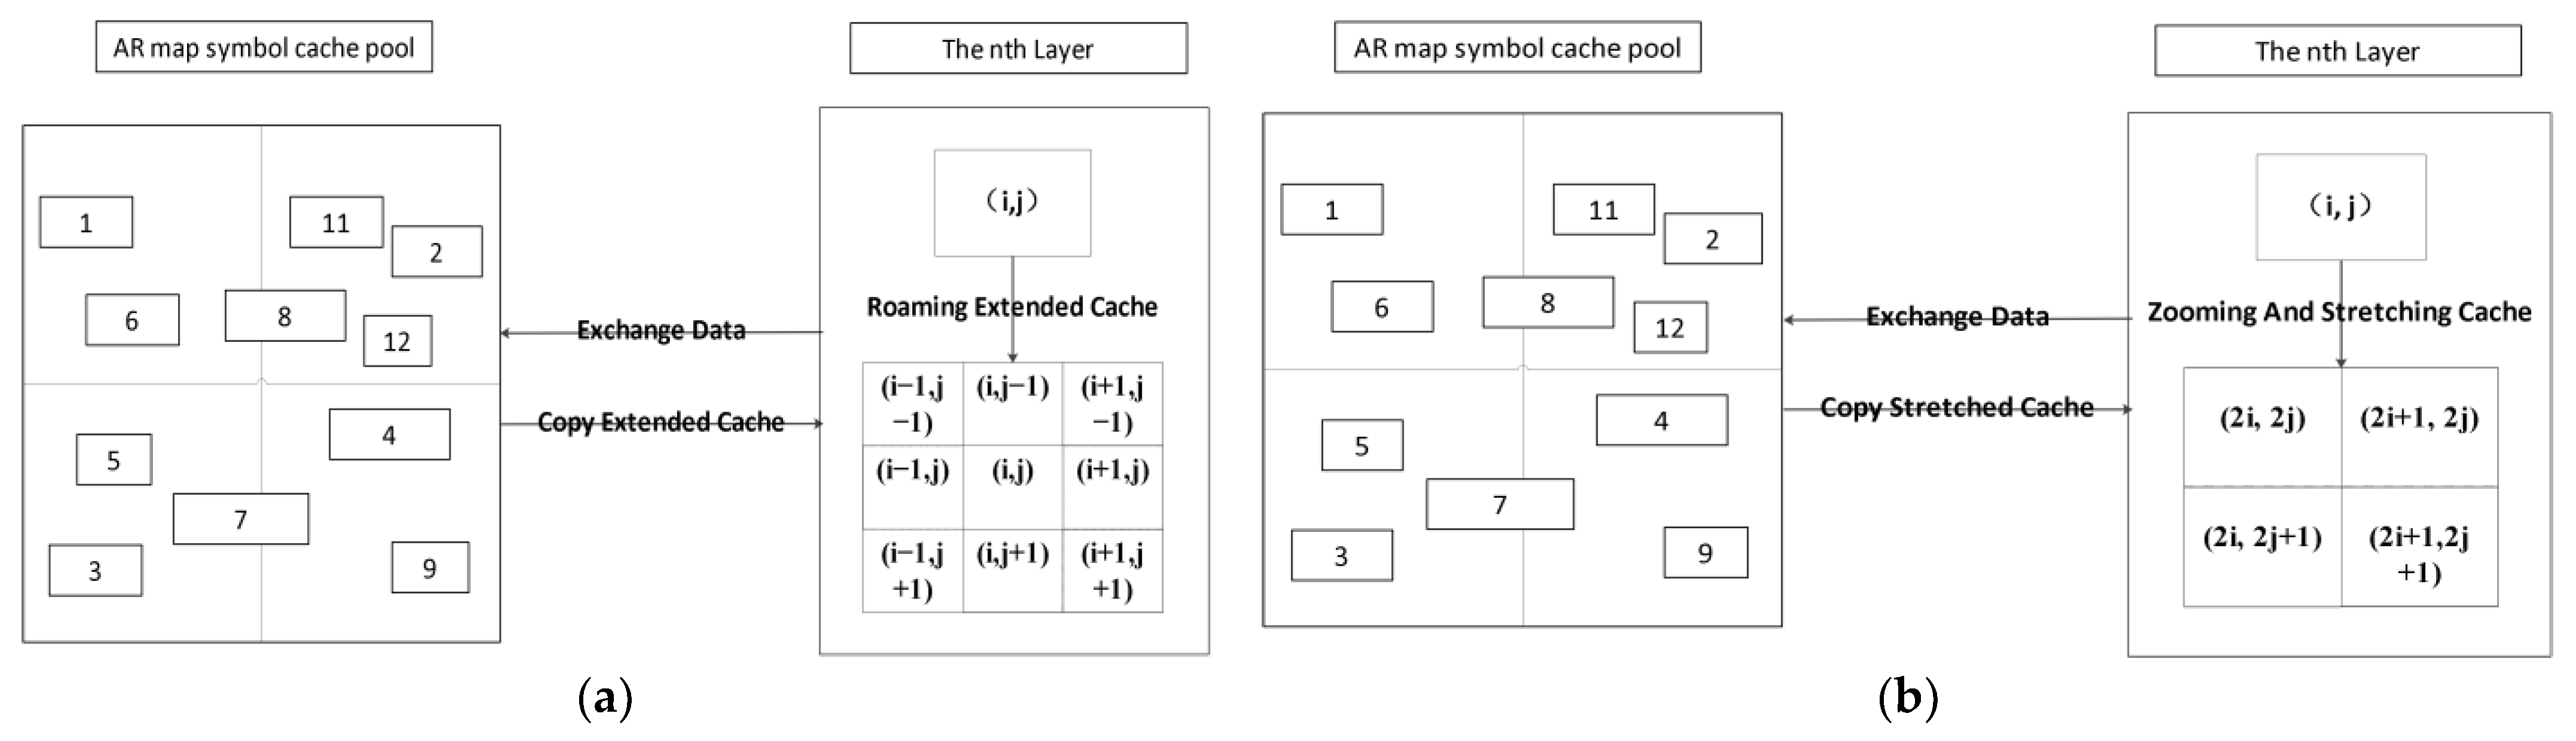
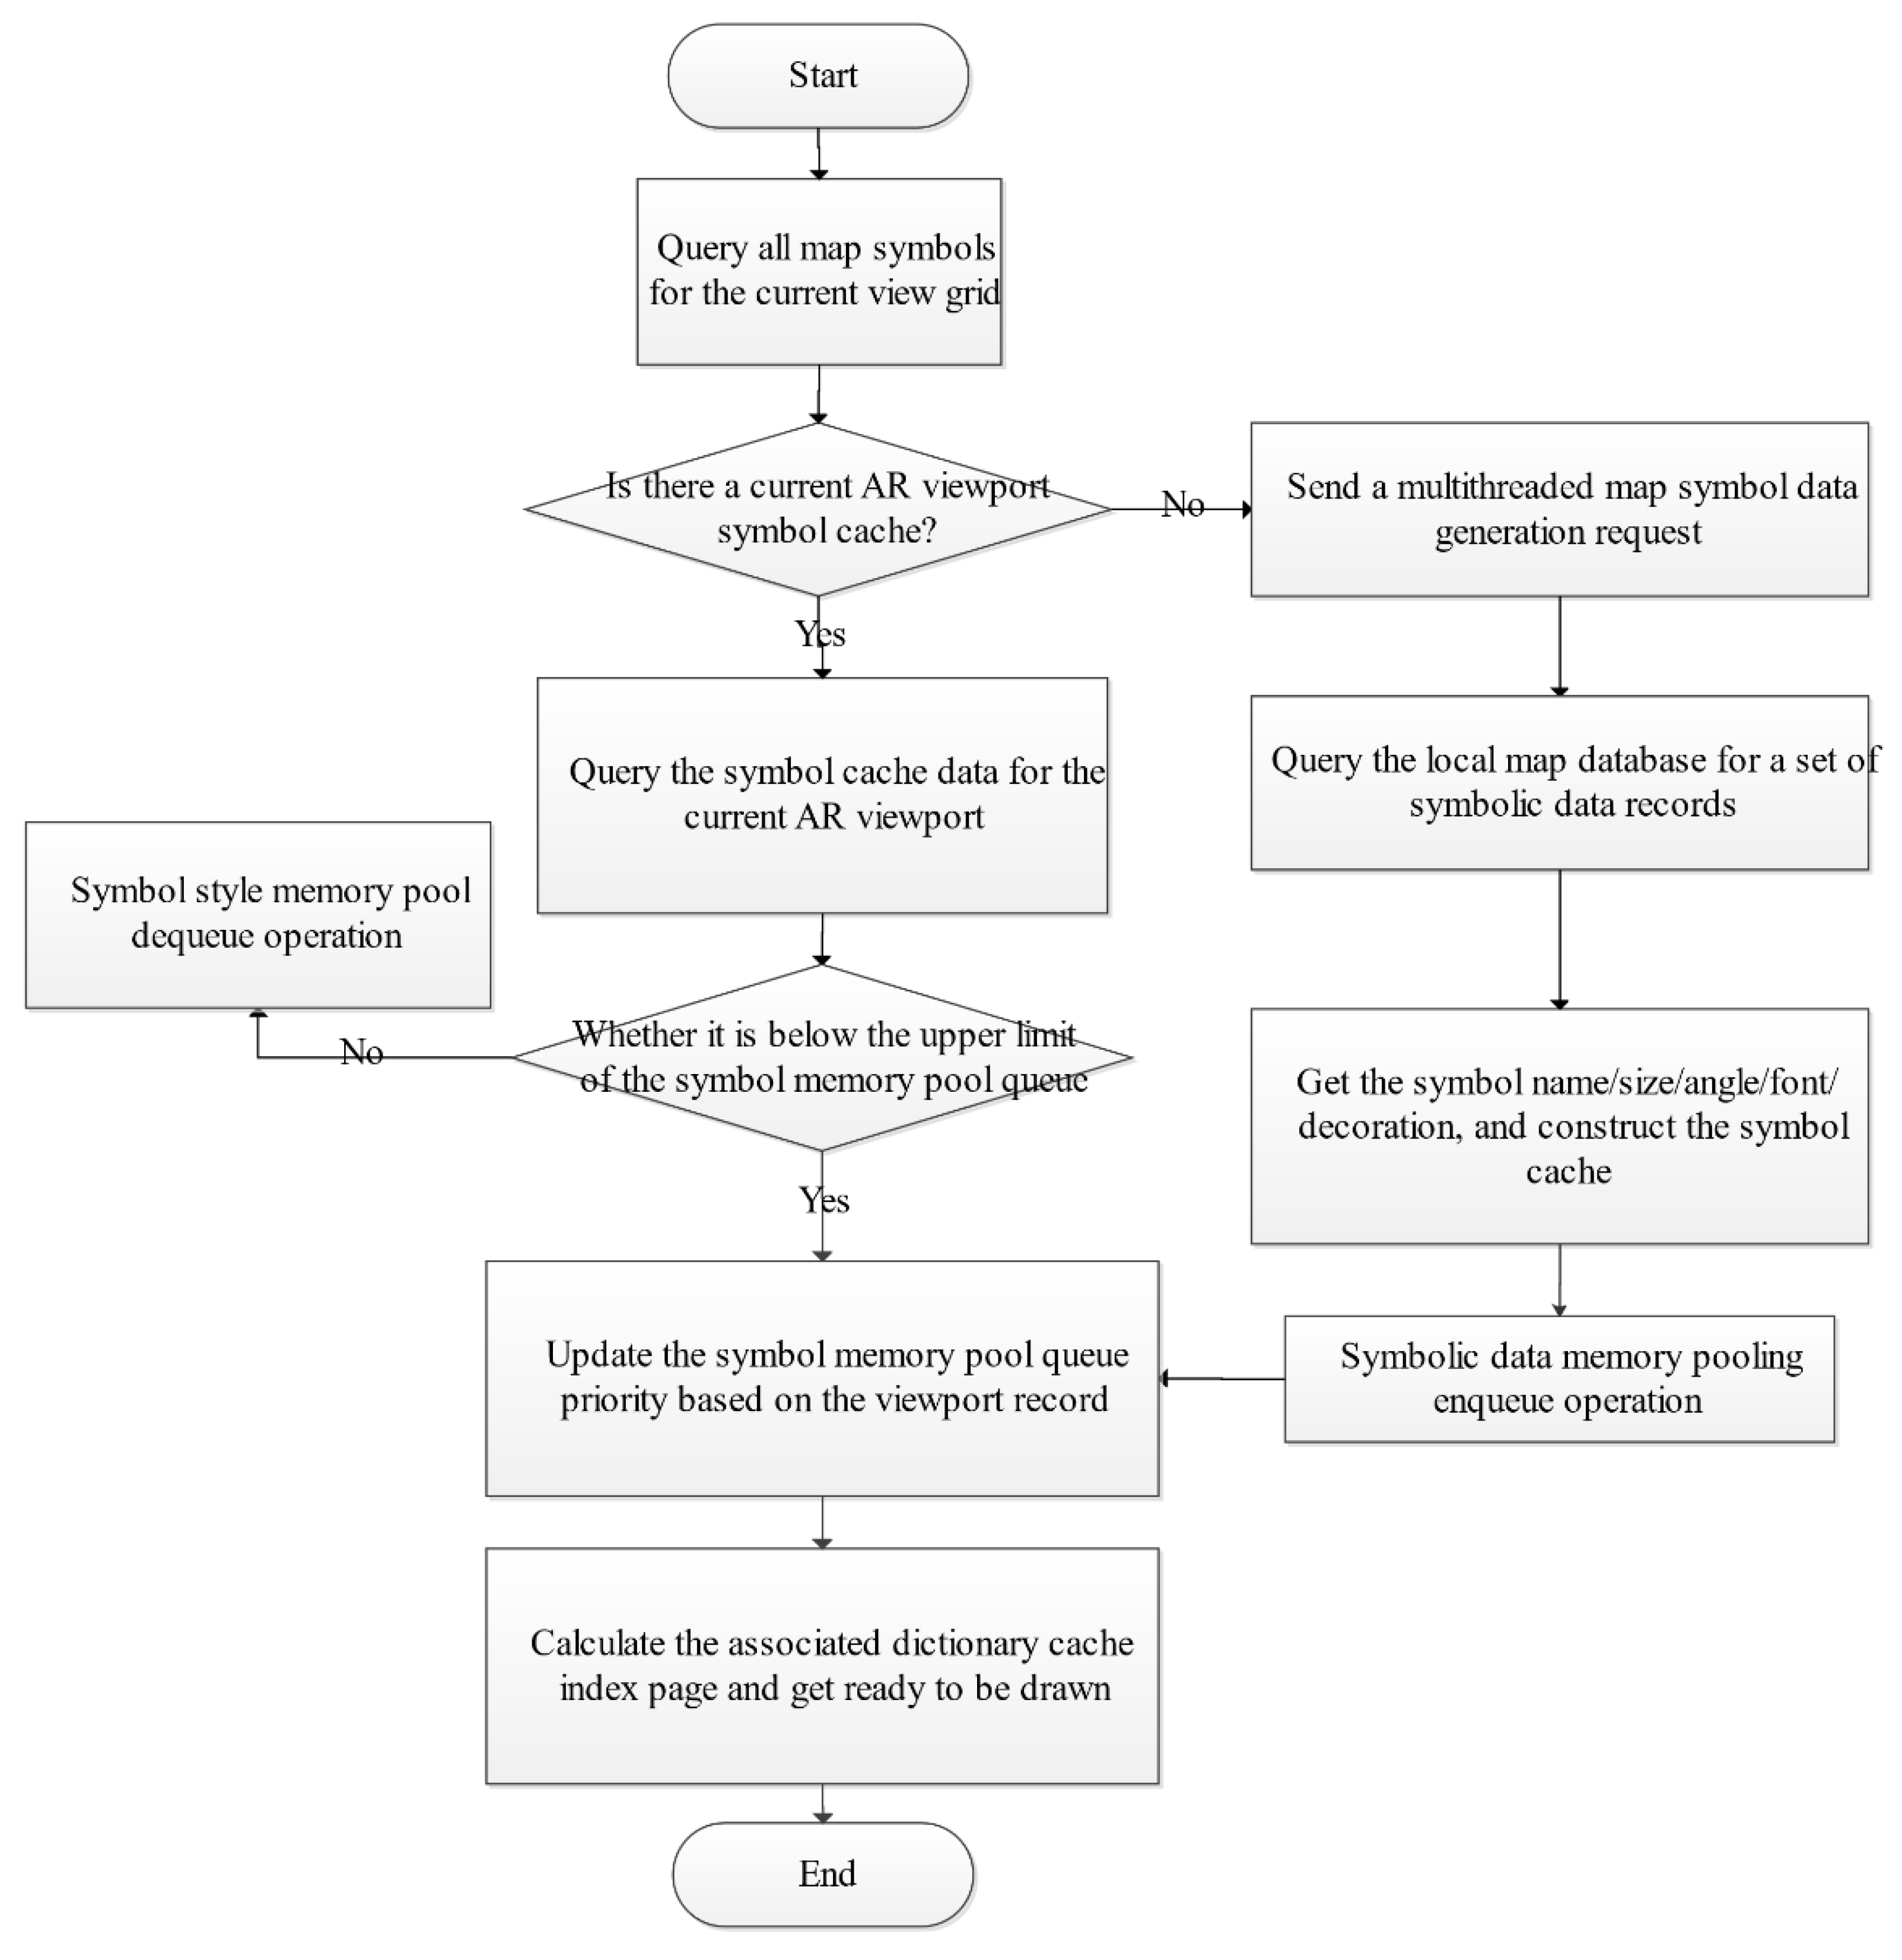
3.2.2. High-Speed AR-GIS Map Symbol Cache

Processing of the AR map symbol element visualization style requires extensive drawing pre-processing time. The AUGL engine provides a map symbol data cache scheme based on load balancing memory pool technology. Cached data storage and reuse of cache loading are key to making full use of the cached map symbol data.
Image data caching strategies include horizontal and vertical methods. As shown in Figure 4A, the image (i, j) in the current view area of layer n is attached to the AR map windows for map symbol visualization and imported into the cache pool. The surrounding images (i − 1, j − 1), (i, j − 1), (i + 1, j − 1), (i − 1, j), (i + 1, j), (i − 1, j + 1), (i, j + 1), and (i + 1, j + 1) represent its extension in layer n. In the vertical, (i, j) represents the image of layer n and the subsequent four graphs indicate that the image of layer n corresponds to the four images divided by scale parity rules at the n + 1th layer (Figure 4B). Cached images in layer n − 1 are divided into images according to the same scale rules and only occupy 1/4 of the spatial range of the nth layer (i, j) images.
During the caching process, it is essential to check for and remove duplicates between the extended image of the nth layer image (i, j) and other images in layer n, as well as duplicates between the stretched image of the nth layer image (i, j) and the n − 1th layer and other extended images. Images in memory are loaded from disk files first and then exported into the cache pool.
The cached data loading method is shown in Figure 5; the nth layer scale stores all of the extended images of that layer and layer n−1 stores all of the stretched images that are smaller than the current scale bar. The n + 1th layer stores all of the stretched images that are larger than the current scale bar. The images are loaded during the display process using the texture traversal order: layer n > layer n + 1 > layer n − 1. The exact loading process is as follows:
(1)
The user browses the map to the nth layer and sends a display request to the system.
(2)
The system automatically traverses all of the images of the nth layer in the cache pool. The images are transferred directly to graphics memory for display. Images in the blank area are overwritten to visualize the latest images in the current area intuitively.
(3)
Traversing the image of the n + 1th layer in the cache pool. If an image intersects the current view area and has a scale bar greater than the current view area, the texture cache is stretched into the graphics memory for display via texture mapping technology, overwriting the blank area of the image.
(4)
Traversing the n − 1th layer image in the cache pool. If an image intersects the current view area with a scale less than the current view area, the texture is stretched to the graphics memory for display via texture mapping technology, overwriting the blank area of the image.
(5)
Traversal of all images in the nth layer. All images that intersect the current view are copied to memory, and images of the n + 1th or n − 1th layer are replaced to ensure that the final displayed image is up-to-date with no remaining stretched images.
This module of the AUGL engine is used to obtain style information for annotation initialization, including name, size, font, angle, type, italics, decoration, combination information, etc. It also serves to prepare these symbols as a collection of object information to be drawn for quick acquisition and coordinate transformation when drawing map symbols per frame. During the map symbol drawing process, the symbol style cache is constructed from the symbol and thematic layers in the order in which the symbol layers are acquired. The annotation style caches that are not included in the annotation style memory pool are attached to the annotation style memory pool via queuing operations. If the number of memory pools exceeds the upper limit of 256, the update algorithm is automatically performed according to the annotation of the current viewport and historical browsing record, filtering out the annotation style cache data to be removed. The number of memory pools online can be adapted dynamically according to the operating system memory.
When a new map annotation drawing task is launched, the priority is to search for the annotation style cache in the memory pool. If the same annotation name or style, such as annotation collection decoration information, is present, it is obtained directly from the memory pool. This strategy enables a large number of annotation style reuses. For map zoom browsing with different scales, there are small changes in the generated map annotations. Most of the annotations can be queried in the memory pool without frequent updates. In this case, the reuse rates of the name and decoration annotation style are quite high. For map panning operations in different spatial ranges, the generated map annotation changes greatly due to fundamental changes in the current viewport display content. New annotations for drawing are updated frequently. Therefore, memory pools must update the cache frequently and remove items from the cache in the order that they are created when the upper limit is exceeded. In this case, the symbol style and font type reuse rates are high. According to the frequency of symbols appearing in the map browsing process and symbols in the current viewport to establish a comprehensive evaluation algorithm, the map symbol style is obtained via the memory pool via key-value pair data organization and matched to the dictionary texture cache to obtain the specified symbol drawing image style directly. The entire caching process is shown in Figure 6.

3.2.3. GPU-Based High-Speed Pre-Processing for OpenGL Render Objects (RO)

Calculating the screen coordinates from the geographic coordinates is the most time-consuming part of the mobile augmented reality drawing process. First, the specified geometry of the GIS layer is set, and when it comes to different GIS spatial data, we decide whether to perform this step in bulk, depending on the amount of data and the characteristics. Since OpenGL only supports triangles and points and line primitives, we need to represent GIS geometry as a combination of three basic components before preparing to be assigned to the OpenGL state machine. According to the principle of OpenGL rendering pipeline coordinate system transformation, shown in Figure 7, the geographic coordinates must be transformed into OpenGL render objects (RO) (i.e., model coordinates in the model coordinate system). These vertex data are then assembled into drawing elements according to the properties of vertex objects, combined with GIS symbolization rules, and then cropped to compare the elements with the view of the user’s crop plane and the model projection matrix, discarding the elements located outside the view and crop plane. By setting the calculation of OpenGL rendering pipeline matrix transformation, GIS graphics data are converted into a pixel matrix that can be displayed by the device screen. The transformation pipeline operates in the following order: model coordinate system- > world coordinate system- > camera coordinate system- > projection. Finally, the blanking operation is performed, that is, the obscured objects are cropped to obtain the window pixel coordinates that the GIS geometry object finally displays. The principle of pre-processing AR-GIS geographic coordinates based on OpenGL rendering pipeline is shown in Figure 7.
The transformation of the AR map from geographic coordinates to screen coordinates can be divided into two stages. In the first stage the geographic coordinate system of the map is obtained and the ellipsoid of the geographic coordinates is determined. AUGL uses WGS84 by default, and the ellipsoid can also be modified according to the meta-information of the map. According to the projection coordinate system of the map, the geometric objects of the map are converted into geometric objects of the specified projection coordinate system, that is, from geographic coordinates to rectangular coordinates. The rectangular coordinates of these geometric objects are used as the input coordinates of the first stage. the data are converted (description information of geometric objects on the map) to OpenGL state machine parameters. The basic idea is to convert complex geometry into a combination of three basic elements that OpenGL can render and to accelerate the time-consuming process of converting map symbol data into vertex data by parallelizing a multi-threaded calculation. The second stage transforms OpenGL render objects (RO) into screen coordinates, which is also a time-consuming process [43]. The transformation of OpenGL render objects (RO) is calculated using the GPU, which is much faster than a CPU. The structured map symbol data characteristics are preserved so that the map symbol data can be converted into screen coordinates in bulk and a large number of symbol data pre-processing mechanisms can be converted in batches.
The mobile augmented reality (MAR) studied in this paper supports the general mobile GPU hardware architecture. At the same time, we use multithreading to transfer the opengl rendering objects (RO) of these map symbol data from the host memory to the global memory on the GPU, which greatly reduces the conversion time of OpenGL rendering objects (RO) on various smartphones [44].

3.3. The AR-GIS Rendering Engine Map Symbolization Core

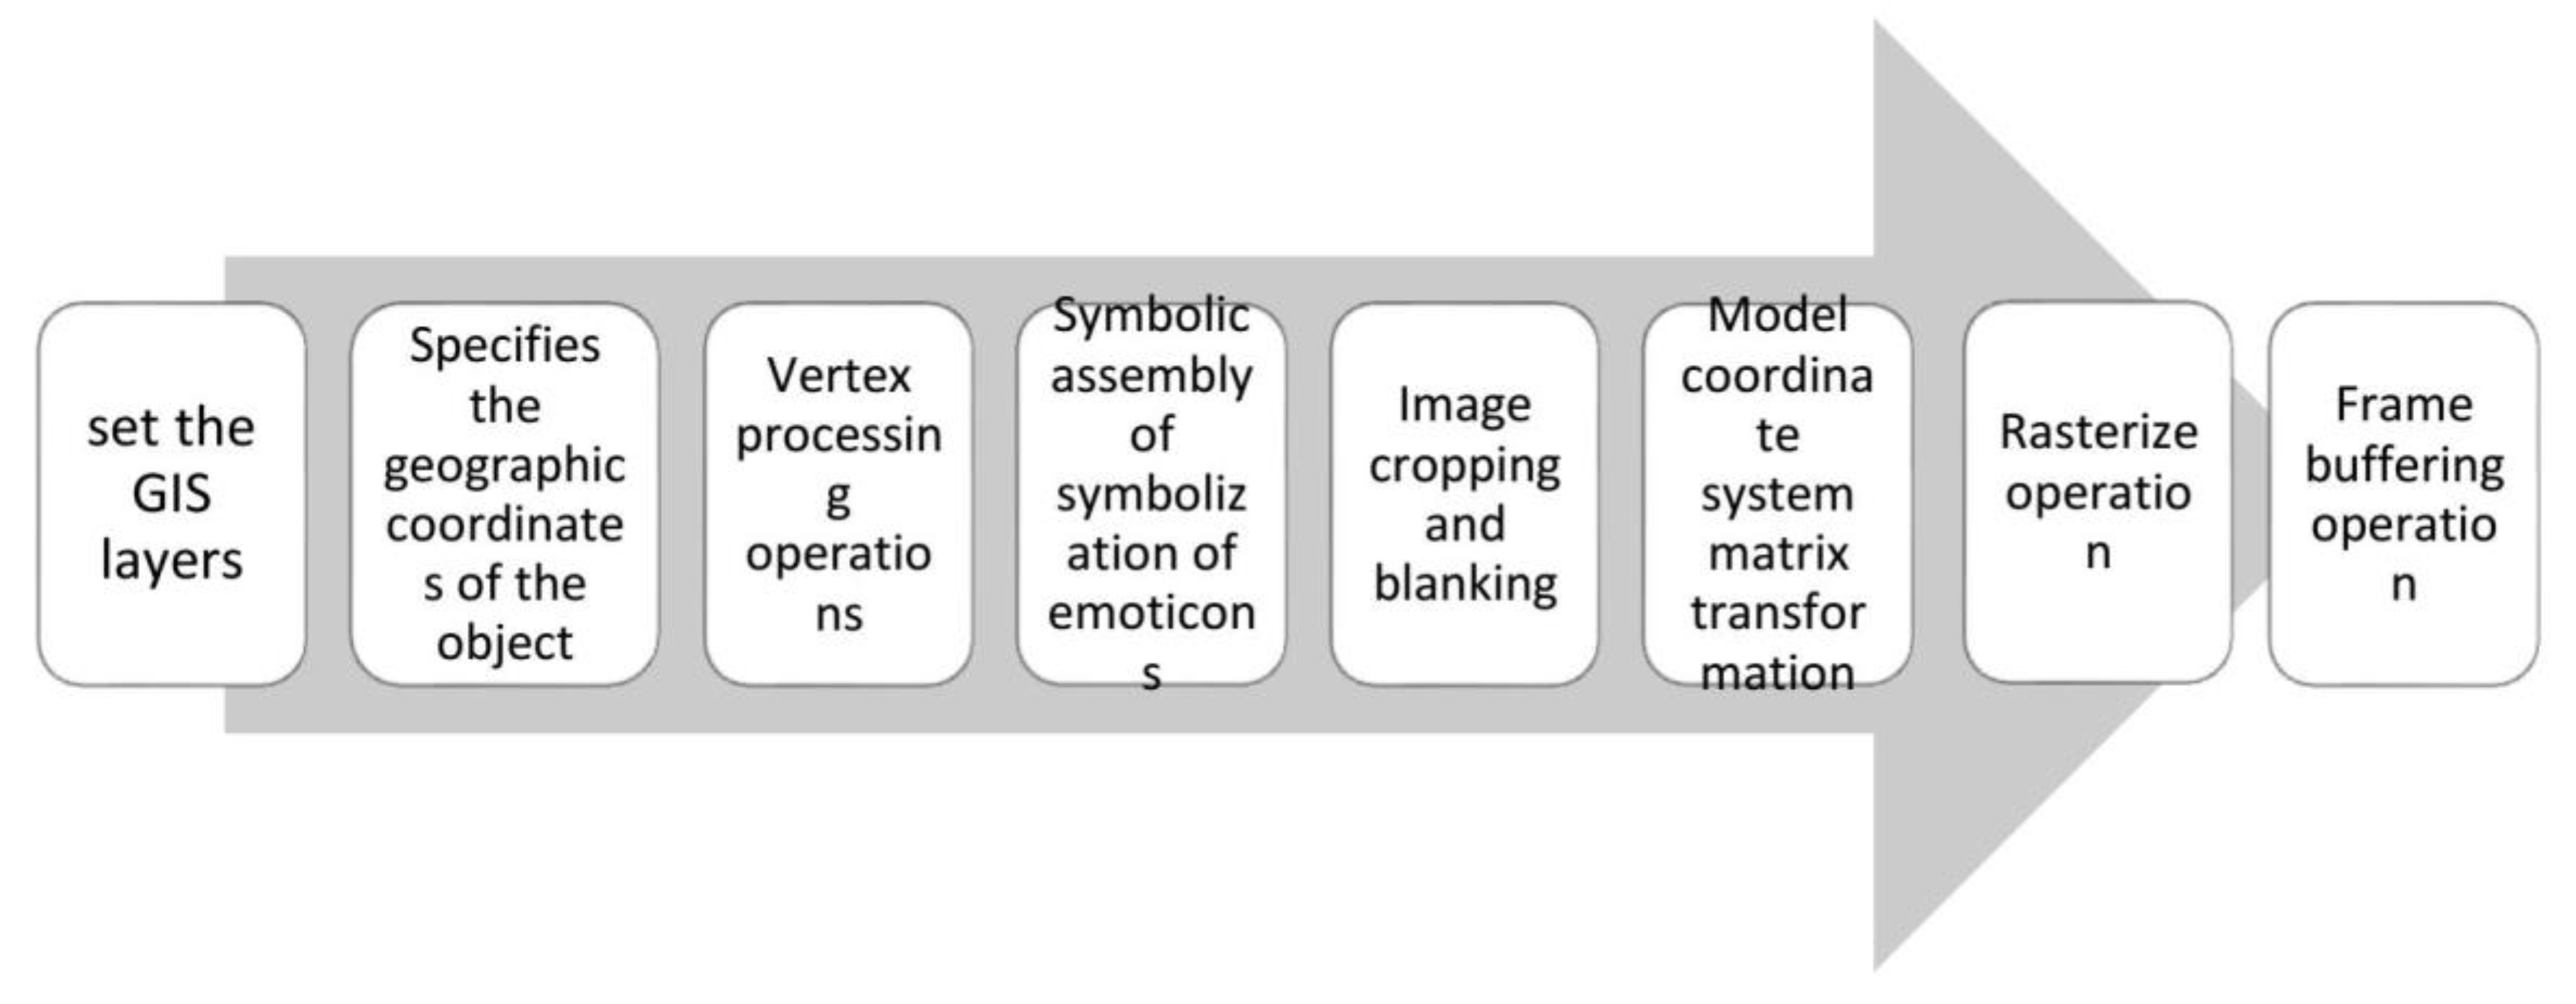
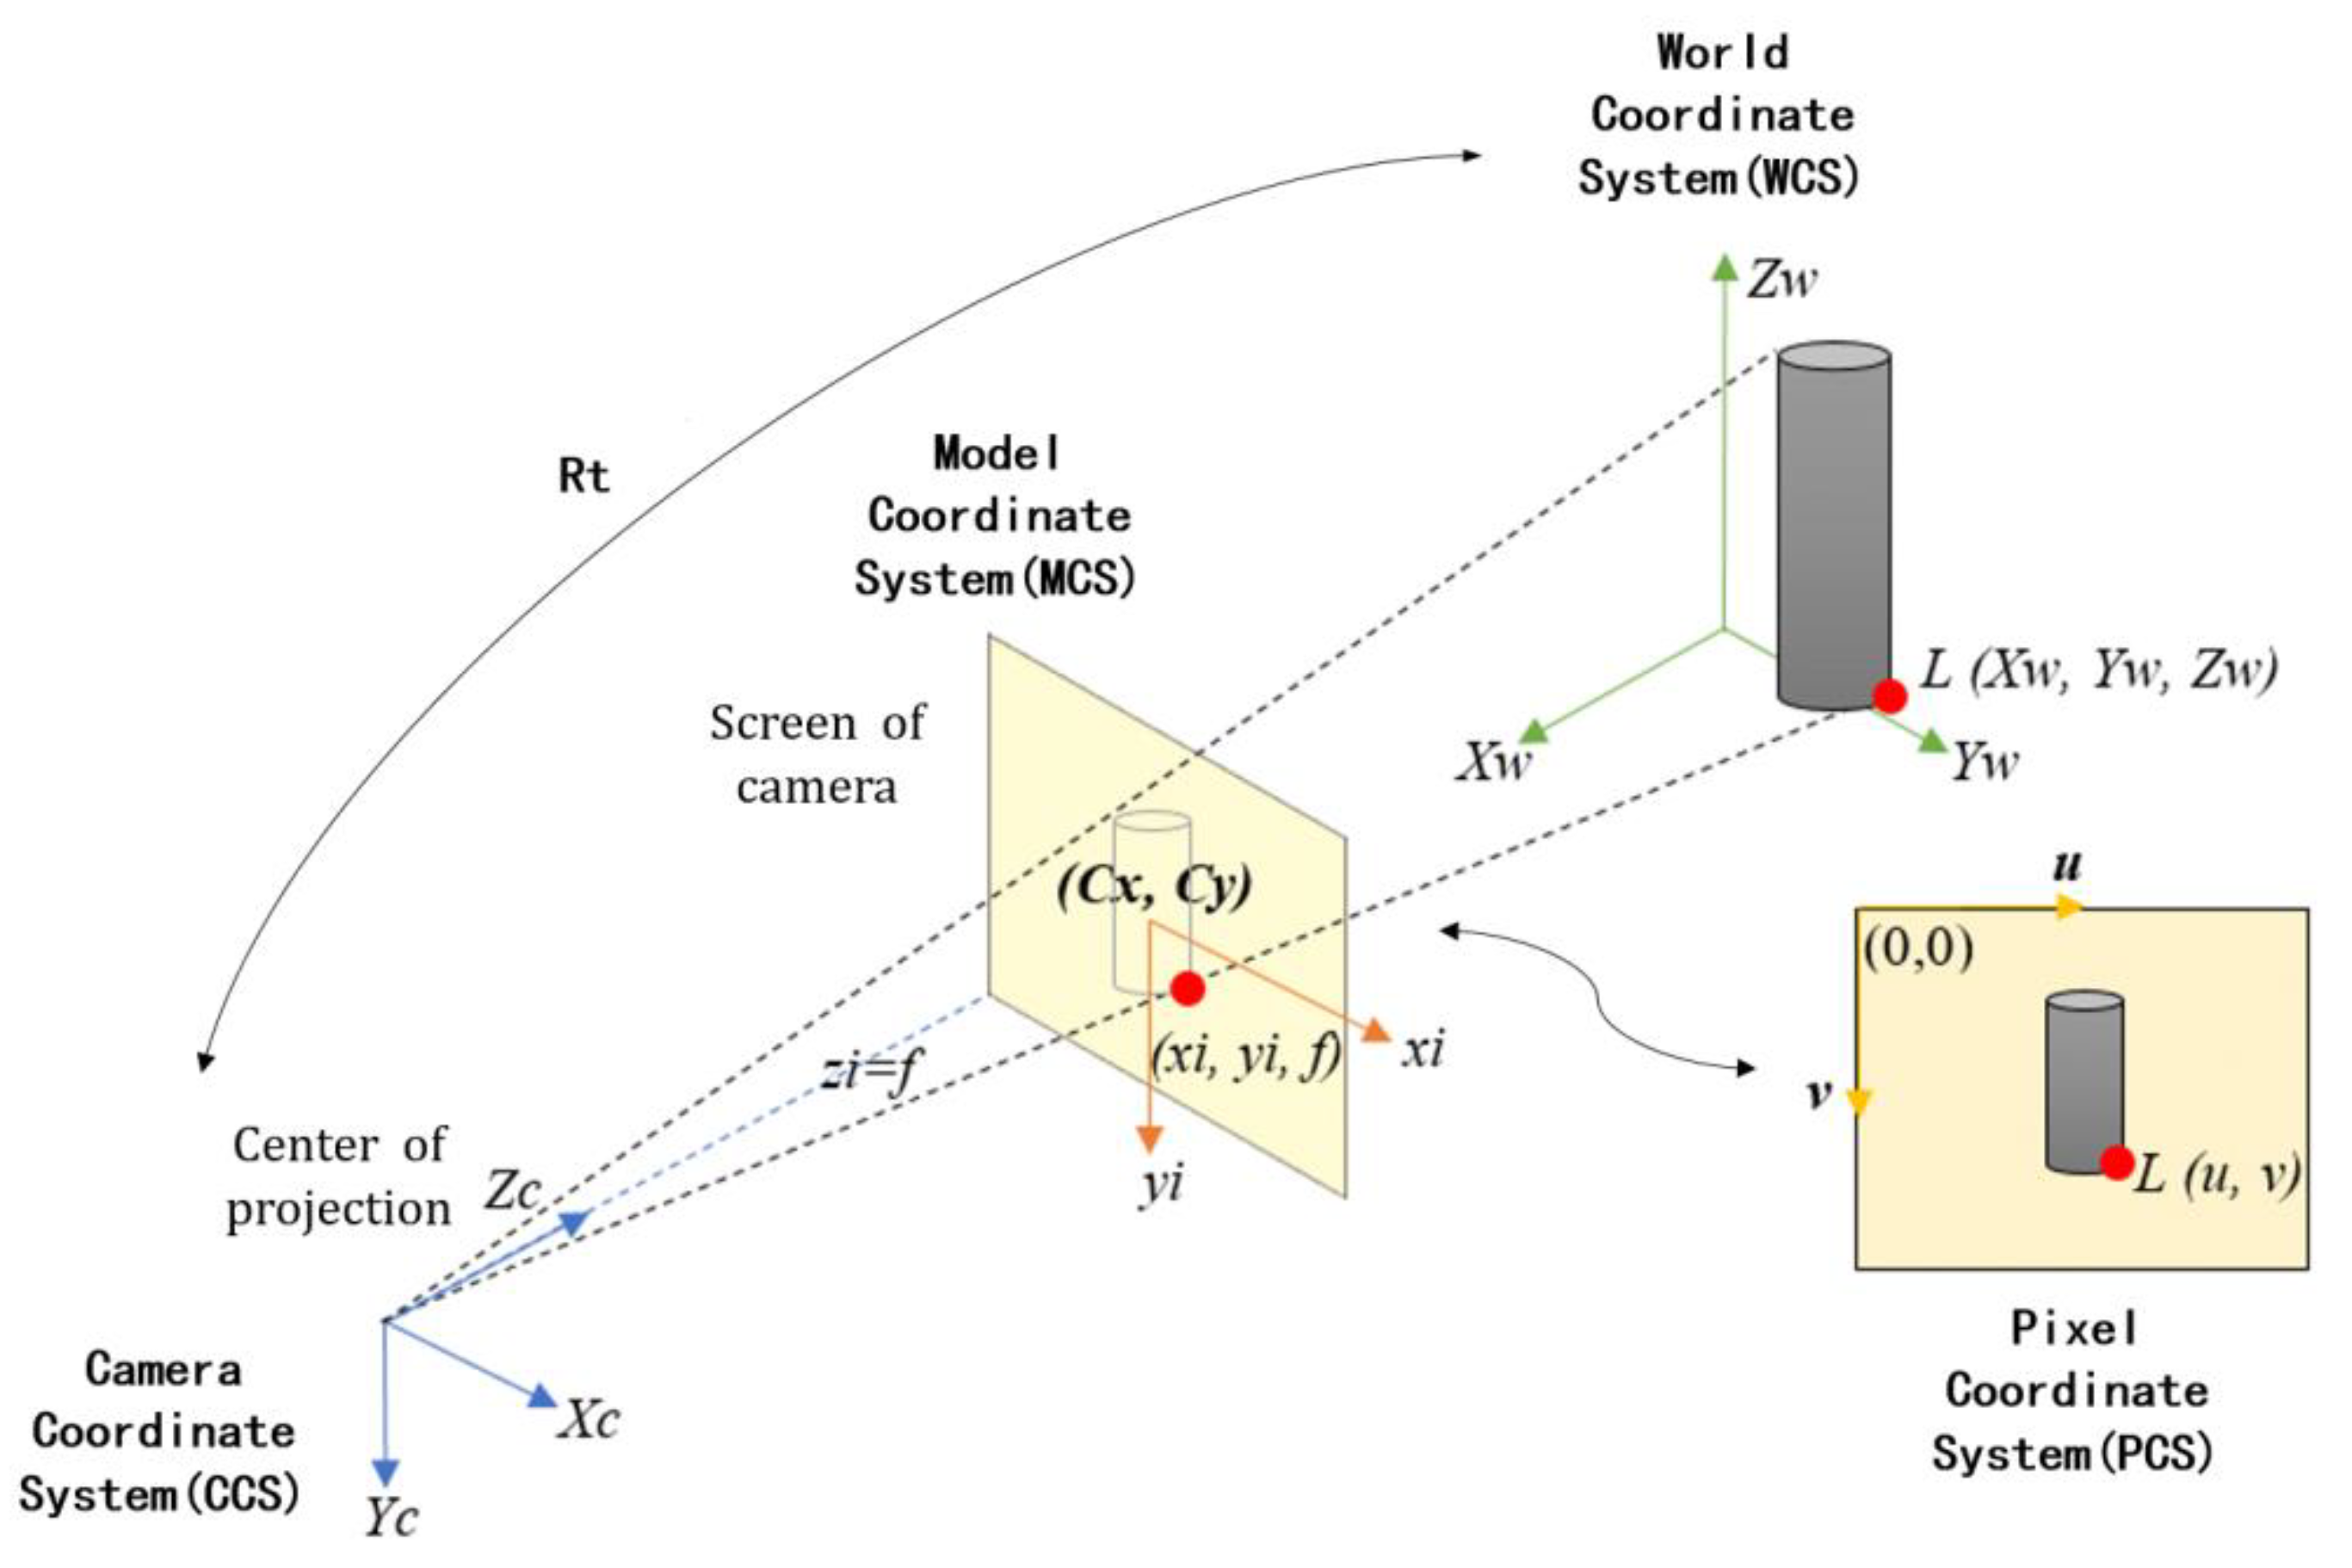
3.3.1. The AR-GIS Map Symbol Drawing Model

Correct visualization of the camera display for geographic data in AR-GIS requires transformation among four coordinate systems including the camera (View Coordinate), world (World Coodrinate), model (Model Coordinate), and screen pixel (Screen Coordinate) coordinate systems. These are used to depict the geometries of the added virtual shapes. Because the world coordinate system and the camera coordinates are right-handed coordinate systems without deformation, rigid body transformation can be used to convert them from coordinates under the world coordinate system to coordinates under the camera coordinate system. This addresses the rotation and translation of a geometric object in 3D space when the object does not deform. The camera coordinates obtained via rigid body transformation and through perspective projection are transformed into coordinates under the image coordinate system [45,46] and then converted to camera display pixels depending on screen coordinate system displacement. The transformation relationships between the four coordinate systems are shown in Figure 7.
In the actual AR map conventional visualization operation, the main scene includes two kinds of coordinate transformation from the world coordinate system to the screen pixel coordinate system and its inverse transformation. In the special operations, such as occlusion elimination and other scenes, several of the four coordinate systems need to be transformed to each other. The transformation relationships between the four coordinate systems are shown in Figure 8.
Based on the principle of computer vision camera imaging [47], the transformation relationship equations between the camera, world, model, and screen pixel coordinate systems [48] are shown in Equation (1). Using these four coordinate systems, a point in the world coordinate system can be transformed into a point in the pixel coordinate system. This allows the map symbol data to be drawn accurately in any location and toward the attitude in the MAR.
Z c u v 1 = 1 d x 0 u 0 0 1 d y v 0 0 0 1 f 0 0 0 0 f 0 0 0 0 1 0   R t 0 T 1 X Y Z 1
Based on the above description, we describe the geographic visualization methods used to create the MAR, as well as the final mapping results, which are integrated into a mobile app (Figure 9). To enhance 3D geographic visualization, we use mapping products such as SMWU (Map document format of SuperMap software) and MXD (Map document format of ArcGIS software) to build a two and three-dimensional integrated symbol model by adding layers, which are rearranged into an image-vector-3D grid-effect map. Unified coordinate references, interactive gestures, and display projection algorithms manage the scheduling and final rendering of large amounts of data.

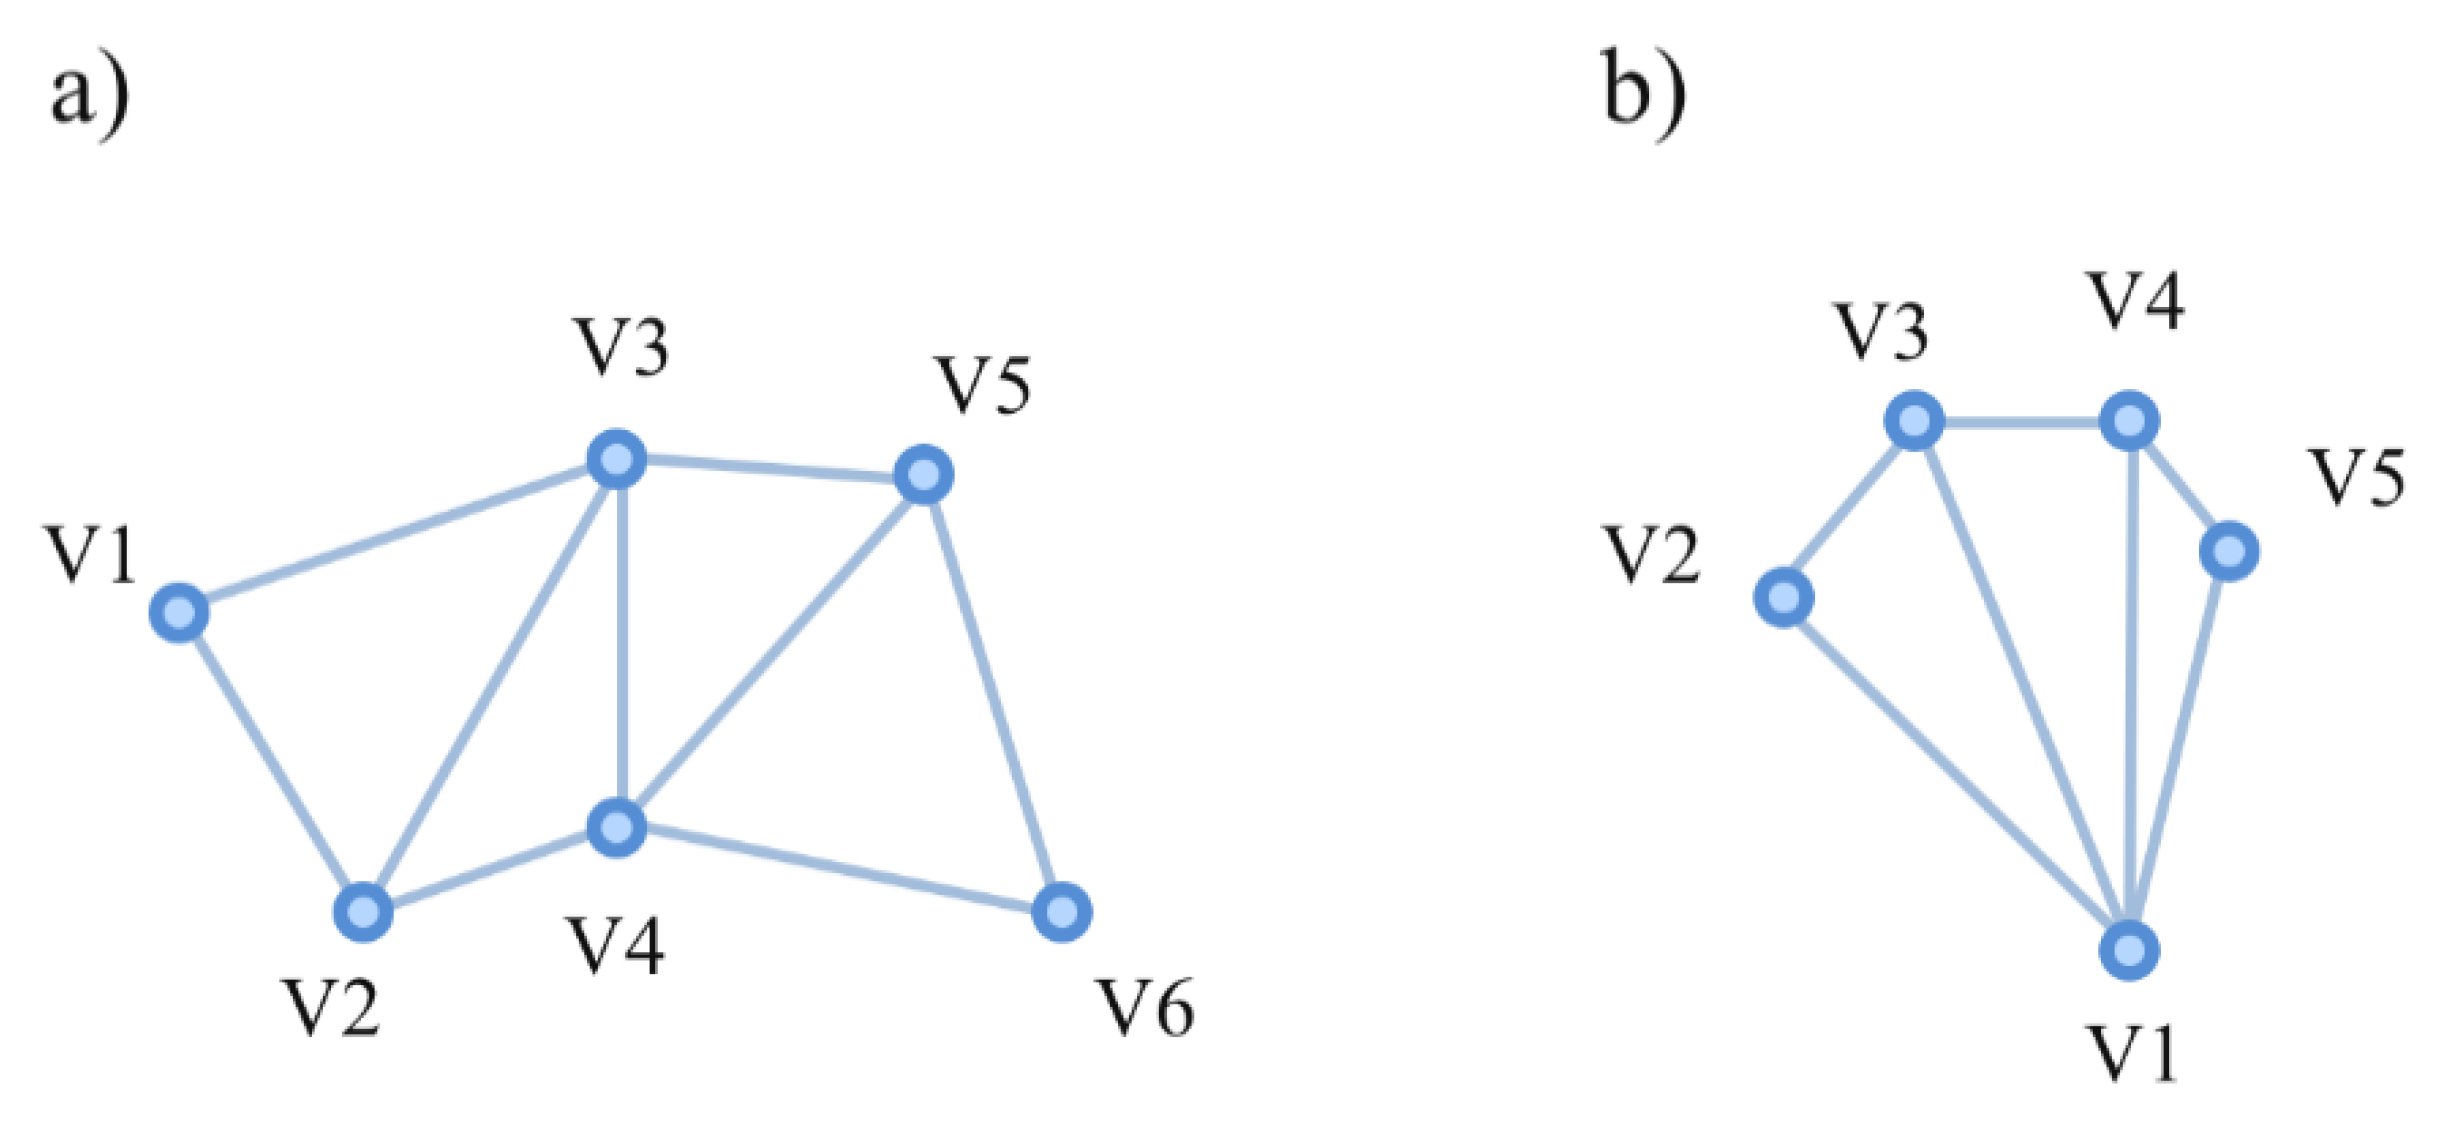
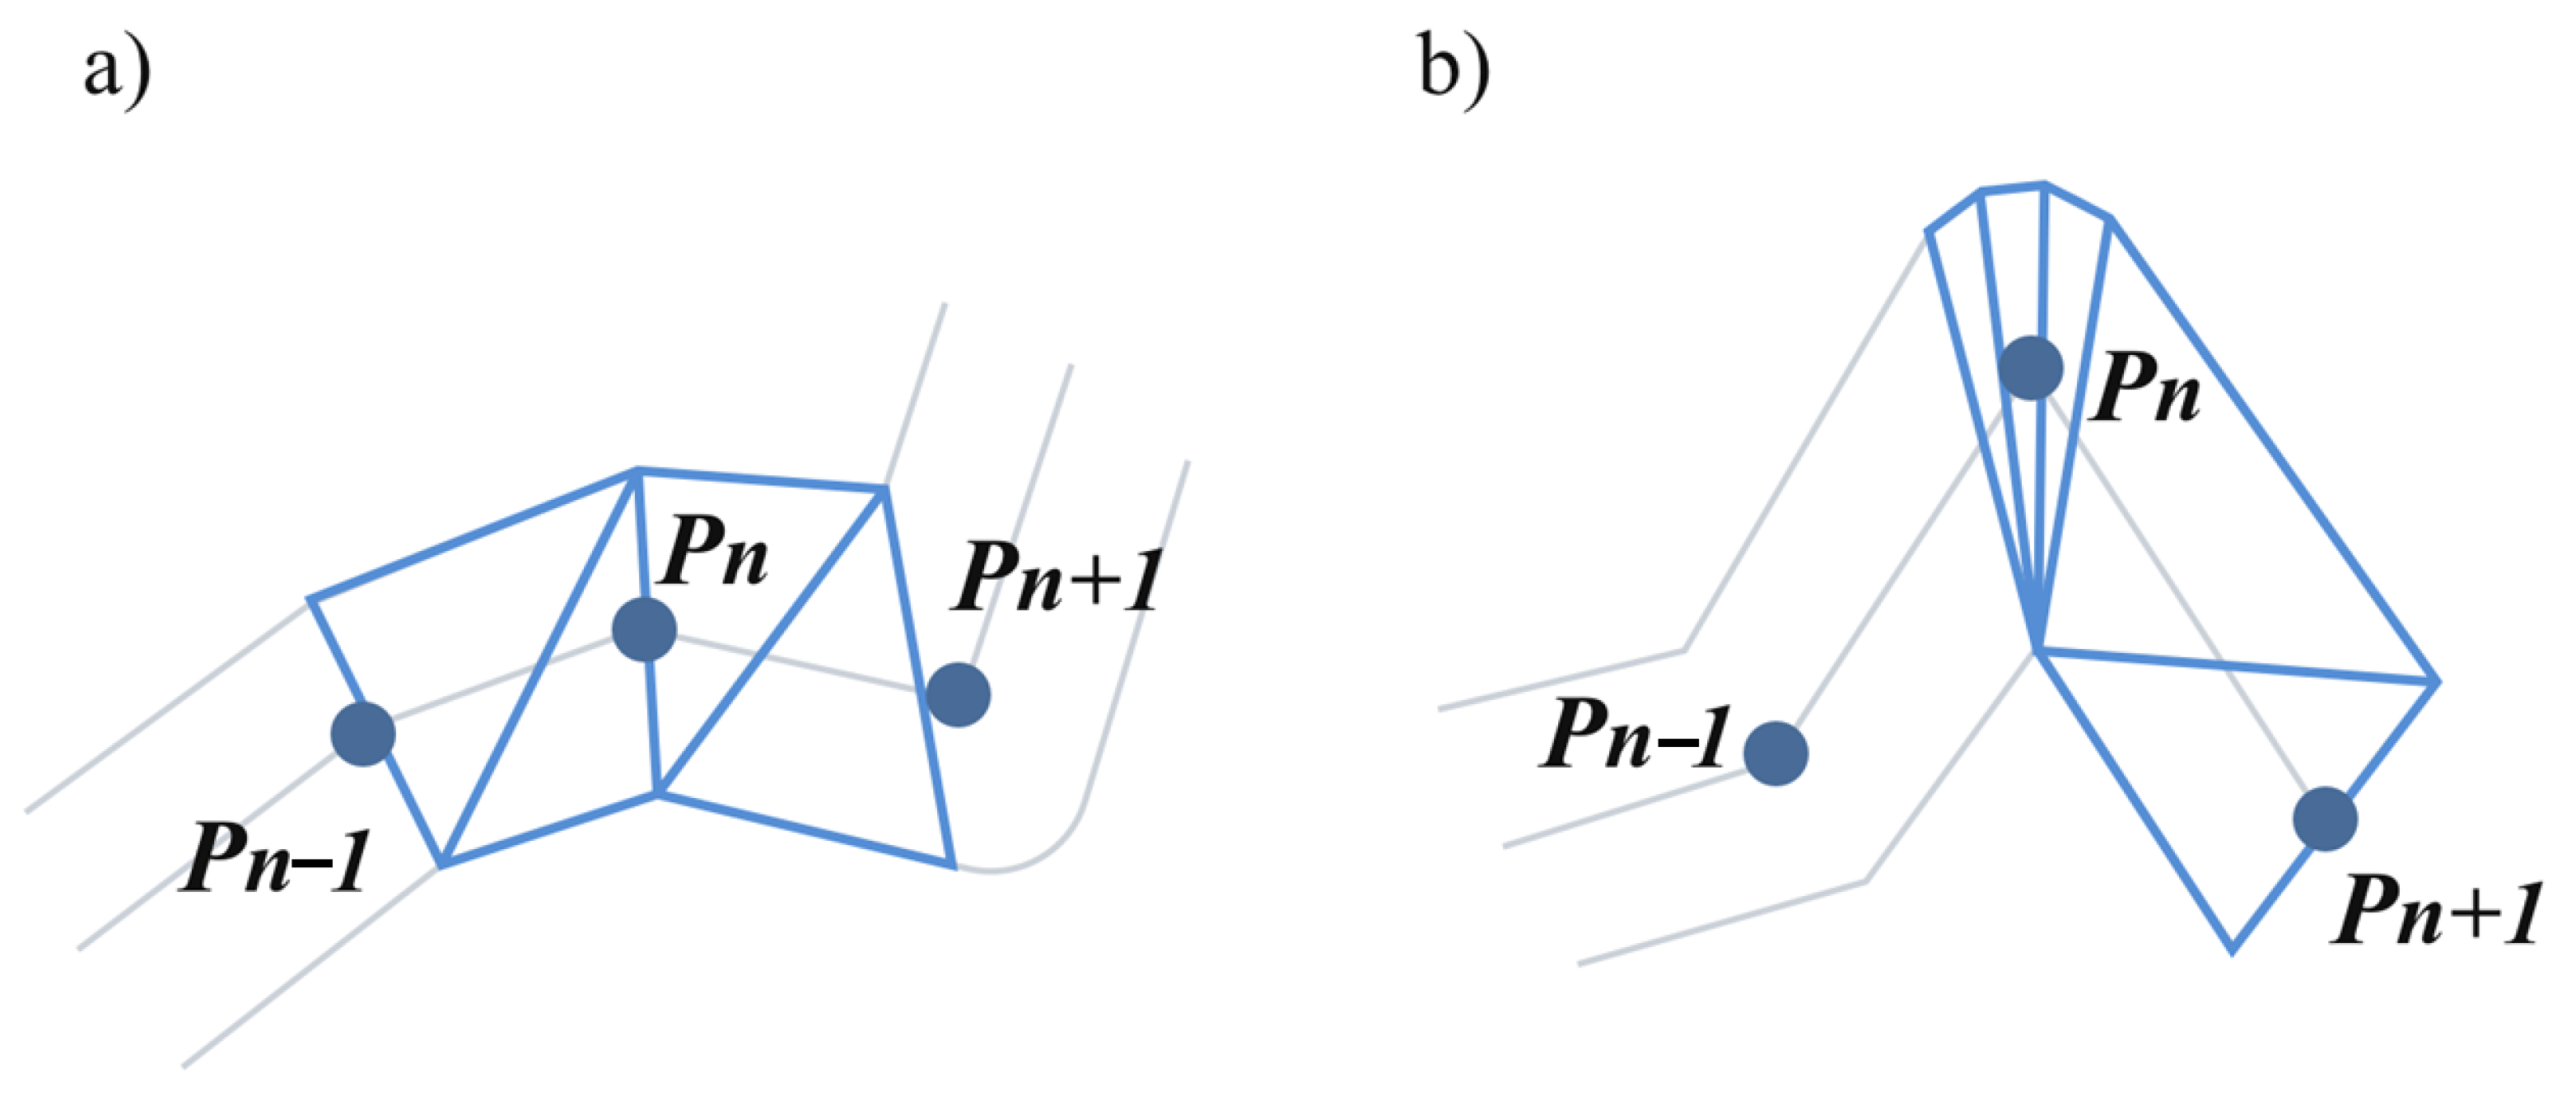
3.3.2. AR Vector Feature Triangulation Rendering

Triangulation of point sets can be used as an important computer graphics pre-processing technique. In particular, many geometric diagrams of point sets such as Voronoi, EMST tree, and Gabriel diagrams are related to Delaunay triangulations. Delaunay triangulations have several important features: maximization of the minimum angle, “closest to regularized” triangulation, and uniqueness (any four points cannot be co-circled). These features can be used to plot the geometry of any shape accurately and rigorously. The relevant mathematical equation [49] is shown in Equation (2):
A x A y A x 2 + A y 2 1 B x B y B x 2 + B y 2 1 C x C y C x 2 + C y 2 1 D x C y D x 2 + D y 2 1   =   A x D x A y D y A x 2 D x 2   +   A y 2 D y 2 B x D x B y D y B x 2 D x 2   +   B y 2 D y 2 C x D x C y D y C x 2 D x 2   +   C y 2 D y 2 = A x D x A y D y A x D x 2 + A y D y 2 B x D x B y D y B x D x 2 + B y D y 2 C x D x C y D y C x D x 2 + C y D y 2 > 0
Popular mapping engine libraries with hardware acceleration including OpenGL and Direct3D support drawing of any polygons based on Delaunay triangulation. Figure 10 shows that there are usually two types of OpenGL geometric primitives. One is the triangle geometric primitive and the other is the triangle fan primitive. We represent the vertex set to be drawn by OpenGL by V1–V6. Based on this principle. The application of the two methods of drawing map symbols in AR-GIS is shown in Figure 11. We represent a consecutive polyline by three points (Pn − 1, Pn and Pn + 1).
When drawing map symbols, the system reads the current location and direction based on the built-in inertial augmented reality odometer. It then prepares to calculate map symbol data that represent the geographical extent of the specified viewport, as provided by a series of geographic point sequences. A distinction is drawn regarding realistic camera pictures to indicate representation of cartographic information regarding the current reality space. This expression systematically calculates the virtual position of the map symbol in the current viewport relative to the fictitious origin within the camera virtual space. The corresponding graphic matrix rotates, transforms, shifts, and scales the coordinate collection and orientation of this map symbol relative to the current position, thus allowing the map symbol to be viewed from the camera angle eventually. Within each video frame in the MAR camera viewport (the calculation time requirement is limited to 35 ms), a 3D transformation of the symbolized map data must be completed so that the map symbol is continuously within the observer’s view for real-time responses. This supports permanent position changes. Therefore, the system requires that large data mass element units be drawn in quick batches that are split into a series of triangles via triangulation, as shown in Figure 12a,b. These are characterized by rapid transformation using parallelization algorithms with GPUs that exceed thousands of computing cores.

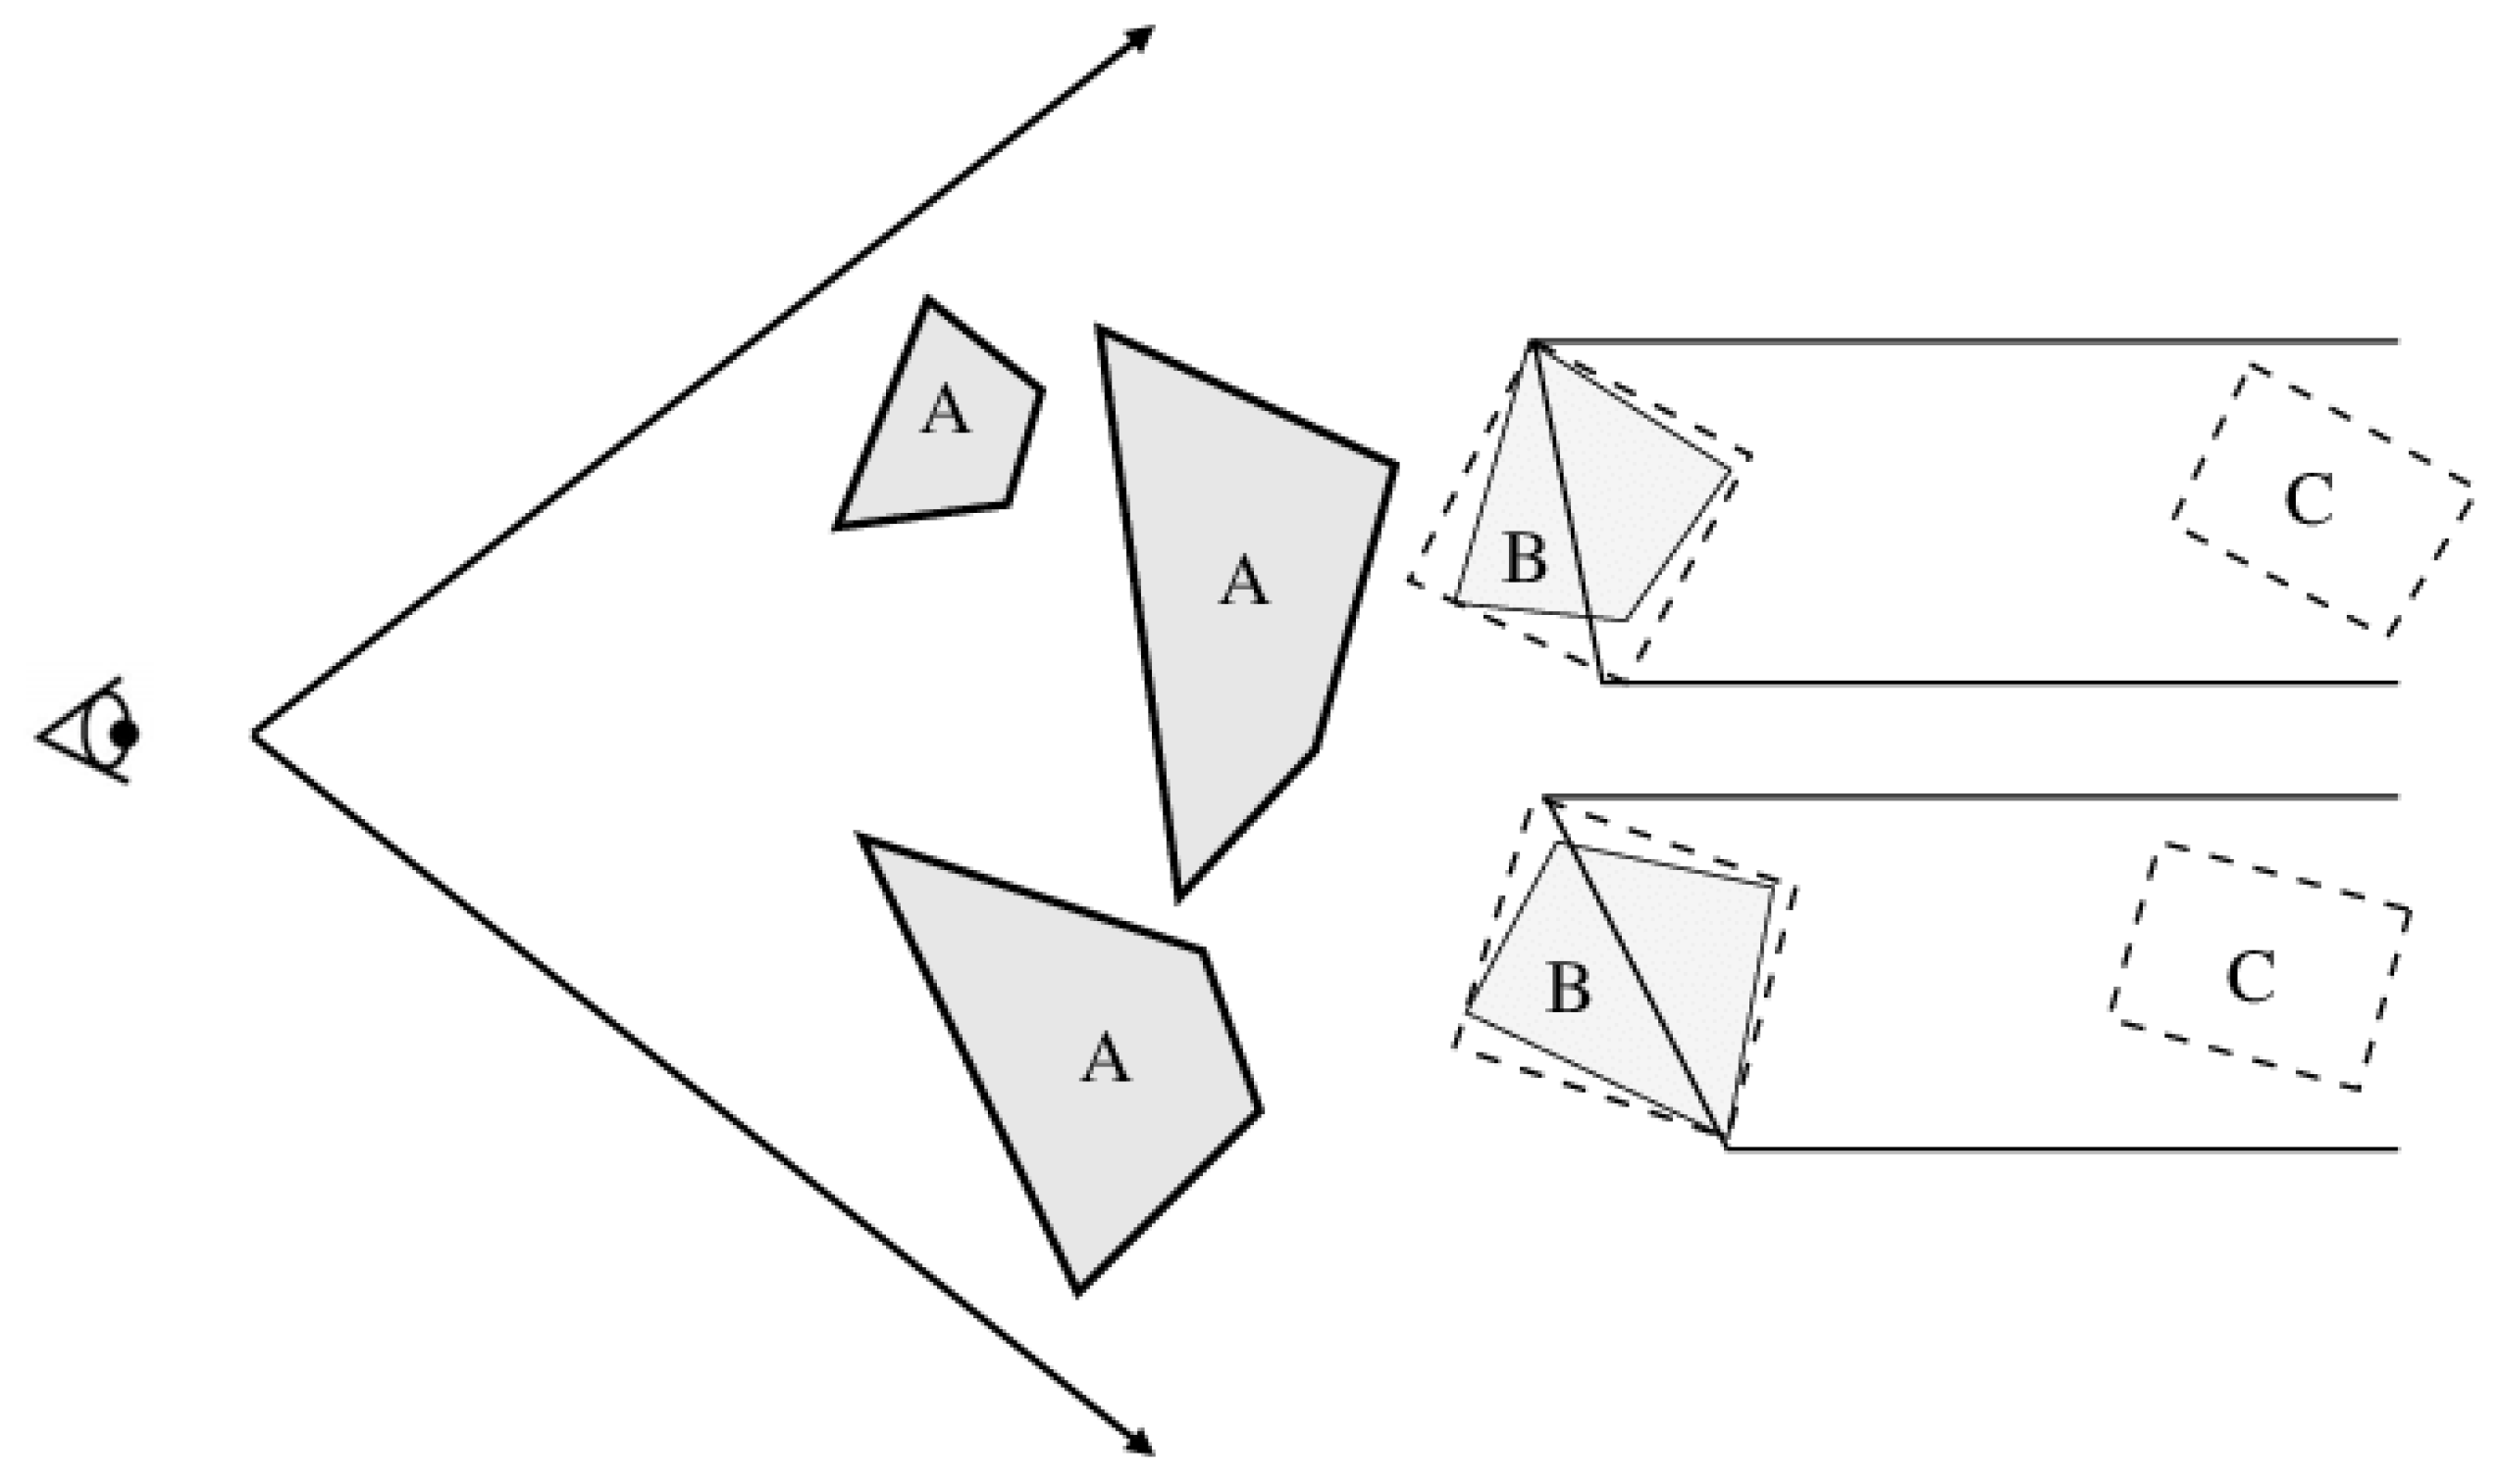
3.3.3. AR Stereoscopic Masking Culling

Displaying spatial objects in 3D space often causes rendering problems due to complex spatial locations and relationships [50]. In all MAR visualization components, masked display is an issue that must be solved in the AR application scene. Virtual objects are always placed in the foreground of incoming video images, but the user is able to view the observed area without constraints depending on the real-time spatial location relationship between the user’s camera location and the AR spatial data. As a result, the real location of the virtual visual model is sometimes behind or in front of the real building. If this masking relationship is not analyzed correctly, rendering does not produce a reasonable image. The principle of OpenGL depth testing and masking [51] is shown in Figure 13.
In this paper, masking technology and virtual geographic data such as depth are used to mask real objects. This simplifies the 3D mask models of textures and textured buildings and mixes it into the visual model via alpha channels. If there is no occlusion of the virtual visual model and 3D mask in the user’s camera viewport, these 3D masks do not affect the visualization results. In contrast, if the 3D mask is placed in a visual model with a mask, the former visually removes the obscured part and displays it through a backward video image. This process is shown in Figure 14. Taking the user’s on-site inspection in urban planning as an example, after accurate augmented reality positioning and orientation, determine the actual display area of GIS 3D data in the video, realize the accurate matching of 3D facilities (such as the well cover in this example) and realistic objects through depth and masking technology, and after matching, view the underground part of the actual object by parameterizing the depth and masking, and obtain the invisible properties of the original space entity.

4. Experiments and Results

4.1. Experiments Design

In this study, we selected the full feature vector map data for a performance test to simulate the way users typically interact with the AR-GIS application. The test assumes that the AR-GIS application has typical user behavior. In the experimental method, to verify the high performance, practicality, and effectiveness of our approach, we implemented the rendering scheme introduced in Section 2 using C++ and the OpenGL library with ARCore on Android and ARKit on iOS. The study used national map data (the scale of Chinese data is less than 1:1 million and the scale of Beijing data is more than 1:1 million) with a total of 268 layers. The data source was OpenStreetMap. The total data set size was 30.25 GB. GIS mapping uses various map symbols. The basic types include dot symbols (solid dot, symbol point), line symbols (solid single lines, solid color wide lines, symbol lines), area symbol (solid fill polygon, symbol polygon), annotations, text, grids, CAD symbol, 3D symbols and animated symbols. Experiments were conducted on these 13 common types of map symbols.

4.2. Time Test of Single AR Map Visualization

To verify the adaptability and robustness of our rendering algorithm in various actual data types, we then compare the time required by each algorithm’s subprocess (Table 1) and test validation under the current ArcGIS scenario geographic range load. The average time spent on map queries in the AR camera viewport is less than 18 ms, the average time required for the map symbols to draw to the texture cache is less than 30 ms, and the average time for texture cache to perform interactive drawing to the viewport screen is less than 24 ms. The total average time is approximately 60 ms. The map symbol drawing method based on the dynamic distributed rendering algorithm designed in this study consumes little time and can complete the drawing tasks efficiently.

4.3. Comparison Test of AR Map Visualization

By applying the adaptive decomposition method when facing the camera viewport, AUGL can model the camera viewport drawing task dynamically based on the amount of rendering data in the geographic range of the AR map. It generates a list of drawing tasks that covers all feature types in the AR map, and renders the symbols in real time based on spatial index queries and spatial relationship judgment. For the four symbol types (points, lines, polygons, and annotations), we compare the operating efficiencies (time consumed in ms) of the three drawing algorithms (Table 2). For all four symbol types, the average drawing time needed by the dynamic distributed rendering algorithm proposed in this paper is less than 60 ms. The average drawing time needed by the ArcGIS runtime AR drawing algorithm exceeds 80 ms and the average drawing time needed by the Mapbox AR drawing algorithm exceeds 100 ms. The AR map symbol drawing system proposed in this paper is significantly faster than the other two algorithms.
To compare the performance characteristics of the AUGL engine and the other two algorithms with regard to battery power consumption, we shut down all other applications on the device and allowed the application to draw points, lines, polygons, and annotations. We recorded the progress of the three rendering algorithms from 100% battery to 90%. The AUGL engine algorithm reduces frequent CPU and GPU resource consumption and improves battery power consumption.
We then compared the average time required by each algorithm’s subprocess (Table 1) and test validation under the current AR-GIS scenario geographic range load. The average time spent on map queries in the AR camera viewport is less than 18 ms, the average time required for the map symbols to draw to the texture cache is less than 30 ms, and the average time for texture cache to perform interactive drawing to the viewport screen is less than 24 ms. The total average time is approximately 60 ms. The map symbol drawing method based on the dynamic distributed rendering algorithm designed in this study consumes little time and can complete the drawing tasks efficiently.

4.4. Consistency Test of AR Visualization Cross Platform Algorithm

In addition, we compared the algorithmic consistency of the three drawing engines across platforms. OpenGL supports 2D and 3D integrated vector and raster graphics rendering, and supports cross language and cross platform graphics processing unit (GPU) interactive processing. In this paper, AR map symbol visualization is designed on the basis of a multi-language OpenGL graphics library. It supports map symbolization algorithms and runs on Android, iOS, web browser and other platforms through cross language graphics rendering. It also supports cross language hardware accelerated rendering, which is obviously reflected in the effect comparison experiment of cross platform algorithm consistency. In the experiment, we compared consistency performance of the smoothed line connection, smoothed line endpoint, annotation auto avoidance display, real-time ground display and occlusion culling display [52,53] of three AR rendering engine algorithms (Table 3). The algorithm can support the various symbol types in the table across platforms and provide smooth display. However, Mapbox does not support line endpoint and line junction consistency. The ArcGIS runtime does not support flow annotation or annotation auto-avoidance consistency. As shown in Figure 15, the AUGL linear symbol algorithm is shown to be presented consistently in three cross-platform environments. Figure 16 shows the AUGL polygon symbol algorithm being presented consistently in three cross-platform environments.
Finally, we compared the visualization of route symbols produced using the AUGL, ArcGIS, and Mapbox AR rendering engines to support AR navigation. The method proposed in this paper is based on cross-platform OpenGL matrix conversion technology. It can identify ground depth information in real time, support drawing of AR guide route parameters in real time, and draw a guiding route when AR navigation is attached to the ground consistently. This visualization approach works better on the human eye sensory system and improves the real-time response capabilities of the AR map system and environment [31]. The above content is shown in Figure 17. We visually compare the visualization results of the AR rendering engine. In addition, in order to verify the usability and visualization effect of AUGL engine in all kinds of GIS data, we test the AR visualization of common GIS data in corresponding environments, and verify it from the perspective of user experience. Figure 18 summarizes the AR visualization test results of four map data types.
Comparisons show the map symbol rendering framework that is based on the dynamic distributed rendering algorithm and combined with the cross-platform OpenGL engine consumes little time and can achieve efficient map symbol rendering in the field of mobile augmented reality.

5. Conclusions and Further Work

This paper proposes a cross-platform rendering framework, the AUGL engine, for rendering of high-performance map symbols in mobile augmented reality implementations. To resolve difficulties with efficient rendering of mobile augmented reality map symbols consistently across different platforms, the AUGL engine utilized parallel graphics acceleration hardware and innovative AR rendering algorithms to achieve high-performance rendering. A stylized map symbol rendering correction algorithm was used to achieve a consistent map symbol rendering style across different platforms.
Based on the AUGL engine, we developed AR map applications consisting of AR service components and mobile prototype components. Experiments in the fourth chapter of this paper demonstrated the following: (i) the use of a consistent, cross-platform AR map symbol rendering method, consistent performance across different operating systems, and better results; (ii) that the AUGL engine with a variety of innovative rendering algorithms improves performance by an average of more than two times compared to other AR map engines and provides a vector polygon symbol performance improvement of near three times (take mapbox AR as an example); (iii) that the GPU pre-cache rendering method reduces battery power consumption; and (iv) that asynchronous interactive rendering reduces the AR real-time response overload and overall wait time.
In the future, we plan to experiment with a more flexible, incremental, cross-platform adaptive decomposition approach to large, long-term AR map visualization tasks at the city level [3,54,55,56]. In addition, we plan to introduce a technology that supports cache fault tolerance in mobile environments and allows devices to connect intermittently and make better use of distributed cache resources.
In MAR, in addition to two natural interaction methods through the interactive operation of the user’s screen and the body motion operation of the mobile camera, we will study more manners in which users can actively choose constraints for map use and exploration, such as AR glasses. For example, the user can manipulate the map through AR glasses combined with physical touch constraints. With the development of AI technology and spatial computing technology, computer vision scene understanding is also an important topic for future work. With the development of MAR software and hardware, the accuracy of visual inertial navigation positioning is becoming higher and higher. The use of AR self-positioning technology combined with GIS semantic understanding to study indoor tools such as indoor surveying and mapping or interior design is expected to achieve better results. For example, users carrying a mobile phone while walking around the museum to obtain a 3D digital map, not just point cloud data. In the future, we plan to conduct research in this area.

Author Contributions

Conceptualization, Kejia Huang and Chenliang Wang; methodology, Kejia Huang, Chenliang Wang and Shaohua Wang; software, Kejia Huang, Runying Liu, Guoxiong Chen and Xianglong Li; validation, Kejia Huang, Runying Liu and Xianglong Li; Writing—Original draft preparation, Kejia Huang, Chenliang Wang and Shaohua Wang; Writing—Review and Editing, Kejia Huang, Chenliang Wang and Shaohua Wang; visualization, Kejia Huang, Runying Liu and Xianglong Li; supervision, Kejia Huang; project administration, Kejia Huang. All authors have read and agreed to the published version of the manuscript.

Funding

This work was supported by the National Key Research and Development Program of China (No. 2017YFA0604703), the National Natural Science Foundation of China under Grant (41571439), a grant from State Key Laboratory of Resources and Environmental Information System, the Key Project of Natural Science Research of Anhui Provincial Department of Education under Grant (KJ2020A0720).

Institutional Review Board Statement

Not applicable.

Informed Consent Statement

Not applicable.

Data Availability Statement

Not applicable.

Acknowledgments

The authors express thanks to anonymous reviewers for their constructive comments and advice.

Conflicts of Interest

The authors declare no conflict of interest.

References

  1. Azuma, R.T. A Survey of Augmented Reality. Presence Teleoperators Virtual Environ. 1997, 6, 355–385. [Google Scholar] [CrossRef]
  2. Kim, W.; Kerle, N.; Gerke, M. Mobile augmented reality in support of building damage and safety assessment. Nat. Hazards Earth Syst. Sci. 2016, 16, 287–298. [Google Scholar] [CrossRef] [Green Version]
  3. Zollmann, S.; Langlotz, T.; Grasset, R.; Lo, W.H.; Mori, S.; Regenbrecht, H. Visualization Techniques in Augmented Reality: A Taxonomy, Methods and Patterns. IEEE Trans. Vis. Comput. Graph. 2020, 27, 3808–3825. [Google Scholar] [CrossRef] [PubMed]
  4. Kilimann, J.-E.; Heitkamp, D.; Lensing, P. An Augmented Reality Application for Mobile Visualization of GIS-Referenced Landscape Planning Projects. In Proceedings of the 17th International Conference on Virtual-Reality Continuum and Its Applications in Industry, Brisbane, Australia, 14–16 November 2019; ACM: New York, NY, USA, 2019; pp. 1–5. [Google Scholar]
  5. Papadopoulou, E.-E.; Kasapakis, V.; Vasilakos, C.; Papakonstantinou, A.; Zouros, N.; Chroni, A.; Soulakellis, N. Geovisualization of the Excavation Process in the Lesvos Petrified Forest, Greece Using Augmented Reality. ISPRS Int. J. Geo-Inf. 2020, 9, 374. [Google Scholar] [CrossRef]
  6. Kamat, V.; El-Tawil, S. Evaluation of Augmented Reality for Rapid Assessment of Earthquake-Induced Building Damage. J. Comput. Civ. Eng. 2007, 21, 303–310. [Google Scholar] [CrossRef]
  7. Siekański, P.; Michoński, J.; Bunsch, E.; Sitnik, R. CATCHA: Real-Time Camera Tracking Method for Augmented Reality Applications in Cultural Heritage Interiors. ISPRS Int. J. Geo-Inf. 2018, 7, 479. [Google Scholar] [CrossRef] [Green Version]
  8. Panou, C.; Ragia, L.; Dimelli, D.; Mania, K. An Architecture for Mobile Outdoors Augmented Reality for Cultural Heritage. ISPRS Int. J. Geo-Inf. 2018, 7, 463. [Google Scholar] [CrossRef] [Green Version]
  9. Rapprich, V.; Lisec, M.; Fiferna, P.; Zavada, P. Application of Modern Technologies in Popularization of the Czech Volcanic Geoheritage. Geoheritage 2016, 9, 413–420. [Google Scholar] [CrossRef]
  10. Werner, P.A. Review of Implementation of Augmented Reality into the Georeferenced Analogue and Digital Maps and Images. Information 2018, 10, 12. [Google Scholar] [CrossRef] [Green Version]
  11. Ortega, S.; Wendel, J.; Santana, J.M.; Murshed, S.M.; Boates, I.; Trujillo, A.; Nichersu, A.; Suárez, J.P. Making the Invisible Visible—Strategies for Visualizing Underground Infrastructures in Immersive Environments. ISPRS Int. J. Geo-Inf. 2019, 8, 152. [Google Scholar] [CrossRef] [Green Version]
  12. Haynes, P.; Hehl-Lange, S.; Lange, E. Mobile Augmented Reality for Flood Visualisation. Environ. Model. Softw. 2018, 109, 380–389. [Google Scholar] [CrossRef]
  13. Schmid, F.; Frommberger, L.; Cai, C.; Freksa, C. What You See is What You Map: Geometry-Preserving Micro-Mapping for Smaller Geographic Objects with mapIT. In Lecture Notes in Geoinformation and Cartography; Springer: Cham, Switzerland, 2013; pp. 3–19. ISBN 9783319006147. [Google Scholar]
  14. King, G.R.; Piekarski, W.; Thomas, B.H. ARVino—Outdoor augmented reality visualisation of viticulture GIS data. In Proceedings of the Fourth IEEE and ACM International Symposium on Symposium on Mixed and Augmented Reality, Vienna, Austria, 5–8 October 2005; IEEE: New York, NY, USA, 2005; pp. 52–55. [Google Scholar]
  15. Liarokapis, F.; Greatbatch, I.; Mountain, D.; Gunesh, A.; Brujic-Okretic, V.; Raper, J. Mobile Augmented Reality Techniques for GeoVisualisation. In Proceedings of the Ninth International Conference on Information Visualisation (IV’05), London, UK, 6–8 July 2005; IEEE: New York, NY, USA, 2005; pp. 745–751. [Google Scholar]
  16. Zaher, M.; Greenwood, D.; Marzouk, M. Mobile augmented reality applications for construction projects. Constr. Innov. 2018, 18, 152–166. [Google Scholar] [CrossRef] [Green Version]
  17. Behzadan, A.H.; Dong, S.; Kamat, V. Augmented reality visualization: A review of civil infrastructure system applications. Adv. Eng. Inform. 2015, 29, 252–267. [Google Scholar] [CrossRef]
  18. Meriaux, A.; Wittner, E.; Hansen, R.; Waeny, T. VR and AR in ArcGIS: An Introduction. In Proceedings of the 2019 ESRI User Conference-Technical Workshops, San Diego, CA, USA, 8–12 July 2019. [Google Scholar]
  19. Palmarini, R.; Erkoyuncu, J.A.; Roy, R.; Torabmostaedi, H. A systematic review of augmented reality applications in maintenance. Robot. Comput. Manuf. 2018, 49, 215–228. [Google Scholar] [CrossRef] [Green Version]
  20. Kim, K.; Billinghurst, M.; Bruder, G.; Duh, H.B.-L.; Welch, G.F. Revisiting Trends in Augmented Reality Research: A Review of the 2nd Decade of ISMAR (2008–2017). IEEE Trans. Vis. Comput. Graph. 2018, 24, 2947–2962. [Google Scholar] [CrossRef]
  21. Brum, M.R.; Rieder, R. Virtual Reality Applications for Smart Cities in Health: A Systematic Review. In Proceedings of the 2015 XVII Symposium on Virtual and Augmented Reality, Sao Paulo, Brazil, 25–28 May 2015; IEEE: New York, NY, USA, 2015; pp. 154–159. [Google Scholar]
  22. Keil, J.; Korte, A.; Ratmer, A.; Edler, D.; Dickmann, F. Augmented Reality (AR) and Spatial Cognition: Effects of Holographic Grids on Distance Estimation and Location Memory in a 3D Indoor Scenario. PFG J. Photogramm. Remote Sens. Geoinf. Sci. 2020, 88, 165–172. [Google Scholar] [CrossRef]
  23. Collins, J.; Regenbrecht, H.; Langlotz, T. Visual Coherence in Mixed Reality: A Systematic Enquiry. Presence Teleoperators Virtual Environ. 2017, 26, 16–41. [Google Scholar] [CrossRef]
  24. Kruijff, E.; Swan, J.E.; Feiner, S. Perceptual issues in augmented reality revisited. In Proceedings of the 2010 IEEE International Symposium on Mixed and Augmented Reality, Seoul, Korea, 13–16 October 2010; IEEE: New York, NY, USA, 2010; pp. 3–12. [Google Scholar]
  25. Bowman, D.A.; North, C.; Chen, J.; Polys, N.F.; Pyla, P.S.; Yilmaz, U. Information-rich virtual environments: Theory, tools, and research agenda. In Proceedings of the ACM Symposium on Virtual Reality Software and Technology, Osaka, Japan, 1–3 October 2013; ACM: New York, NY, USA, 2003; Volume F1290, pp. 81–90. [Google Scholar]
  26. Bowman, D.; Hodges, L.F. Formalizing the Design, Evaluation, and Application of Interaction Techniques for Immersive Virtual Environments. J. Vis. Lang. Comput. 1999, 10, 37–53. [Google Scholar] [CrossRef]
  27. Elmqvist, N.; Tsigas, P. A Taxonomy of 3D Occlusion Management for Visualization. IEEE Trans. Vis. Comput. Graph. 2008, 14, 1095–1109. [Google Scholar] [CrossRef]
  28. Willett, W.; Jansen, Y.; Dragicevic, P. Embedded Data Representations. IEEE Trans. Vis. Comput. Graph. 2016, 23, 461–470. [Google Scholar] [CrossRef] [PubMed] [Green Version]
  29. Rosser, J.; Morley, J.; Smith, G. Modelling of Building Interiors with Mobile Phone Sensor Data. ISPRS Int. J. Geo-Inf. 2015, 4, 989–1012. [Google Scholar] [CrossRef] [Green Version]
  30. Azuma, R.; Baillot, Y.; Behringer, R.; Feiner, S.; Julier, S.; MacIntyre, B. Recent advances in augmented reality. IEEE Eng. Med. Boil. Mag. 2001, 21, 34–47. [Google Scholar] [CrossRef] [Green Version]
  31. Narzt, W.; Pomberger, G.; Ferscha, A.; Kolb, D.; Müller, R.; Wieghardt, J.; Hörtner, H.; Lindinger, C. Augmented reality navigation systems. Univers. Access Inf. Soc. 2005, 4, 177–187. [Google Scholar] [CrossRef]
  32. Devaux, A.; Hoarau, C.; Brédif, M.; Christophe, S. 3D Urban Geovisualization: In Situ Augmented and Mixed Reality Experiments. ISPRS Ann. Photogramm. Remote Sens. Spat. Inf. Sci. 2018, 4, 41–48. [Google Scholar] [CrossRef] [Green Version]
  33. Banville, S.; Diggelen, F.V. Precise GNSS for Everyone: Precise Positioning Using Raw GPS Measurements from Android Smartphones. GPS World 2016, 27, 43–48. [Google Scholar]
  34. Wanninger, L.; Heßelbarth, A. GNSS code and carrier phase observations of a Huawei P30 smartphone: Quality assessment and centimeter-accurate positioning. GPS Solut. 2020, 24, 1–9. [Google Scholar] [CrossRef] [Green Version]
  35. Wu, C.; Liu, J.; Li, Z. Research on National 1:50,000 Topographic Cartography Data Organization. ISPRS Ann. Photogramm. Remote Sens. Spat. Inf. Sci. 2014, 4, 83–89. [Google Scholar] [CrossRef] [Green Version]
  36. Netek, R.; Brus, J.; Tomecka, O. Performance Testing on Marker Clustering and Heatmap Visualization Techniques: A Comparative Study on JavaScript Mapping Libraries. ISPRS Int. J. Geo-Inf. 2019, 8, 348. [Google Scholar] [CrossRef] [Green Version]
  37. Guo, M.; Guan, Q.; Xie, Z.; Wu, L.; Luo, X.; Huang, Y. A spatially adaptive decomposition approach for parallel vector data visualization of polylines and polygons. Int. J. Geogr. Inf. Sci. 2015, 29, 1419–1440. [Google Scholar] [CrossRef]
  38. Hertel, S.; Hormann, K.; Westermann, R. A Hybrid GPU Rendering Pipeline for Alias-Free Hard Shadows. In Eurographics 2009—Areas Papers; Ebert, D., Krüger, J., Eds.; The Eurographics Association: Goslar, Germany, 2009. [Google Scholar]
  39. Li, S.; Wang, S.; Guan, Y.; Xie, Z.; Huang, K.; Wen, M.; Zhou, L. A High-performance Cross-platform Map Rendering Engine for Mobile Geographic Information System (GIS). ISPRS Int. J. Geo-Inf. 2019, 8, 427. [Google Scholar] [CrossRef] [Green Version]
  40. Hu, W.; Li, L.; Wu, C.; Zhang, H.; Zhu, H. A parallel method for accelerating visualization and interactivity for vector tiles. PLoS ONE 2019, 14, e0221075. [Google Scholar] [CrossRef] [Green Version]
  41. Guo, M.; Han, C.; Guan, Q.; Huang, Y.; Xie, Z. A universal parallel scheduling approach to polyline and polygon vector data buffer analysis on conventional GIS platforms. Trans. GIS 2020, 24, 1630–1654. [Google Scholar] [CrossRef]
  42. Zhang, J.; Ye, Z.; Zheng, K. A Parallel Computing Approach to Spatial Neighboring Analysis of Large Amounts of Terrain Data Using Spark. Sensors 2021, 21, 365. [Google Scholar] [CrossRef]
  43. Guo, M.; Huang, Y.; Guan, Q.; Xie, Z.; Wu, L. An efficient data organization and scheduling strategy for accelerating large vector data rendering. Trans. GIS 2017, 21, 1217–1236. [Google Scholar] [CrossRef]
  44. Gao, B.; Dellandréa, E.; Chen, L. Accelerated dictionary learning with GPU/Multi-core CPU and its application to music classification. In Proceedings of the 2012 IEEE 11th International Conference on Signal Processing, Beijing, China, 21–25 October 2012; IEEE: New York, NY, USA, 2012; pp. 1188–1193. [Google Scholar]
  45. Milosavljević, A.; Dimitrijević, A.; Rančić, D. GIS-augmented video surveillance. Int. J. Geogr. Inf. Sci. 2010, 24, 1415–1433. [Google Scholar] [CrossRef]
  46. Milosavljević, A.; Rančić, D.; Dimitrijević, A.; Predić, B.; Mihajlović, V. Integration of GIS and video surveillance. Int. J. Geogr. Inf. Sci. 2016, 1–19. [Google Scholar] [CrossRef]
  47. Zhang, Z. Camera Calibration. In Computer Vision; Springer: Boston, MA, USA, 2014; pp. 76–77. [Google Scholar]
  48. Zhang, Z. A flexible new technique for camera calibration. IEEE Trans. Pattern Anal. Mach. Intell. 2000, 22, 1330–1334. [Google Scholar] [CrossRef] [Green Version]
  49. Chew, L.P. Constrained delaunay triangulations. Algorithmica 1989, 4, 97–108. [Google Scholar] [CrossRef]
  50. She, J.; Tan, X.; Guo, X.; Liu, J. Rendering 2D Lines on 3D Terrain Model with Optimization in Visual Quality and Running Performance. Trans. GIS 2016, 21, 169–185. [Google Scholar] [CrossRef] [Green Version]
  51. Staneker, D. An Occlusion Culling Toolkit for OpenSG PLUS. In OpenSG Symposium; Reiners, D., Ed.; The Eurographics Association: Goslar, Germany, 2003. [Google Scholar]
  52. Dalenoort, G.J. Towards a general theory of representation. Psychol. Res. 1990, 52, 229–237. [Google Scholar] [CrossRef]
  53. Wu, M.; Zheng, P.; Lu, G.; Zhu, A.-X. Chain-based polyline tessellation algorithm for cartographic rendering. Cartogr. Geogr. Inf. Sci. 2016, 44, 491–506. [Google Scholar] [CrossRef]
  54. Chatzopoulos, D.; Bermejo, C.; Huang, Z.; Hui, P. Mobile Augmented Reality Survey: From Where We Are to Where We Go. IEEE Access 2017, 5, 6917–6950. [Google Scholar] [CrossRef]
  55. Wang, S.; Zhong, Y.; Wang, E. An integrated GIS platform architecture for spatiotemporal big data. Futur. Gener. Comput. Syst. 2018, 94, 160–172. [Google Scholar] [CrossRef]
  56. Heitzler, M.; Lam, J.C.; Hackl, J.; Adey, B.T.; Hurni, L. GPU-Accelerated Rendering Methods to Visually Analyze Large-Scale Disaster Simulation Data. J. Geovisualization Spat. Anal. 2017, 1, 3. [Google Scholar] [CrossRef]
Figure 1. Platform-independent visualization architecture of AUGL.
Ijgi 10 00593 g001
Figure 2. Architecture of AUGL.
Ijgi 10 00593 g002
Figure 3. AR map symbol rendering parallelization frameworks in multi-core environments.
Ijgi 10 00593 g003
Figure 4. AR map symbol caching mechanism: (a) data extending and (b) data stretching caching mechanisms.
Ijgi 10 00593 g004
Figure 5. AR map symbol data pre-cache loading reuse principle.
Ijgi 10 00593 g005
Figure 6. The principle of map symbol pre-caching in the AUGL engine.
Ijgi 10 00593 g006
Figure 7. The principle of AUGL engine map symbol pre-caching.
Ijgi 10 00593 g007
Figure 8. Transformation relationships among the four coordinate systems.
Ijgi 10 00593 g008
Figure 9. Visualization prototype of AR map symbols based on computer vision camera imaging principle: (a) Original display area outdoors; (b) Visualization of map symbols in outdoor augmented reality; (c) Original display area indoors; (d) Visualization of map symbols in indoor augmented reality.
Ijgi 10 00593 g009
Figure 10. Two types of OpenGL geometric primitives: (a) triangle strip; (b) triangle fan.
Ijgi 10 00593 g010
Figure 11. The application of two types of geometric primitives to GIS line symbol rendering: (a) wide line segment constructed by triangular strip; (b) smooth line node constructed by triangular fan.
Ijgi 10 00593 g011
Figure 12. Triangularized vector feature rendering: (a) a triangularized route and (b) a triangularized building area.
Ijgi 10 00593 g012
Figure 13. A mask test performed using an OpenGL depth buffer (A indicates visible geometry; B indicates testing with OpenGL; and C indicates testing with other software methods).
Ijgi 10 00593 g013
Figure 14. Correct visualization of virtual geographic data based on depth and masking: (a) no occlusion; (b) minimal occlusion; (c) partial occlusion; (d) almost all occlusion.
Ijgi 10 00593 g014
Figure 15. The linear symbol algorithms are rendered consistently in three cross-platform environments.
Ijgi 10 00593 g015
Figure 16. The polygon symbol algorithms are rendered consistently in three cross-platform environments.
Ijgi 10 00593 g016
Figure 17. Comparison with the visualization of AR route navigation: (a) AR route navigation (Mapbox); (b) AR route navigation (ArcGIS); (c) AR route navigation (AUGL).
Ijgi 10 00593 g017
Figure 18. AR visualization test results of four map data types: (a) 2D Vector; (b) BIM; (c) Navigate route; (d) Terrain; (e) 3D models; (f) 3D Vector.
Ijgi 10 00593 g018
Table 1. Sub process time test of various rendering algorithms.
Map Symbol TypeAR Camera Viewport Map QueryMap Symbols Drawn to the Texture CacheInteractive Rendering of ResultTotal
Rendering Time
Lags
Points (500 features)15 ms25 ms14 ms54 msRunning smoothly
Lines (500 features)16 ms21 ms13 ms50 msRunning smoothly
Polygons (500 features)18 ms24 ms10 ms52 msRunning smoothly
Annotations (200 features)14 ms29 ms15 ms58 msNo obvious lag
Table 2. Comparison of the efficiencies of three rendering engine drawing algorithms.
Map Symbol TypeAUGL EngineArcGIS Runtime
AR Rendering
Mapbox
AR Rendering
Battery Power Consumption Ratio
(AUGL/ArcGIS/Mapbox)
Points (500 features)37 ms55 ms89 ms1:1.12:1.17
Lines (500 features)45 ms53 ms117 ms1:1.15:1.13
Polygons (500 features)41 ms62 ms106 ms1:1.1:1.16
Annotations (200 features)48 ms67 ms109 ms1:1.13:1.15
Table 3. Comparison of the consistency performance of three rendering engine drawing algorithms.
AR-GIS
Engine
Smoothed Line ConnectionSmoothed Line EndpointAnnotation Auto Avoidance DisplayReal-Time Ground DisplayOcclusion Culling Display
Android (ArcGIS)Not supportedNot supportedPartially supportedNot supportedNot supported
iOS (ArcGIS)Not supportedNot supportedPartially supportedNot supportedNot supported
WebAR (ArcGIS)Not supportedNot supportedNot supportedNot supportedNot supported
Android (Mapbox)SupportedSupportedPartially supportedSupportedNot supported
iOS (Mapbox)Not supportedNot supportedPartially supportedNot supportedNot supported
WebAR (Mapbox)Not supportedNot supportedNot supportedNot supportedNot supported
Android (AUGL)SupportedSupportedSupportedSupportedSupported
iOS (AUGL)SupportedPartially supportedSupportedSupportedSupported
WebAR (AUGL)SupportedSupportedSupportedSupportedPartially supported
Publisher’s Note: MDPI stays neutral with regard to jurisdictional claims in published maps and institutional affiliations.

