Article

Soil Moisture Retrieval Using Polarimetric SAR Data and Experimental Observations in an Arid Environment

by
Saeid Gharechelou
1,*,
Ryutaro Tateishi
2,
Josaphat Tetuko Sri Sumantyo
2 and
Brian Alan Johnson
3
1
Faculty of Civil Engineering, Shahrood University of Technology, Shahrood 3619995161, Iran
2
Center for Environmental Remote Sensing (CEReS), Chiba University, Chiba 263-8522, Japan
3
Natural Resources and Ecosystem Services Area, Institute for Global Environmental Strategies (IGES), Hayama 240-0115, Japan
*
Author to whom correspondence should be addressed.
ISPRS Int. J. Geo-Inf. 2021, 10(10), 711; https://0-doi-org.brum.beds.ac.uk/10.3390/ijgi10100711
Submission received: 9 August 2021 / Revised: 27 September 2021 / Accepted: 10 October 2021 / Published: 19 October 2021

Abstract

:
Soil moisture is a critical component for Earth science studies, and Synthetic Aperture Radar (SAR) data have high potential for retrieving soil moisture using backscattering models. In this study, polarimetric SAR (PALSAR: Phased Array type L-band Synthetic Aperture Radar) data and polarimetric decompositions including span, entropy/H/alpha, and anisotropy, in combination with surface properties resulting from field and laboratory measurements, are used to categorize the natural surface condition and discriminate the backscatter parameter in the test site for applying the inversion soil moisture retrieval. The work aims to introduce the better of two examined models in the research for soil moisture retrieval over the bare land and sparse vegetation in arid regions. After soil moisture retrieval using the two different models, the results of comparison and validation by field measurement of soil moisture have shown that the Oh model has a more realiable accuracy for soil moisture mapping, although it was very difficult to find the best model due to different characteristics in land cover. It seems the inversion model, with the field observation and polarimetric SAR data, has a good potential for extracting surface natural conditions such as surface roughness and soil moisture; however, over- and under-estimation are observed due to land cover variability. The estimation of accurate roughness and moisture data for each type of land cover can increase the accuracy of the results.

1. Introduction

Polarimetric SAR remote sensing offers a reliable and efficient means of collecting information on geophysical and biophysical parameters of climate change and the Earth’s surface. Due to the increasing number of spaceborne SAR sensors in operation (e.g., PALSAR-2, Sentinel-1, and Radarsat), polarimetric SAR data are becoming more available for a wide range of Earth science applications, including land monitoring and assessment of hydrology (soil moisture, flood delineation), estimation of forest biomass, land cover and land use mapping, sea ice monitoring, climate ocean, and coastal monitoring [1,2,3].
Soil moisture monitoring is a particularly important application of SAR data, as soil moisture data obtained by traditional field-based monitoring approaches are usually sparse due to their labor-intensive nature. Typically, backscattering models are used to retrieve soil moisture from SAR data, and the major impediment for the surface soil moisture retrieval from this data lies in the separation of the different scattering mechanisms that contribute to the backscattering coefficients. This separation of different scattering mechanisms is quite complicated due to the variety of land surface properties that affect backscattering, e.g., the type of land cover, the soil texture, and the surface roughness. All of these characteristics make it difficult to associate the satellite-measured SAR backscatter with the soil dielectric constant (which is determined by the soil moisture). Therefore, for accurate soil moisture retrieval, it is necessary to first measure or simulate the natural land surface characteristics as much as possible [2,3].
Measuring soil moisture using SAR data is challenging for researchers in backscattering models [4,5,6]. Most studies use dual polarization SAR data and very rarely use full polarimetric SAR data. Generally, C- and X-band SAR data are used by researchers for soil moisture retrieval [6,7,8,9], and some of them used the L-band due to less sensor availability [10,11,12,13,14,15,16]. Generally, the physical backscatter models for soil moisture retrieval are based on theoretical scattering models, and approaches to the semi-empirical model involve extending or modifying empirical observations. A large number of experimental measurements are required for establishing the underlying experimental calibration relationships, but such empirical relationships are often difficult to apply to sites other than those where they were developed. Moreover, they are generally valid only for specific soil surface conditions [14].
The most popular semi-empirical model is named Dubois [12,15], and there is also the Oh model. The Dubois model works for dual polarization SAR and is suited for bare to sparse vegetated areas [17,18]. Moreover, since the Dubois model needs only two polarizations in SAR data mode, unlike the Oh model, these models are easier to use in soil moisture retrieval. In addition, the inversion model results were better than those of the Oh model in the full polarimetric L-bands rather than the C-band due to more penetration, longer wavelength, and quad polarization [19,20,21,22,23,24,25,26].
A number of studies have been carried out by researchers to compare and evaluate the backscattering models such as Dubois, Oh, IEM, and AIEM [27,28,29]. Zribi et al. [30] evaluated the Oh model and IEM using L-, C-, and X-bands SAR data and in situ measurements. They concluded that Oh model simulations retrieve backscattering values very close to the measured ones for rough surfaces while showing poor correlation over smooth areas with measured backscattering coefficients; on the other hand, the IEM model showed better results on smooth surfaces. Baghdadi and Zribi [30] evaluated the backscattering models IEM, Oh, and Dubois using C-band SAR data and experimental measurements. The results showed that these models frequently tend to under-estimate or over-estimate the radar signal depending on soil moisture (Mv), height surface roughness (Hrms), and incidence angle. Baghdadi et al. [27] evaluated the potential of the IEM, Oh, and Dubois models by using TerraSAR-X and experimental datasets of in situ measurements (Mv ranged between 5 and 41 Vol% and Hrms ranged between 0.42 and 4.55 cm). In this case, the semi-empirical Oh model correctly simulated the backscattering (showing over or under-estimation of the backscatter < 1 dB and RMSE < 3 dB), the IEM simulates correctly the backscattering at the X-band for Hrms < 1.5 cm by using the exponential correlation function and for Hrms > 1.5 cm, while the Dubois model showed a poor correlation between real data and simulations. The advanced integral equation model (AIEM) [31] was also recently widely used among these models for soil moisture retrieval, which has achieved satisfactory results for bare soil surfaces [32].
In addition to the empirical, semi-empirical, and theoretical models used to measure microwave soil moisture, there are some indices such as the delta index, which uses the ratio between the dry and wet images [33].
By this preliminary investigation from the literature review and test site physical characteristics of roughness and moisture contents, the authors decided use the Dubois, Oh, and delta models as semi-empirical approaches for soil moisture retrieval using ALOS PALSAR full polarimetric data over an arid environment with bare and sparse vegetation land cover.

1.1. Oh and Dubois Models

During the last few decades, a few models have been developed for the inversion of soil moisture from spaceborne SAR data; the IEM [31], Oh [34], and Dubois [21] models are quite widely used. The Oh model is a semi-empirical algorithm based on theoretical models and radar measurements obtained using a truck-mounted scatterometer operating at three frequencies (1.5, 4.5, and 9.5 GHz). The scatterometer measurements were acquired in a fully polarimetric mode with an incidence angle ranging from 10° to 70°. Based on the observed relationships between the scatterometer data and field measurements over a wide variety of bare soil conditions, an empirically determined function for the co-polarized and cross-polarized backscattering ratios was proposed [22,35]:
p = σ h h 0 σ v v 0 = [ 1 ( 2 θ π ) 1 3 Γ 0 e k s ]
q = σ h v 0 σ v v 0 = 0.23 Γ 0 ( 1 e k s )
where p and q are the σ ratios in co- and cross-polarizations, θ (°) is the local incidence angle, ks is the electromagnetic roughness (i.e., RMS height normalized to the wavelength), Γ 0 is the Fresnel reflectance coefficient at nadir (i.e., θ   = 0), ε′ is the real part of the complex dielectric constant, and σ h h 0 , σ h v 0 , and σ v v 0 are the backscattering coefficient from different polarizations.
  Γ 0 = | 1 ε 1 + ε | 2
To incorporate the effect of varying incidence angles, a new expression for q was introduced (Oh et al., 1994):
q = 0.25 Γ 0 ( 0.1 + sin 0.9 θ ) ( 1 e ( 1.4 1.6 Γ 0 ) k s ) .
Later on, the expression for p and q were further modified, and an expression for the cross-polarized backscattering coefficient was suggested:
p = 1   ( θ 90 ) 0.35 m v 0.65   e 0.4 ( k s ) 1.4
q = 0.1 ( s L + sin 1.3 θ ) 1.2 ( 1 e 0.9 ( k s ) 0.8 )
  σ h v 0 = 0.11 m v 0.7 cos 2.2 θ ( 1 e 0.32 ( k s ) 1.8 ) .
Finally, taking into account the fact that the measurement of the surface roughness correlation length is not exact and that the ratio q is insensitive to the roughness parameter, Oh proposed a new formulation of the cross-polarized ratio that ignores the correlation length [36]:
q = 0.095   ( 0.13 + sin 1.5 θ ) 1.4 ( 1 e 1.3 ( k s ) 0.9 ) .
Generally, the Oh model can estimate accurately the moisture volume (Mv) within a validity range of ks < 3 and 9 < Mv < 31 Vol% [26,37]. Due to this fact, the algorithm is more suitable for applications at lower frequencies such as S-, L-, or P-band [24].
The Dubois model is another semi-empirical model that was developed by Dubois et al. [21,25]. It has some similarities with the Oh model but is simpler in that it considers only the co-polarized backscattering coefficients. The empirical co-polarized σ h h 0 and σ v v 0 backscattering coefficients are expressed as a function of radar parameters, i.e., the frequency, local incidence angle, and soil surface parameters, such as permittivity and surface roughness. Then, by the understanding of backscattering coefficient ratio and dependency with different moisture conditions and varying incidence angles, the roughness-induced deviations by an empirically derived expression for the roughness term log (ks sin θ ) were accounted. Finally, the following empirical expressions for the co-polarized backscattering coefficients were found:
σ h h 0 = 10 2.75 cos 1.5 θ sin 5 θ 10 0.028 ε   tan θ ( k s × sin θ ) 1.4 λ 0.7
σ v v 0 = 10 2.35 cos 3 θ sin 3 θ 10 0.046 ε   tan θ ( k s × sin θ ) 1.1 λ 0.7
where ε is the relative dielectric constant, θ is the local incidence angle (°), ks is the normalized surface roughness, and λ is the wavelength (dB). Therefore, when the θ   is   known , Equations (9) and (10) constitute a system of two non-linear equations with two unknowns: ks and ε [31]. It should be noted that the backscattering coefficients of Equations (9) and (10) decrease with increasing θ and/or with decreasing ks. It has similarities with the prediction of the Small Perturbation Model (SPM). On the other hand, the backscattering coefficients increase with increasing Mv. This increase is robust in vertical than in horizontal co-polarization. The sensitivity of the model to Mv decreases with increasing local incident angle [38,39]. Moreover, it can be seen in the condition of the empirically determined expression that the σ h h 0 / σ v v 0 ratio is dependent on roughness and increases with increasing ks. However, this is different from the SPM, because the co-polarized term is not roughness dependent. With increasing Mv, the co-polarized ratio increases steadily, while its sensitivity to Mv decreases with decreasing θ [40]. As a summary, Table 1 shows the comparison of the Oh and Dubois models.
There is an alternative method to use the polarimetric parameters such as the entropy, the α angle, and the anisotropy to address the roughness problem. This should allow for mapping soil surface characteristics simultaneously. The basic theory of this idea is that the polarimetric signature of low depolarizing targets—for example in two different land covers with bare or sparse vegetated fields—presents various signatures due to roughness. It is predictable and would be very sensitive to the geometrical properties of the soil surfaces. At that point, it would be imaginable that the polarimetric information maximizes the radar sensitivity, such as the surface roughness. Consequently, a polarimetric feature has an extreme sensitivity to roughness and is almost insensitive to moisture [1]. The other researchers mentioned that it has a strong dependence on the roughness state and is less dependent on the soil moisture content co-polarized correlation coefficient, which is expressed in a circular polarization basis [40]. The other result showed that the real part of the circular coherence is more sensitive to surface roughness than circular coherence itself [41]. Although further research, mainly limited to the assessment of the roughness parameterization accuracy, is being conducted on this topic, its applicability to current spaceborne sensors is limited, since the majority of the available sensors are not fully polarimetric [42,43].
Most soil moisture retrieval using polarimetric SAR data has been done by C-band SAR data such as Radarsat and rarely tried use the L-band data, and all of them challenge the surface roughness complexity in backscattering models [12,25,44].

1.2. Delta Model

The delta index works based on the relative change of backscattering of two images in the dry and wet seasons. Therefore, the delta index should be interpreted in light of dry scene soil moisture. This is because there is at least a small amount of residual soil moisture in any dry scene backscatter. After selecting the two images that represent dry conditions and wetter conditions than the other with different times, they should be co-registered, and then, the delta index is defined on a per-pixel basis as [45]
Delta   index = σ 0 wet σ 0 dry σ 0 dry
where dry backscatter (decibels) is estimated from a pixel in a radar image representing dry soil conditions, and wet radar backscatter (decibels) is estimated from a pixel in the same geographic location representing wet soil conditions at a different time [46]. The delta index can quantify the change of a drier image period with negative backscattering to a wet image period with a positive backscattering number. In soil moisture terms, this is a change in the positive direction, since backscatter values are always negative. For reflecting the positive change in soil moisture status, the absolute value is necessary to scale the delta index to a positive range. For retrieving the soil moisture percentage, the histogram of the index was produced. Then, the soil moisture index was scaled to the 5th and 95th percentiles of each histogram of field observation. We note that the pixel outside of this range was discarded. Then, the sigma nought values based on their position in the histogram with an interval between the two percentiles is used to normalize. A soil moisture index (SMI) value is given to the land cover and filed observation soil moisture in pixel scale. The SMI can range between 0 and 100.
In this research, several backscattering modeling approaches are tested for retrieving soil moisture from fully polarimetric SAR (ALOS PALSAR) data in an arid environment of Iran, including delta theoretical scattering, and two semi-empirical models: the Oh model and the Dubois model. The performance of each method was assessed through a comparison against in situ and laboratory measurements. This research aims to give an introduction to the most important polarimetric parameters used for the extraction of physical soil surface information about the scattering process properties to enable more accurate inversion models for soil moisture mapping.

2. Material and Method
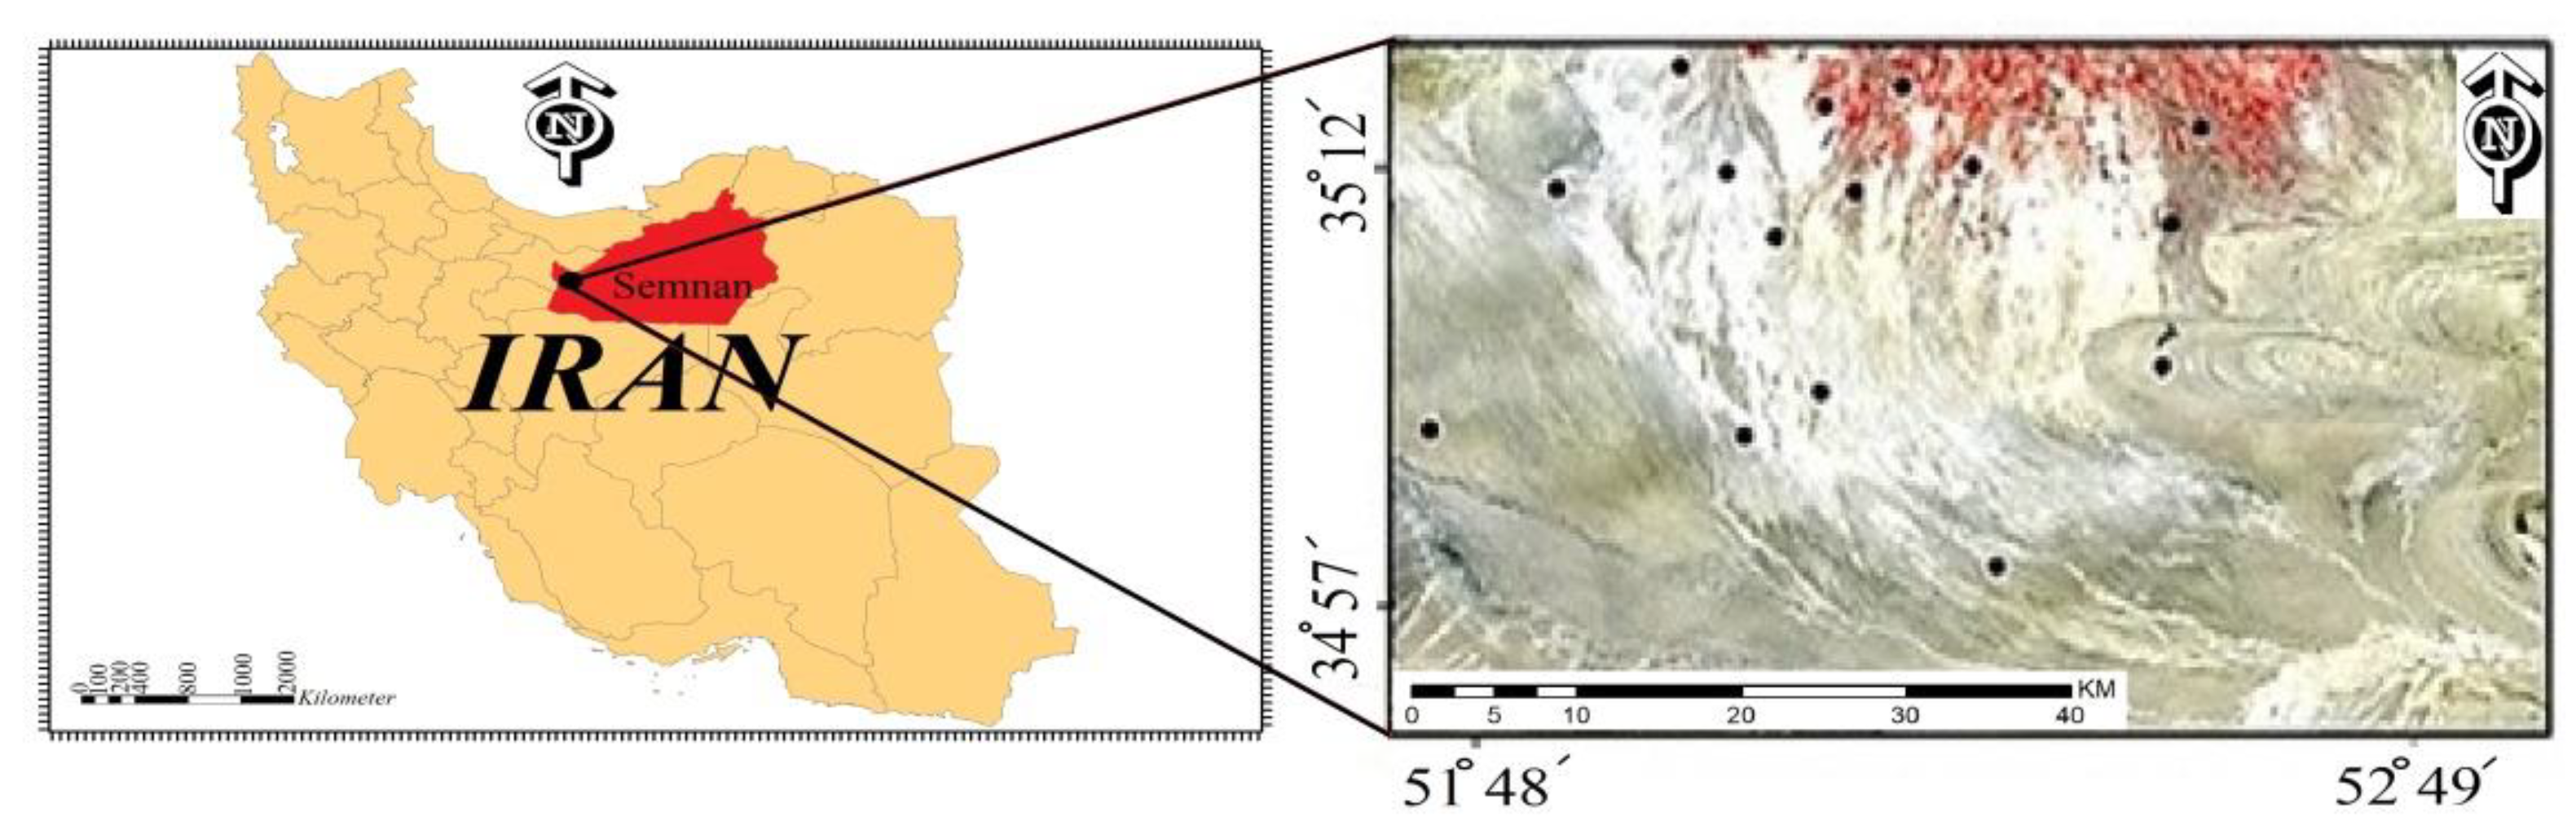
2.1. Test Site

The test site is located on a plain in the northern part of Iran formed during the Quaternary geological period (Figure 1). The soil regime of the study area is aridic, and the climate ranges from arid (southern part of the study area) to semi-arid (northern part of the study area), with an average annual precipitation of 140 mm. Mostly, there is no precipitation happening from July to September in the summer season. The dominant land cover in the study area is bare land, with sparse vegetation also found mainly in the northern part.

2.2. Dataset

Table 2 shows an overview of the datasets used in this study. Firstly, we acquired three ALOS-PALSAR scenes of the study area: two single and dual-polarization (HH, HV) images from March and September 2010 and one quad-polarization (HH, HV, VH, VV) image from October 2010 (Table 2). In the test site, a very rare pass of full Pol Alos data is available, which we obtained for just one scene. The polarimetric (PLR) observation mode of ALOS PALSAR allows it to simultaneously transmit and receive horizontal and vertical polarization for each polarized transmission. The PALSAR Quad-Pol (HH, HV, VH, VV) scattering matrix has twelve alternative off-nadir angles between 9.70 and 26.20. This observation mode has a 30 m × 10 m ground resolution for a 30 km swath width [47].
In addition to the ALOS data, optical data (Landsat 7) and a Shuttle Radar Topography Mission (SRTM) digital elevation model (DEM) were used. The optical imagery of Landsat ETM+ in level.2 was used to calculate band indices including the normalized difference vegetation index (NDVI) [48,49] and normalized water index (NWI) [39]. Aside from these remote sensing datasets, we acquired national GIS maps of land use/land cover (LULC), soil regime/type, vegetation cover, and geology.

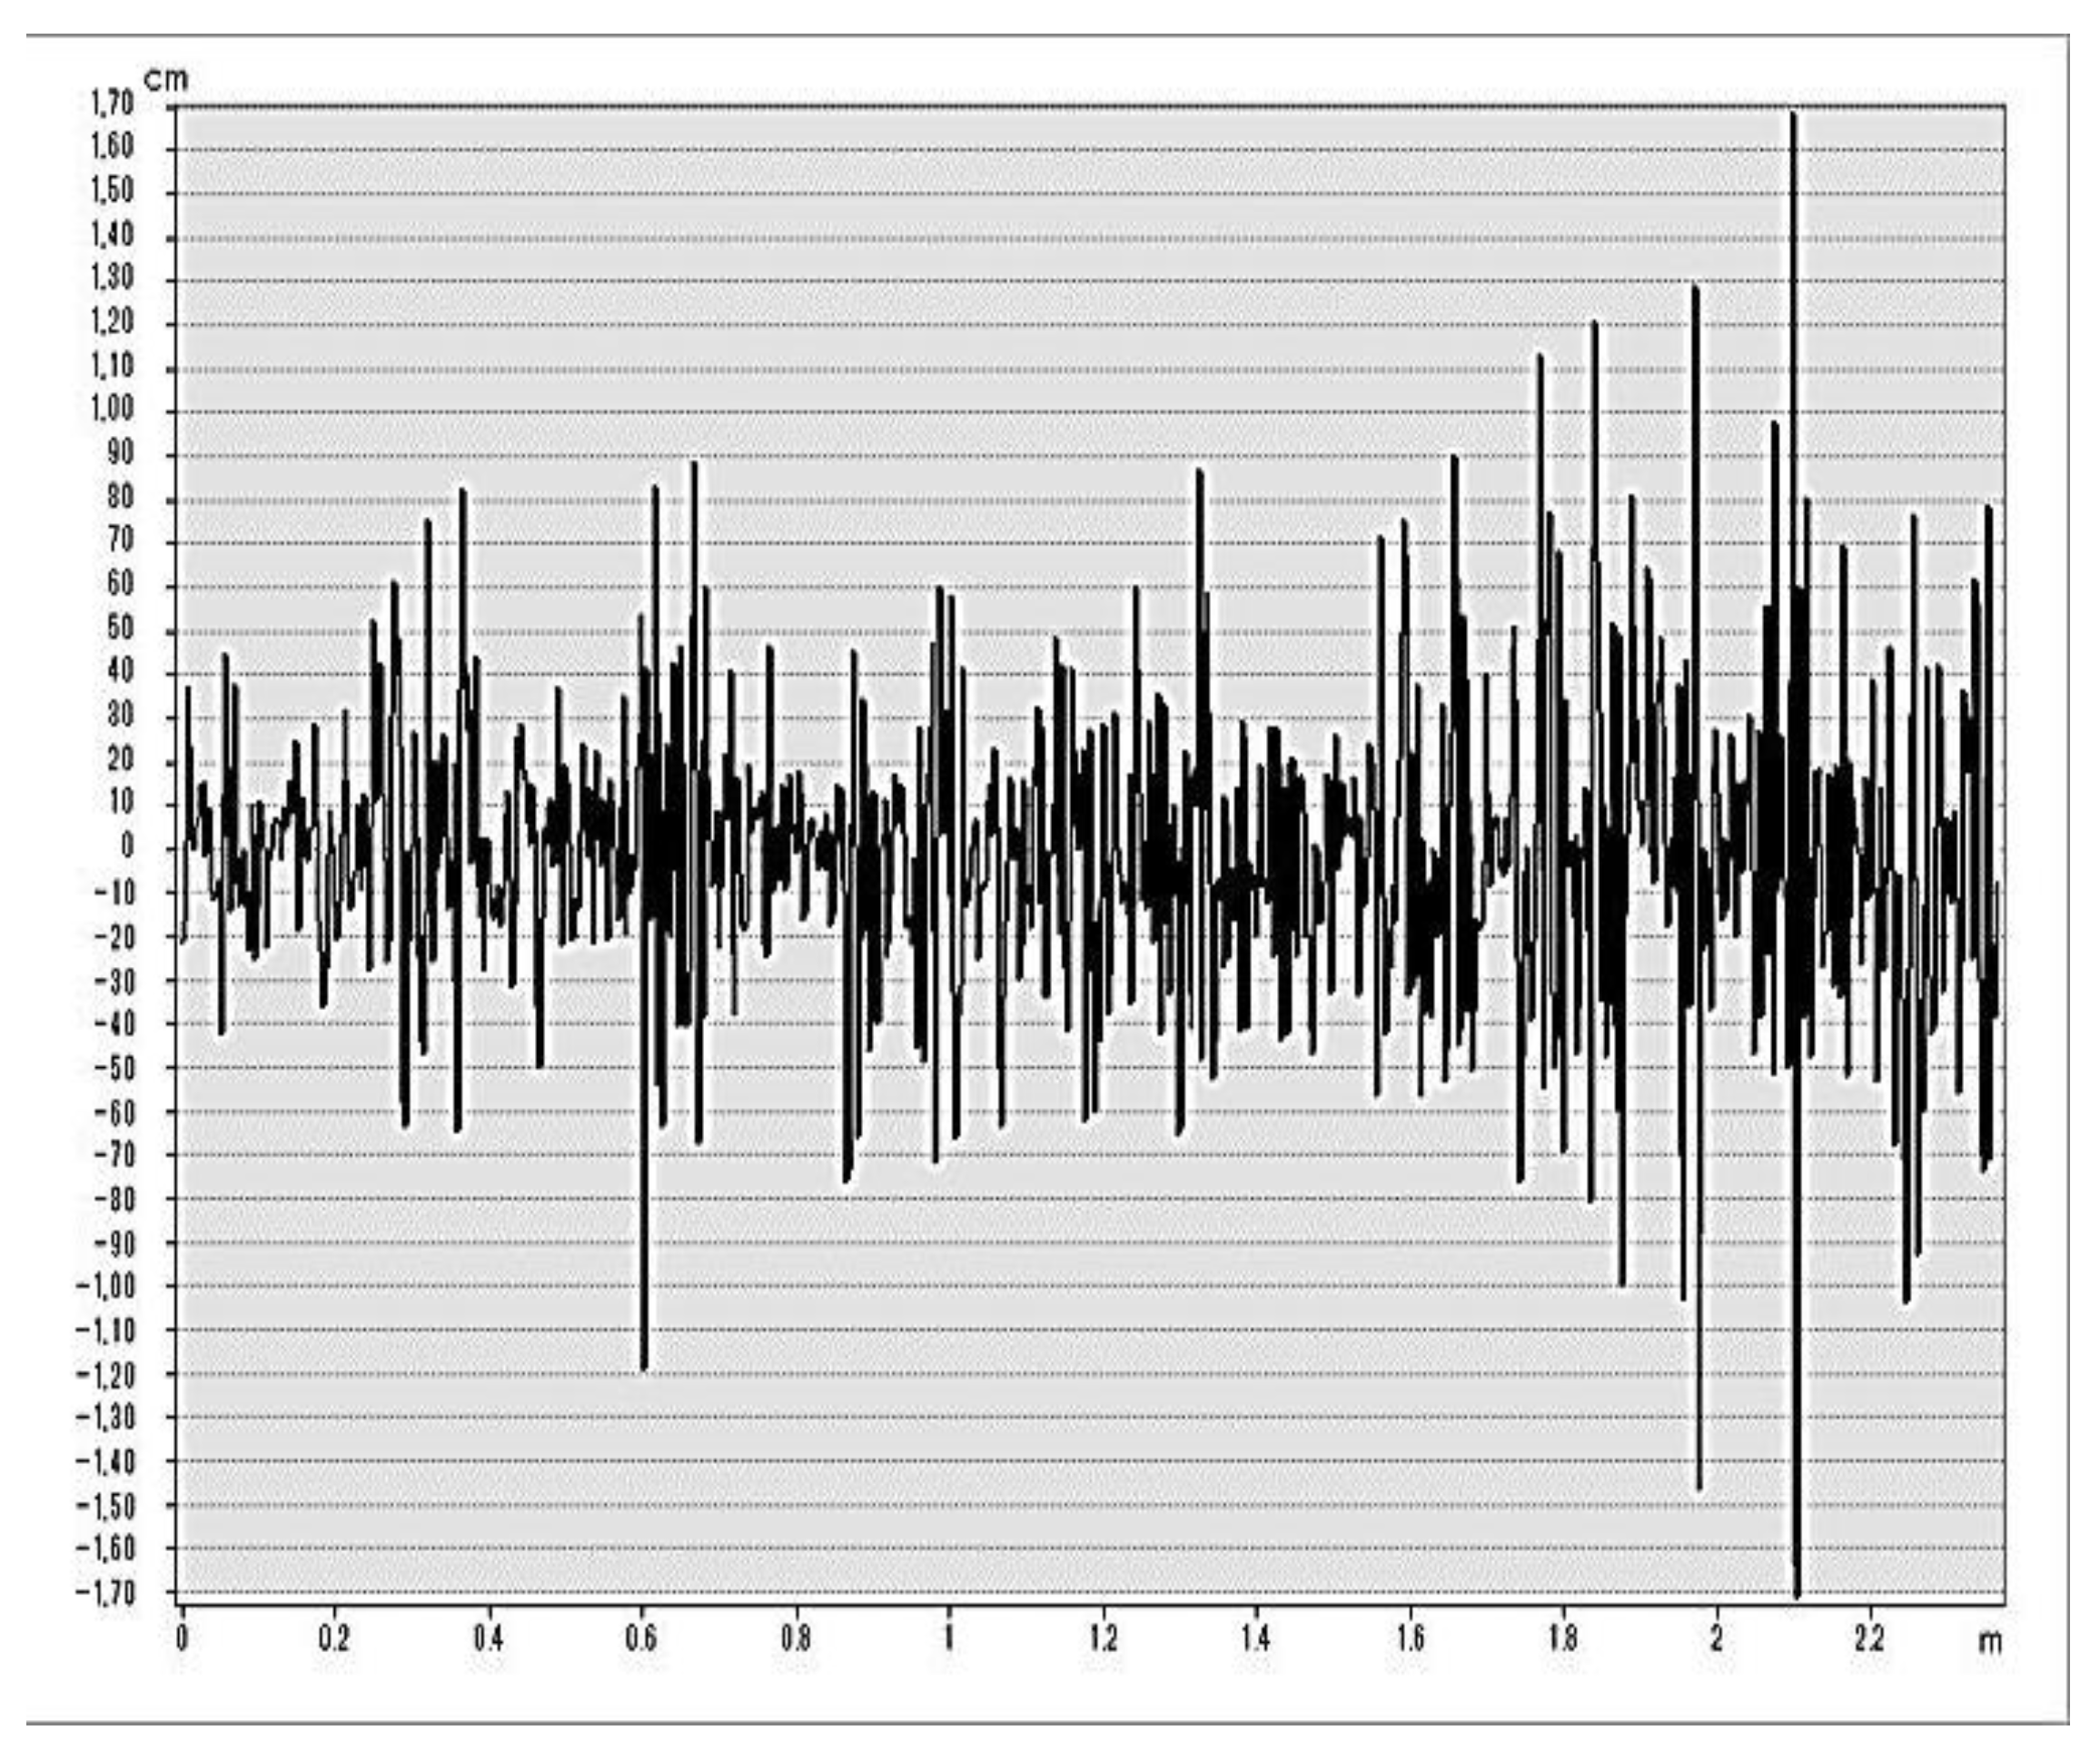
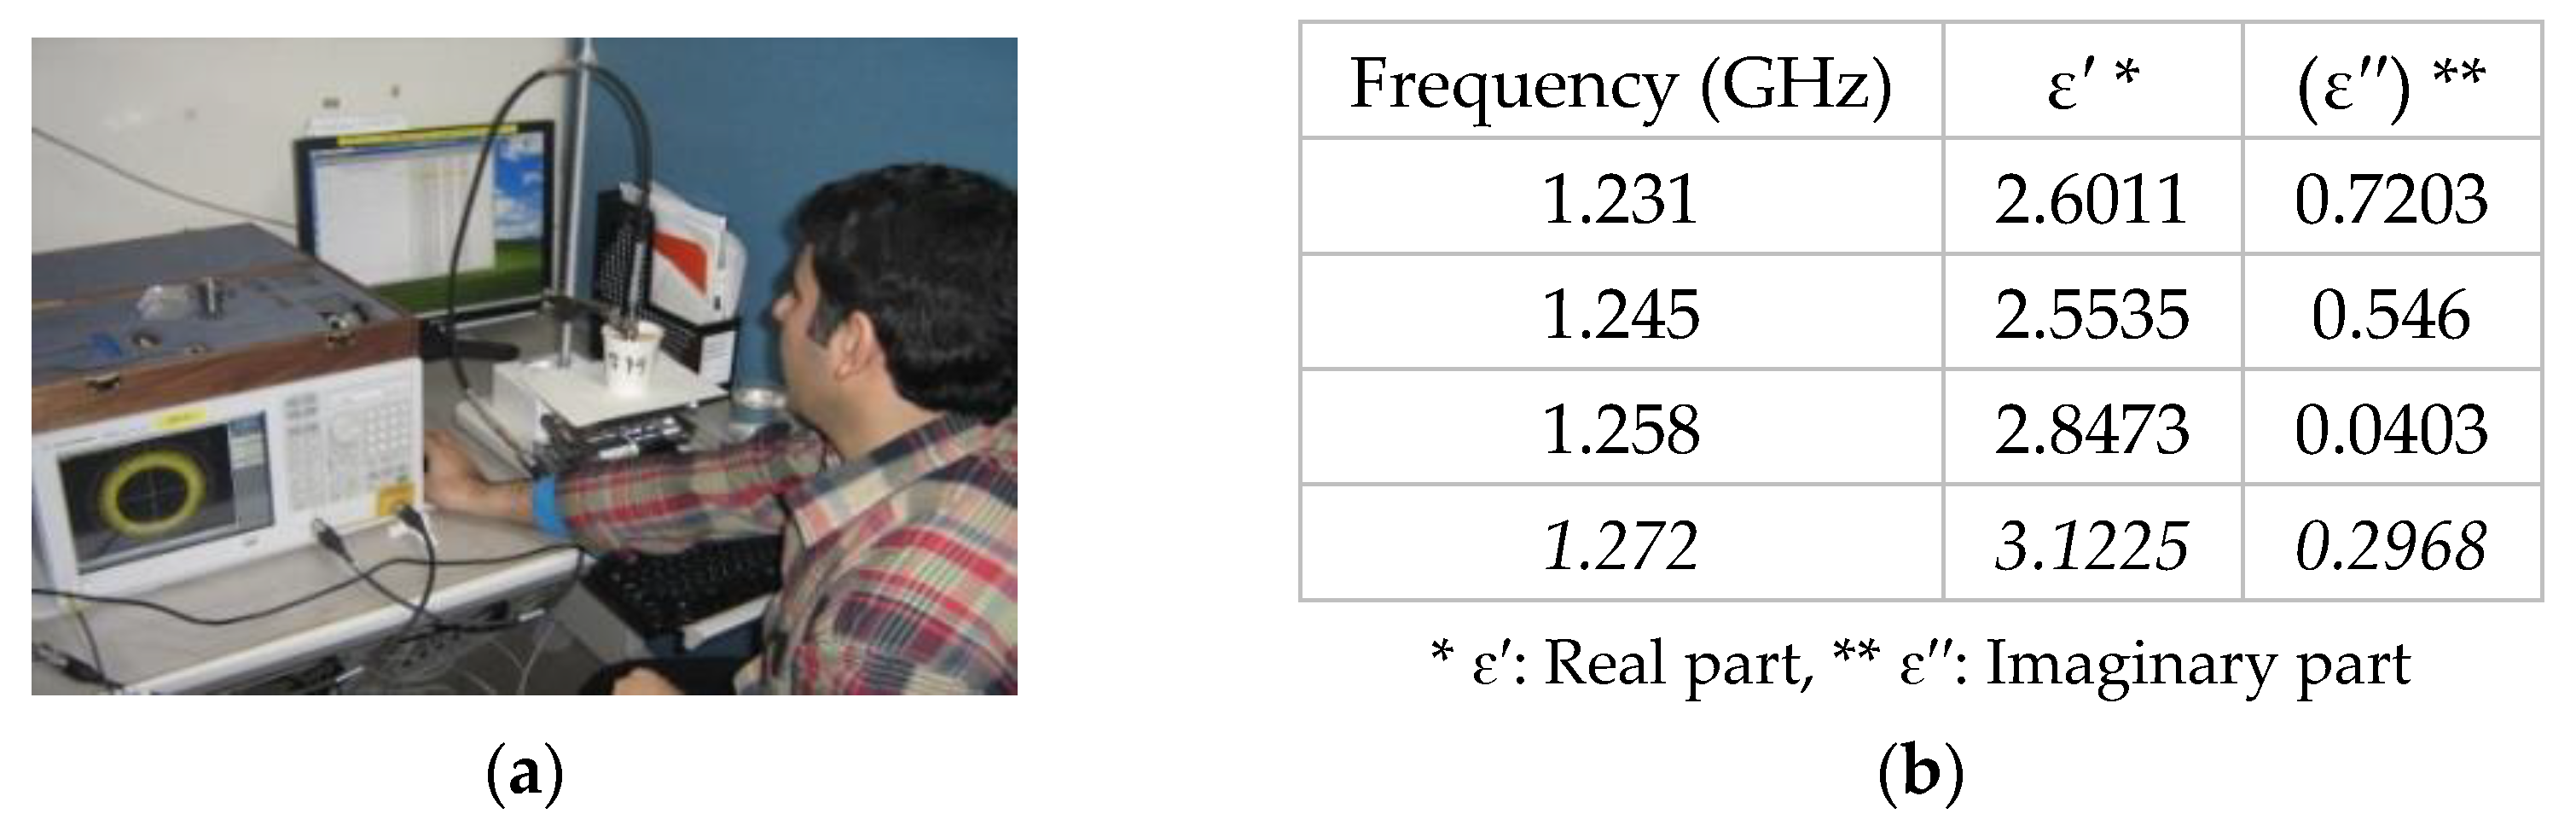
2.3. Soil Roughness and Dielectric Constant Measurements

The RMS height, correlation length, and autocorrelation function are calculated as surface roughness inputs to most backscatter models. In recent years, photogrammetry techniques and working with cameras that are not particularly designed for the requirements of photogrammetry have become common in close-range applications. Therefore, in this research, photogrammetry techniques were used. In this way, a point cloud and 3D digital terrain model (DTM) were created based on acquired ground photos by a digital camera in the field. Then, the DTM was imported to a GIS environment to calculate the surface roughness parameter for each field site (Figure 2 and Table 3). Figure 2 presents the one horizontal profile by 2.5 m in range of 3.4 cm of height change [50].
A network analyzer coupled with an open-air probe technique was used in the laboratory for the measurement of the soil dielectric constant from the soil samples obtained in the field (Figure 3) [51]. Soil moisture was measured in the field by TDR (time domain reflectance) from top soil in the field and laboratory. The thirty-two soil samples were taken randomly from a homogenous area of thirteen land cover unit areas (LUAs) in September and October 2011 from topsoil at a depth of 0–10 cm. For select the soil samples, we took the four samples in each field in the four different directions with ten-meter distance regarding the PALSAR image resolution, and afterwards, we mixed them to gather and make one soil sample that represented each field. Once completed, a one-half kilogram of soil was taken and kept within a double-zipped plastic bag for carriage to the laboratory for dielectric measurement. The measurement frequency was from 0.3 to 3 GHz with 200 sampling points, which are supposed to detect the L-band ALOS PALSAR (1.27 GHz range) data. The real (ε′) and imaginary parts (ε′′) of the complex dielectric constant of soil samples have been determined experimentally. The dielectric constant relative permittivity has a variable dependent on frequency that decreases with increasing frequency [52].

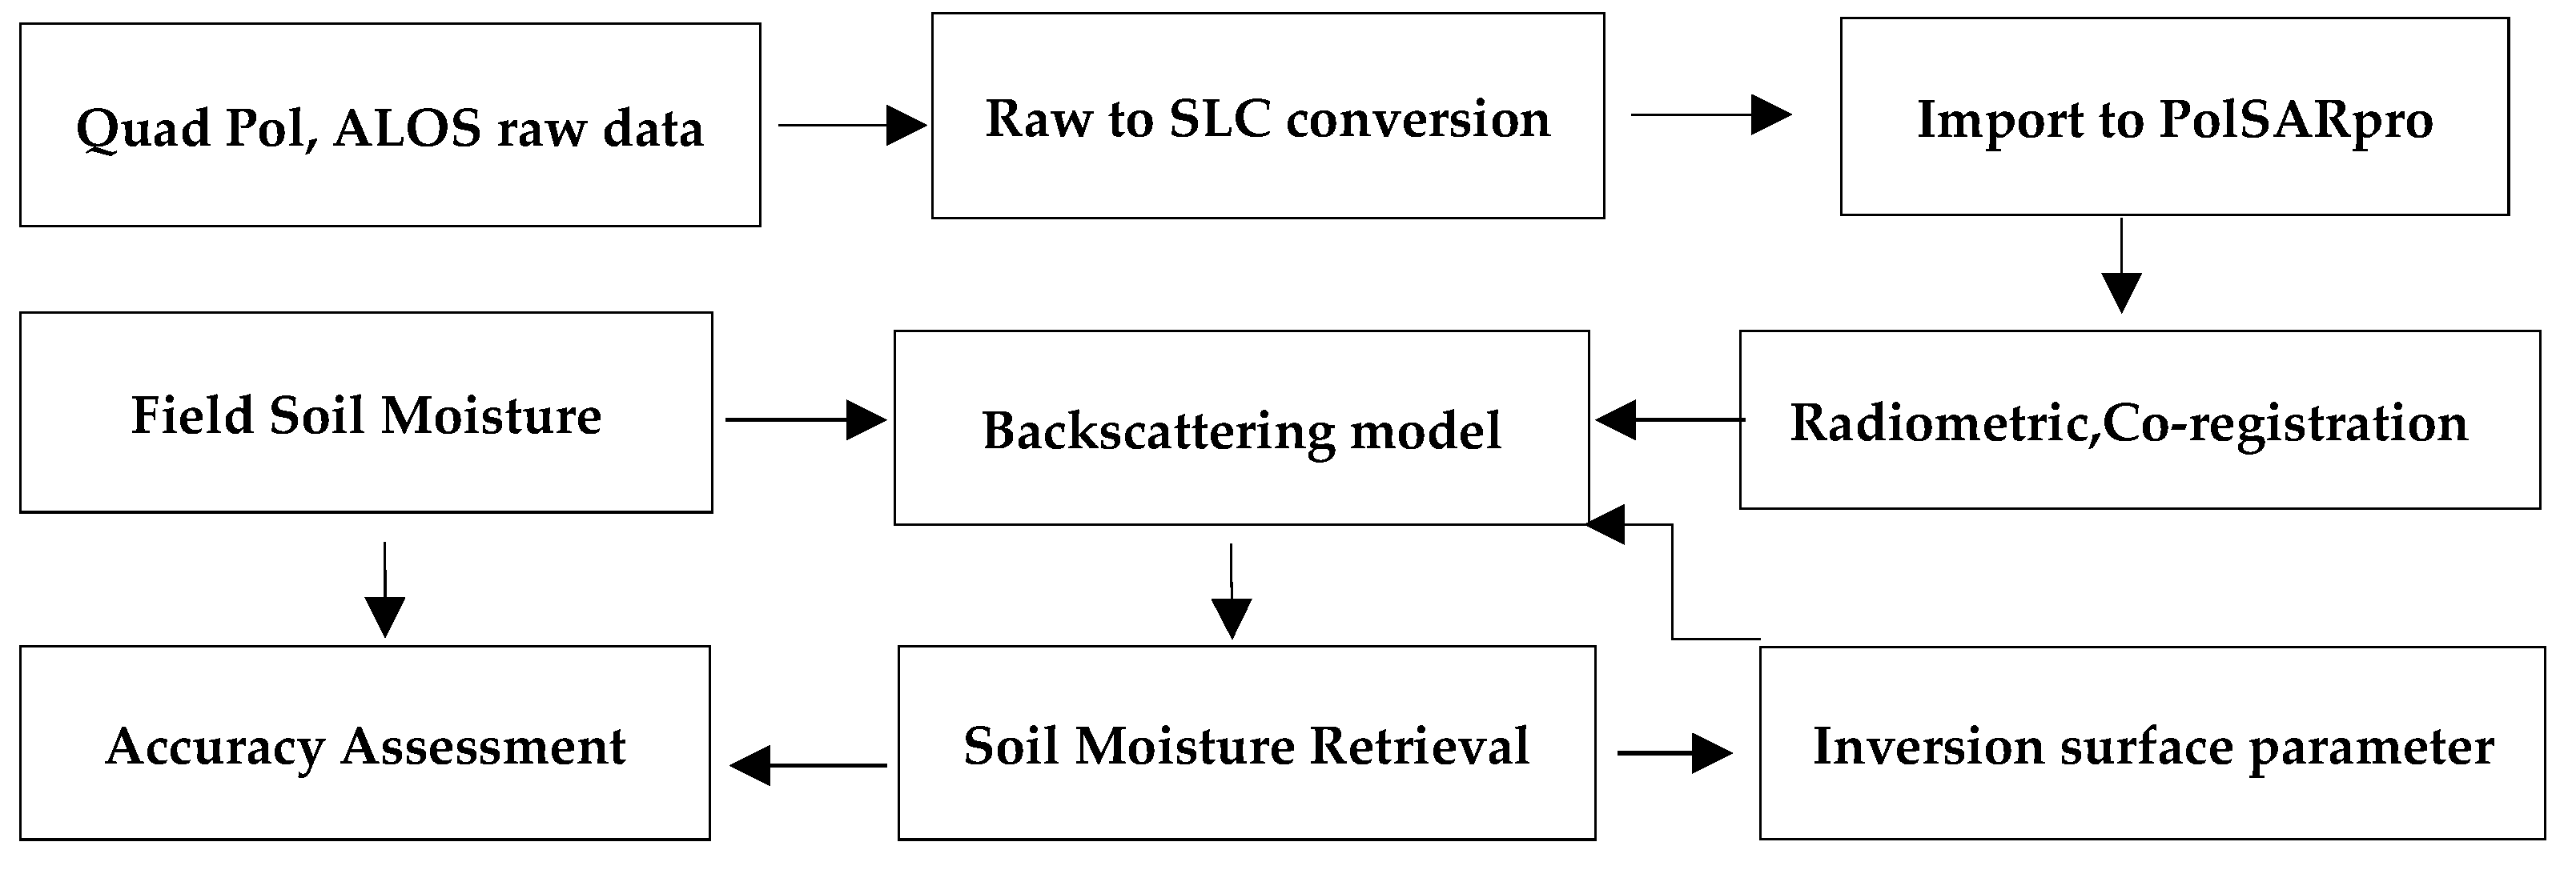
2.4. Processing Flow of Polarimetric ALOS Data

To extract the full information contained in the partial polarimetric ALOS PALSAR (PLR mode) data, we have developed a processing structure. The PALSAR sensor with the coherent-on receive operation allows decomposing the images employing PolSAR techniques. Therefore, we needed to perform radiometric calibration to obtain the backscattering coefficients of the horizontally and vertically polarized channels in HH and HV polarization and also for decomposition of the scattering matrix into its eigenvectors and eigenvalues. The PLR raw data were converted to single look complex (SLC) data using ENVI software. Geometric and radiometric calibration was conducted using the ASF (Alaska Satellite Facility) map-ready software and NEST. Speckle noise was removed by applying a Lee filter with 5*5 window size. Then, the processed images were imported to the PolSARpro software and MATLAB to do the polarimetric SAR processing. Figure 4 shows a simplified representation of the processing chain.
The Quad polarized PLR acquisitions of ALOS PALSAR enable the exploitation of the distributed target (2 × 2) complex covariance matrix ([C2]) and the complete (3 × 3) scattering matrix ([C3]), which are raw binary data off-diagonal elements. In this research, we used an eigenvector analysis of the 3 × 3 coherency [T3] matrix, as it provides a basis invariant description of the scattering target with a specific decomposition into types of scattering processes. This original approach employs a three-level Bernoulli statistical model to generate estimates of the average target matrix parameters. This statistical model assumption sets out a dominant “average” scattering mechanism in each resolution cell [53,54,55].

3. Results

The most important parameters and last products of the polarimetric decomposition are four images: the entropy, anisotropy, alpha angle, and span images (Figure 5, Figure 6 and Figure 7). Previously, they were imported into a GIS composed with the calibrated backscattering products, and the images were geocoded and orthorectified to obtain identical geometries. Then, these images could be used for backscattering understanding and comparison of mechanisms, and we could apply the enhanced model for deriving the soil moisture.
A simple visualized interpretation of the Pauli RGB in Figure 6 can illustrate how surface features are portrayed in the image, and its detail can be extracted based on the experience and local knowledge of the interpreter. In this RGB image, the color from black to red has shown the smooth to rough area, respectively. In the span image, which shows the total power of three eigenvalues, the black color to white color has shown respectively the surface backscattering to the volumetric backscattering (Figure 5, Figure 6 and Figure 7).
The decomposition of [T3] into three single scattering components is described by [T31], [T32], and [T33]. The sum of the three eigenvalues is defined as the span, or the total power received from the scattering target, and it would be very useful for detecting the homogeneous and heterogeneous area in the polarimetric SAR image.
Span = λ1 + λ2 + λ3
To extract the full information content of the PLR images, the different decomposition methods such as Freeman, Yamaguchi, and H/a/alpha decomposition are considered. Within the mean angular parameters ( α , β , δ , and γ) of the dominant scattering mechanism, this 3 × 3 coherency [T3] matrix can be extracted. The roll-invariant α is the main parameter for identifying the dominant scattering mechanism in terms of random media problems. The other three parameters ( β ,   δ , and γ ) can be used to define the target polarization orientation angle [55,56].
The entropy H ranges from 0 to 1. If the polarimetric entropy H is low (H < 0.3), the system may be considered weakly depolarizing and the dominant scattering mechanism.
The other important polarimetric feature is the anisotropy, which is defined as the normalized difference between the appearance probabilities of the second and the third target component [44,56].
A = P 2 P 3 P 2 + P 3 = λ 2 λ 3 λ 2 + λ 3
The anisotropy measures the relative importance of the second and the third eigenvalues of the eigen decomposition. The polarimetric anisotropy A also ranges from 0 to 1 and is a complementary parameter to the polarimetric entropy H. In PolSAR applications, it seems to be important to note that the polarimetric anisotropy A plays a key role and represents a very useful parameter to improve the capability of distinguishing different types of scattering processes, particularly when the polarimetric entropy reaches high values. In the polarimetric backscattering problem, the invariance of the eigenvalue problem under unitary transformation is the great advantage of the entropy and anisotropy parameters [14,57].

3.1. The Oh and Dubois Models

The quad pol ALOS data were applied to the Oh model for soil moisture retrieving. Figure 8 shows the result of soil moisture retrieval by the Oh model. This figure presents the soil moisture from the 22 October 2010 ALOS data acquisition date over the test site; this is the dry season, and the Vol% of soil moisture range from 0 to 35%; however, most of the area has soil moisture less than 5 Vol%. The green point spots are the small pool for animal drinking or a small cultivation site.
Figure 8. The volumetric soil moisture (Vol%) of the Dubois (a) and the Oh model (b) from 22 October 2010 and the rectangle (c,d) correspond to the same position of the Google Earth image in Figure 9.
Ijgi 10 00711 g008
Figure 9. The footprint of ALOS on Google Earth. Rectangles (c,d) indicate the two different land cover types and correspond to the same position of rectangles placed on the soil moisture map in Figure 8.
Ijgi 10 00711 g009
The accuracy of the prediction soil moisture by the Oh model after crossing to the observation soil moisture point was 5.4 Vol% RMS error, as shown in the result. The rectangles c and d on the image show the two different land covers of sparse vegetation and bare land, respectively. As already explained about backscattering from black color to white indicating the transition from smooth to rough surface due to land cover types. The Google Earth image also shows that the northern part has sparse vegetation and some agriculture field, and from northern to the southern part, the land cover changes to bare land. In the test site, most of the land cover is bare land, and some parts are sparse vegetation; to understand land cover, we tried to produce the normalized different vegetation index (NDVI) and normalized water index (NWI) using Landsat data that demonstrate the soil and water content in the land cover (Figure 10). Figure 10 also compares the Google Earth image and clearly presents the vegetation contents in NDVI from north to south, which correspond to the NWI image presenting the water contents decreasing from north to south.

3.2. DELTA Model

In this step, we applied the delta index by two ALOS FBD and Fine Beam Single (FBS) images from the dry (September) and wet season (March). Figure 11 presents the delta index of the soil moisture map in the study area. The Vol% of soil moisture of the delta model has shown the rate of 0–35% because in March, the test site soil had a higher level of moisture. The southern part of site is the flat region named Playa, and its ground water table is very high, about 50 cm; also, there is the seasonal river, which is clear in blue color with the highest moisture content. The other spot of blue color in the northern part is the irrigated area or the flooded area in the alluvial fan of the Hablerood River.
The RMS error considers the observation soil moisture points and predicts the soil moisture by that model’s result. The accuracy test for the regression statistical method achieved the 5.4 Vol% RMS, 7.9 Vol% RMS, and 3 Vol% RMS for the Oh and Delta indexes, respectively.
Figure 12 presents the relationship between soil moisture measurements in the field with soil moisture retrieval with three models (Oh, Dubois, delta) in different colors. Finally, measurement Vol% of soil moisture and the retrieval results of the Oh, Dubois, and delta models are compared with ground truth soil moisture. The summary of the results and the one sample point of the study area are presented in Figure 13. As the results show, the delta model is the theoretical index that achieved the highest accuracy, which is followed by Oh and Dubois models. The observation points of soil moisture used validate the results of the Dubois model, as 7.9 Vol% RMSE was achieved for this model. Moreover, the comparison between two of the semi-empirical Oh and Dubois inversion models showed that the Oh model is a more suitable model for the study area than the Dubois model. The Oh model works for a wider roughness range than the Dubois model, and the Oh model is more applicable in shorter wavelengths such as the P- and L-band. The Oh model also works on fully polarimetric data, while the Dubois model works just for co-polarization.

4. Discussion

SAR potentially is suitable for soil moisture estimation at high spatial/temporal resolution [58]. ALOS PALSAR products use state-of-the-art image processing techniques; however, the preprocessing techniques are inadequate. To extract the full information content of multi-channel PALSAR data, refined PolSAR preprocessing techniques were employed. When using a backscattering model to retrieve the soil moisture, the major impediment for surface soil moisture retrieval from SAR data lies in the separation of different scattering contributions to the backscattering coefficients. It is the complicated part according to the various properties of a land surface such as land cover, soil texture, and surface roughness. All these characteristics make up the different dielectric constant behavior, which has a relationship with the backscattering coefficient. In this regard, we should measure or simulate the natural surface characteristics as far as possible appropriately and quantitatively.
Taking all samples into consideration that were filed visually via in situ measurement, there was a wide range soil of moisture from 0 to 30 Vol% and a wide surface roughness range with RMS height between 0.3 and 5 cm, indicating that the area changed from smooth to rough. However, it is a quite special site with different subclasses of bare land with some parts consisting of very smooth claypan, which is excellent for SAR backscattering coefficient calibration. The other specialty of the test site is the soil property, which is cover by Aridisols; there have not been enough studies about the dielectric constant of this arid soil types.
Some important aspects are not considered by the Dubois model, such as the influence of the surface correlation length on the fields or the influence of topographic variations on the accuracy of the estimates. However, the Dubois model can estimate the validity range for the natural surface condition and should be in the range of Mv < 35 Vol% and ks < 2.5. Their accuracy is quantified as 4.2 Vol% for the soil moisture estimates and ks of 0.4 for the surface roughness over bare soil. However, it should be mentioned that the authors had several reasons to consider only the co-polarized signals in their model. Firstly, it should be mentioned the co-polarized backscattering coefficients are less sensitive to system noise and cross-talk, rendering the calibration of co-polarized channels more accurate, according to the study done by Freeman (1992) [59]. Additionally, the arrangement of effective and reliable calibration algorithms for polarimetric SAR data was still under development in the early and mid-1990s [14]. Therefore, the Dubois model working with co-polarized signals makes it a possibility to work with the dual acquired SAR data, whereas the Oh model strictly requires fully polarimetric data. The polarimetry SAR is the key to overcome these problems because it allows a direct or indirect separation of attenuation effects induced by surface roughness and vegetation by H/A/Alpha decomposition. By applying a PolSAR decomposition technique, namely the H/A/Alpha decomposition, the phase information was exploited to increase the amount of observables. In effect, most of the popular inversion approaches use polarimetric SAR imaging.
Soil moisture has a wide variability in study area and shows an RMS of around 3 to 8 Vol% in different approaches and test sites. However, we cannot compare fairly since the techniques and parameters are not similar. Generally, the map exhibits that Oh underestimates and Dubois overestimates the soil moisture. The best result was achieved by the delta index and then by the empirical statistic model followed by Oh and Dubois in order by RMSE error. The Oh model was the best, since it is working with full polarimetric data and it provides the better information by such a backscattering decomposition such an alpha and entropy to understand the natural surface.
In fact, there are lots of issues in microwave remote sensing for retrieving and estimating the physical characteristics of land, but particularly in this research, we can mention the backscattering complexity in mixed pixels of vegetated cover and bare area and agriculture area. As we mentioned before, there are aspects of the sensor properties and natural physical land that affect the backscattering model, so both of these aspects create difficulties in the backscattering model. For instance, in the sensor, the incident angle, SAR propagation wave, backscattering mechanism in the surface and underground land layer or vegetation attenuation, polarization mode etc., are very important for retrieving the soil moisture. On the other hand, the surface roughness is most important in the soil moisture retrieval, since it has a main influence on SAR backscatter.

5. Conclusions

Soil moisture exhibited wide variability in the study area and shows an RMS around 3 to 8 Vol% in different approaches and test sites. Generally, the Oh semi-empirical model underestimated and the Dubois model overestimated the soil moisture in the study site. The best result was achieved by the Oh model followed by the delta index and the Dubois, in order of RMSE error. Within the models, the Oh outperformed the Dubois model, as the remote sensing dataset used was fully polarimetric data, and the Oh model could provide better information through backscattering decomposition (e.g., alpha and entropy) to understand the natural surface. The SAR polarimetry is the key to overcome these problems because it allows a direct or indirect separation of attenuation effects induced by surface roughness and vegetation by H/A/Alpha decomposition. By applying a PolSAR decomposition technique, namely the H/A/Alpha decomposition, the phase information was exploited to increase the number of observables. In effect, most of the popular inversion approaches use polarimetric SAR imaging.
To conclude, the results have shown that the fully polarimetric L-band SAR backscattering model has good potential for soil moisture retrieval, but for accurate retrieval, the model needs the quantitative scatter attention from the land surface. The L-band SAR data are also very suitable for different land cover and vegetated land. The results of this study are not recommended for other different land cover and soil texture unless it has similar surface natural properties.
There are many issues in microwave remote sensing for the retrieval and estimation of physical characteristics of land, but particularly in this research, we can mention the backscattering complexity in mixed pixels of vegetated cover and bare area. On the other hand, the surface roughness is most important in soil moisture retrieval, since it has the main influence on SAR backscatter; therefore, the accurate surface roughness data could improve the result.
The multi-polarization/incident/frequency SAR data with high resolution, short revisiting time, and near real time acquisition might achieve a more accurate soil moisture map.
In future work, we suggest collecting more accurate surface roughness and vegetation properties, such as soil/plant water content, and applying the multiband SAR data such as ALOS-2 and Sentinel-1 in different land cover types, especially in sparsely vegetated areas in arid land regions.

Author Contributions

Saeid Gharechelou did the data processing and writing. Ryutaro Tateishi and Josaphat Tetuko Sri Sumantyo advised the methodology and Brian Alan Johnson, revised the manuscript. All authors have read and agreed to the published version of the manuscript.

Funding

This research received no external funding.

Institutional Review Board Statement

Not applicable.

Informed Consent Statement

Not applicable.

Data Availability Statement

Not applicable.

Conflicts of Interest

There is no conflict of interest.

References

  1. Verhoest, N.E.C.; Lievens, H.; Wagner, W.; Álvarez-Mozos, J.; Moran, M.S.; Mattia, F. On the soil roughness parameterization problem in soil moisture retrieval of bare surfaces from synthetic aperture radar. Sens. J. 2008, 8, 4213–4248. [Google Scholar] [CrossRef] [Green Version]
  2. Lakshmi, V. Remote Sensing of Soil Moisture. ISRN Soil Sci. 2013, 2013, 424178. [Google Scholar] [CrossRef]
  3. Gharechelou, S.; Tateishi, R.; Sharma, R.C.; Johnson, B.A. Soil Moisture Mapping in an Arid Area Using a Land Unit Area (LUA) Sampling Approach and Geostatistical Interpolation Techniques. ISPRS Int. J. Geo-Inf. 2016, 5, 35. [Google Scholar] [CrossRef] [Green Version]
  4. Aubert, M.; Baghdadi, N.; Zribi, M.; Ose, K.; El Hajj, M.; Vaudour, E.; Gonzalez-Sosa, E. Toward an operational bare soil moisture mapping using TerraSAR-X data acquired over agricultural areas. IEEE J. Sel. Top. Appl. Earth Obs. Remote Sens. (JSTARS) 2013, 6, 900–916. [Google Scholar] [CrossRef]
  5. El Hajj, M.; Baghdadi, N.; Zribi, M.; Bazzi, H. Synergic use of Sentinel-1 and Sentinel-2 images for operational soil moisture mapping at high spatial resolution over agricultural areas. Remote Sens. 2017, 9, 1292. [Google Scholar] [CrossRef] [Green Version]
  6. Foucras, M.; Zribi, M.; Albergel, C.; Baghdadi, N.; Calvet, J.C.; Pellarin, T. Estimation 500 m resolution soil moisture using Sentinel-1 and optical data synergy. Water 2020, 12, 866. [Google Scholar] [CrossRef] [Green Version]
  7. Gorrab, A.; Zribi, M.; Baghdadi, N.; Mougenot, B.; Lili-Chabaane, Z. Potential of X-band TerraSAR-X and COSMO-SkyMed SAR data for the assessment of physical soil parameters. Remote Sens. 2015, 7, 747–766. [Google Scholar] [CrossRef] [Green Version]
  8. El Hajj, M.; Baghdadi, N.; Belaud, G.; Zribi, M.; Cheviron, B.; Courault, D.; Charron, F. Irrigated grassland monitoring using a time series of TerraSAR-X and COSMO-SkyMed X-band SAR data. Remote Sens. 2014, 6, 10002–10032. [Google Scholar] [CrossRef] [Green Version]
  9. Ainsworth, T.L.; Kelly, J.P.; Lee, J.S. Classification comparisons between dual-pol, compact polarimetric and quad-pol SAR imagery. ISPRS J. Photogramm. Remote Sens. 2009, 64, 464–471. [Google Scholar] [CrossRef]
  10. Baghdadi, N.; Chaaya, J.A.; Zribi, M. Semiempirical Calibration of the Integral Equation Model for SAR Data in C-Band and Cross Polarization Using Radar Images and Field Measurements. IEEE Geosci. Remote Sens. Lett. 2011, 8, 14–18. [Google Scholar] [CrossRef] [Green Version]
  11. Ballester-Berman, J.D.; Vicente-Guijalba, F.; Lopez-Sanchez, J.M. Polarimetric SAR Model for Soil Moisture Estimation Over Vineyards at C-Band. Prog. Electromagn. Res. 2013, 142, 639–665. [Google Scholar] [CrossRef] [Green Version]
  12. Yang, L.; Feng, X.; Liu, F.; Liu, J.; Sun, X. Potential of soil moisture estimation using C-band polarimetric SAR data in arid regions. Int. J. Remote Sens. 2019, 40, 2138–2150. [Google Scholar] [CrossRef]
  13. Touzi, R.; Nedelcu, S.; Shimada, M. Polarimetric PALSAR System Model Assessment and Calibration. In Proceedings of the IEEE Geoscience and Remote Sensing Symposium, Boston, MA, USA, 7–11 July 2008; p. I-21. [Google Scholar]
  14. Ayari, E.; Kassouk, Z.; Lili-Chabaane, Z.; Baghdadi, N.; Bousbih, S.; Zribi, M. Cereal crops soil parameters retrieval using L-band ALOS-2 and C-band Sentinel-1 sensors. Remote Sens. 2021, 13, 1393. [Google Scholar] [CrossRef]
  15. Wang, H.; Allain, S.; Meric, S.; Pottier, E. Soil Moisture Characterization Using Multi-Angular Polarimetric Radarsat-2 Datasets; ESA Living Planet Symposium: Edimburgh, UK, 2013; pp. 1–4. [Google Scholar]
  16. Paloscia, S.; Pettinato, S.; Santi, E. Combining L and X band SAR data for estimating biomass and soil moisture of agricultural fields. Eur. J. Remote Sens. 2012, 45, 99–109. [Google Scholar] [CrossRef]
  17. Balenzano, A.; Satalino, G.; Lovergine, F.; Rinaldi, M.; Iacobellis, V.; Mastronardi, N.; Mattia, F. On the use of temporal series of L-and X-band SAR data for soil moisture retrieval. Capit Plain Case Study. Eur. J. Remote Sens. 2013, 46, 721–737. [Google Scholar] [CrossRef]
  18. Hosseini, M.; McNairn, H. Using multi-polarization C- and L-band synthetic aperture radar to estimate biomass and soil moisture of wheat fields. Int. J. Appl. Earth Obs. Geoinf. 2017, 58, 50–64. [Google Scholar] [CrossRef]
  19. Ponnurangam, G.G.; Rao, Y.S. The application of compact polarimetric decomposition algorithms to L-band PolSAR data in agricultural areas. Int. J. Remote Sens. 2018, 39, 8337–8360. [Google Scholar] [CrossRef]
  20. Edokossi, K.; Calabia, A.; Jin, S.; Molina, I. GNSS-Reflectometry and Remote Sensing of Soil Moisture: A Review of Measurement Techniques, Methods, and Applications. Remote Sens. 2020, 12, 614. [Google Scholar] [CrossRef] [Green Version]
  21. Dubois, P.C.; van Zyl, J.; Engman, T. Measuring soil moisture with imaging radars. IEEE Trans. Geosci. Remote Sens. 1995, 33, 915–926. [Google Scholar] [CrossRef] [Green Version]
  22. Oh, Y.; Sarabandi, K.; Ulaby, F.T. Semi-empirical model of the ensemble-averaged deferential Mueller matrix for microwave backscattering from bare soil surfaces. IEEE Trans. Geosci. Remote Sens. 2002, 40, 1348–1355. [Google Scholar] [CrossRef] [Green Version]
  23. Sikdar, M.; Cumming, I. A modified empirical model for soil moisture estimation in vegetated areas using SAR data. In Proceedings of the IEEE International Geoscience and Remote Sensing Symposium (IGARSS ’04), Anchorage, AK, USA, 20–24 September 2004; pp. 803–806. [Google Scholar]
  24. Ji, J.; van der Keur, P.; Thomsen, A.; Skriver, H. Soil moisture retrieval using the Danish L- & C- band polarimetric SAR. In Proceedings of the IEEE International Geoscience and RemoteSensing Symposium (IGARSS ’96), Lincoln, NE, USA, 31–31 May 1996; Volume 2, pp. 1300–1302. [Google Scholar]
  25. Baghdadi, N.; Holah, N.; Zribi, M. Soil moisture estimation using multi incidence and multi polarization ASAR data. Int. J. Remote Sens. 2006, 27, 1907–1920. [Google Scholar] [CrossRef]
  26. Choker, M.; Baghdadi, N.; Zribi, M.; El Hajj, M.; Paloscia, S.; Verhoest, N.E.C.; Lievens, H.; Mattia, F. Evaluation of the Oh, Dubois and IEM Backscatter Models Using a Large Dataset of SAR Data and Experimental Soil Measurements. Water 2017, 9, 38. [Google Scholar] [CrossRef]
  27. Baghdadi, N.; Saba, E.; Aubert, M.; Zribi, M.; Baup, F. Evaluation of radar backscattering models IEM, Oh, and Dubois for SAR data in X-band over bare soils. IEEE Geosci. Remote Sens. Lett. 2011, 8, 1160–1164. [Google Scholar] [CrossRef]
  28. Baghdadi, N.; Zribi, M.; Paloscia, S.; Verhoest, N.E.; Lievens, H.; Baup, F.; Mattia, F. 2015. Semi-empirical calibration of the integral equation model for co-polarized L-band backscattering. Remote Sens. 2015, 7, 13626–13640. [Google Scholar] [CrossRef] [Green Version]
  29. Chen, K.-S.; Wu, T.-D.; Tsang, L.; Li, Q.; Shi, J.; Fung, A.K. Emission of rough surfaces calculated by the integral equation method with comparison to three-dimensional moment method simulations. IEEE Trans. Geosci. Remote Sens. 2003, 41, 90–101. [Google Scholar] [CrossRef]
  30. Zribi, M.; Chahbi, A.; Shabou, M.; Lili-Chabaane, Z.; Duchemin, B.; Baghdadi, N.; Amri, R.; Chehbouni, A. Soil surface moisture estimation over a semi-arid region using ENVISAT ASAR radar data for soil evaporation evaluation. Hydrol. Earth Syst. Sci. 2011, 15, 345–358. [Google Scholar] [CrossRef] [Green Version]
  31. Fung, A.K.; Li, Z.; Chen, K.-S. Backscattering from a randomly rough dielectric surface. IEEE Trans. Geosci. Remote Sens. 1992, 30, 356–369. [Google Scholar] [CrossRef]
  32. Han, Y.; Bai, X.; Shao, W.; Jie, W. Retrieval of Soil Moisture by Integrating Sentinel-1A and MODIS Data over Agricultural Fields. Water 2020, 12, 1726. [Google Scholar] [CrossRef]
  33. Esch, S.; Korres, W.; Reichenau, T.G.; Schneider, K. Soil moisture index from ERS-SAR and its application to the analysis of spatial patterns in agricultural areas. J. Appl. Remote Sens. 2018, 12, 022206. [Google Scholar]
  34. Oh, Y. Robust inversion technique for retrieving soil moisture from multi-polarised backscatter of bare surface. Electron. Lett. 2006, 42, 414–415. [Google Scholar] [CrossRef]
  35. Oh, Y.; Sarabandi, K.; Ulaby, F.T. An inversion algorithm for retrieving soil moisture and surface roughness from polarimetric radar observation. In Proceedings of the IGARSS ‘94: Surface and Atmospheric Remote Sensing-Technologies, Data Analysis and Interpretation, Pasadena, CA, USA, 8–12 August 1994; pp. 1582–1584. [Google Scholar]
  36. Oh, Y. Quantitative retrieval of soil moisture content and surface roughness from multipolarized radar observations of bare soil surfaces. IEEE Trans. Geosci. Remote Sens. 2004, 42, 596–601. [Google Scholar] [CrossRef]
  37. Baghdadi, N.; Zribi, M. Evaluation of radar backscatter models IEM, Oh and Dubois using experimental observations. Int. J. Remote Sens. 2006, 27, 3831–3852. [Google Scholar] [CrossRef]
  38. Koyama, C.N.; Korres, W.; Fiener, P.; Schneider, K. Variability of surface soil moisture observed from multitemporal C-band synthetic aperture radar and field data. Vadose Zone J. 2010, 9, 1014–1024. [Google Scholar] [CrossRef] [Green Version]
  39. Hajnsek, I.; Jagdhuber, T.; Schon, H.; Papathanassiou, K.P. Potential of Estimating Soil Moisture Under Vegetation Cover by Means of PolSAR. IEEE Trans. Geosci. Remote Sens. 2009, 47, 442–454. [Google Scholar] [CrossRef] [Green Version]
  40. Hajnsek, I.; Pottier, E.; Cloude, S.R. Inversion of surface parameters from polarimetric SAR. IEEE Trans. Geosci. Remote Sens. 2003, 41, 727–744. [Google Scholar] [CrossRef]
  41. Ballester-Berman, J.; Lopez-Sanchez, J.M.; Fortuny-Guasch, J. Retrieval of biophysical parameters of agricultural crops using polarimetric SAR interferometry. IEEE Trans. Geosci. Remote Sens. 2005, 43, 683–694. [Google Scholar] [CrossRef]
  42. Schuler, D.L.; Lee, J.-S.; Kasilingam, D.; Nesti, G. Surface roughness and slope measurements using polarimetric SAR data. IEEE Trans. Geosci. Remote Sens. 2002, 40, 687698. [Google Scholar] [CrossRef]
  43. Hajnsek, I.; Pappathanassiou, K.P.; Reigber, A.; Cloude, S.R. Soil-moisture estimation using polarimetric SAR data. In Proceedings of the International Geoscience and Remote Sensing Symposium(IGARSS), Hamburg, Germany, 28 June–2 July 1999; Volume 41, pp. 727–744. [Google Scholar] [CrossRef]
  44. Merzouki, A.; McNairn, H.; Powers, J.; Friesen, M. Synthetic Aperture Radar (SAR) Compact Polarimetry for Soil Moisture Retrieval. Remote Sens. 2019, 11, 2227. [Google Scholar] [CrossRef] [Green Version]
  45. Thoma, D.P.; Moran, M.S.; Bryant, R.; Rahman, M.M.; Collins, C.D.H.; Keefer, T.O.; Noriega, R.; Osman, I.; Skrivin, S.M.; Tischler, M.A.; et al. Appropriate scale of soil moisture retrieval from high resolution radar imagery for bare and minimally vegetated soils. Remote Sens. Environ. 2008, 112, 403–414. [Google Scholar] [CrossRef]
  46. Zribi, M.; Baghdadi, N.; Holah, N.; Fafin, O. New methodology for soil surface moisture estimation and its application to ENVISAT-ASAR multi-incidence data inversion. Remote Sens. Environ. 2005, 96, 485–496. [Google Scholar] [CrossRef]
  47. Jaxa. Available online: http://www.eorc.jaxa.jp/ALOS/en/about/palsar.htm (accessed on 2 April 2015).
  48. Jackson, T.J.; Chen, D.; Cosh, M.; Li, F.; Anderson, M.; Walthall, C.; Doriaswamy, P.; Hunt, E.R. Vegetation water content mapping using Landsat data derived normalized di_erence water index for corn and soybeans. Remote Sens. Environ. 2004, 92, 475–482. [Google Scholar] [CrossRef]
  49. Chen, D.; Huang, J.; Jackson, T.J. Vegetation water content estimation for corn and soybeans using spectral indices derived from MODIS near-and short-wave infrared bands. Remote Sens. Environ. 2005, 98, 225–236. [Google Scholar] [CrossRef]
  50. Gharechelou, S.; Tateishi, R.; Johnson, B.A. A Simple Method for the Parameterization of Surface Roughness from Microwave Remote Sensing. Remote Sens. 2018, 10, 1711. [Google Scholar] [CrossRef] [Green Version]
  51. Agilent. Available online: http://www.keysight.com (accessed on 25 February 2015).
  52. Gharechelou, S.; Tateishi, R.; Johnson, B.A. Mineral Soil Texture–Land Cover Dependency on Microwave Dielectric Models in an Arid Environment. Land 2020, 9, 39. [Google Scholar] [CrossRef] [Green Version]
  53. Cloude, S.R. Polarisation: Applications in Remote Sensing; Oxford University Press: Oxford, UK, 2010; p. 493. [Google Scholar]
  54. Cloude, S.R.; Pottier, E. An entropy based classi¯cation scheme for land applications of polarimetric SAR. IEEE Trans. Geosci. Remote Sens. 1997, 35, 68. [Google Scholar] [CrossRef]
  55. Lee, J.S.; Pottier, E. Polarimetric Radar Imaging from Basics to Applications; CRC Press: Boca Raton, FL, USA, 2009. [Google Scholar]
  56. Pottier, E. Unsupervised Classification Scheme of PolSAR Images based on the Complex Wishard Distribution and the H/A/alpha Polarimetric Decomposition Theorem. In Proceedings of the 4th Int. Workshop on Radar Polarimetry, PIERS, Friedrichshafen, Germany, 5–27 May 1998; pp. 535–547. [Google Scholar]
  57. Gharechelo, S.; Tateishi, R.; Sumantyo, J.T.S. Interrelationship Analysis of L-Band Backscattering Intensity and Soil Dielectric Constant for Soil Moisture Retrieval Using PALSAR Data. Adv. Remote Sens. 2015, 4, 15–24. [Google Scholar] [CrossRef] [Green Version]
  58. Thoma, D.P.; Moran, M.S.; Bryant, R.; Rahman, M.; Holifield-Collins, C.D.; Skirvin, S.; Sano, E.E.; Slocum, K. Comparison of four models to determine surface soil moisture from C-band radar imagery in a sparsely vegetated semiarid landscape. Water Resour. Res. 2006, 42, 1–12. [Google Scholar] [CrossRef] [Green Version]
  59. Freeman, A. SAR calibration: An overview. IEEE Trans. Geosci. Remote Sens. 1992, 30, 1107–1121. [Google Scholar] [CrossRef]
Figure 1. Test site location using Landsat RGB image and soil sample points in the northern part of Iran.
Ijgi 10 00711 g001
Figure 2. Profile line (2.5 m) of surface roughness modeling with photogrammetry technique in GIS.
Ijgi 10 00711 g002
Figure 3. Dielectric constant measurement toolkit (a), and some soil sample results are shown in the right table of for samples in the field (b).
Ijgi 10 00711 g003
Figure 4. Process chain for quad polarization ALOS PALSAR data.
Ijgi 10 00711 g004
Figure 5. Entropy alpha plane and its distribution from the backscattering decomposition analysis using full polarization ALOS PALSAR data (22 October 2010).
Ijgi 10 00711 g005
Figure 6. The HH polarization of quad pol PALSAR data on the left, the Pauli RGB (color coded as red = |HH − VV|, green = |HV|, and blue = |HH + VV|) in the middle, and the Span total power image on the right.
Ijgi 10 00711 g006
Figure 7. The alpha decomposition: red shows the rough area, blue shows the smooth area, and the moderate is shown in green on the left; the entropy image is in the middle; and the anisotropy image in the right.
Ijgi 10 00711 g007
Figure 10. The result of NWI (a) from low to high water content and NDVI (b) from low to high vegetation cover using Landsat data. The rectangles (c,d) correspond to the same position of rectangles in the Google Earth image in Figure 9.
Ijgi 10 00711 g010
Figure 11. Soil moisture map result of the delta index, and the rectangles (c,d) correspond to the same rectangle placed on the Google Earth image in Figure 9.
Ijgi 10 00711 g011
Figure 12. The graph shows the relationship with field soil moisture (Vol%) and retrieval soil moisture for the three models: Oh, Dubois, and delta.
Ijgi 10 00711 g012
Figure 13. The comparison of soil moisture results of the study area by different methods against the field soil moisture measurement (Vol%) showed in the points.
Ijgi 10 00711 g013
Table 1. Comparison between the backscattering models in different natural surface conditions.
ModelsDelta Oh ModelDubois Model
Frequency (GHz)All1–9 (suitable for C, X-band)1–11 (suitable for L, C, X-band)
Incidence angle (θ)All 10 70 ° 30 65 °
RMS (s) cmAllks < 3 *ks < 2.5
Correlation lengthAll__
Data polarizationAllFull polarimetricCo-polarization (HH, VV)
Soil moisture adaptionDry soil9 < Mv < 31 Vol%<35 Vol%
* ks = (2 π λ ). RMS height.
Table 2. The satellite dataset used in this research and monthly average of rain/temperature.
SensorModePolarizationOff-Nadir AngleTime (Local)DateRain/Temperature (Month/Avg)
ALOSFBS
FBD
HH
HH, HV
32.3
34.3
19:00:12
18:57:00
11 March 2010
16 September 2010
12.2/16
0/27.4
PLRHH, HV,
VH, VV
22.116:21:1022 October 20102/23.4
LANDSAT
(ETM+)
Nadir7:35:1516 September 20100/26.2
Table 3. The classification of the roughness type in the study area with a real ground photo of the land.
Roughness TypeRMS HeightGround Real Photo
Slightly rough<1.5 cm Ijgi 10 00711 i001
Moderate rough1.5–3.5 cm Ijgi 10 00711 i002
Rough>3.5 cm Ijgi 10 00711 i003
Publisher’s Note: MDPI stays neutral with regard to jurisdictional claims in published maps and institutional affiliations.

