Article

The Evolvement of Rail Transit Network Structure and Impact on Travel Characteristics: A Case Study of Wuhan

1
School of Urban Design, Wuhan University, Wuhan 430072, China
2
Rail Transit Department, Wuhan Transportation Development Strategy Institute, Wuhan 430014, China
*
Author to whom correspondence should be addressed.
ISPRS Int. J. Geo-Inf. 2021, 10(11), 789; https://0-doi-org.brum.beds.ac.uk/10.3390/ijgi10110789
Submission received: 4 August 2021 / Revised: 2 November 2021 / Accepted: 16 November 2021 / Published: 18 November 2021
(This article belongs to the Special Issue Geo-Information for Developing Urban Infrastructures)

Abstract

:
The expansion of the rail transit network has a positive impact on travel characteristics under spatial and temporal constraints by changing accessibility. However, few empirical studies have examined the longitudinal evolution of the impact of accessibility and travel characteristics. In this paper, a model of the Wuhan rail transit network is constructed and the evolution of the spatial pattern of accessibility over different periods is analyzed. The correlation of accessibility with rail transit travel characteristics is studied longitudinally to provide theoretical support for rail transit construction and traffic demand management. The study shows that: (1) Wuhan’s rail transit network has evolved from a tree to a ring, improving the operational efficiency. (2) The accessibility of Wuhan’s rail transit network has evolved into a circular structure, showing a decreasing trend away from the city center. (3) The change of accessibility greatly affects travel characteristics. The higher the accessibility, the higher the traffic volume, and the lower the travel frequency, the more residents travel during peak hours, and the shorter the travel distance. These findings are useful for gaining insight into public transportation demand in large cities, and thus for developing reasonable transportation demand management policies.

1. Introduction

In the context of rapid urban development, unreasonable travel demand distribution has triggered long-distance detours, traffic congestion, and other problems, which restrict the efficiency of urban operation and seriously affect the quality of life of residents. Grasping the evolving trend of residents’ travel demand characteristics is a prerequisite for promoting the high-quality development of urban transportation. Since the reform and opening-up, China’s urbanization mode has gradually changed to the in-fill development stage, driven by transportation facilities after the expansion development stage, which is further driven by the land factor. As the most important infrastructure of big cities, the rapid expansion of urban rail transit networks has a deep impact on the overall operational efficiency of cities. In the face of the expanding urban space scale and increasing traffic travel pressure, the construction of an urban spatial structure with a rail transit network as the backbone has become an important measure for big cities to improve their urban operational efficiency [1]. Resident travel characteristics involve the mapping of spatial interactions to the urban functional structure. Different travel evolution characteristics characterize the changes in urban physical space and are an important basis for optimizing urban traffic organization. Therefore, the study of the spatiotemporal evolution of the rail transit network and the characteristics of residents’ travel is beneficial for the screening of public transportation demand in the metropolis, in order to optimize the network deployment and develop reasonable traffic demand management policies to realize the priority development of public transportation.
A large number of studies have shown that, with the continuous construction of urban rail transit lines, the rail transit network tends to become more complicated. Since the introduction of complex network theory into the field of public transportation, a large number of scholars have analyzed urban rail transit from the perspective of complex network models. Most of such research involves a horizontal comparison process. [2] Previously, the rail transit network structure of 10 typical cities have been selected, and the network topology analyzed. This horizontal comparison is also common in other transportation fields [3,4]. In fact, the idea of vertical comparison has already had partial research results in many fields. Wandelt et al. measured the evolution of international air transport national networks from 2002 to 2013 [5]. Ding R et al. (1995–2017) studied the evolution of Kuala Lumpur’s public transportation network over the year [6]. Resident travel characteristics include travel mode, travel frequency, travel distance, travel peak, etc. Existing studies on the factors affecting residents’ travel mostly consider the impact of built environment characteristics on travel. Cervero [7] summarizes the built environment that affects residents’ travel as 5 “D”, which includes density, diversity, design, destination accessibility, and distance to transit. A large number of literary studies have explored the relationship between the urban built environment and travel, but relatively few studies have analyzed the impact of rail transit accessibility on residents’ travel behavior. Meanwhile, existing studies are mostly based on cross-sectional data for analysis but lack the support of time-series panel data and cannot be used to explore the dynamic response law of rail transit network expansion and residents’ travel characteristics. The continuous development of time series big data provides new opportunities for scholars to explore complex travel behaviors.
Based on this, this paper explores the topological evolution process of the Wuhan rail transit network structure by measuring the topological indicators over the years and discusses the spatiotemporal distribution pattern of accessibility. A longitudinal design based on dynamic time-series big data is established to study the effects of accessibility on residents’ travel characteristics. This was carried out to fill the gap left by existing studies on the longitudinal analysis of accessibility and travel characteristics. The spatiotemporal effects of accessibility on residents’ travel characteristics are examined in terms of five aspects: average trip volume, average trip frequency, average trip distance, morning and evening peak hours, and peak hour traffic. The study aims to: (1) Provide theoretical support for the construction timing of the Wuhan rail transit network and improve the efficiency of rail transit operations. (2) Screen the characteristics of rail travel in large cities and provide some suggestions for public transportation demand management policies in Wuhan.
The remainder of this paper is organized as follows. In the following section, we review the literature on the influence of accessibility on residents’ travel behavior. The Section 3 introduces the study area, data sources, and research methods. The modeling results are discussed in the Section 4. The Section 5 discusses the results and development trends of rail transportation in Wuhan. In the last section, we conclude the key findings and offer implications for planning and transport practices.

2. Literature Review

2.1. Rail Transit Complex Network Model

Urban public transportation networks and residents’ travel characteristics have always been key areas of research for traffic engineering and urban planning scholars. Early studies on urban public transportation networks mostly focused on the use of complex network theory to describe the characteristics of urban public transportation networks [8,9,10]. Derrible et al. [11] conducted a horizontal comparative study of 33 urban rail transit systems around the world and found that rail transit networks are complex and have scale-free and small-world characteristics. The initial topological structure of rail transit construction and operation is relatively simple. With the acceleration of construction, complex network characteristics are presented at both the spatial structure level and the operation level [12]. At the same time, there are many research results of longitudinal comparative analysis that characterize the complex network evolution characteristics of public transportation networks through time-series data. As a complex dynamic system, inherent static network index characteristics cannot reflect the influence of travel characteristics on network functions, and it is difficult to fit the actual operating characteristics of the network [13]. Therefore, the dynamic analysis method based on the characteristics of passenger flow has received more attention [14]. Xiao et al. [15] studied the dynamic characteristics of the rail transit network from both static and dynamic measurement levels and found that the heterogeneity of the rail transit network changes with time when considering the characteristics of passenger flow. The main research methods of complex networks are all based on the theories and methods of graph theory. The public transportation network model has four construction methods: Space-L, Space-P, Space-B, and Space-C [16]. In the urban rail transit system, rail transit stations or lines are connected by different organizational principles. Each line connects various stations along the line in series and maintains the connection with other lines through transfer stations. The Space-L network abstracts the stops of rail transit lines into nodes, which helps to understand the specific trajectory of each rail transit line. Du et al. [17] established a rail transit weighted network based on the weight of the passenger flow index based on the Space-L static topology structure to reflect the characteristics of the dynamic network structure.

2.2. The Influence of the Accessibility on Residents’ Travel Behavior

In the context of urban polycentric structures, accessibility can more directly reflect the spatial structure of cities and highlight the impact of transportation infrastructure on the mobility of residents [18]. Handy [19] defines mobility as the potential to move, i.e., the ability to move from one place to another, while accessibility is defined as the potential for interactions between different, dispersed urban activities. In an increasingly mobile urban society, a key quality of locations is their physical accessibility or the quality of their connectivity to transportation networks at multiple spatial scales [20]. Multiple approaches exist in the literature to derive operational measures of accessibility. These measures fall into two categories depending on whether they are based on the concept of gravity/spatial interaction or consumer utility [21,22]. Of these two categories, gravity-based measures are certainly the most commonly used in practice, as they are easy to implement, interpret, and communicate [23]. In addition to the concept of gravity, another approach to understanding spatial interactions involves intervention opportunities. A key aspect of gravity-based accessibility measures is that they measure the potential for interaction between origin and destination [24]. In addition to the concept of gravity, another approach to understanding spatial interactions focuses on the opportunity to travel from origin to destination, also as a measure of traveler opportunity [25].
A large number of scholars have conducted analysis and research on the accessibility of rail transit networks based on complex networks [26,27]. Bonotti R et al. analyzed the Brescia light rail system, evaluated the space-time efficiency of public transportation facilities, and revealed the space–time accessibility changes after the light rail entered operation [28]. Existing studies have shown that the expansion of a rail transit network profoundly affects time accessibility. With the development of time and space of the rail transit network, accessibility produces corresponding regional responses, forming a sparse isochronism that deviates from the urban center [29,30]. Existing studies have shown that rail transit has multiple effects on residents’ travel characteristics. Research based on Singapore’s multi-day credit card data demonstrates that the individual travel characteristics of residents show temporal and spatial regularity [31]. Rail transit has profoundly affected the travel characteristics of residents and promoted the diversification of residents’ travel modes [32,33]. In Portland, Oregon, a study on the explanatory factors of residents’ travel in the context of commuting explained the changes in residents’ affinity for travel [34]. Pan et al. [35] found that rail transit is more attractive to residents in the suburbs of the city based on an empirical study on travel in Shanghai. Throughout the previous studies, research on accessibility and travel behavior mostly concerns the analysis of cross-sectional data and lacks the measurement of correlations. Fewer studies have involved dynamic time-series big data. This study uses longitudinal analysis to provide support for the theory of accessibility and residential travel.

3. Materials and Methods
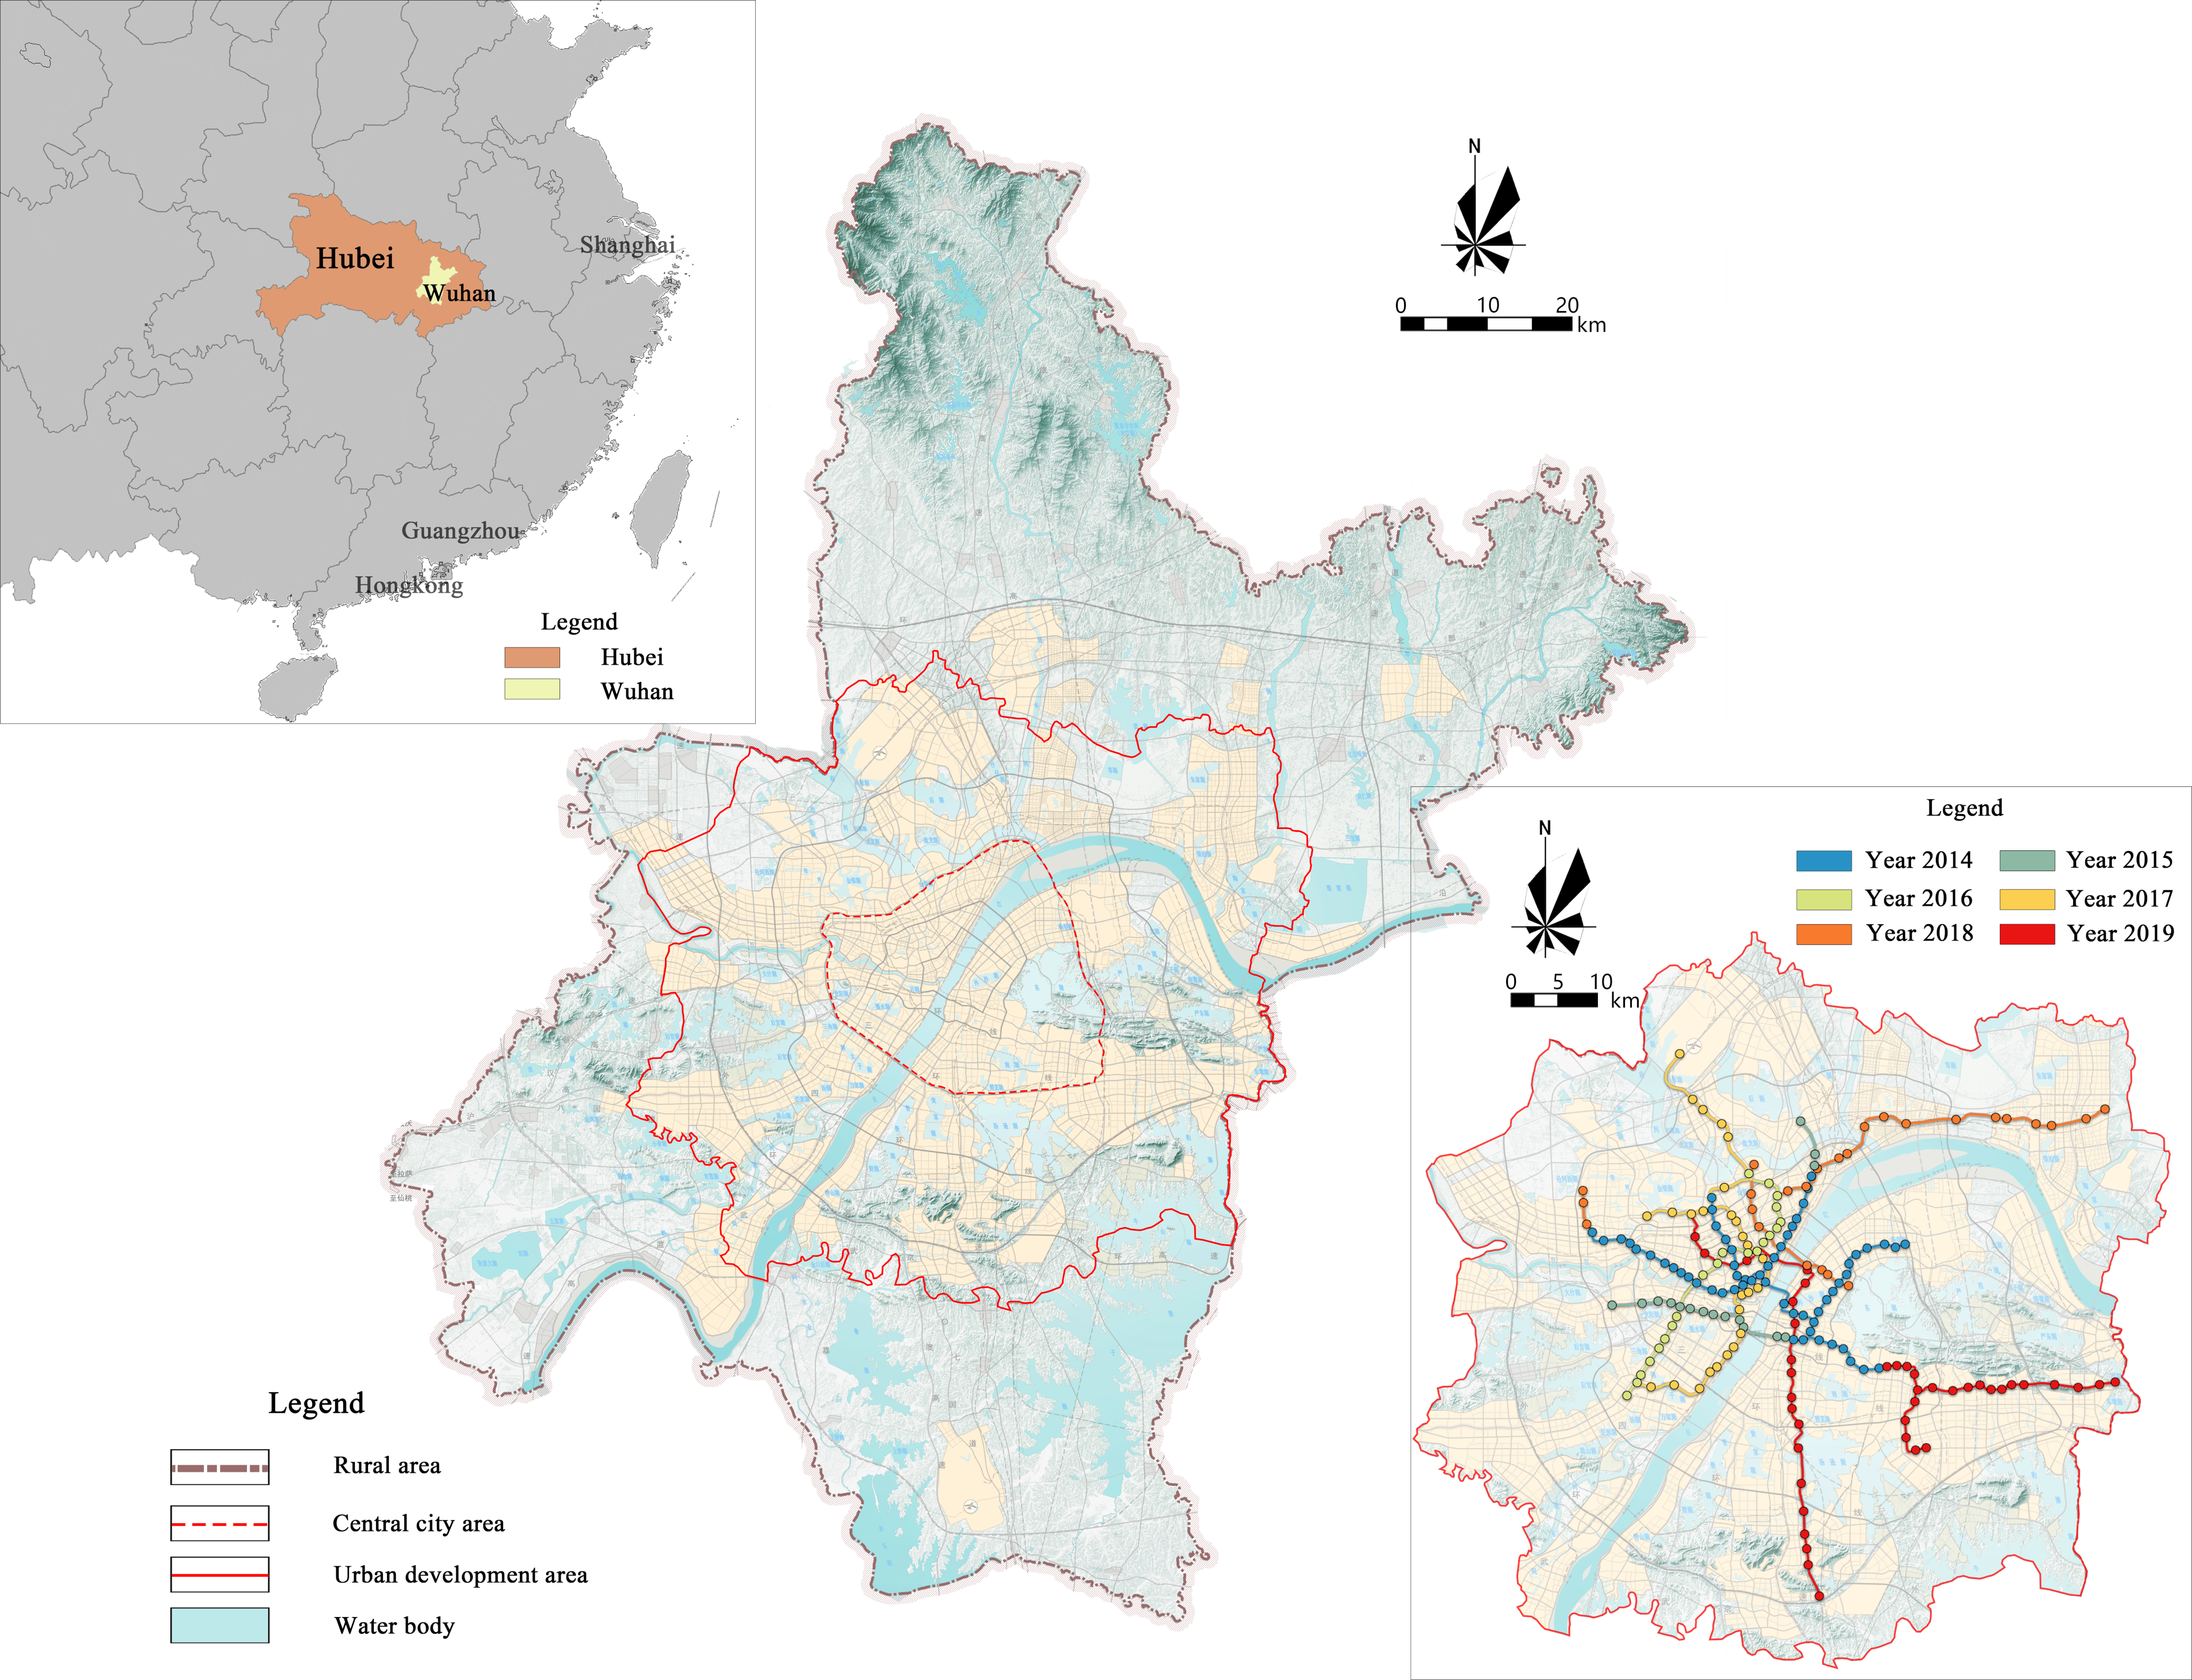
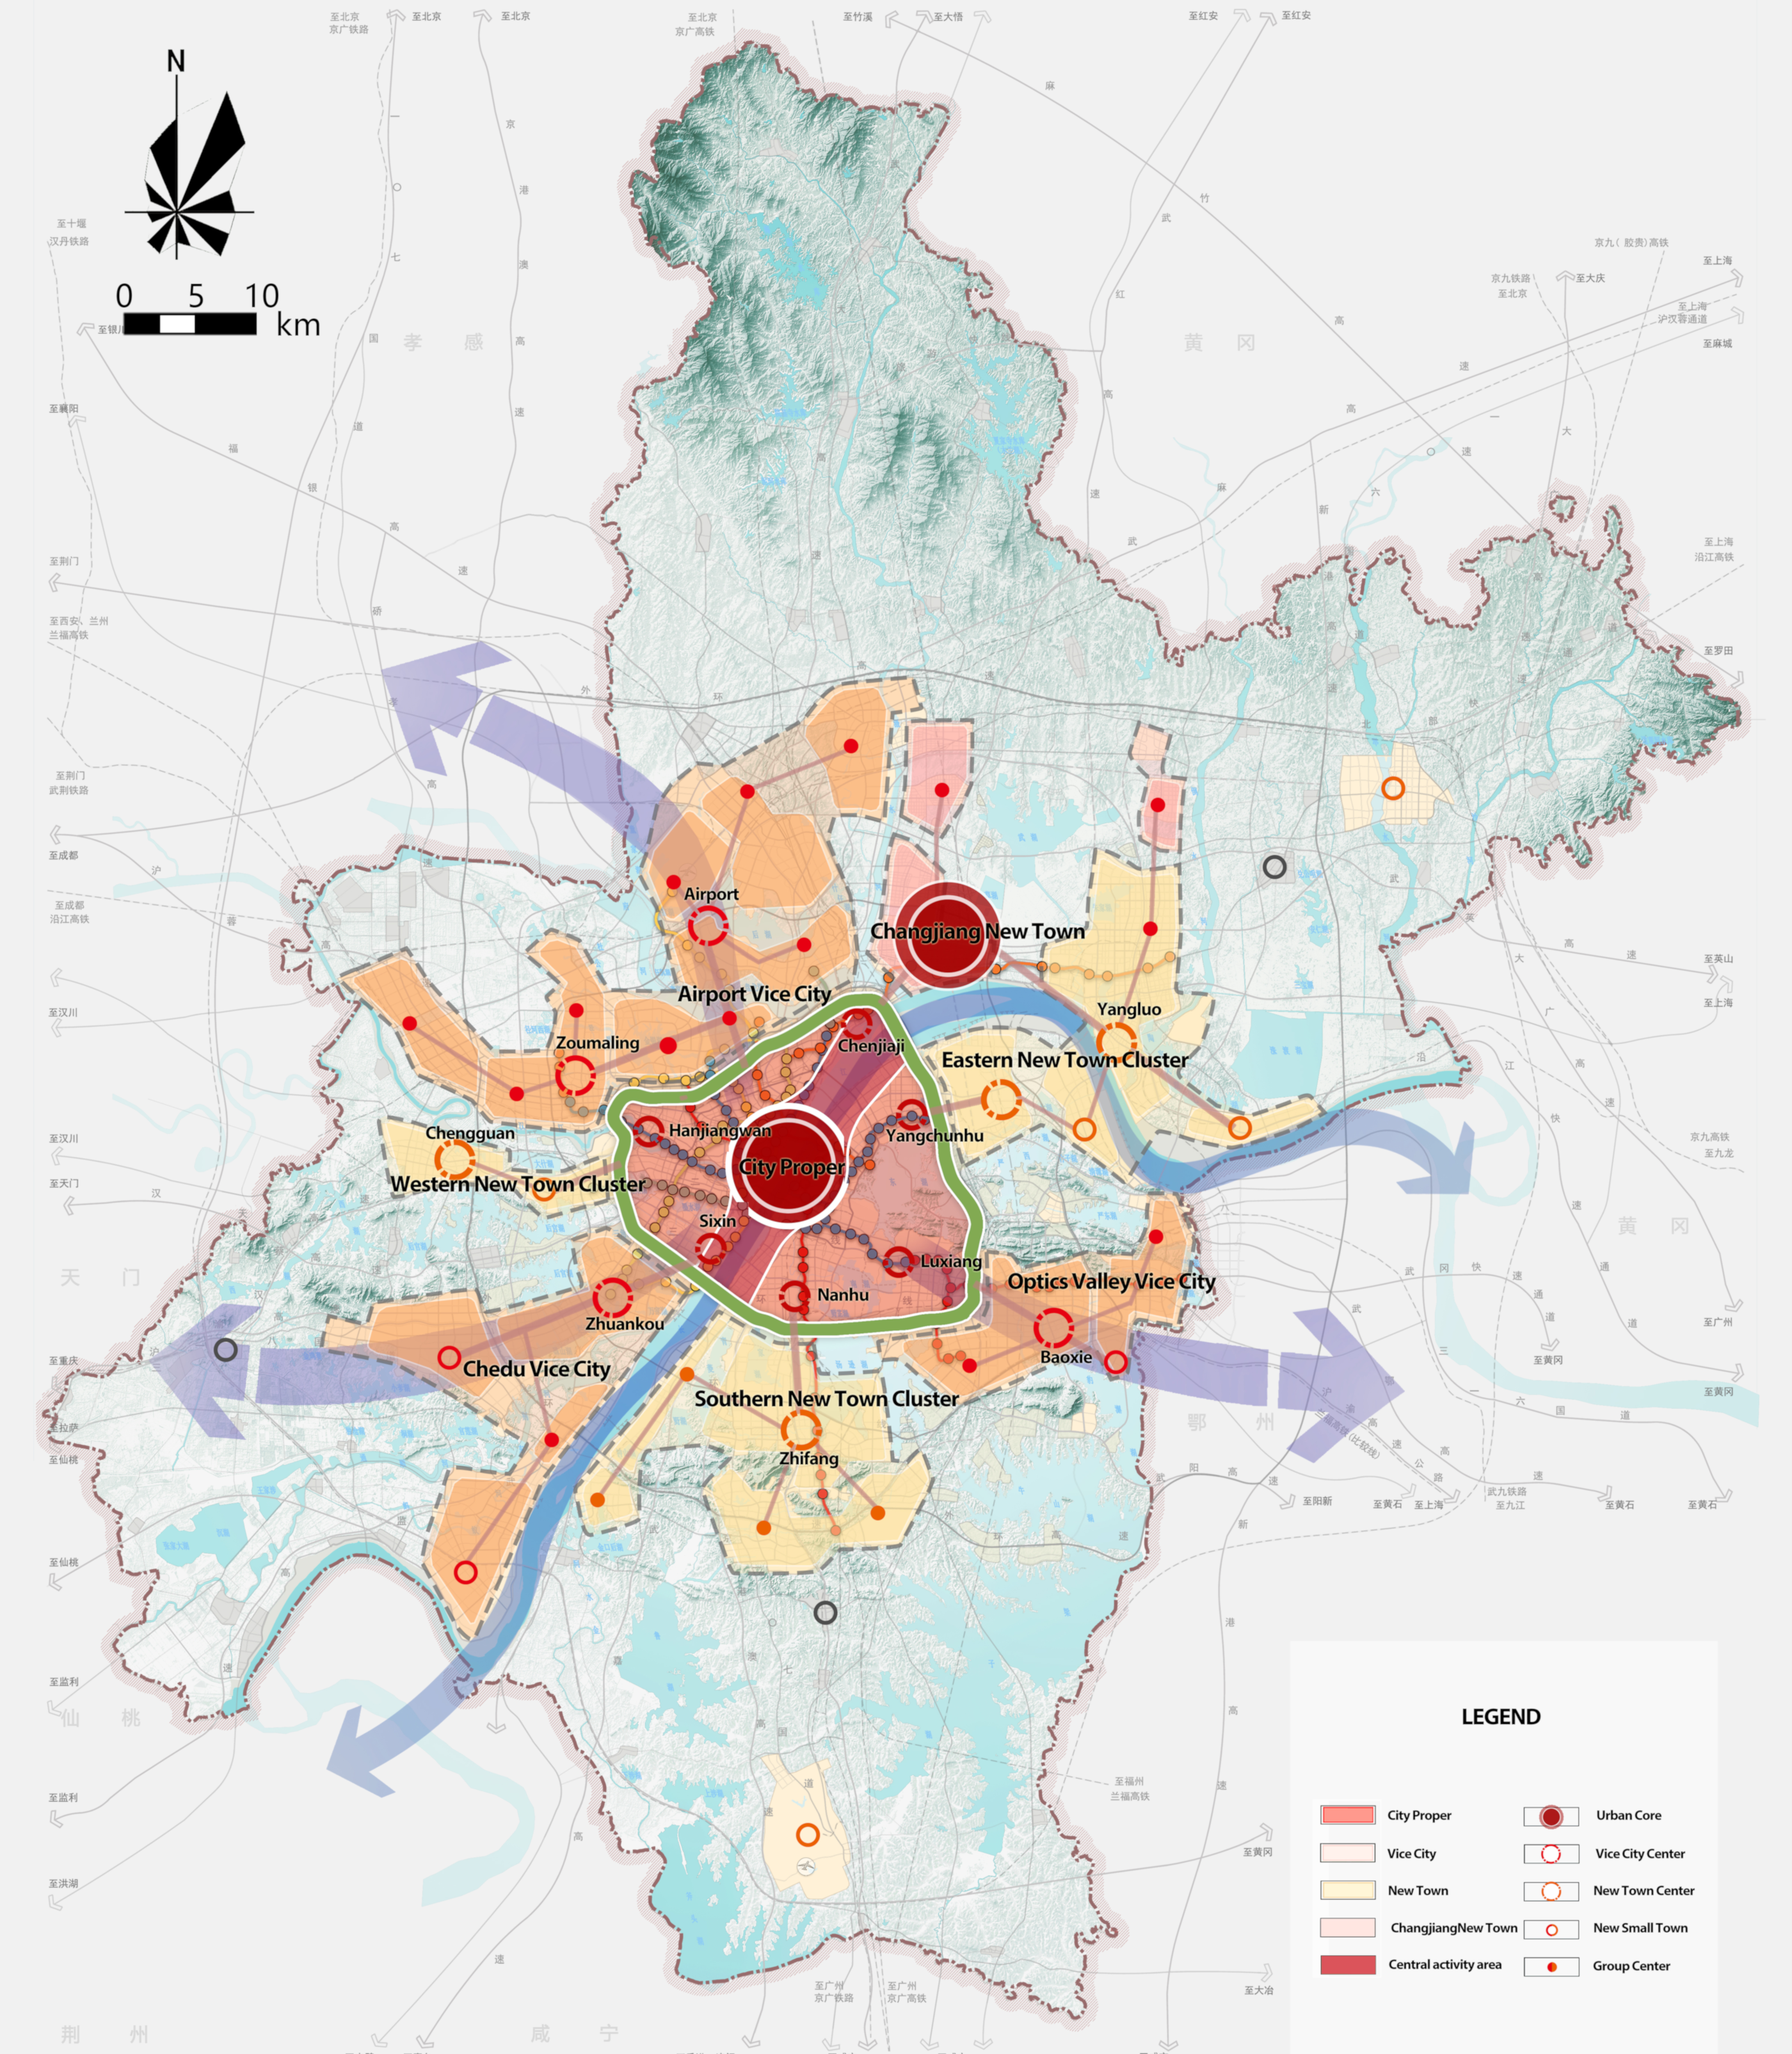
3.1. Study Area

Wuhan is the largest city in central China, and the natural landscape has formed a unique urban pattern of “two rivers intersecting and three towns standing”, which has given birth to the unique territorial space and travel characteristics of Wuhan. Currently, Wuhan is in a period of rapid construction of rail transit and dramatic changes in urban space. The construction of rail transit in Wuhan is closely related to topography and land use. In terms of topography, due to the division of rivers and lakes (166 lakes, water area accounting for 1/4), Wuhan has formed a typical two-river three-town grid, forming a special travel behavior. In the Hankou area, a network of small blocks and dense roads has been formed. The Wuchang area has formed a large-span ground transportation organization under the division of lakes; the economic development of the Hanyang area is relatively backward, so its rail transit construction is also relatively backward. In terms of urban land use, Wuhan Rail Transit Line 1 connects Hankou along the Yangtze River area. Along the line there are four major business districts, including Hankou North, Wuhan Tiandi, Wuguang and Jianghan Road, and Rongqiao Jincheng Area. Rail Transit Line 2 connects Wuhan’s main core business districts (Hankou Business District, Zhongnan Business District, Hanjie Business District, and Optics Valley Business District), and Rail Transit Line 4 connects Wuhan’s two core railway stations: Wuhan Railway Station and Wuchang Railway Station. In 2013, Wuhan’s railway passenger volume surpassed Beijing and Guangzhou, reaching 121 million passengers, becoming China’s largest railway transport transfer station. The construction of Line 1, Line 2, and Line 4 realized the rail transit connection between the three major railway stations in Wuhan and effectively eased ground rail traffic. The subsequent rail transit construction closely revolves around urban topographical elements and changes in land use.
As shown in Figure 1, since the opening of Line 1 in 2004, Wuhan rail transit has completed the construction of nine lines, experienced single-line operation, double-line operation, backbone network formation, and is now entering the accelerated network phase. By March 2014, Wuhan rail transit was operating three lines (Line 1, Line 2, and Line 4) with 59 stations, forming the backbone network of Wuhan rail transit. Since 2009, the initial formation of the rail transit network has generally reversed the downward trend of Wuhan’s urban public transportation passenger traffic. In 2016, Wuhan’s rail transit network began to be significantly upgraded and laid out around the Wuhan Rail Transit Line Network Plan. The coverage of the rail transit network started to extend and expand from the central urban area to the fringe urban area, with the Jiangxia District, Caidian District, and Huangpi District included in the coverage of the rail transit network. Meanwhile, the new lines concentrated on covering the central urban area, increasing the density of the line network, and the complexity of its network structure increased accordingly. By 2019, Wuhan rail transit had formed 9 lines and 190 stations, operating mileage reached 339 km, and annual passenger volume reached 1.223 billion, accounting for nearly 40% of travel, thus forming the backbone of rail transit passenger flow. Urban rail transit has now become one of the most major daily travel modes for Wuhan residents.

3.2. Data

The data used in this paper includes: (1) OD data of urban rail transit smart cards in Wuhan for five consecutive workdays from March 2014 to March 2019. OD data is the traffic trip data between the origin and the destination. The “O” stands for Origin, which is the origin of the trip, and the “D” stands for Destination, which is the destination of the trip. The analyzed data refer to the pre-pandemic period, and there is no exploration of the impacts of the COVID-19 pandemic on OD data and railway usage. The data structure is shown in Table 1. Each data record includes desensitization card number, check in and check out stations, check in and checkout lines, check in and check out times, entry and exit types, and transaction card type. The ticket checking system generates data based on the time and sequence of card swiping, and each passenger trip will generate two records of in-station and out-station data. (2) 2014–2019 Wuhan rail transit station data, including station name, latitude and longitude coordinates, and network data.
(i)
Selection of Resident Travel Characteristics Variables:
Referring to previous research [36,37,38,39], this paper uses average travel volume, average number of travelers, average travel frequency, average travel distance, and peak hour and peak flow to express the travel characteristics of rail transit residents. Among these, the average travel flow is expressed by the cumulative value of daily average in and out of the station swiping card, the average number of travelers is expressed by average number of card entry and exit per day, the average travel frequency is expressed as the ratio of the average travel volume to the average number of travelers, the average travel distance is expressed as the average of the daily average distances between the in- and the out-station, and peak hour and peak flow are calculated by sorting traffic data. The above variables examine the impact of accessibility on residents’ travel behavior from the two levels of stations and residents. The average travel volume and the peak flow can reflect the average passenger flow intensity of rail transit stations, while the average travel frequency and the average travel distance can reflect the characteristics of residents in the area surrounding the station who choose rail transit to travel.
(ii)
Measurement of the Shortest Path Distance between Stations:
In this study, based on the vector data of the Wuhan rail transit line network, after data pre-processing, ArcGIS network analysis is used to generate a topological structure network, the shortest spatial distance matrix (m) of stations in the topological network is measured by the shortest path function of spatial analysis, and the inter-station distance is derived by matching with station OD.

3.3. Methods

3.3.1. Rail Transit Network Topology

Graph theory is the basic method of transportation research. This paper evaluates the traffic topology network by constructing parameters based on graphs. The topological structure of the rail transit network can be measured from the degree of network connection and the potential for network expansion. In the topology construction based on Space-L, the connection rate (β) and loop index (μ) can reflect the degree of network connection, and the actual loop rate (α) and actual combination degree (γ) can reflect network expansion potential [40].
The connection rate (β) is the ratio of the number of links between adjacent nodes (e) in the network to the number of nodes (n), reflecting the average degree of connection of the network. When β < 1, the rail transit network presents a tree-like network structure; When β > 1, the rail transit network presents a loop-like network structure. The calculation formula is:
β = e n , 0 β n 1 2
The loop index (μ) is the number of links between adjacent nodes (e) minus the number of nodes (n) plus the number of network subgraphs. The calculation formula is:
μ = e n + p , 0 μ n 1 n 2 2
The actual loop rate (α) is the ratio of the loop index (μ) to the maximum possible number of loops in the network. The larger the value, the higher the looping level. The calculation formula is:
α = e n + p 2 n 5 p , 0   α 1
The actual integration degree (γ) is the ratio of 2 times the number of adjacent node links (e) and the number of node pairs, reflecting the actual polymerization level of network connections. The larger the value, the higher the degree of polymerization. The calculation formula is:
γ = e 3 n 2 , 0   γ 1
The larger the above-mentioned network topology index value, the better the network topology structure.
According to complex network theory, statistical indicators of network topology include node degree, average path length, network efficiency, clustering coefficient, and average node betweenness [41].
The node degree is usually the total number of all connected edges of the node. The distribution characteristics of the node degree are obtained by the ratio of the degree of any node to the total number of connected edges of the network. The larger the node degree of a station, the more important the station is in the network; while the distribution characteristics of the degree of all stations reflect whether the rail network has complex network characteristics, if the degree distribution is in the form of a power law, it is a scale-free network. The calculation formula is:
K i = j n e i j
The average path length describes the average value of the shortest distance between any two nodes, i and j, in the network and reflects the degree of dispersion of the nodes. The calculation formula is:
L = i j n d i j n n + 1
The clustering coefficient reflects the average coupling degree of nodes in the network. Node i is connected to n other nodes through n edges. If n nodes are also connected to each other, the number of connected edges of all nodes is n (n − 1)/2. If the actual number of connected edges of nodes is e, the ratio to n (n − 1)/2 is the clustering coefficient of node i. The calculation formula is:
C i = 2 e n n 1
Node betweenness is the ratio of the number of paths passing through the node to the total number of shortest paths among all shortest paths in the network. Value range is 0–1, the larger the value, the more passenger will choose the route through the station, which will cause a large cross-section passenger flow at the station and cause network congestion. The calculation formula is:
B i = k j n D k j i D k j
Node: D k j ( i ) is the number of shortest paths through node i; D k j is the total number of shortest paths of all node pairs in the network.

3.3.2. The Rail Accessibility Metric Model Based on Weighted Travel Time

Traffic accessibility research determines the accessibility of the entire network by calculating the accessibility of the nodes in the network. Most scholars use time distance indicators to characterize accessibility, because distance indicators ignore the impact of speed differences [42]. The perceived travel time during a public transport journey directly affects passengers’ satisfaction and therefore is an essential consideration when planning and operating the public transport system [43]. The shortest average time distance evaluation of rail transit network accessibility only considers the impact of time and does not involve the influence of the weight of the stations. The accessibility between stations is also closely related to the population and regional economy [44]. Therefore, in this paper, the weighted average travel time method is used to study and analyze the accessibility of the network, and the potential accessibility model is used to more accurately reflect the true situation of the network. The formula for calculating the weighted average travel time based on passenger flow is:
A i = j = 1 n T i , j × M j / j = 1 n M j
where Ai is the accessibility index of station i, reflecting the closeness of the connection between station i and other stations. In order to calculate accurately, the unit is set in minutes in this paper. The smaller the value, the more convenient it is to reach the station. Ti,j is the shortest distance between station i and station j, which consists of the running time of the rail transit line and the transfer time between rail transit station. The running time of the rail transit line is set according to the running timetable of the Wuhan rail transit line. The transfer time is set to 3 min based on the researcher’s survey and interviews with rail transit passengers and field visit experience; n is the number of all stations in the network. Mj is the weight of the station, expressed in this paper by the average passenger flow of the station. The formula for weight of the station is:
M j = G j l = 1 l G l / n
where Gj is the average daily passenger flow of rail transit station i; the ratio of this value to the average daily average passenger flow of the entire network is the weight of station i, and n is the total number of rail transit network stations.
In order to clearly reflect the spatial evolution pattern of the accessibility of the metro network, the accessibility center of gravity is defined by drawing on the concept of population center of gravity in order to use the accessibility center of gravity index to provide a concise, general, and accurate spatial distribution of Wuhan’s rail transit accessibility, and to analyze the general trend or central location of rail transit accessibility changes. The formula for accessibility center of gravity is:
X = A i X i A i , Y = A i Y i A i
where X, Y is the geographic coordinates of the regional accessibility center of gravity, Xi, Yi is the geographic coordinates of the station i, and Ai is the accessibility index of station i.

4. Results

4.1. The Evaluation of Wuhan Rail Transit Network Topology Structure

4.1.1. The Evolution of Global Topological Characteristics of the Wuhan Rail Transit Network

From Table 2, the spatiotemporal characteristics of the global topological structure of Wuhan rail transit network are:
(1)
The Wuhan rail transit network has completed a tree-like to loop-like evolution. Before March 2015, the Wuhan rail transit network showed an obvious tree-like network with a connection rate of less than 1 and a loop index of 0. The network has not yet formed a loop and has poor accessibility. With the opening and operation of rail transit Line 3, the network space has gradually evolved into a loop-like network. By March 2016, the connection rate of the Wuhan rail transit network reached 1.010, more than 1, and the loop index reached 2, indicating that with the expansion of the network, the topology structure had gradually improved, and the extent of the network extension had also been greatly improved, initially forming a loop-like network. Subsequently, the connection rate increased year by year, from 0.983 to 1.084. By March 2019, the actual looping rate of the rail transit network had been increase from 0.011 to 0.045. The increase in its value indicates that the more developed the network, the stronger the robustness.
(2)
The travel efficiency of the Wuhan rail transit network is gradually improving. From 2014 to 2019, the actual integration degree of the Wuhan rail transit network increased from 0.339 to 0.365, indicating that as the rail transit network expanded, the overall travel efficiency continued to improve. The actual degree of integration over the years has been at a low level, indicating that the actual level of direct access between different line stations in the network development process is not high.
Table 2. Evolution of global topological index of rail transit network.
Yearn1e 2p3β 4μ 5α 6γ 7
2014595810.98300.0000.339
2015757410.98700.0000.338
2016969711.01020.0110.344
201712313011.05780.0330.358
201814915911.067110.0380.361
201919020611.084170.0450.365
1 The number of nodes. 2 The number of links. 3 The number of network subgraphs. 4 The connection rate. 5 The loop index. 6 The actual loop rate. 7 The actual integration degree.

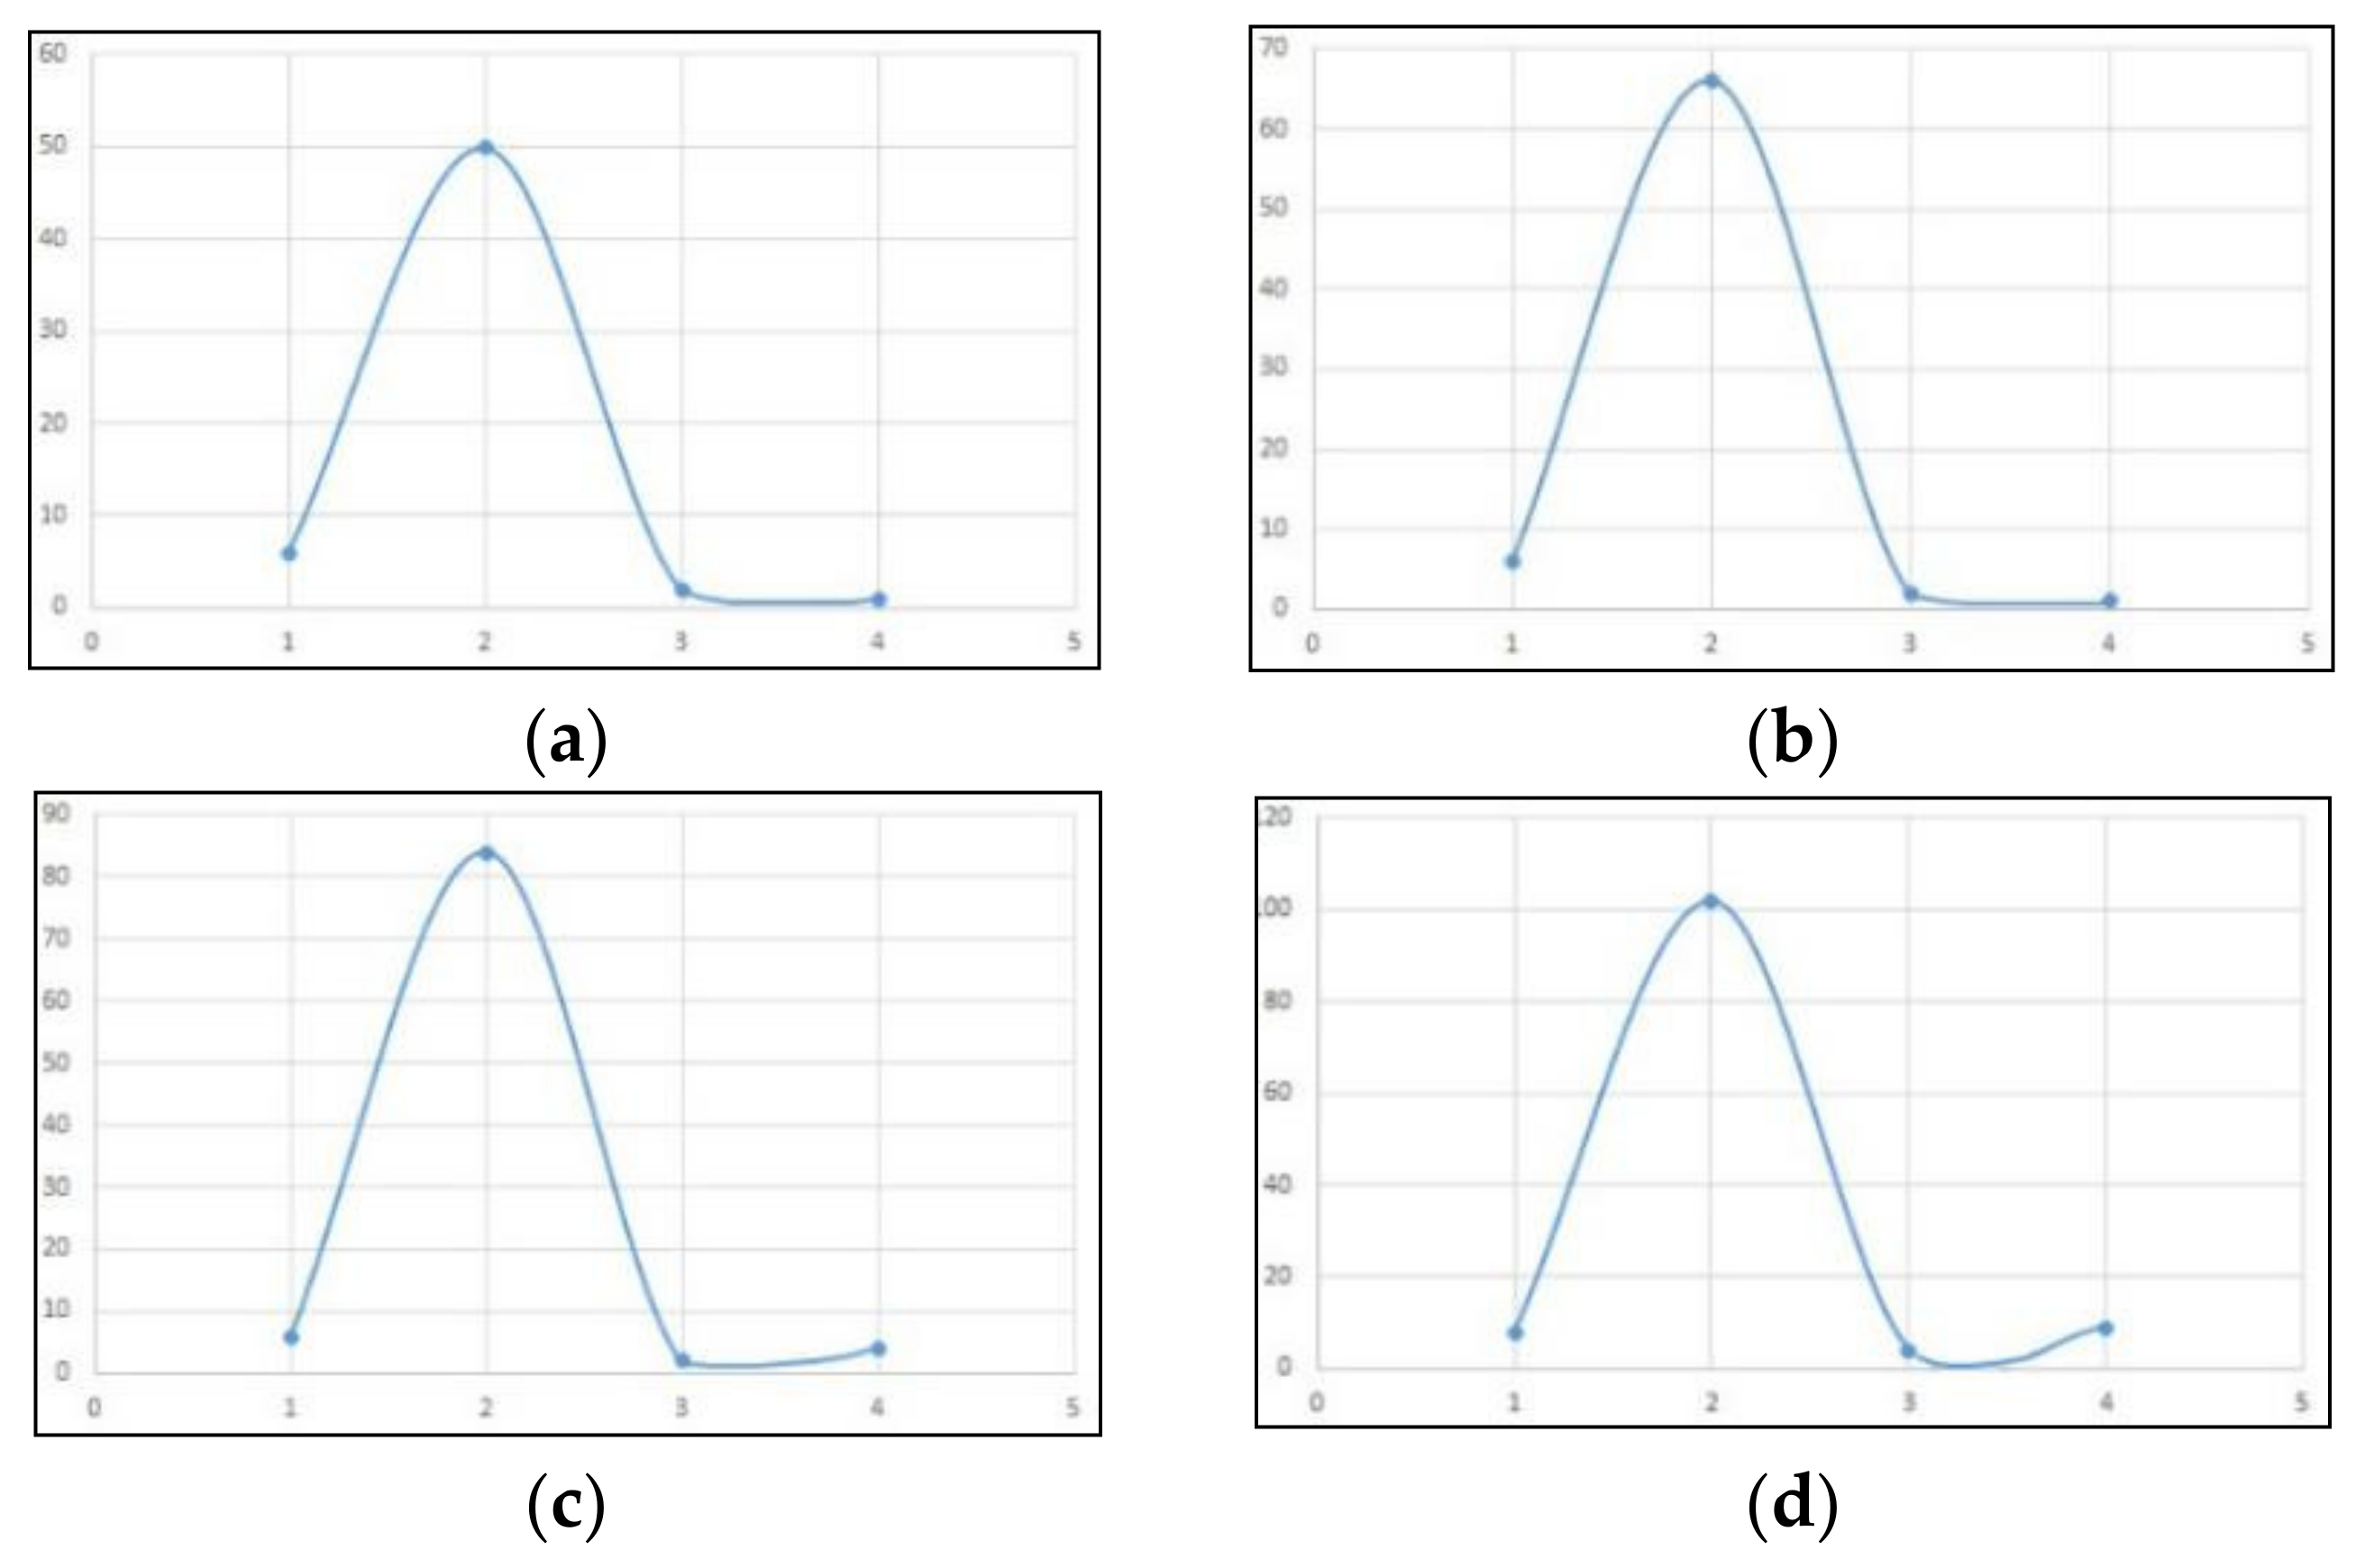
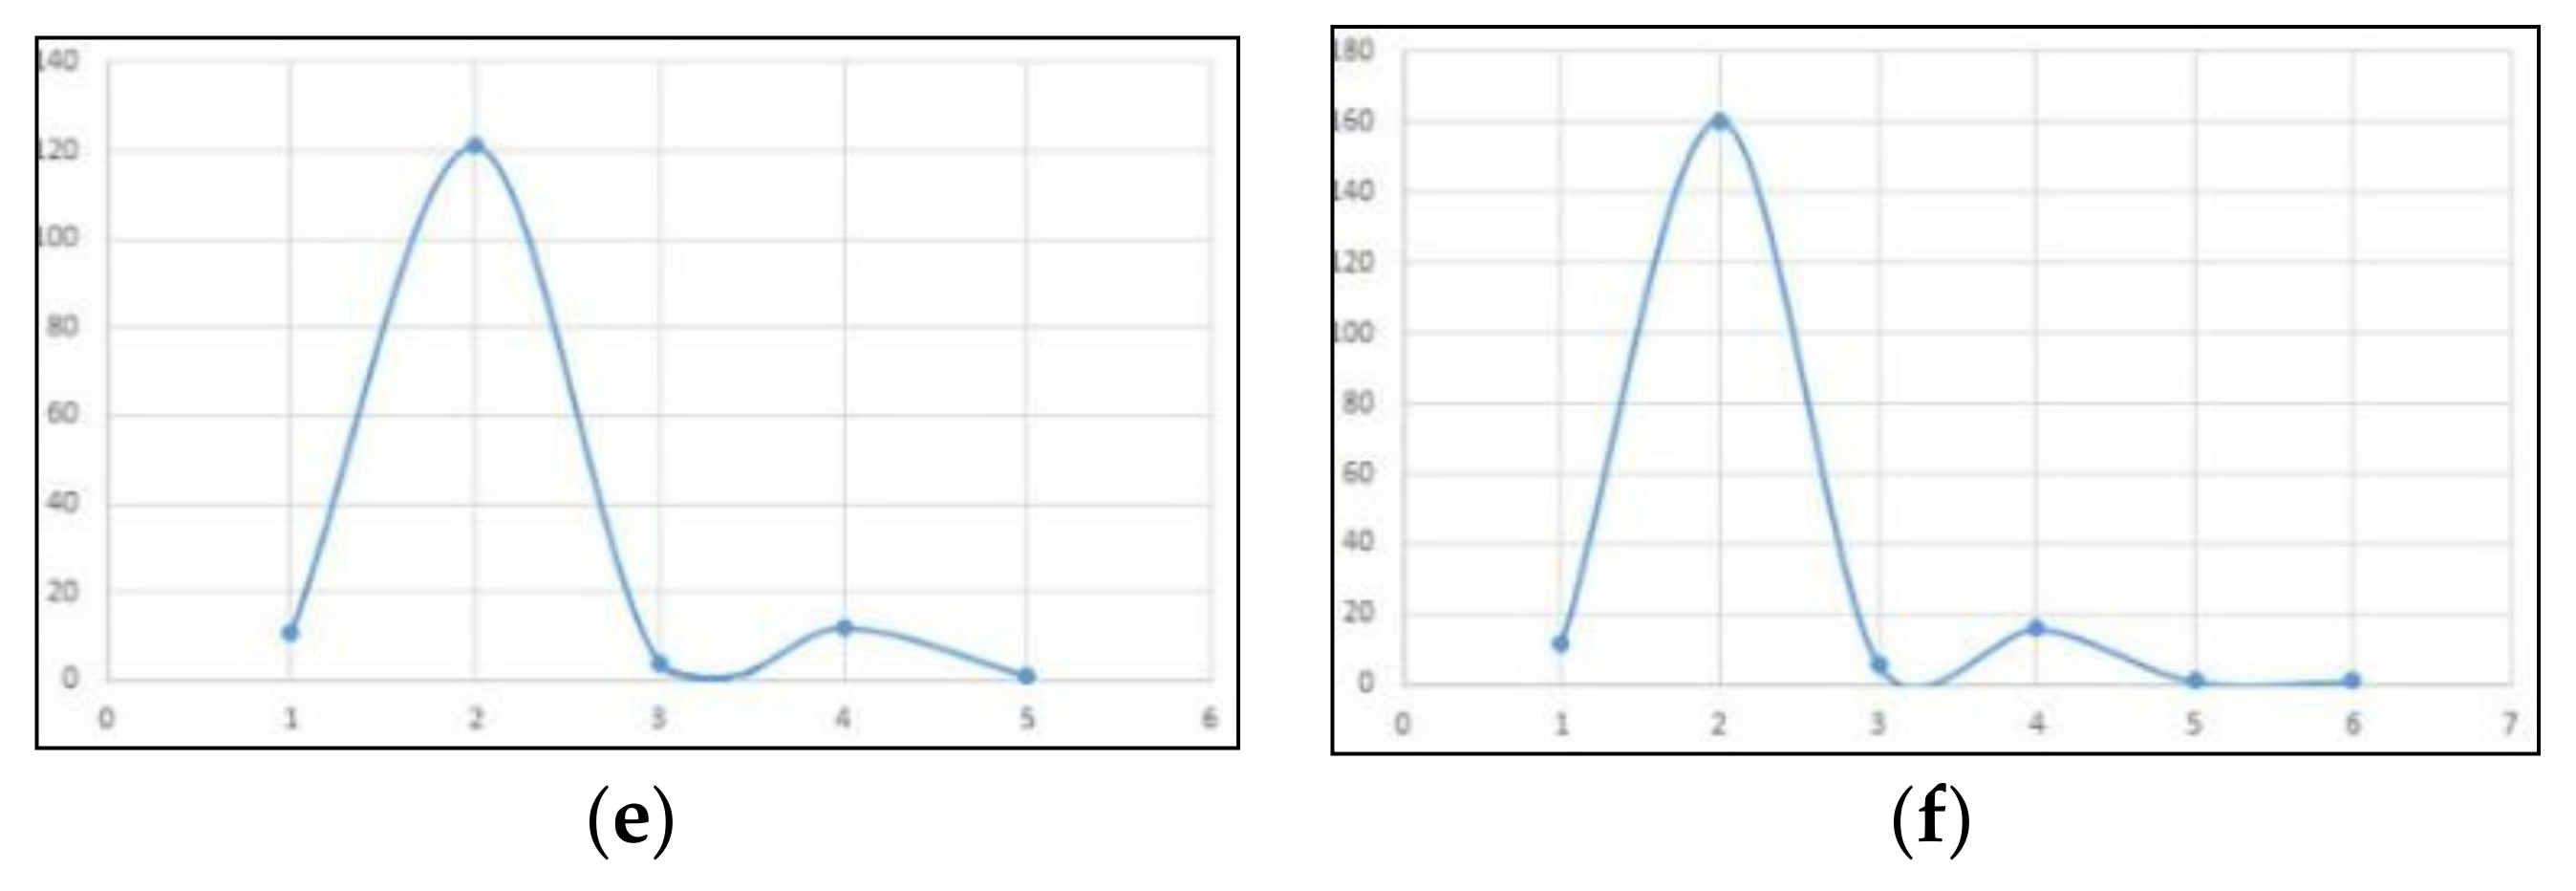
4.1.2. Analysis of the Statistical Characteristics and Spatiotemporal Evolution of the Wuhan Rail Transit Network

From Figure 2, the node degree distribution of the Wuhan rail transit network is a Poisson distribution. According to the complex network theory, the degree distribution of the characteristics of the small-world network and the scale-free network are similar to the Poisson distribution, indicating that the Wuhan rail transit network has the characteristics of a random network. Stations with a large number of nodes are transfer stations, and they are clustered in the city center with the densest network lines, indicating that the development of the Wuhan rail transit network is uneven, the transfer station concentration is relatively high, and the network’s anti-attack ability is relatively weak.
From Table 3: Since 2014, the average node degree of the Wuhan rail transit network has increased year by year. Adjacent stations were basically maintained at about two stations, indicating that network connectivity was not strong, and that growth was still not mature enough. From 2014 to 2016, the average clustering coefficient of the Wuhan rail transit network was 0, reflecting that the density of network stations needed to be strengthened. By 2017, the average clustering coefficient reached 0.004, and then decreased with the increase of the line and stations, indicating that the disadvantages caused by the extension of the Wuhan rail transit have not been completely eliminated. From 2014 to 2019, the average node betweenness of the Wuhan rail transit network continued to increase. With the increase of transfer stations, the network’s ability to evacuate passenger flow strengthened. From 2014 to 2015, the average path length of the line network increased with the extension of the rail transit network. Since the opening of Line 3 in 2016, the average path length gradually decreased, and the rail transit network began to develop inward. From 2018 to 2019, continued external extension brought a rapid increase in the average path length due to the opening of Line Yangluo, Line 7, and Line 11.

4.2. The Accessibility Measurement and Spatiotemporal Evolution of the Wuhan Rail Transit Network

From Table 4: The minimum value of the Wuhan rail transit’s weighted travel time accessibility index has increased year by year. From March 2014 to March 2019, the minimum accessibility index increased from 16.37 to 22.74, the maximum accessibility index increased from 49.41 to 88.78, and the mean value of the network accessibility index increased from 29.91 to 43.59. From Figure 3, it can be seen that the newly added line significantly changed network accessibility from March 2014 to March 2015, and from March 2018 to March 2019. As the rail transit network expanded, the overall accessibility index of the network increased, and the network access time become longer. (Note: The units of the weighted time accessibility index are measured in minutes in this paper.)
Based on the weighted travel time accessibility index of each station, this paper uses the “Inverse Distance Weighted (IDW)” interpolation method in ArcGIS to generate the trend surface of the Wuhan rail transit accessibility index. Considering the spatial service significance of rail transit stations, the trend surface is limited to less than 2 km, and the evolution characteristics are revealed through contour maps.
From Figure 4, the spatial distribution characteristics of accessibility of Wuhan rail transit network are:
(1)
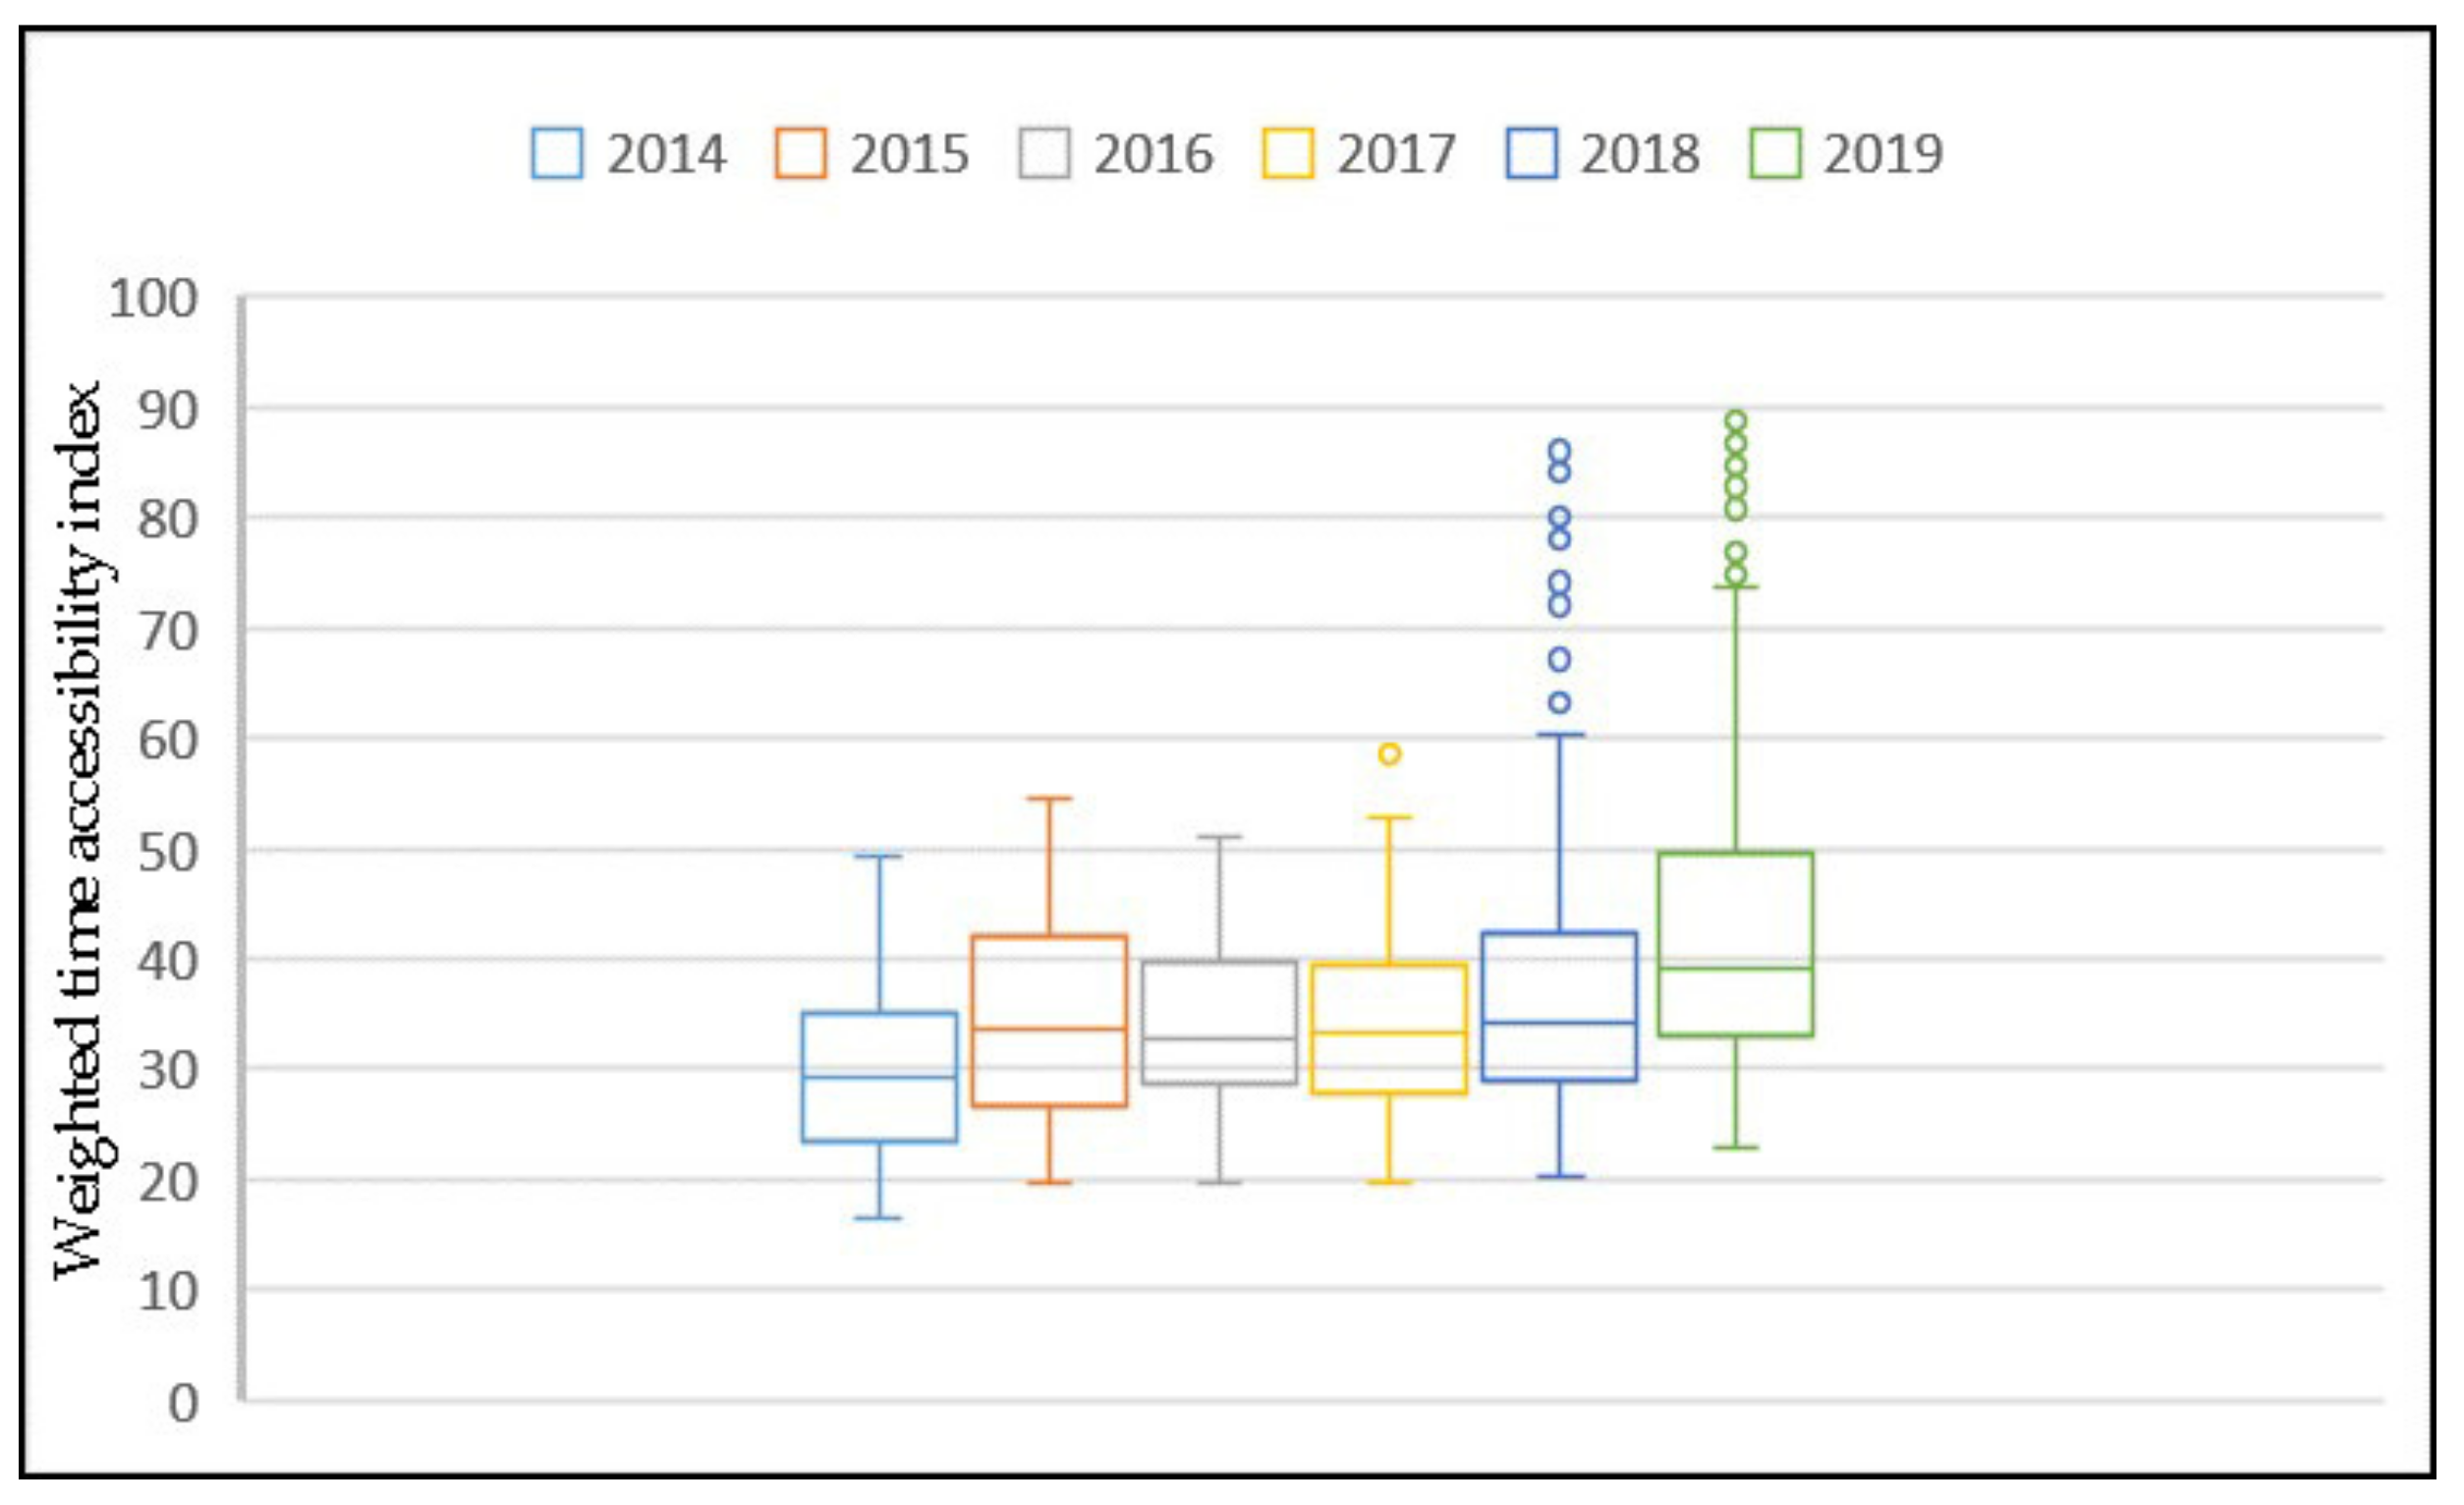
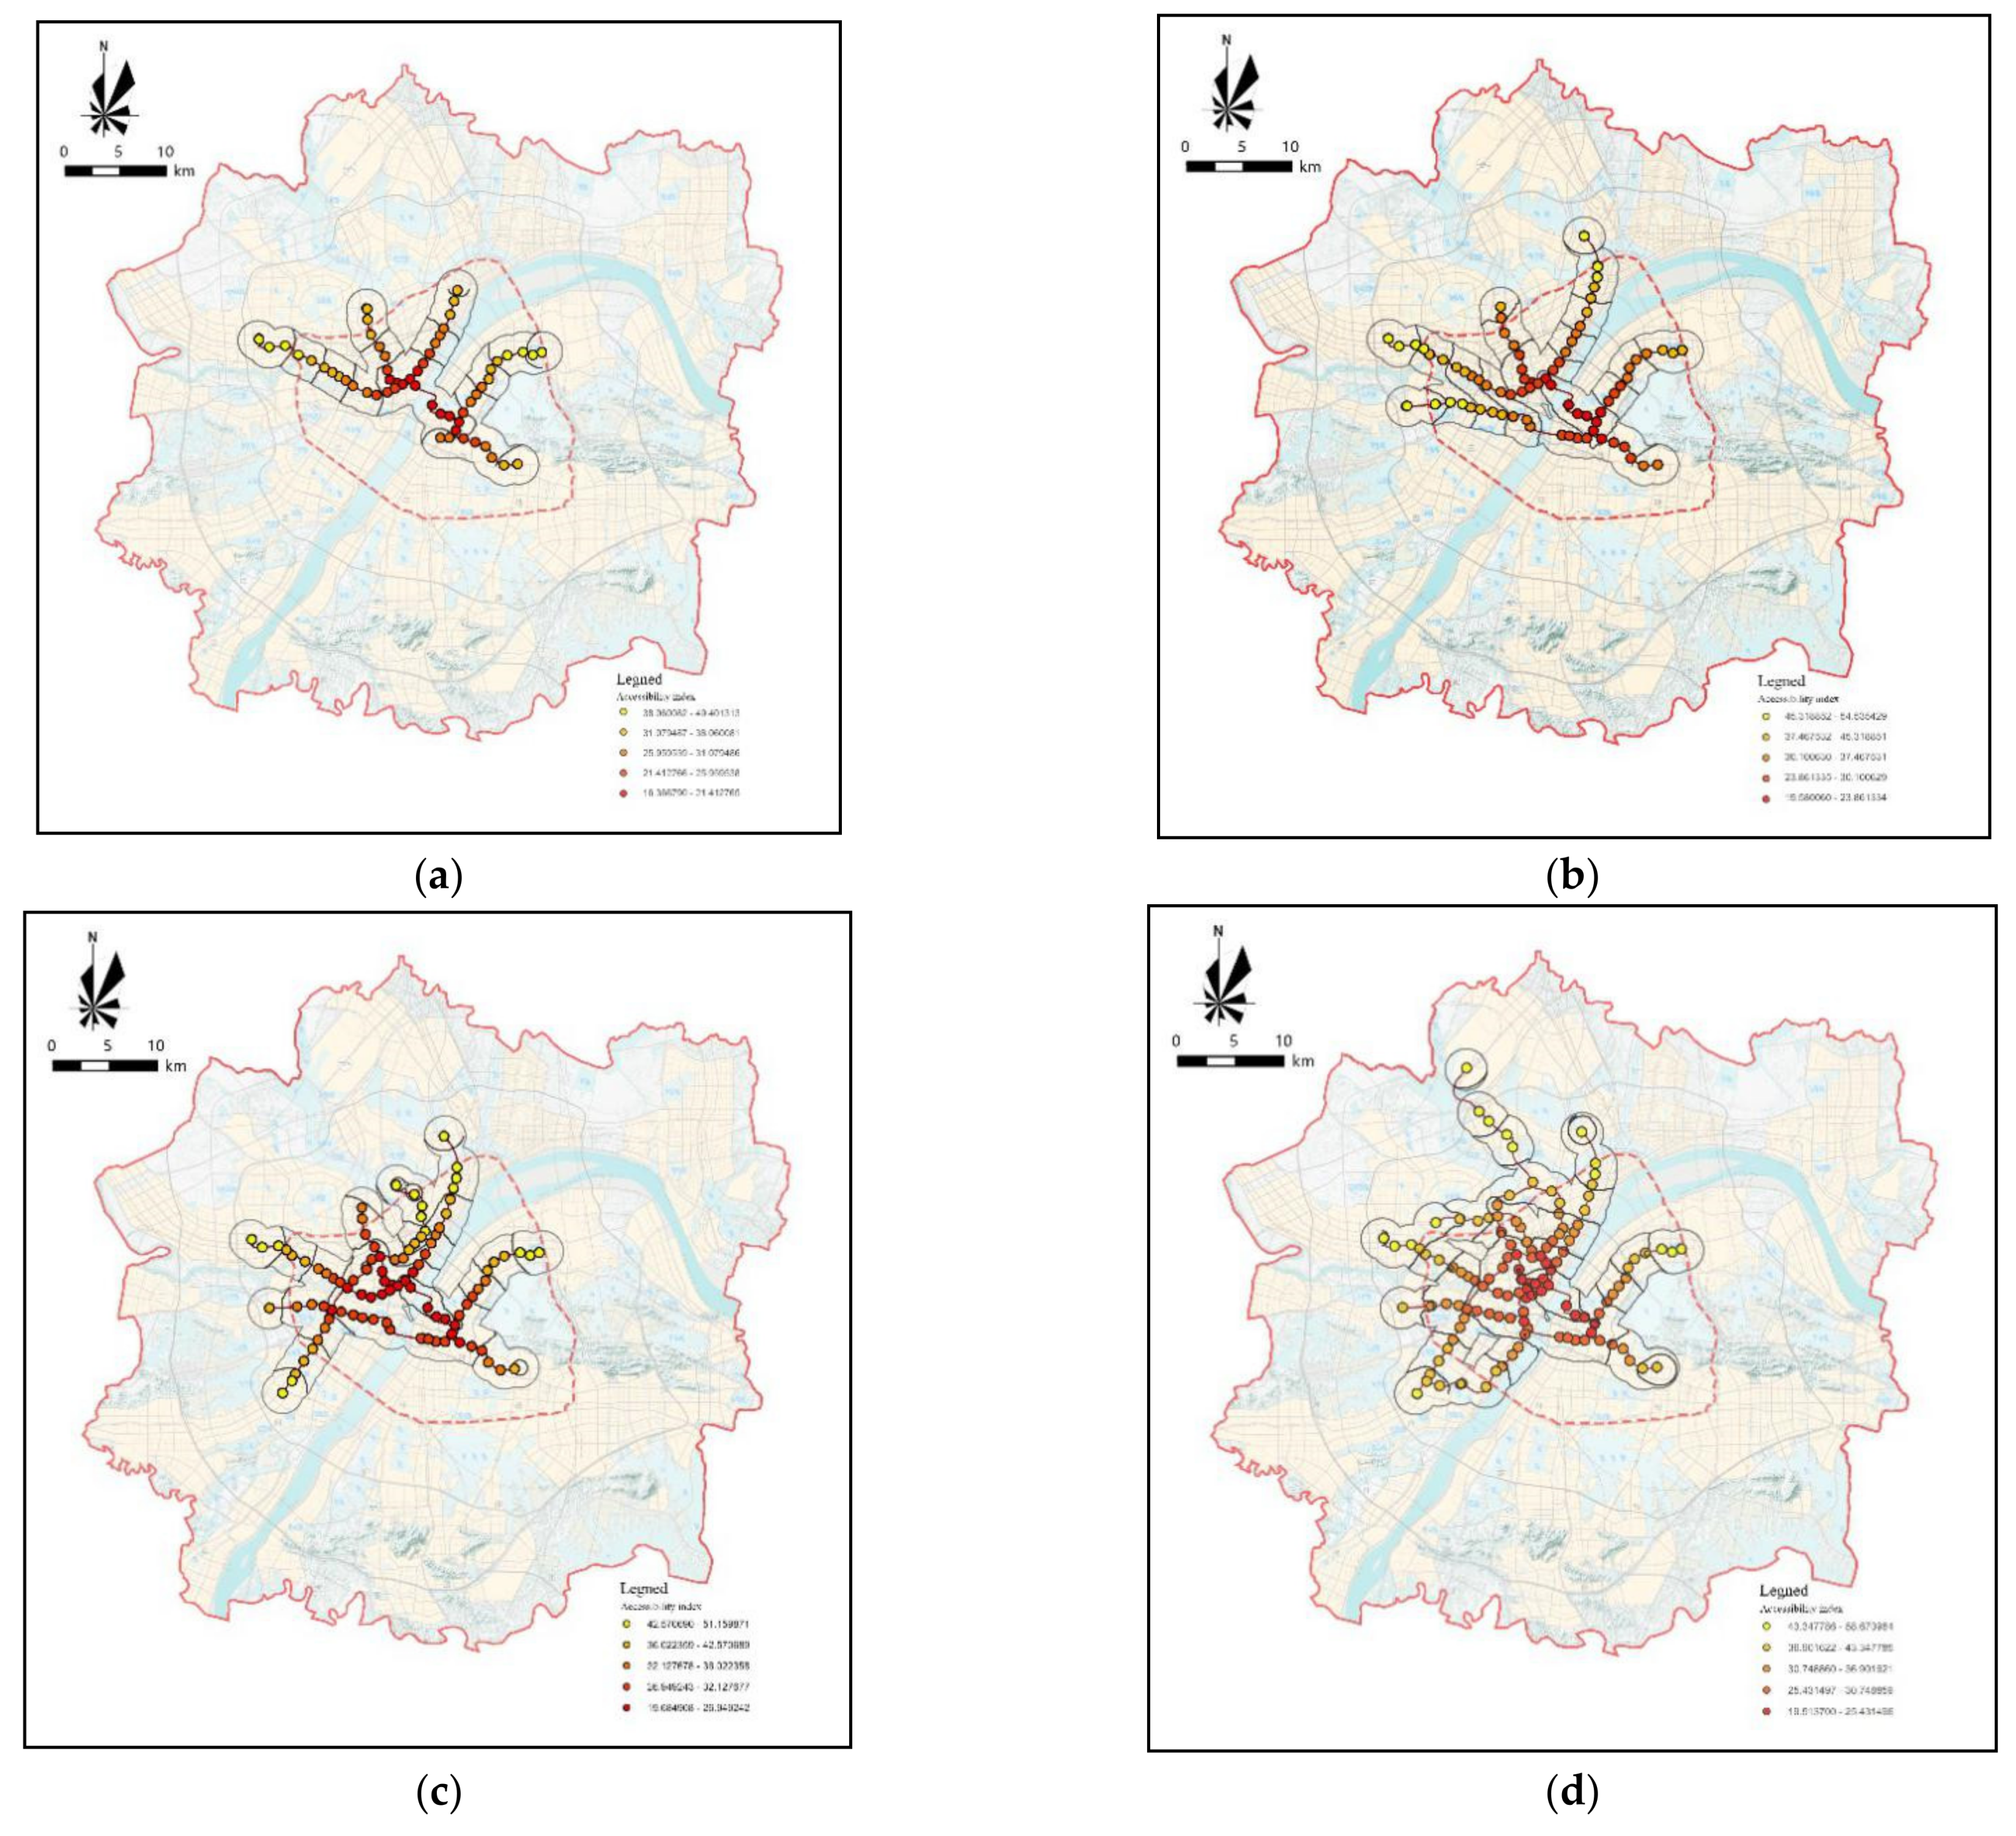
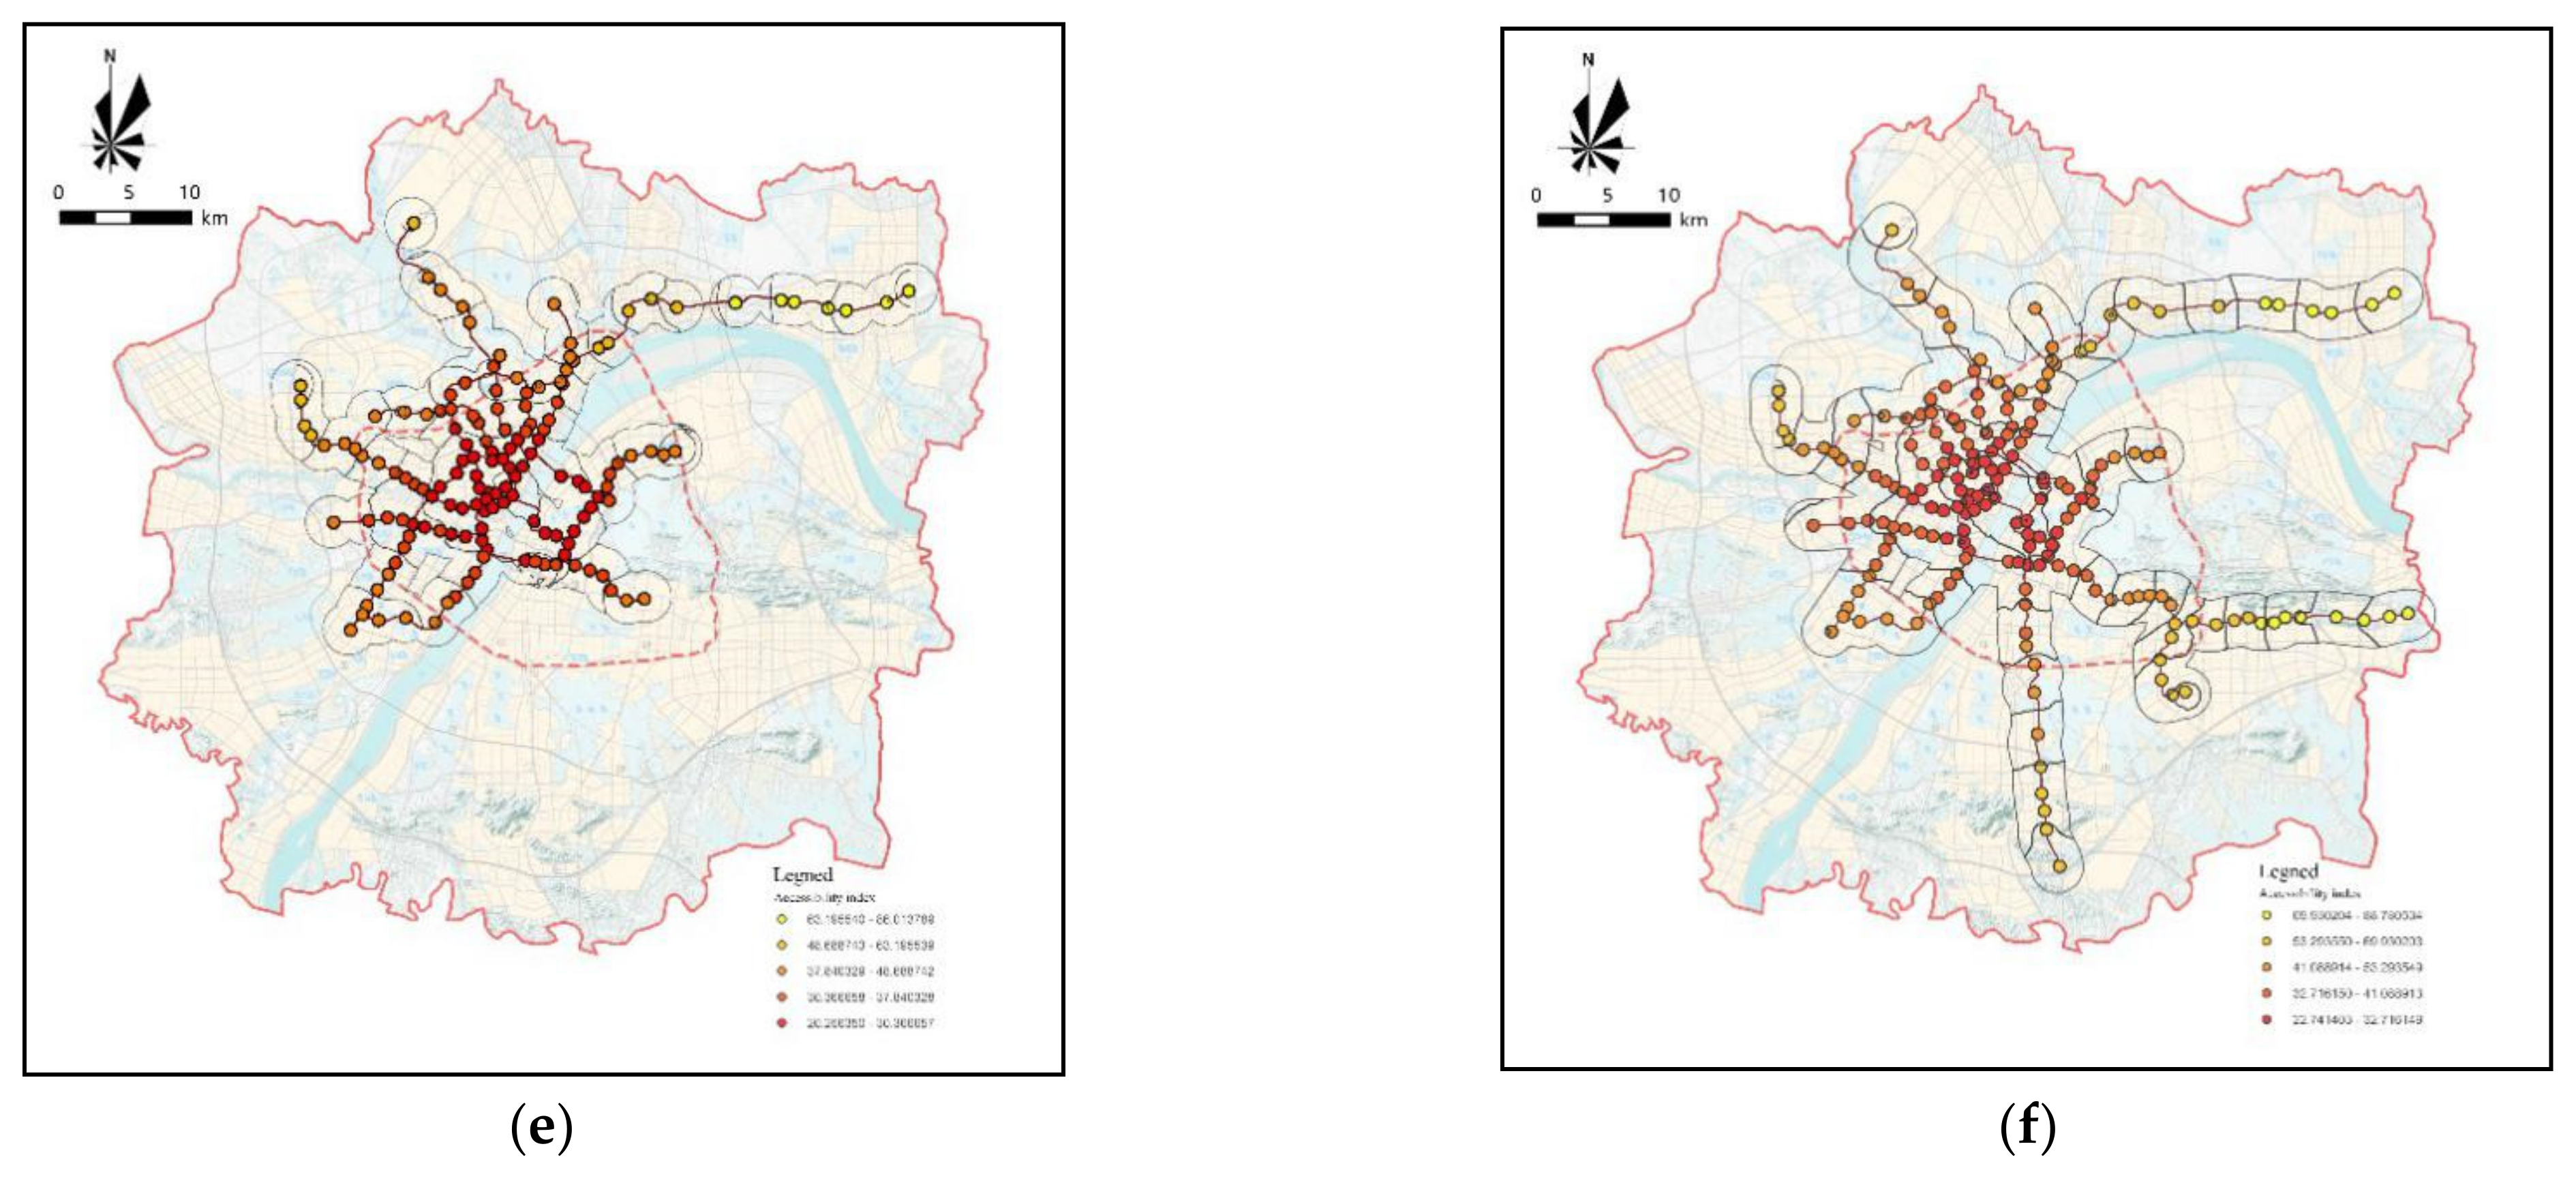
Accessibility distribution has a positive marginal effect and shows a weaker spatial distribution trend from the central city to the fringe city. Stations with a smaller weighted travel time accessibility index are concentrated in the central city, and the coverage of the central area of the weighted travel time accessibility index is gradually expanding. The accessibility index of central city stations gradually decreases as the network expands, indicating that, as the rail transit network expands, the connectivity of central city stations increases.
(2)
The expansion of the Wuhan rail transit network has less impact on stations with a smaller weighted travel time accessibility index. In March 2014, the station with the highest accessibility was Xunlimen, which became Jianghan Road after March 2016. The stations with the highest accessibility index were constantly changing with the opening of the fringe city line. From March 2014, they were Dongwu Boulevard station on Line 1, Huangjinkou station on Line 4, Hankou North station on Line 1, Tianhe International Airport station on Line 2, and Jintai station on Line Yangluo. After the opening of Line 7, Line Yangluo, Line 11, and the south extension of Line 2, which were all located in fringe urban area, the overall time accessibility of the line network was reduced.
(3)
The spatial distribution of time accessibility forms a circular structure, which radiates to the surroundings, with Xunlimen station and Jianghan Road station as the center, and gradually weakens with the increase of distance. The accessibility development of rail transit coverage areas is uneven. Prior to March 2016, the central urban area weighted travel time accessibility index contours were sparsely distributed, and the accessibility changes were not obvious, while the decline in the accessibility of stations in the fringe urban areas gradually increased, reflecting the influence of the cross spatial distribution structure of the rail transit network on accessibility. After March 2016, with the expansion of the transit network and the optimization of the loops, the change of the weighted travel time accessibility index of the stations in the fringe urban area shows the characteristics of decreasing the accessibility as the distance increases.
(4)
The transfer station has a significant effect on time accessibility enhancement. The time accessibility index of the transfer station is relatively small, and the contour line close to the transfer station has a prominent trend, indicating that the transfer station has a strong radiation capacity of accessibility. Increasing the intersection of lines and networks and the setting of loop lines are important measures to improve the time accessibility of the Wuhan rail transit network.
Figure 4. Evolution of spatial distribution form of the weighted time accessibility index of the Wuhan rail transit network. (a) 2014; (b) 2015; (c) 2016; (d) 2017; (e) 2018; (f) 2019.
Ijgi 10 00789 g004aIjgi 10 00789 g004b

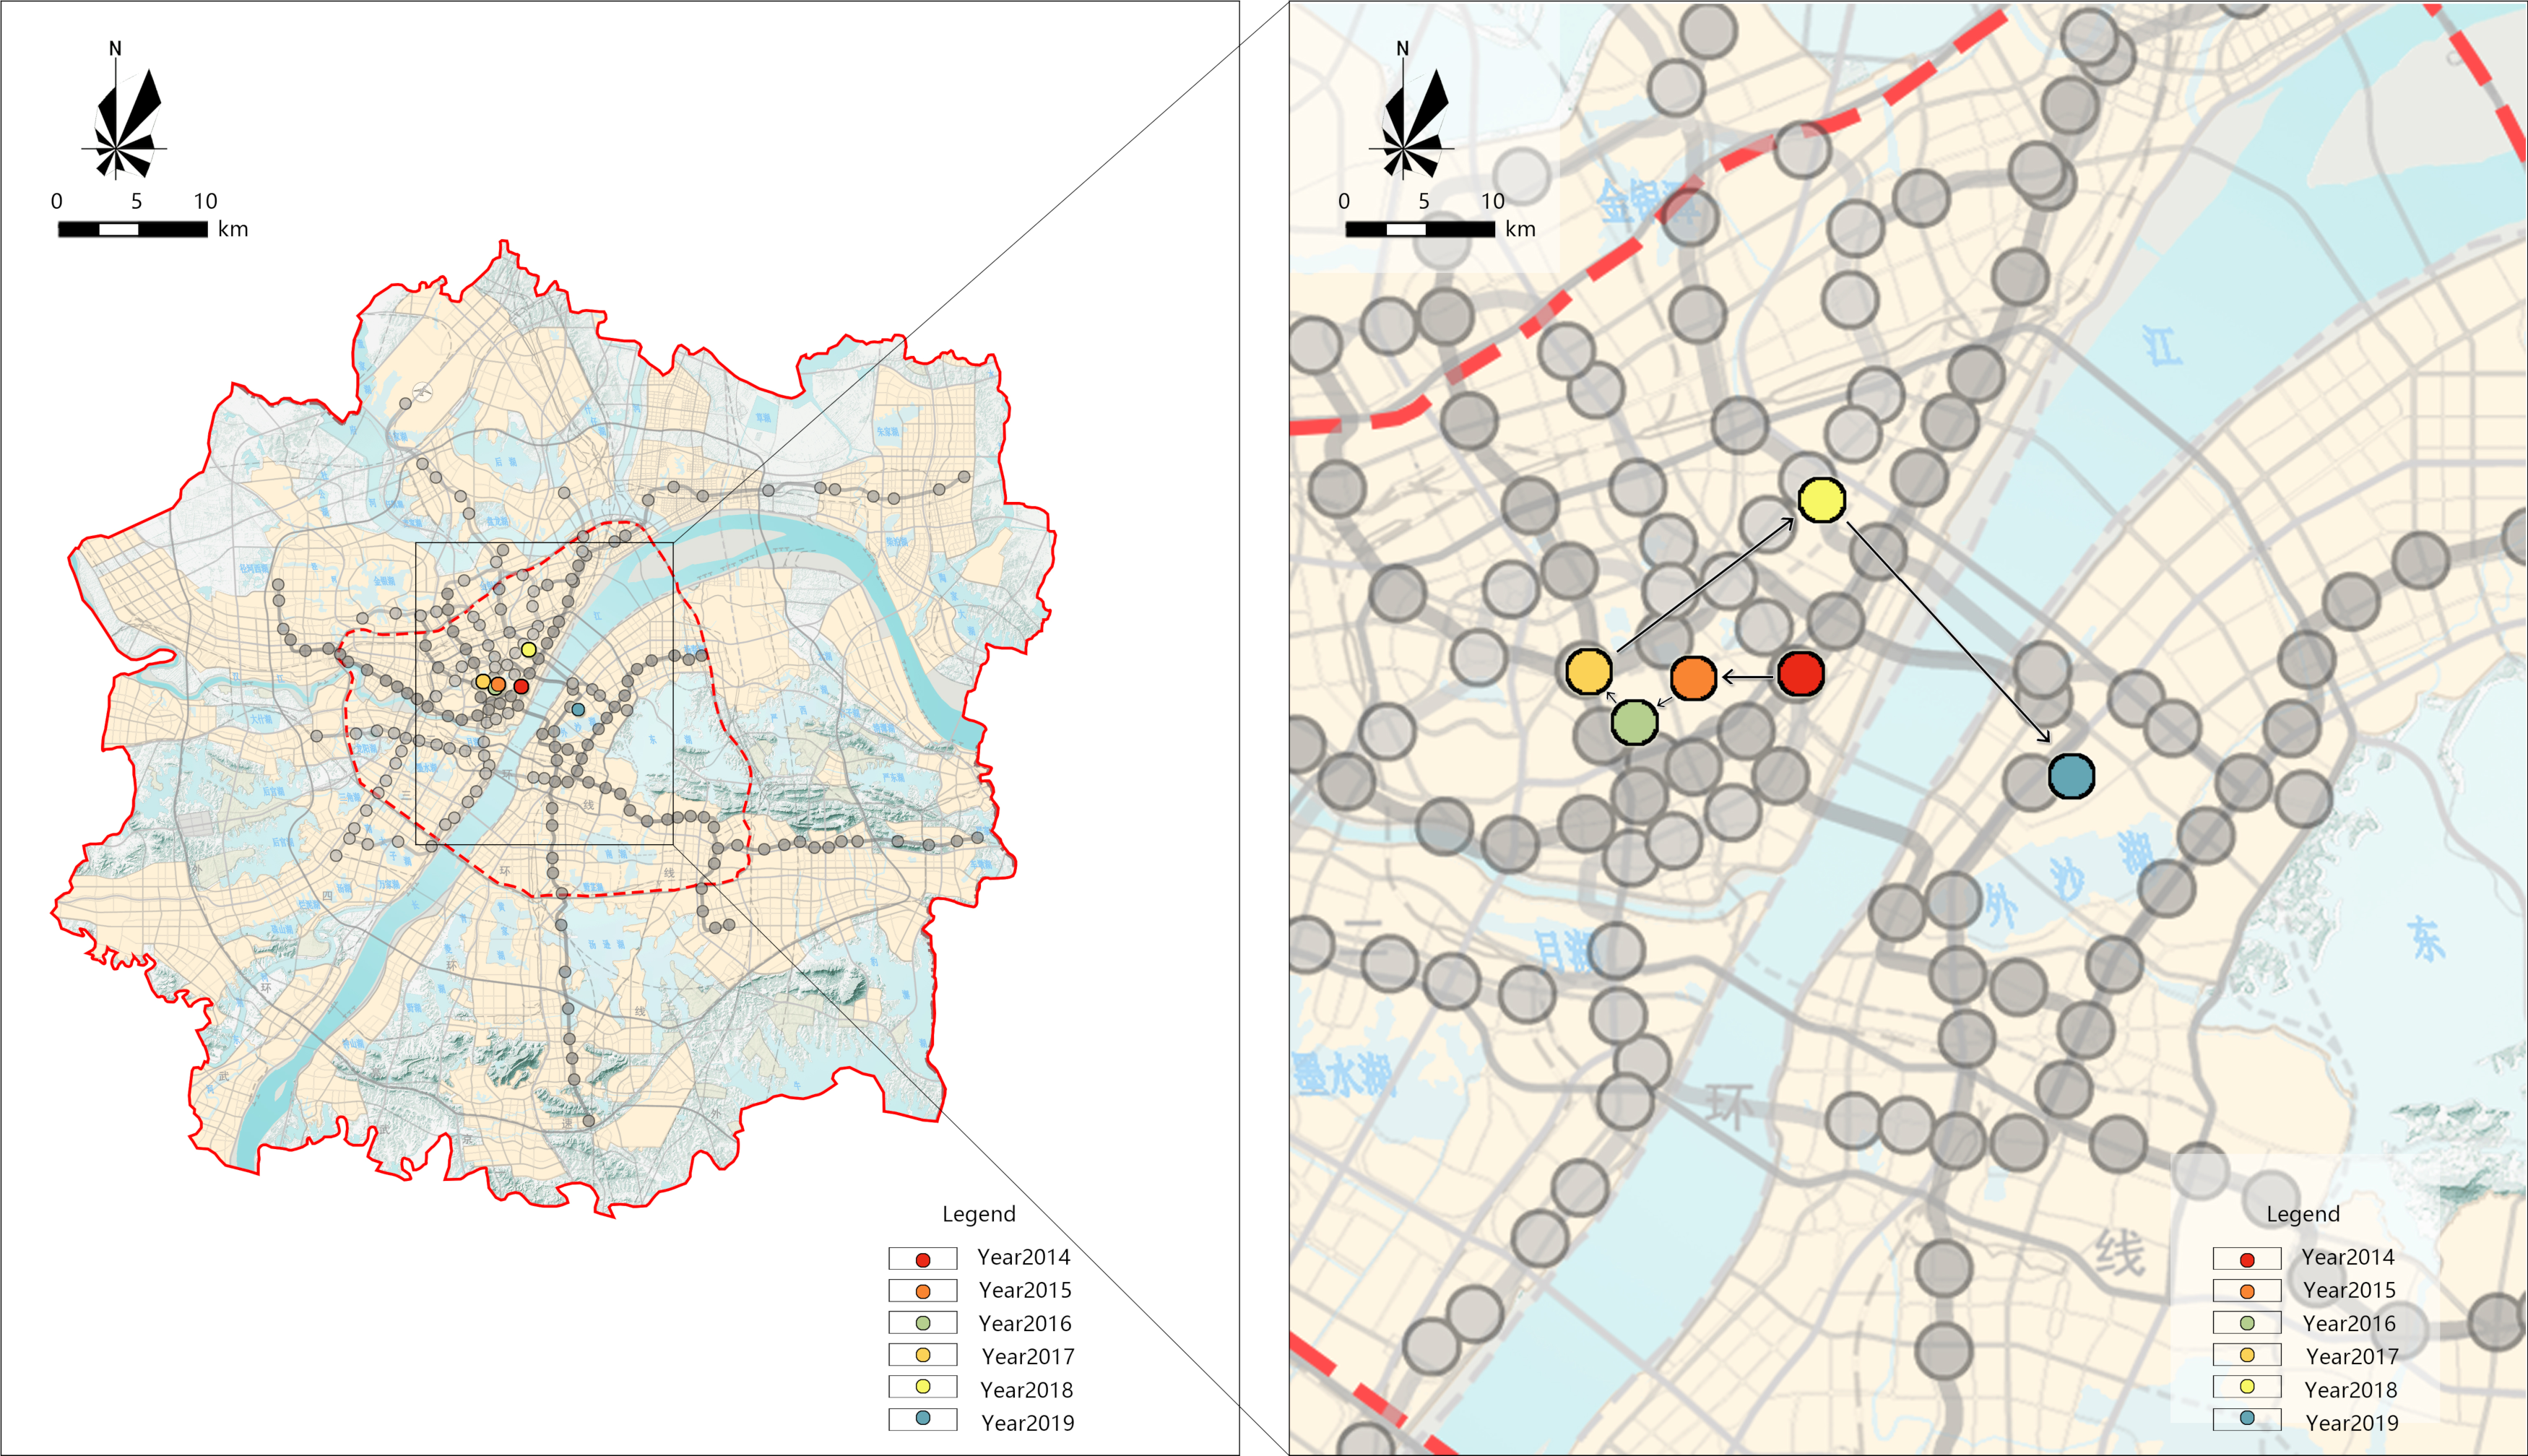
4.3. The Migration of the Accessibility Gravity of Wuhan Rail Transit Network

From Figure 5: The accessibility center of the Wuhan rail transit network shows a trend of moving to the northwest in the early period and to the southeast in the later period. Corresponding to the spatial expansion direction of Wuhan, with the changes in the spatial pattern, the accessibility center of the Wuhan rail transit network has shown the characteristics of moving to the southeast. In 2014, the center of accessibility of the Wuhan rail transit was located in Jiang’an District (near Xunlimen station). With the opening of Line 3 and the extension of lLne 4, the center of gravity gradually moved westward and northward. By 2016, the center of accessibility moved to the vicinity of Wangjiadun, and the overall movement range of the space was relatively small. By 2017, Wuhan started the planning and construction of Changjiang New Town, and the accessibility of the rail transit network has obviously crossed the center of gravity space. The opening of Line Yangluo has moved the accessibility center of gravity to the vicinity of Sanyang road to the west. By 2019, with the opening of Line 7, Line 11, and the south extension of Line 2, relying on the construction of the Optics Valley Science and Technology Innovation Corridor, the eastward expansion of Optics Valley accelerated, and the center of accessibility has further moved to the southeast to Xujiapeng.

4.4. The Spatiotemporal Evolution Law of the Expansion of the Rail Transit Network on Resident Travel Characteristics

From Table 5, Table 6, Table 7, Table 8, Table 9 and Table 10: The correlation between the weighted time accessibility index and residential travel characteristics was analyzed based on SPSS. Correlation analysis results show that there is a correlation between average travel flow, average number of travelers, average travel frequency, average travel distance, peak flow, and accessibility index of rail transit stations. Among them, average travel distance has the strongest correlation with the accessibility index.
The weighted time accessibility index of rail transit stations over the years has had a significant impact on the average travel volume, the average travel frequency, the average travel distance, and the peak flow. Within the study area, the higher the station weighted travel time accessibility index, the lower the network accessibility, and the smaller the average travel volume. On the whole, the average accessibility of the central urban stations is higher, and the travel volume is relatively large. The higher the station weighted travel time accessibility index, the lower the network accessibility, and the higher the average travel frequency. The average travel frequency of central urban stations is lower than that of fringe urban stations. This may be due to the rapid expansion of urban space due to the construction of the rail transit, but the urban central area still occupies a dominant position in employment. The higher the station weighted travel time accessibility index, the lower the network accessibility, and the greater the average travel distance. Residents in central urban areas travel for short distances, while residents in fringe urban areas travel for long distances. The higher the station weighted travel time accessibility index, the lower the network accessibility, and the smaller the peak flow. Central urban stations with higher accessibility have higher peak flow.

5. Discussion

This paper evaluates the development of rail transit in Wuhan by constructing a rail transit topology network to measure accessibility, focusing on the relationship between accessibility and travel characteristics. To meet the needs of the longitudinal design, this study uses rail transit credit card data during one week in March for the calendar years 2014–2019 to describe the travel characteristics.

5.1. Discussion on the Layout and Timing of Rail Transit Construction in Wuhan

The Wuhan rail transit network shows complex network characteristics. The evolution of network organization patterns triggers changes in accessibility, which impacts on traffic operation efficiency. The significant increase in rail transit efficiency in 2016 illustrates the importance of network ring formation. This area tends to have higher traffic and peak travel behavior due to its composite functional attributes. High outbound traffic and higher trip count instead bring lower trip frequency. Due to out-migration, residents in peripheral urban areas are more likely to use rail transit for commuting, and their characteristics are relatively stable and exhibit fixed travel frequency and long-distance travel. As shown in Figure 6 from the empirical evidence of Wuhan, the emerging employment centers in Wuhan are concentrated in sub-centers, such as Changjiang New Town and Optics Valley Vice City. Line 21 and Line 11 connect these employment centers with the central city through a single line. These lines bear the major commuter traffic. For the Chedu Vice City, there are currently no rail lines covering it. There is a clear spatial mismatch between employment and residential centers, requiring rail transit to play a more important role. At the global level, the core of rail transit construction is to improve transportation efficiency, serve the key areas, and solve the problem of job-housing balance, based on the background of a small amount of investment. Therefore, in the recent construction planning of Wuhan rail transit, it is prudent to expand the network coverage and adapt to the future development requirements of the city. The recent construction focuses on the rail transit coverage of Chedu Vice City. Line 3 and Line 6 will be used to link the job-housing space in this area. At the same time, the loop tandem of Airport Vice City, Changjiang New Town, and Optics Valley Vice City should be increased to closely connect the central city with major employment centers and improve the efficiency of rail transit operation at the global level.

5.2. Discussion on Public Transportation Management Based on Travel Behavior Orientation

The development context of Chinese cities is different from that of Western cities. The built-up areas of cities with high floor area ratios and high density are more dependent on public transportation. In terms of the impact of urban spatial structure on residents’ transportation behavior, suburbanization generally increases the travel time and distance of residents and thus increases the use of small cars. Reducing car dependence and traffic congestion, and the resulting negative effects such as air pollution and energy consumption, are important dimensions of current transportation development. By improving the accessibility and service quality of rail transit, residents are guided to shift from cars to rail transit and build a sustainable green transportation model. The higher the accessibility, the higher the average travel flow, the lower the average travel frequency, the smaller the average travel distance and the higher the peak flow. This conclusion is consistent with the development trend of rail transportation in Wuhan. Attention to the fringe urban areas is the focus of public transportation development. Public transportation policies should be conducive to long-distance and high-volume commuting between the vice city and the city proper.
The limitations of this study include the following: (1) Due to the lack of socio-economic attributes of rail transit swipe data, the discussion of the spatiotemporal evolution of rail transit network accessibility and its impact on residents’ travel in this paper is limited to passenger flow characteristics and does not incorporate the analysis of residents’ travel demands. (2) No built environment elements are involved, and this study lacks the analysis of the impact of the built environment on residents’ travel behavior.

6. Conclusions

This paper investigates the spatial and temporal distribution pattern of accessibility of the Wuhan rail transit network and its influence on the travel characteristics of residents, explains the spatial pattern evolution of accessibility of the rail transit network and its spatial and temporal effects on travel characteristics, provides theoretical support for the decision of optimal development of rail transit network, and draws the following main conclusions:
(1)
The Wuhan rail transit network presents the characteristics of a scale-free complex network, and the transformation from a tree-like network to a loop-like network has been completed. The opening of Line 3 had a significant effect on network formation. With the increase of rail transit lines and the expansion of service scope, the overall travel efficiency of the network has been continuously improved, and the robustness has been enhanced.
(2)
The accessibility pattern of the rail transit network shows a trend of changing from corridor to network. The change of time accessibility is shown as a circlular structure, showing a decreasing spatial distribution trend away from the city center. The opening of Line Yangluo, Line 7, Line 11 and the south extension of Line 2 greatly increased the overall travel time of the network and reduced network accessibility. At the same time, over the years, the trend of rail transit accessibility shifting to the northwest and then to the south is basically coupled with the spatial development direction of Wuhan’s construction of Changjiang New Town and Optics Valley East.
(3)
The accessibility changes caused by the expansion of the rail transit network have had a significant impact on residents’ travel characteristics. With the improvement of network accessibility, average travel flow increased, average travel frequency decreased, average travel distance increased, and peak flow increased. This may be due to the rapid expansion of urban space due to the construction of the rail transit, and residents in fringe urban areas will commute frequently during workdays, while in central urban areas with a high degree of functional compounding, high travel flow and number of journeys reduced the travel frequency. We are committed to developing good public service facilities in suburbs with good traffic accessibility. To a certain extent, this can support and promote the development of related industries, promote the formation and expansion of regional centers, and improve the job–housing balance of the entire city. This will improve the operating efficiency of the rail transit network by reducing long-distance commuting behavior.
Future research can further simulate the construction of Wuhan rail transit based on the current network accessibility measurement and propose specific construction timing optimization suggestions. Meanwhile, this will be combined with the urban built-up environment, the spatial distribution of urban population, and economic activities to deeply study the travel characteristics of residents on different lines, analyze the internal differences of the urban rail transit system, and provide accurate directions for rail transit demand management in Wuhan.

Author Contributions

Conceptualization, Jiandong Peng, Changwei Cui, and Hong Yang; methodology, Jiandong Peng, Hong Yang, and Changwei Cui; formal analysis, Changwei Cui; validation, Changwei Cui; investigation, Qi Dai and Hong Yang; writing—original draft preparation, Changwei Cui and Jiajie Qi; writing—review and editing, Changwei Cui, Hong Yang, and Zehan Ruan; All authors have read and agreed to the published version of the manuscript.

Funding

This research received no external funding.

Conflicts of Interest

The authors declare no conflict of interest.

References

  1. Saidi, S.; Wirasinghe, S.; Kattan, C.L. Long-term planning for ring-radial urban rail transit networks. Transp. Res. Part B Methodol. 2016, 86, 128–146. [Google Scholar] [CrossRef]
  2. Gao, T.Z.; Chen, K.M.; Li, F.L. Topology analysis of urban rail transit network. J. Chang. Univ. Nat. Sci. Ed. 2018, 38, 97–106. [Google Scholar]
  3. Sienkiewicz, J.; Hołyst, J.A. Statistical analysis of 22 public transport networks in Poland. Phys. Rev. E Stat. Nonlinear Soft Matter Phys. 2005, 72, 046127. [Google Scholar] [CrossRef] [PubMed] [Green Version]
  4. Wang, L.R.; Hopcroft, J. Community Structure in Large Complex Networks. Lect. Notes Comput. Sci. 2010, 6108, 455–466. [Google Scholar]
  5. Wandelt, S.; Sun, X.Q. Evolution of the international air transportation country network from 2002 to 2013. Transp. Res. Part E Logist. Transp. Rev. 2015, 82, 55–78. [Google Scholar] [CrossRef]
  6. Ding, R.; Ujang, N.; Bin Hamid, H.; Wu, J.J. Complex Network Theory Applied to the Growth of Kuala Lumpur’s Public Urban Rail Transit Network. PLoS ONE 2015, 10, e0139961. [Google Scholar] [CrossRef]
  7. Ewing, R.; Cervero, R. Travel and the Built Environment. J. Am. Plan. Assoc. 2010, 76, 265–294. [Google Scholar] [CrossRef]
  8. Latora, V.; Marchiori, M. Efficient behavior of small-world networks. Phys. Rev. Lett. 2001, 87, 198701. [Google Scholar] [CrossRef] [Green Version]
  9. Latora, V.; Marchiori, M. Is the Boston subway a small-world network? Phys. A Stat. Mech. Appl. 2002, 314, 109–113. [Google Scholar] [CrossRef] [Green Version]
  10. Cardillo, A.; Gómez-Gardenes, J.; Zanin, M.; Romance, M.; Papo, D.; Del Pozo, F.; Boccaletti, S. Emergence of network features from multiplexity. Sci. Rep. 2013, 3, 1344. [Google Scholar] [CrossRef] [Green Version]
  11. Derrible, S.; Kennedy, C. The complexity and robustness of metro networks. Phys. A Stat. Mech. Appl. 2010, 389, 3678–3691. [Google Scholar] [CrossRef]
  12. Jenelius, E.; Petersen, T.; Mattsson, L.G. Importance and exposure in road network vulnerability analysis. Transp. Res. Part A Policy Pract. 2006, 40, 537–560. [Google Scholar] [CrossRef]
  13. Mishra, S.; Welch, T.F.; Jha, M.K. Performance indicators for public transit connectivity in multi-modal transportation networks. Transp. Res. Part A Policy Pract. 2012, 46, 1066–1085. [Google Scholar] [CrossRef]
  14. Lee, K.; Jung, W.S.; Park, J.S.; Choi, M.Y. Statistical analysis of the Metropolitan Seoul Subway System: Network structure and passenger flows. Phys. A Stat. Mech. Appl. 2008, 387, 6231–6234. [Google Scholar] [CrossRef] [Green Version]
  15. Xiao, X.M.; Jia, L.M.; Wang, Y.H. Correlation between heterogeneity and vulnerability of subway networks based on passenger flow. J. Rail Transp. Plan. Manag. 2018, 8, 145–157. [Google Scholar] [CrossRef]
  16. Von Ferber, C.; Holovatch, T.; Holovatch, Y.; Palchykov, V. Public transport networks: Empirical analysis and modeling. Eur. Phys. J. B 2009, 68, 261–275. [Google Scholar] [CrossRef] [Green Version]
  17. Du, F.; Huang, H.; Zhang, D.; Zhang, F. Research of characteristics of complex network and robustness in Shanghai metro network. Eng. J. Wuhan Univ. 2016, 4965, 701–707. [Google Scholar]
  18. Mavoa, S.; Witten, K.; McCreanor, T.; O’sullivan, D. GIS based destination accessibility via public transit and walking in Auckland, New Zealand. J. Transp. Geogr. 2012, 20, 15–22. [Google Scholar] [CrossRef]
  19. Handy, S.L.; Niemeier, D.A. Measuring accessibility: An exploration of issues and alternatives. Environ. Plan. A 1997, 29, 1175–1194. [Google Scholar] [CrossRef]
  20. Bertolini, L.; Dijst, M. Mobility Environments and Network Cities. J. Urban Des. 2003, 8, 27–43. [Google Scholar] [CrossRef]
  21. Kwan, M.P. Space-time and integral measures of individual accessibility: A comparative analysis using a point-based framework. Geogr. Anal. 1998, 30, 191–216. [Google Scholar] [CrossRef]
  22. Páez, A.; Scott, D.M.; Morency, C. Measuring accessibility: Positive and normative implementations of various accessibility indicators. J. Transp. Geogr. 2012, 25, 141–153. [Google Scholar] [CrossRef]
  23. Geurs, K.T.; van Wee, B. Accessibility evaluation of land-use and transport strategies: Review and research directions. J. Transp. Geogr. 2004, 12, 127–140. [Google Scholar] [CrossRef]
  24. Frost, M.E.; Spence, N.A. The rediscovery of accessibility and economic potential: The critical issue of self-potential. Environ. Plan. A 1995, 27, 1833–1848. [Google Scholar] [CrossRef]
  25. Cheung, C.; Black, J. A reappraisal of the intervening opportunities model of commuter behaviour. Road Transp. Res. 2008, 17, 3–18. [Google Scholar]
  26. Jiang, Y.; Zegras, P.C.; Mehndiratta, S. Walk the line: Station context, corridor type and bus rapid transit walk access in Jinan, China. J. Transp. Geogr. 2012, 20, 1–14. [Google Scholar] [CrossRef]
  27. Wang, C.H.; Chen, N. A GIS-based spatial statistical approach to modeling job accessibility by transportation mode: Case study of Columbus, Ohio. J. Transp. Geogr. 2015, 45, 1–11. [Google Scholar] [CrossRef]
  28. Bonotti, R.; Rossetti, S.; Tiboni, M.; Tira, M. Analysing Space-Time Accessibility towards the Implementation of the Light Rail System: The Case Study of Brescia. Plan. Pract. Res. 2015, 30, 424–442. [Google Scholar] [CrossRef]
  29. Ma, X.; Wu, Y.J.; Wang, Y.; Chen, F.; Liu, J. Mining smart card data for transit riders’ travel patterns. Transp. Res. Part C Emerg. Technol. 2013, 36, 1–12. [Google Scholar] [CrossRef]
  30. Reggiani, A.; Bucci, P.; Russo, G. Accessibility and Network Structures in the German Commuting. Netw. Spat. Econ. 2011, 11, 621–641. [Google Scholar] [CrossRef]
  31. Merlin, L.A.; Hu, L.Q. Does competition matter in measures of job accessibility? Explaining employment in Los Angeles. J. Transp. Geogr. 2017, 64, 77–88. [Google Scholar] [CrossRef]
  32. Luan, X.; Cheng, L.; Song, Y.; Zhao, J. Better understanding the choice of travel mode by urban residents: New insights from the catchment areas of rail transit stations. Sustain. Cities Soc. 2020, 53, 101968. [Google Scholar] [CrossRef]
  33. Dai, F.Z.; Diao, M.; Sing, T.F. Effects of rail transit on individual travel mode shares: A two-dimensional propensity score matching approach. Transp. Res. Part D Transp. Environ. 2020, 89, 102601. [Google Scholar] [CrossRef]
  34. Runa, F.; Singleton, P.A. What factors are associated with travel liking on a recent commute? Evidence from commuters in Portland, Oregon. Travel Behav. Soc. 2021, 23, 207–215. [Google Scholar] [CrossRef]
  35. Pan, H.X.; Shen, Q.; Zhao, T. Travel and Car Ownership of Residents near New Suburban Metro Stations in Shanghai, China. Transp. Res. Rec. 2013, 2394, 63–69. [Google Scholar] [CrossRef]
  36. Yang, A.; Wang, B.; Huang, J.; Li, C. Service replanning in urban rail transit networks: Cross-line express trains for reducing the number of passenger transfers and travel time. Transp. Res. Part C Emerg. Technol. 2020, 115, 102629. [Google Scholar] [CrossRef]
  37. Manley, E.; Zhong, C.; Batty, M. Spatiotemporal variation in travel regularity through transit user profiling. Transportation 2018, 45, 703–732. [Google Scholar] [CrossRef] [Green Version]
  38. Thorhauge, M.; Haustein, S.; Cherchi, E. Accounting for the Theory of Planned Behaviour in departure time choice. Transp. Res. Part F Traffic Psychol. Behav. 2016, 38, 94–105. [Google Scholar] [CrossRef] [Green Version]
  39. Yang, C.; Yan, F.F.; Ukkusuri, S.V. Unraveling traveler mobility patterns and predicting user behavior in the Shenzhen metro system. Transp. A Transp. Sci. 2018, 14, 576–597. [Google Scholar] [CrossRef]
  40. Wang, J.; Jin, F.; Mo, H.; Wang, F. Spatiotemporal evolution of China’s railway network in the 20th century: An accessibility approach. Transp. Res. Part A Policy Pract. 2010, 44, 52. [Google Scholar] [CrossRef]
  41. Ni, J.H.; Liang, M.; Lin, Y. Multi-Mode Two-Step Floating Catchment Area (2SFCA) Method to Measure the Potential Spatial Accessibility of Healthcare Services. Isprs Int. J. Geo-Inf. 2019, 8, 236. [Google Scholar] [CrossRef] [Green Version]
  42. Lättman, K.; Olsson, L.E.; Friman, M. A new approach to accessibility—Examining perceived accessibility in contrast to objectively measured accessibility in daily travel. Res. Transp. Econ. 2018, 69, 501–511. [Google Scholar] [CrossRef]
  43. Abuaddous, H.Y.; Jali, M.Z.; Basir, N. Web Accessibility Challenges. Int. J. Adv. Comput. Sci. Appl. 2016, 7, 172–181. [Google Scholar] [CrossRef] [Green Version]
  44. Salze, P.; Banos, A.; Oppert, J.M.; Charreire, H.; Casey, R.; Simon, C.; Chaix, B.; Badariotti, D.; Weber, C. Estimating spatial accessibility to facilities on the regional scale: An extended commuting-based interaction potential model. Int. J. Health Geogr. 2011, 10, 2. [Google Scholar] [CrossRef] [Green Version]
Figure 1. Study area and spatiotemporal expansion of rail transit network. Note: By March 2019, Xujiapeng Station of Line 8 and Xujiapeng Station of Line 7 have not yet opened for interchange, so this article is calculated separately by two stations.
Ijgi 10 00789 g001
Figure 2. Evolution of node degree distribution in the Wuhan rail transit network. (a) 2014; (b) 2015; (c) 2016; (d) 2017; (e) 2018; (f) 2019; Horizontal axis represents the degree distribution of nodes and vertical axis represents the number of stations.
Ijgi 10 00789 g002aIjgi 10 00789 g002b
Figure 3. Distribution of weighted time accessibility index of the Wuhan rail transit network. Note: The unit of the weighted time accessibility index is minute.
Ijgi 10 00789 g003
Figure 5. The migration of the accessibility gravity of Wuhan rail transit network in 2014–2019.
Ijgi 10 00789 g005
Figure 6. Space structure planning map of Wuhan.
Ijgi 10 00789 g006
Table 1. Examples of data records of smart cards in Wuhan metro system.
Card NumberSwipe TimeLineStationSwipe TypeCard Type
80271104xxxxxxxx2019/03/11 06:20:511103 128 3205
80271104xxxxxxxx2019/03/11 06:46:224437 229 4205 5
1 Line 1, 103 station is the Wuhan avenue station. 2 Line 4, 437 station is the Qilimiao station. 3 Swipe type, 28 are in-station. 4 Swipe type, 29 are out-station. 5 Card type 205 is the code scanning pass.
Table 3. Evolution of topological statistics indexes of Wuhan rail transit.
Year K ¯ 1D 2 C ¯ 3 L ¯ 4 B ¯ 5
20141.966320.00011.7510.059
20151.973370.00013.7890.070
20162.021320.00012.3680.092
20172.114320.00411.9730.135
20182.134400.00312.9190.176
20192.168510.00315.3850.255
1 The node degree. 2 The number of shortest paths. 3 The clustering coefficient. 4 The average path length. 5 Node betweenness.
Table 4. Descriptive statistics of weighted time accessibility index of the Wuhan rail transit network.
YearnMinimumMaximumMeanStandard Deviation
201458 116.3749.4029.91368.07067
20157519.5854.5434.42089.41600
20169619.6851.1634.18147.78418
201712319.5158.6737.29488.01921
201814920.2686.0137.294812.43961
201919022.7488.7843.592514.98766
1 Zhuyehai station of rail transit Line 1 was not included in the accessibility index calculation in this study, because it was opened but not used in March 2014.
Table 5. Correlation analysis results of resident travel characteristics and accessibility index in 2014.
VariableAccessibility Index
rp
Average travel flow−0.405 **0.002
Average number of travelers−0.350 **0.007
Average travel frequency−0.490 **0.000
Average travel distance−0.705 **0.000
Morning peak hour−0.1470.270
Moring peak flow−0.1900.153
Evening peak hour−0.1770.183
Evening peak flow−0.2410.068
Note: ** indicates a significant correlation at the 0.01 level (two-sided).
Table 6. Correlation analysis results of resident travel characteristics and accessibility index in 2015.
VariableAccessibility Index
rp
Average travel flow−0.460 **0.000
Average number of travelers−0.417 **0.000
Average travel frequency−0.363 **0.001
Average travel distance0.336 **0.003
Morning peak hour−0.1070.361
Moring peak flow−0.343 **0.003
Evening peak hour−0.270 *0.019
Evening peak flow−0.577 **0.000
Note: ** indicates a significant correlation at the 0.01 level (two-sided); * indicates a significant correlation at the 0.05 level (two-sided).
Table 7. Correlation analysis results of resident travel characteristics and accessibility index in 2016.
VariableAccessibility Index
rp
Average travel flow−0.397 **0.000
Average number of travelers−0.340 **0.001
Average travel frequency−0.298 **0.003
Average travel distance0.503 **0.000
Morning peak hour−0.0940.361
Moring peak flow−0.210 *0.040
Evening peak hour−0.0940.363
Evening peak flow−0.514 **0.000
Note: ** indicates a significant correlation at the 0.01 level (two-sided); * indicates a significant correlation at the 0.05 level (two-sided).
Table 8. Correlation analysis results of resident travel characteristics and accessibility index in 2017.
VariableAccessibility Index
rp
Average travel flow−0.396 **0.000
Average number of travelers−0.314 **0.000
Average travel frequency−0.502 **0.000
Average travel distance−0.746 **0.000
Morning peak hour0.0090.922
Moring peak flow−0.478 **0.000
Evening peak hour−0.1610.075
Evening peak flow−0.346 **0.000
Note: ** indicates a significant correlation at the 0.01 level (two-sided).
Table 9. Correlation analysis results of resident travel characteristics and accessibility index in 2018.
VariableAccessibility Index
rp
Average travel flow−0.439 **0.000
Average number of travelers−0.379 **0.000
Average travel frequency−0.309 **0.000
Average travel distance0.840 **0.000
Morning peak hour−0.163 *0.046
Moring peak flow−0.378 **0.000
Evening peak hour−0.1130.170
Evening peak flow−0.515 **0.000
Note: ** indicates a significant correlation at the 0.01 level (two-sided); * indicates a significant correlation at the 0.05 level (two-sided).
Table 10. Correlation analysis results of resident travel characteristics and accessibility index in 2019.
VariableAccessibility Index
rp
Average travel flow−0.517 **0.000
Average number of travelers−0.477 **0.00
Average travel frequency−0.290 **0.000
Average travel distance0.831 **0.000
Morning peak hour−0.1420.051
Moring peak flow−0.474 **0.000
Evening peak hour−0.0600.410
Evening peak flow−0.516 **0.000
Note: ** indicates a significant correlation at the 0.01 level (two-sided).
Publisher’s Note: MDPI stays neutral with regard to jurisdictional claims in published maps and institutional affiliations.

