
Climate Change and Vulnerability: The Case of MENA Countries

1
Department of Agricultural Extension and Education, College of Agriculture, Shiraz University, Shiraz 71348-14336, Iran
2
Department of Agriculture, Payame Noor University, Tehran 19395-4697, Iran
*
Author to whom correspondence should be addressed.
ISPRS Int. J. Geo-Inf. 2021, 10(11), 794; https://0-doi-org.brum.beds.ac.uk/10.3390/ijgi10110794
Submission received: 22 August 2020
/
Revised: 29 October 2020
/
Accepted: 2 November 2020
/
Published: 22 November 2021
(This article belongs to the Special Issue Multi-Hazard Spatial Modelling and Mapping)
Abstract
:Climate is changing and mitigation of the corresponding impacts requires assessment of vulnerability and adaptation building. This issue is particularly important in Middle East and North Africa (MENA), which is recognized as one of the most water scarce regions of the world and vulnerable to climate change. Therefore, the objective of this study was an assessment of the different sectors’ vulnerability as well as the overall vulnerability of the MENA countries to climate change. The Notre Dame-Global Adaptation Index (ND-GAIN) was used to investigate climate change vulnerability. Cluster analysis revealed the very high, high, medium and low levels of vulnerability for the MENA countries by distinguishing their extent of exposure, sensitivity and adaptive capacity. Further results indicated that the MENA countries have an acceptable status of infrastructure and habitat, tolerable health and ecosystem statuses, and inappropriate water and food conditions. Water shortage is also a serious problem in this region, to the extent that it is often assumed that water shortage is the root cause of all other types of vulnerability in MENA. However, the obtained results do not support this assumption. These findings provide insight about the adaptation challenges that should be faced and the choices that should be made in response to climate change, in MENA.
Keywords:
climate change; vulnerability; exposure; sensitivity; adaptive capacity; food; water; ecosystem services; MENA1. Introduction
Climate change is a widely accepted reality. The change of climate is expected to confront the globe with numerous challenges, such as global warming. Global warming, which has serious economic consequences for societies, is one of the most serious challenges the world has faced due to climate change [1]. Water stress, acidification of oceans and the potential extinction risk of some plant and animal species are the other challenges [2]. With respect to these challenges, climate change is expected to cause significant impacts on the water resources of the arid and semi-arid regions of the world [3]. Global water scarcity has also critical impacts on food production and security, human health and economic development [4]. Under climate change, one of the greatest dilemmas of the world is how to feed the growing population while safeguarding the environment [2]. In spite of the improvements achieved regarding this dilemma, the available information is still limited due to the lack of comprehensive observations of regional climates [5]. In order to fill this knowledge gap, vulnerability of the Middle East and North Africa (MENA) countries to climate change is investigated. On the basis of the IPCC report 2014+, MENA is significantly vulnerable to the effects of climate change, such as precipitation reduction and increase in temperature. Therefore, many MENA countries would likely experience a hotter and drier weather through the course of the 21st century [6]. Vulnerability to climate change stands for susceptibility of a system to the adverse impacts of climate change and is related to the sensitivity of the human and natural system to the climate exposure and capacity of the system to adapt [7,8].
Thus, vulnerability to climate change differs from one context to another [9] and has a strong tie with the socio-economic and ecological characteristics of a given society. In other words, it is necessary to assess vulnerability of every single community to understand the effects of climate change on the MENA region. Based on the World Bank, this region includes Algeria, Bahrain, Djibouti, Egypt, Iran, Iraq, Israel, Jordan, Kuwait, Lebanon, Libya, Malta, Morocco, Oman, Qatar, Saudi Arabia, Syria, Tunisia, United Arab Emirates, West Bank, Gaza and Yemen [10]. MENA has a high degree of political instability and a low level of economic freedom. In addition, it has suffered from war (invasion or civil violence) for decades [11]. While MENA is rich in oil and gas reservoirs by having about 57% of the world’s oil reserves and 41% of the natural gas resources [12], its renewable water resources are poor [10].
On the other hand, as a result of climate change, MENA will be noticeably warmer by 2030. So that, the average summer temperature of MENA is expected to be 1–2 °C hotter and the trend of temperature increase will continue until 2050 and beyond [13]. The average water availability per person in other geographical regions is about 7000 m3/year, whereas water availability is merely 1200 m3/person/year in the MENA region. This region has the highest per capita rates of freshwater extraction in the world. Due to burgeoning population and rapid economic growth, the per capita water availability is expected to reduce to alarming proportions in the coming decades [14]. Moreover, on the basis of the World Water Development Report 4, water scarcity is the main demolition factor of economy among the MENA countries [15] and about 1% of GDP in Egypt, Jordan, Lebanon and Morocco and nearly 3% of GDP in Iran are dedicated to remedy of the water-induced health damages and loss of products [6]. Continuation of water scarcity can lead to severe economic destruction of these countries in the near future [15].
Another important feature of MENA is possession of diverse biological, nonrenewable and renewable resources, which are of both global and local importance in control of the world’s climate and development of industrial and agriculture activities, production of pharmaceutics, construction and tourism [16]. However, the population of MENA is growing so fast with an average annual growth rate of 2.1% between 1990 and 2003 [17,18]. By 2050, MENA is expected to have a population size of 692 million. Moreover, MENA has the least arable land per person among the world’s regions [19]. Population densities in MENA are largest in semi-arid to humid regions, or where irrigation systems are present [20]. Therefore, more water, food, jobs and housing will be required in MENA [21]. Meanwhile, the regions that have rapidly expanding populations and low levels of arable land are more vulnerable to food and water unavailability [7,22]. Furthermore, global warming and over-use of natural resources in the already vulnerable MENA countries has resulted in degradation of ecosystems, threatening of lives, decrease in environmental quality, increase in ecological degradation, change of species’ distribution and loss of biodiversity [4,21].
This study is designed to reflect the vulnerability of the MENA region to climate change and enable prioritization of adaptation investments for its population [23]. In fact, the findings of this research can assist policy makers and development planners to develop highly effective adaptive strategies for decreasing vulnerability of MENA to climate change with respect to the impacts of vulnerability on water, food, health, infrastructure, human habitat and ecosystem services. It should be noted that most of the worldwide efforts that have been devoted to vulnerability reduction and adaptation building have failed in the process of scale extension from the local level to the national, regional or global scales [24]. It is while there are several studies on various aspects of vulnerability to climate change on some practical sectors, e.g., water resources, agricultural production, food security, energy, industry and human activities (e.g., [7,8,9,10,11,12,13,14,15,16,17,18,19,20,21,22,23,24,25,26,27,28,29,30,31,32,33,34]). Therefore, this study tries to facilitate shifting from the local level to the regional scale by considering a complex net of elements including the economic, social, cultural, political and environmental factors [27] in the process of vulnerability assessment.
2. Materials and Methods
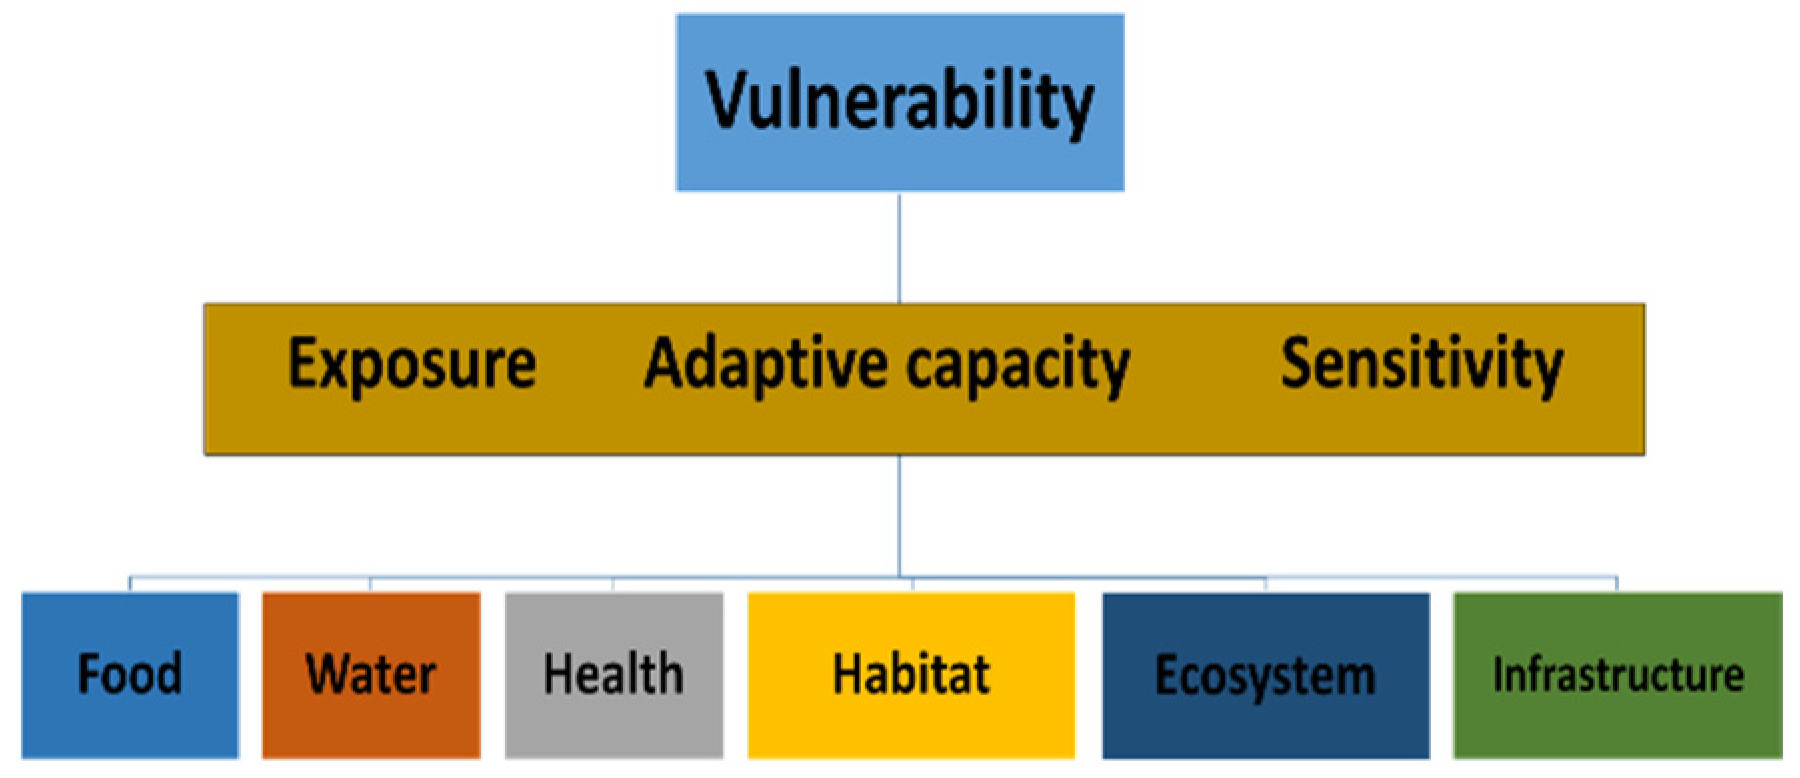
In order to assess vulnerability of the MENA countries to climate change, the Notre Dame-Global Adaptation Index (ND-GAIN) was used. This open source index represents the current vulnerability of a country to climatic disruptions by forming 45 core indicators from over 74 variables for measurement of the readiness and vulnerability of countries since 1995. In this respect, the best available data sources (e.g., AQASTAT, FAOSTAT, and World Bank) are used to estimate vulnerability to climate change by focusing on the water, food, human habit, health, ecosystem services and infrastructure life-supporting sectors (Figure 1).
Several researchers, corporate stakeholders, policy makers, practitioners, and development planners reached a consensus in favor of vulnerability measures. Six indicators are used for each sector (Table 1) to evaluate the three components of: exposure to climate induced hazards; sensitivity to the hazard impacts; and adaptive capacity to adapt to or cope with the hazard consequences [26].
Exposure is defined as the extent of stress imposed to the human society and its supporting sectors by the changes of climate conditions. In other words, the exposure component of ND-GAIN deals with the external physical factors that contribute to the vulnerability of the studied system. Sensitivity is determined as the affection level of the members and sectors of the system by the climate changes. The factors that can increase the extent of sensitivity include dependency level of the climate-sensitive sectors and the proportion of the system’s population that is sensitive to climate hazard due to various factors, e.g., demography and topography.
Adaptive capacity is the ability of the system and its supporting sectors to respond to and decrease the potential damages of negative impacts of climate. In ND-GAIN, the indicators of adaptive capacity are selected in a way to efficiently capture a collection of means that are readily deployable and can deal with the sector-specific impacts of climate change [26].
Since the variables adopted to calculate ND-GAIN were incommensurate data (data with different scales and units), all data were standardized into a uniform (0, 1) scale with ratio properties. The equation used by ND-GAIN for this transformation is:
The reference point reveals the perfection status, i.e., the performance that gives zero vulnerability. A detailed description of reference point, and maximum and minimum baselines of each index is presented as Supplementary Materials (Table S1).
After transforming the data into commensurate values, the extents of exposure, sensitivity and adaptive capacity were calculated for each sector and the sector (i.e., water, food, human habit, health, ecosystem services, and infrastructure life-supporting vulnerability) and overall vulnerability were determined. The score of sector vulnerability was calculated by taking the arithmetic mean of exposure, sensitivity and adaptive capacity scores. Finally, the arithmetic mean score of the food, water, health, ecosystem services, human habitat, and infrastructure sectors were used to calculate the score of overall vulnerability [26].
After calculation of the annual vulnerability scores, cluster analysis was applied to classify the MENA countries into relatively homogenous groups. Classification of the MENA countries into meaningful subgroups of subjects (i.e., a number of clusters) was carried out based on the observed values of food, water, human, ecosystem services, health and infrastructure vulnerabilities of each country during 1995 to 2018. In cluster analyses of each sector of variables, available data in the period of 1995–2015 for each country was used. Clustering MENA countries into groups which encounter similar exposures and have the same sensitivity and adaptive capacity can provide useful information for policy-makers to better target their regional plans and policies toward reduction of vulnerabilities and increase the resilience to climate change. Several clustering methods (i.e., hierarchical and non-hierarchical) can be used to distinguish MENA countries based on their exposure, sensitivity and adaptive capacity. In this longitudinal study, the non-hierarchical clustering method was applied. Non-hierarchical clustering technique is appropriate for large data sets. However, arbitrary number of cluster centers should be predetermined. Additionally, within the non-hierarchical method several specific methods and algorithms exist. In the present study, the K-means cluster analysis was distinguished as the most appropriate approach and the MENA countries were classified into four types of vulnerability groups (i.e., low, medium, high and very high) using the SPSS software version 21. The k-means clustering is an iterative technique which starts with k cluster centers randomly selected. Then, all observations (e.g., MENA countries) are incorporated to the nearest cluster center. The new cluster centers are calculated as the mean of the observations of a particular cluster (e.g., low vulnerable group). The observations are classified regarding the new centers (i.e., vulnerability classes) iteratively until convergence. Moreover, to investigate the differences between the clusters, ANOVA analysis was performed.
In this article, the overall situation of vulnerability in MENA countries is first examined the countries in four groups in terms of mean total of vulnerability and average vulnerability of different sectors tables showed. In the following tables, each of the six dimensions of vulnerability of countries using the ANOVA test, based on the three indicators have been examined in more detail and their significant differences in vulnerability in different groups of MENA countries have been investigated.
3. Results
3.1. Vulnerability of MENA Countries
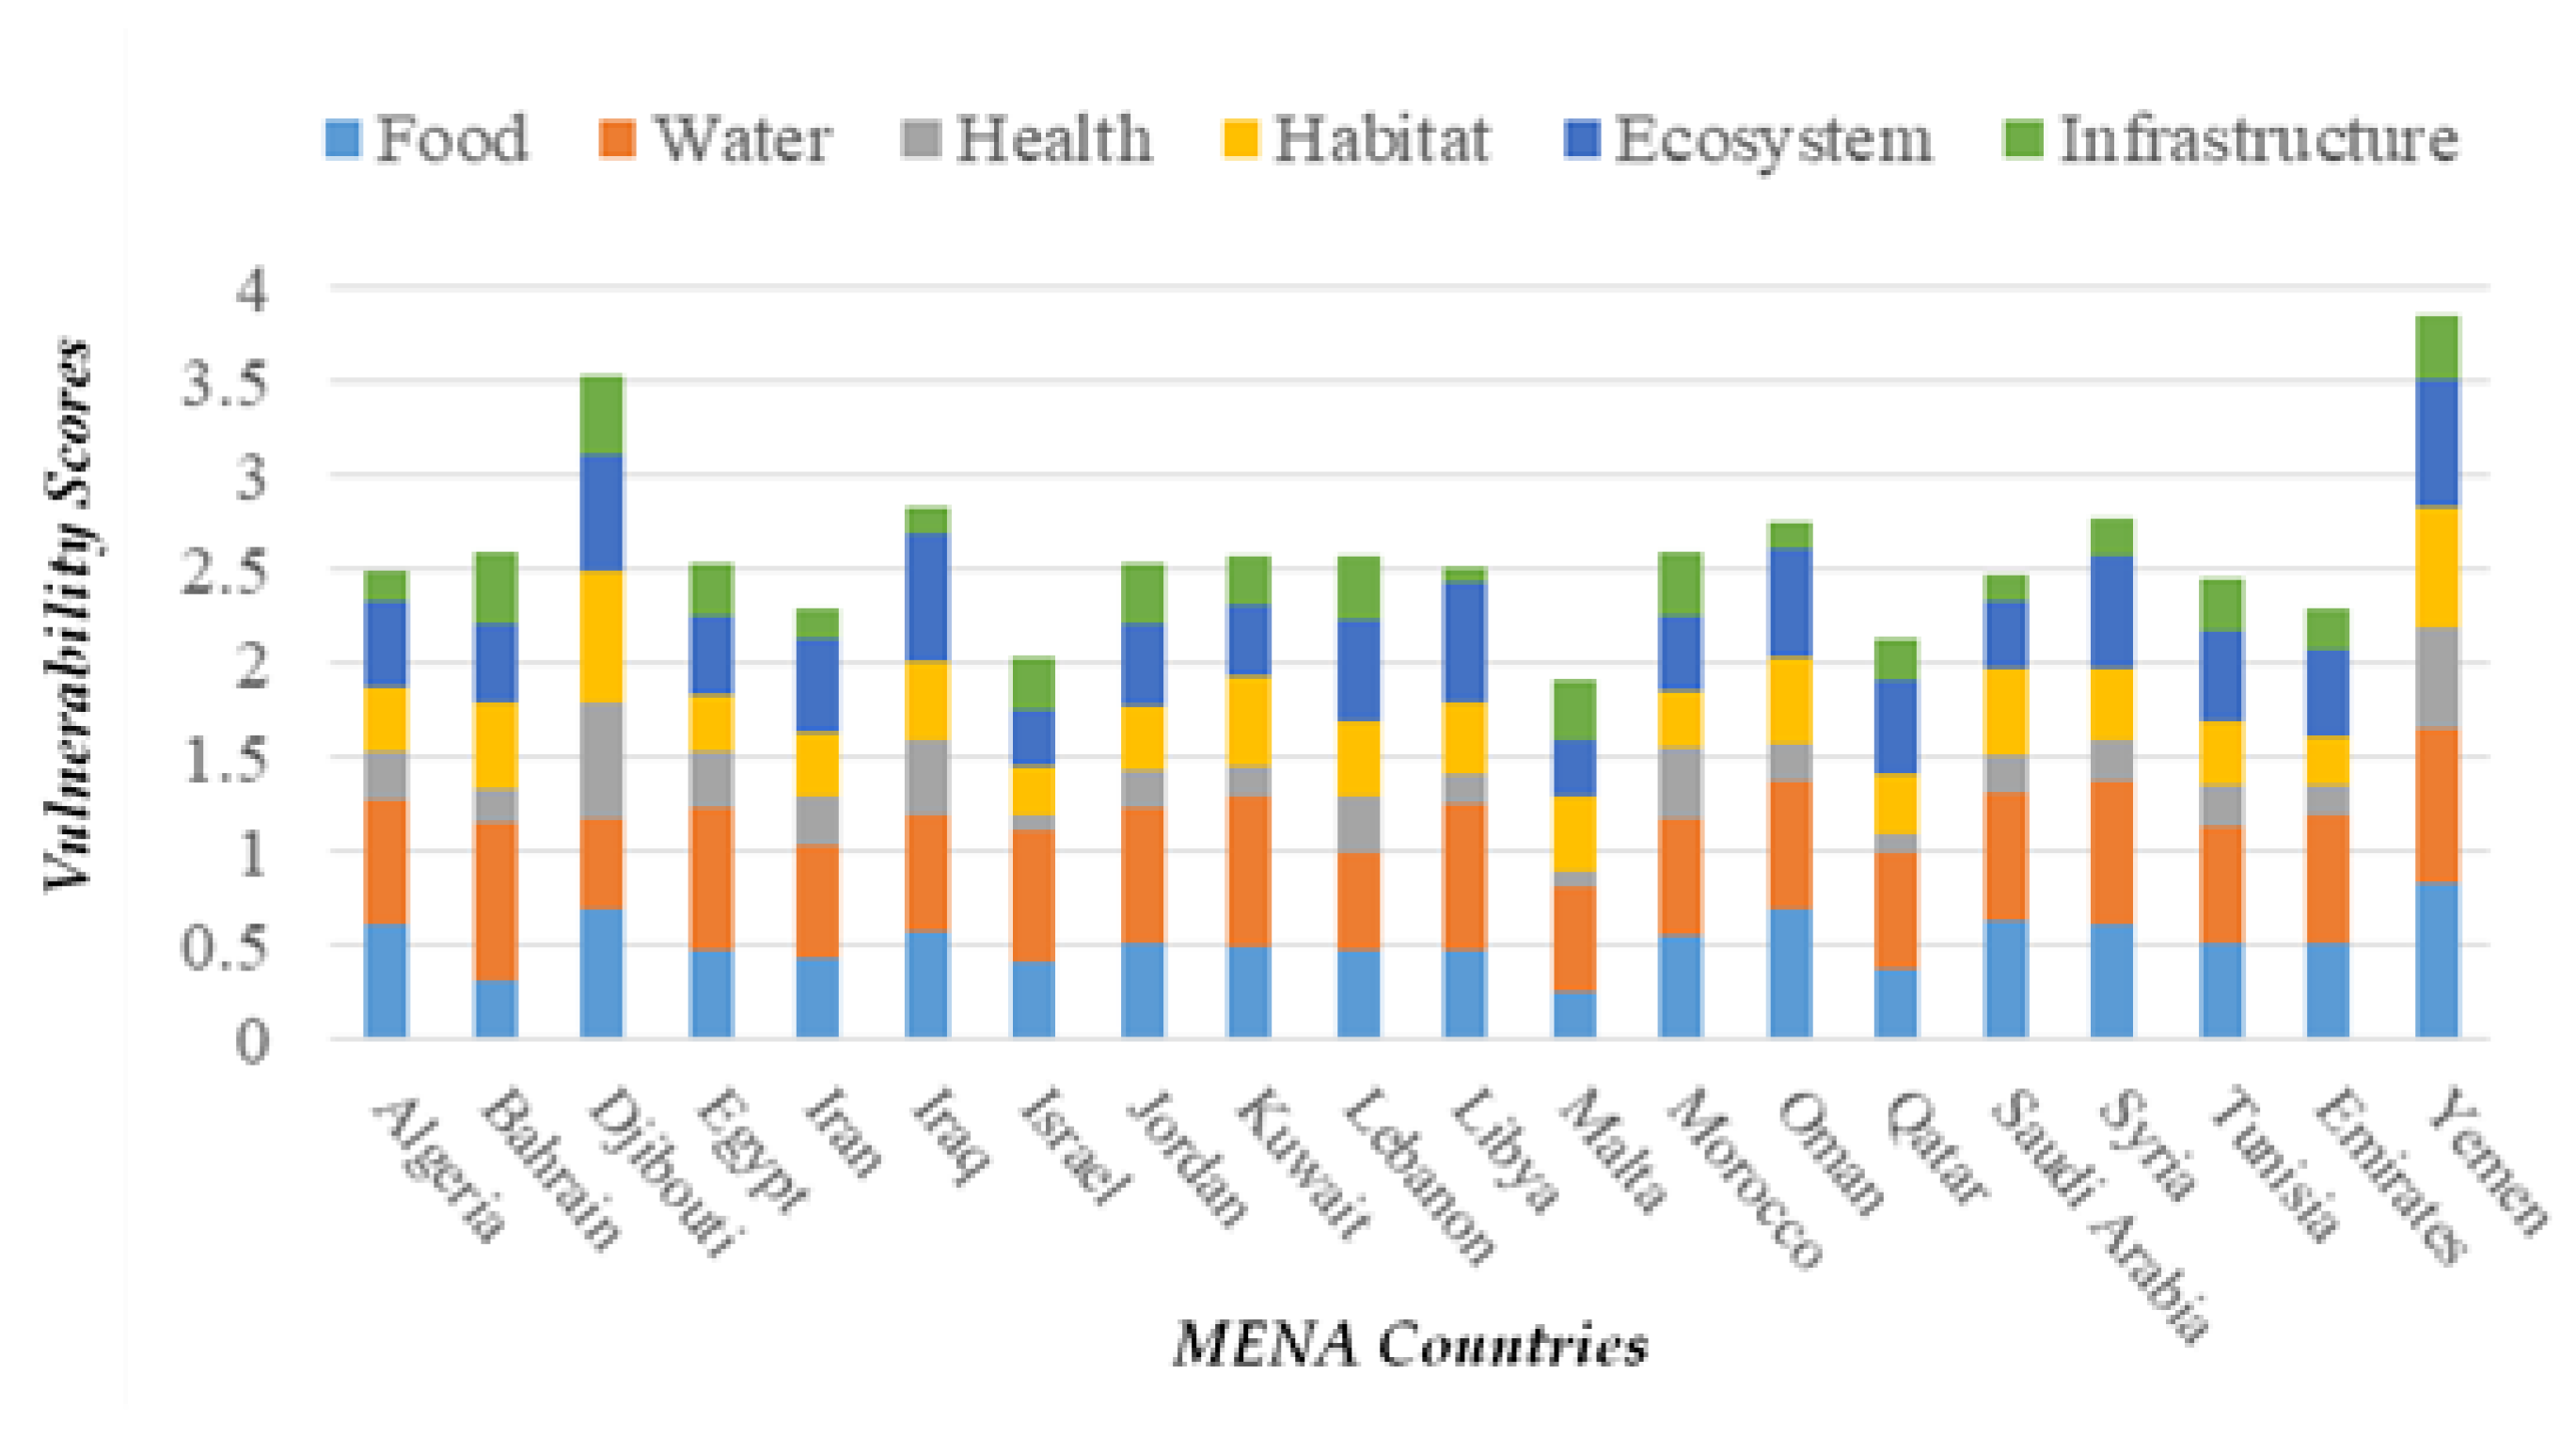
Figure 2 demonstrates vulnerability of the food, water, health, habitat, infrastructure, and ecosystem services sectors in the MENA countries. As indicated in Figure 2, Yemen, Djibouti and Iraq are the most vulnerable countries. This is while Malta and Israel are the least vulnerable countries in the MENA region.
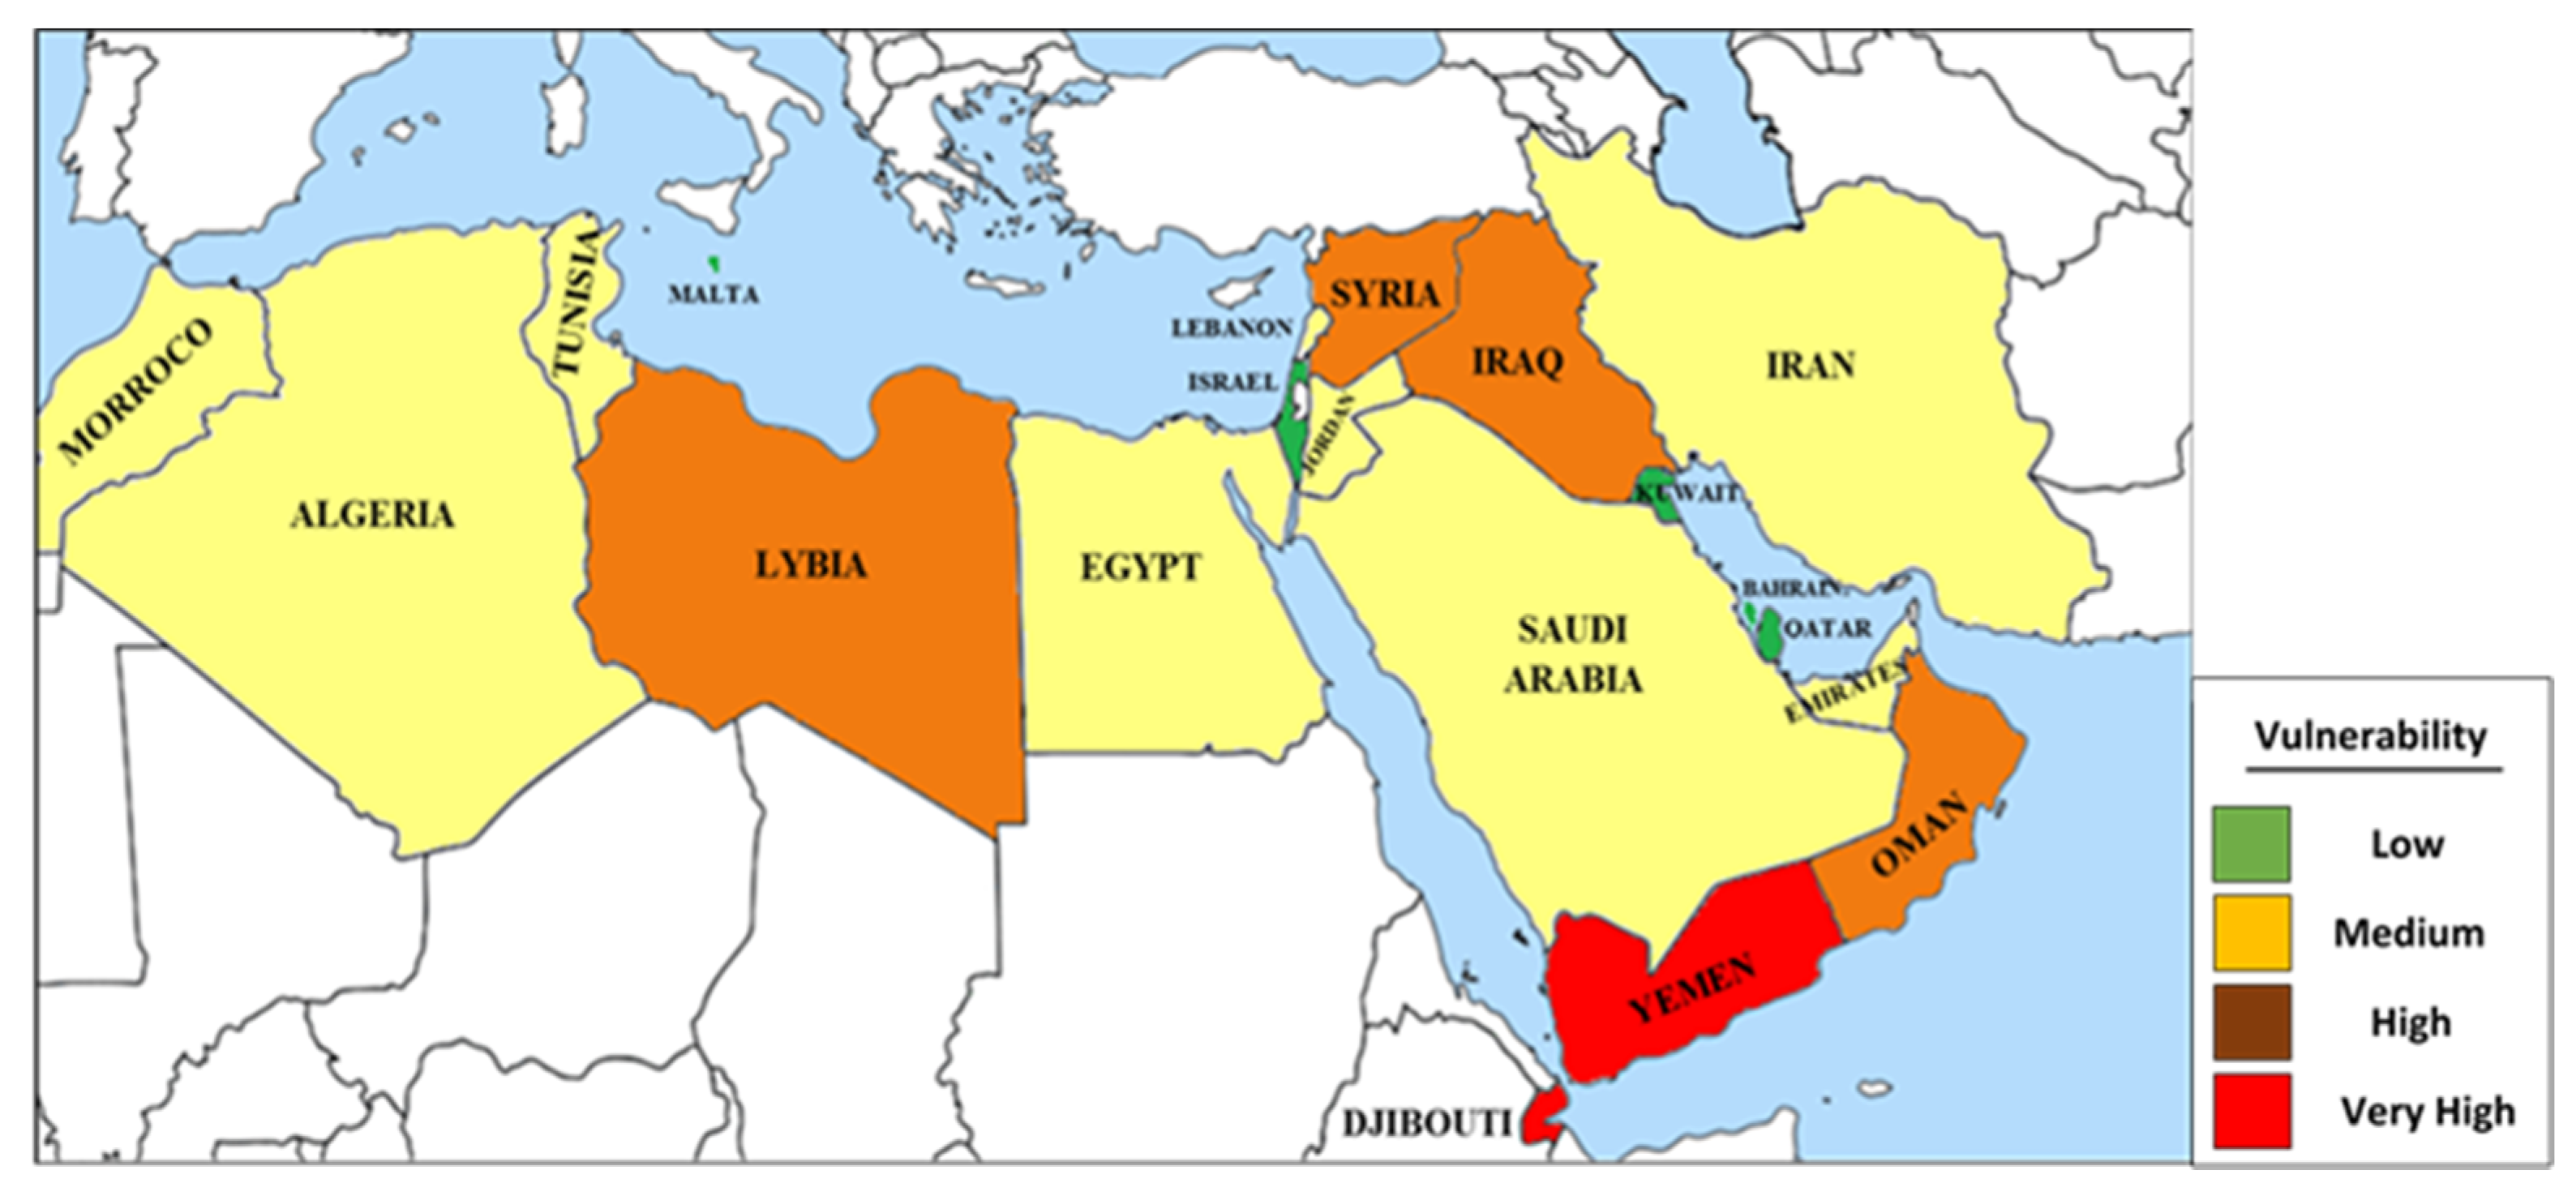
Cluster analysis determined four vulnerability clusters including: (1) low vulnerability ( = 0.372): Bahrain, Kuwait, Malta, Qatar and Israel, (2) medium vulnerability ( = 0.411): Tunisia, Saudi Arabia, Morocco, Lebanon, Jordan, Iran, Emirates, Egypt and Algeria, (3) high vulnerability ( = 0.453): Syria, Oman, Iraq and Libyan and (4) very high vulnerability ( = 0.613): Djibouti and Yemen (Table 2). As indicated in Table 2, the highest rate of food vulnerability is related to Yemen and Djibouti. However, food vulnerability is remarkable and higher than the mean value in most MENA countries. In addition, Table 2 reveals that all clusters have suffered from water scarcity, which means that water scarcity is a major obstacle in MENA. On the other hand, the only group with inappropriate habitat and infrastructure conditions is the very high vulnerable cluster including Yemen and Djibouti (Table 2). Furthermore, considering the ecosystem index, the low vulnerable countries have a relatively acceptable situation while the high and very high vulnerable countries are in unsuitable conditions based on their ecosystem indices. Moreover, on the basis of the health index, all MENA countries have a low level of vulnerability except Yemen and Djibouti, whose conditions are concerning. In summary, the MENA countries have acceptable infrastructure and habitat statuses, tolerable health and ecosystem conditions and inappropriate water and food circumstances (Table 2).
As indicated in Table 2, the low vulnerable countries, i.e., Bahrain, Kuwait, Malta, Qatar and Israel, have the lowest level of food, human habitat and ecosystem services vulnerability. Moreover, Table 2 declares that the medium vulnerable group, which is consisted of most MENA countries (i.e., Tunisia, Saudi Arabia, Morocco, Lebanon, Jordan, Iran, Emirates, Egypt and Algeria) shows a moderate degree of food, water and ecosystem services vulnerability and a low level of human habitat, health and infrastructure vulnerability. On the other hand, the highly vulnerable countries including Syria, Oman, Iraq and Libyan are associated with a high extent of water and ecosystem services vulnerability, a moderate degree of food and health vulnerability and a low level of human habitat and infrastructure vulnerability (Table 2). The very high vulnerable countries including Djibouti and Yemen exhibit the highest extent of food, human habitat, ecosystem services, health and infrastructure vulnerability (Table 2). The overall vulnerability of the MENA countries is shown in Figure 3.
The following sub-sections discuss the vulnerability of each sector separately due to the significance of the relative contribution of the sensitivity, exposure and adaptive capacity indicators to the context of each sector.
3.2. Food Vulnerability
As illustrated in Table 3, climate change is projected to significantly reduce production of rice, wheat and maize in the medium vulnerable countries due to the possible effects of global warming and chronic water stress. Projections of cereal yield changes have also asserted that it will be difficult to grow cereal crops in the MENA countries that are classified in the high and very high vulnerable groups (e.g., Yemen, Syria, Iraq and Libya). The climate change impacts are projected to be noticeably lower for the low vulnerable countries (e.g., Israel, Bahrain and Kuwait) that are the large importers of cereal crops (Table 3). Moreover, the high and very high vulnerable countries are expected to experience a population growth faster than that of the medium and low vulnerable groups (Table 3).
As indicated in Table 3, dependency on food import is a major concern for many of the MENA countries especially in the low and very high vulnerable clusters. In this respect, above 85% of consumed cereals of low and very high vulnerable countries originate from the other regions (Table 3). On the other hand, rural population is significantly high in Yemen and Djibouti, as the most vulnerable cluster (Table 3). However, Bahrain, Israel, Kuwait, Qatar and Malta (the low vulnerable countries) are the MENA nations with lower proportions of rural population (Table 3).
Among the MENA countries, the very high vulnerable cluster has the lowest agricultural capacity (Table 3). However, by implementing several mitigation and adaptation strategies, the members of the low and high vulnerable groups have improved their agricultural capacity in recent decades (Table 3). Additionally, Yemen and Djibouti (very high vulnerable countries) have the lowest capacity of responding to the basic nutritional needs of their most sensitive society members (Table 3). On the contrary, substantial progress is made in reducing child malnutrition in the low and high vulnerable countries (Table 3). Meantime, the burden of child malnutrition is relatively low in Israel, Bahrain, Qatar and Kuwait (Table 3).
3.3. Water Vulnerability
As indicated in Table 4, two of the exposure indices including the projected change of annual runoff and groundwater recharge have very high mean values among all clusters. With this respect, the mean values of annual runoff and groundwater recharge in Yemen and Djibouti, as the very high vulnerable countries, are equal to 1.00 (Table 4). Table 4 also illustrates that the low, medium and high vulnerable countries, such as Iran, Jordan, Lebanon, UAE and Saudi Arabia, have bad conditions of fresh water withdrawal rate. Furthermore, some low and high vulnerable countries supply much of their water demand from external sources (Table 4). Table 4 indicates that all MENA countries, except the high vulnerable group, have an appropriate access to reliable drinking water. Moreover, the dam capacity of the low, medium and high vulnerable countries is very low or low.
It is often assumed that water vulnerability is the root cause of all other vulnerabilities in MENA. Our findings do not support this assumption (Table 5). As indicated in Table 5, the relationship between water vulnerability and other types of vulnerability is very weak regardless of their significance.
3.4. Human Habitat Vulnerability
As declared in Table 6, the two exposure indices of projected change of warm period and flood hazard have the highest mean values for the very high vulnerable countries (i.e., Djibouti and Yemen). Climate change is also expected to significantly increase the frequency and intensity of flood hazards and warm periods in the low vulnerable countries (i.e., Bahrain, Kuwait, Malta, Qatar and Israel). On the other hand, urban concentration has demonstrated a major threat to the low and medium vulnerable countries (Table 6).
As indicated in Table 6, age dependency ratio is significantly higher for the high and very high vulnerable countries. Furthermore, the quality of transport and trade infrastructure and the percentage of paved roads are considerably lower in the high and very high vulnerable countries, in comparison with the low and medium vulnerable groups (Table 6). Table 6 states that most countries in the region have broad networks of paved roads with high capacities, in some areas.
3.5. Ecosystem Services Vulnerability
As declared in Table 7, the degree of changes in the biome distribution of the vulnerability classes is significantly different and climate change is likely to lead to more changes in the species’ distribution of the high and very high vulnerable countries. Moreover, climate change is expected to increase the risk of marine biodiversity loss in the highly vulnerable countries including Syria, Oman, Iraq and Libyan.
According to Table 7, ecological footprint, as the index of the sensitivity measure, is 0.43 and 0.10 for the very high and low vulnerable countries, respectively. Additionally, in comparison with the other vulnerability groups, the planet’s regenerative capacity is more demanded by very high vulnerable countries (Table 7).
In the low and medium vulnerable countries, the number of protected biomes has increased significantly (Table 7). It is while the high and very high vulnerable countries have paid less attention to protection of biomes (Table 7). Furthermore, the low and medium vulnerable groups have engaged more in environmental conventions and agreements, relative to the other groups even though participation of the MENA countries in the international conservation forums is relatively low (Table 7).
3.6. Health Vulnerability
As indicated in Table 8, the risk of mortality caused by climate change is significantly higher in the very high vulnerable countries. Table 8 also reports that dependency on external health services and the number of slum population are significantly higher in Yemen and Djibouti (i.e., the very high vulnerable countries), compared with the other MENA countries. In addition, these very high vulnerable countries have lower access to improved sanitation facilities and medical staffs (Table 8).
3.7. Infrastructure Vulnerability
As indicated in Table 9, most MENA countries will be almost unable to increase their hydropower generation capacity. From another perspective, sea-level rise will not be a serious challenge for the MENA region (Table 9). However, the low and medium vulnerable countries are moderately dependent on imported energy (Table 9), while the high and very high vulnerable countries depend fully on their own energy sources (Table 9).
Based on Table 9, a few MENA countries have attempted to prepare for and manage disasters by devising and applying effective plans, policies and legislation. In this respect, the lowest level of disaster preparedness can be seen for the high vulnerable countries (Table 9), while the proportion of the population living in under 5 m above sea level is significantly low in most MENA countries (Table 9).
4. Discussion
Identifying the situation and reducing the vulnerability of the MENA region is discussed here as a multi-objective issue in six areas.
4.1. Food Vulnerability
Findings revealed that it will be difficult to increase cereal yield in the high and very high vulnerable countries, which is similar to the findings of Wiebelt et al. [35] and Milenkovic et al. [36]. It is mainly due to the limited availability of arable lands, unprecedented extension of natural hazards and scarcity of water supply. Based on IPCC repots of 2019, land use change and rapid land use intensification have supported the increasing production of food, feed and fiber. Since 1961, the total production of food (cereal crops) has increased by 240% (until 2017) because of land area expansion and increasing yields [37].
However, the MENA region is characterized by a high rate of population growth (about two percent per year in 1990–2015) and the region’s population is expected to increase at an unprecedented rate by 2050. The rapidly growing population, along with the changing consumption patterns, will lead to an increasing demand for food. While the growth of foodstuff production has considerably fallen behind the growth of food demand, which would result in a significant gap between domestic production and consumption. Dependency on food import is extraordinarily high and significantly different among the four clusters. The low and very high vulnerable countries are extraordinarily dependent on grain import for supplying their food. Therefore, the Gulf Cooperation Council countries (including Bahrain, Kuwait, Oman, Qatar, Saudi Arabia and United Arab Emirates) should reach a satisfying level of food security as it is impossible for them to locally produce a remarkable part of their needed foods [38]. That is why Bahrain, Kuwait, Malta, Qatar, Israel (the low vulnerable group), Djibouti and Yemen (the very high vulnerable group) are the largest importers of grains in this region. Moreover, the members of the high vulnerable group (e.g., Syria and Iraq) have been the principal sources of grain supply but their agricultural productions have significantly reduced due to governmental mismanagement, price ceilings or underinvestment [39].
In MENA, most poor people live in rural areas and food insecurity is more severe for rural families [40]. Additionally, concentration of rural residents is more considerable in Syria, Iraq, Tunisia, Jordan and Egypt (the medium and high vulnerable groups). Though MENA suffers from the highest level of water scarcity in the world, many rural residents are highly dependent on agriculture and their agricultural sectors are perceived as the driving force for their development. Among the MENA countries, Yemen and Djibouti have the lowest agricultural capacity. These countries have a limited potential of agricultural production due to the lack of water supplies [36] and the other fundamental resources. For instance, Yemen has severe water scarcity with about a two-meter drop in its water tables [39]; with degradation of water resources, its grain yield has reduced by one third over the last 26 years while its demand for food has continued to rise. Due to the reduced flow of surface water resources and drilling and over-pumping wells for irrigation, the crop yields of Iraq, Syria and Libya have also shrunk, significantly. Furthermore, the grain harvests of Syria and Iraq have been respectively reduced by one fifth and one fourth over the last 15 years. In order to guarantee food supplies for domestic consumption, investment in foreign lands has been pursued by Libya [41]. By implementing major irrigation projects, using fertilizer for low quality soils and adopting large scale mechanization, the members of the low and high vulnerable groups have improved their agricultural capacity. Meanwhile, in Iran, Jordan, Saudi Arabia and Egypt, there is little farming without irrigation and agricultural production heavily benefits from groundwater resources. By recognizing the unreliability of water resources, several members of the medium and high vulnerable classes, such as Saudi Arabia, have acquisitioned foreign arable lands in Africa and elsewhere in order to produce food grains and meet the rising food demand of their rapidly growing population [41].
Among all MENA countries that are facing food crisis, Yemen and Djibouti are in the worst situation. These countries have the highest rate of child malnutrition due to regional conflicts, political instability and high level of poverty. It should be added that, since 1990s, considerable progress has been made in alleviating child malnutrition in the low and high vulnerable countries. On the basis of the FAO report [40], the rates of child stunting have reduced in several countries, such as Tunisia (from 31 to 10%, in 2012), Morocco (from 30 to 15%, in 2011), Oman (from 26 to 10%, in 2009) and Saudi Arabia (from 21 to 9%, in 2010).
4.2. Water Vulnerability
The Intergovernmental Panel on Climate Change projects strong changes in climate across MENA, further exacerbating pressure on available water resources [20]. MENA is the driest region of the world and contains just one percent of the world’s freshwater resources. However, some countries such as Yemen and Djibouti (i.e., very high vulnerable group) are consuming their surface and groundwater aquifers at a rate faster than the other MENA countries [18]. In addition, more than half of the water withdrawal in Saudi Arabia, Iran, Egypt, Qatar, Kuwait and Bahrain is unsustainable [15]. This statement implies that the MENA countries consume an amount of water that is noticeably greater than the water that can be replenished by their natural resources. For instance, the annual fresh water withdrawals of Iran, Egypt, Libya and Saudi Arabia exceed 108%, 350%, 800% and 954% of their renewable resources, respectively [6]. While the critical threshold of withdrawal-to-availability ratio is 40% [42]. Since withdrawal of excess freshwater from renewable water resources exerts water stress on countries [43], the mentioned countries suffer from serious water stress. Therefore, they cannot compensate the sustainable human needs defined by the United Nations [44].
In MENA, the primary source of drinking water is groundwater [45]. Since the impacts of climate change on groundwater resources have remained weakly comprehended [46], the MENA countries should consider alternative resources to ensure reliable access to drinking water in the future. It is mainly important for the highly vulnerable group which has lower access to drinking water compared with the other countries. Additionally, the rural areas of the MENA countries are frequently less well-served than their cities. For instance, only 56% of the rural inhabitants of Iraq enjoy from improved drinking water sources [6]. Dam capacity can offer the means required to cope with water stress and increased variability in surface water. However, most MENA countries have not enhanced the storage capacities of their constructed dams due to accelerated population growth, rapid urbanization, increase in irrigated area, and consumption of more water for irrigation and land reclamation [19]. Although inadequate or unsafe water supplies can lead to public health and social welfare crises in any region, it seems that these crises will be considerably concerning for the MENA countries [6].
Findings revealed a weak relationship between water vulnerability and other types of vulnerabilities. This finding implies that one cannot overestimate the impact of water scarcity in MENA. This issue is particularly important because failure to address water challenges can have significant negative spillover effects both within and outside the MENA region. Furthermore, it can be speculated that the relatively lower vulnerability of some MENA countries to climate change is the result of adopting more appropriate mitigation and adaptation strategies. It seems that the root causes of all vulnerabilities in MENA are rapid population growth, bad governance, mismanagement and a fatalistic attitude toward environmental problems [47].
4.3. Human Habitat Vulnerability
Based on the IPCC report, Asia and Africa are projected to have the highest number of people vulnerable to increased desertification [38]. Flood is the frequent disaster occurring in very high vulnerable countries, currently. The 2008 flood in Yemen caused USD 1.6 billion (6% of Yemen’s GDP) damages to this country [48] and the 2004 flood in Djibouti led to 230 deaths and affected 100,000 people [49]. Moreover, climate change is expected to significantly increase the frequency of floods in the low vulnerable group. Floods can regularly disrupt livelihoods in the MENA cities due to insufficient citywide drainage systems, limited structural protection and informal urbanization of catchment areas [49].
Findings revealed that urban concentration is another driver of MENA’s sensitivity. With an average growth rate of 2.1% per annum from 1990 to 2003, the MENA region has one of the world’s most rapidly expanding populations. Urban areas have been the primary focus of this growth. So that, the urban share of total population grew from 48% in 1980 to 61% in 2016 [15]. The rapid rate of urbanization and population growth is mainly observed in the economically poor parts of the MENA region [17]. The fast rate of urbanization has exerted intense pressure on the urban setting of 14 out of 20 MENA countries [50]. Moreover, on the basis of the UN’s projections, the population of MENA will reach 430 million by 2020 while 280 million MENA residents are expected to live in the urban areas. In addition, around 2030, over 90% of the population residing in seven of the medium and low vulnerable countries would be urban: Bahrain (95.8%), Israel (94.5%), Kuwait (98.4%), Lebanon (93.9%), Qatar (95.9%), Saudi Arabia (92.6%) and the UAE (93.3%) [18].
Furthermore, the quality of transport and trade infrastructure and the quantity of paved roads are significantly low in the high and very high vulnerable countries. Nevertheless, the trade and transport systems are only relatively well-developed in the low vulnerable countries. It is worth noting that the quality of transport infrastructure is often inefficient in the MENA region and cannot support evolution of a modern economy [51].
4.4. Ecosystem Services Vulnerability
Biodiversity of ecosystems might help to reduce the costs of the financial damages induced to human systems by weather events and climate change [52]. It is while, the present and future distributions of biodiversity can be severely affected by climate change [53,54]. The key point about the MENA countries is that though their climate is majorly arid, their diversity of freshwater biota is noticeably high and they have one of the greatest marine biodiversity levels on earth [55]. However, climate change is projected to threaten the marine biodiversity in the highly vulnerable countries. For instance, minor increase in water temperature can damage coral reefs, exacerbate the other types of stress (e.g., pollution and over-fishing) and, thereby, reduce fish stocks [4].
According to the findings, the very high and low vulnerable countries are not using their ecosystem services in a sustainable manner. To clarify this statement, one should notice that the ecological footprint per capita of MENA was 2.2 gha in 2006. This value was lower than the average footprint per capita of the world and greater than the world’s average bio capacity per capita, at that time [10]. Since the ecosystem of some MENA countries is fragile, any small change in bio capacity can have negative effects on their ecosystem and residents. Creation of protected areas can conserve the fragile environment of these countries [56].
4.5. Health Vulnerability
Findings indicated that the risk of climate change-induced mortality is higher in Yemen and Djibouti. The environmental literature is mainly dedicated to the climate change and health hazards that have a clear relationship with sustainable economic growth and long-term national development [57,58]. The Intergovernmental Panel on Climate Change has declared that climate change would mainly deteriorate human health by increasing the number of injuries and deaths caused by intense heat waves and freezing conditions, loss of work capacity, and water- and food-borne diseases [46]. Moreover, both Yemen and Djibouti have been ranked among the first 25 countries with a huge slum population. On the basis of the World Bank’s data, the slum populations of Djibouti and Yemen were respectively 65.6 and 60.8% of their urban population, in 2014 [59]. Moreover, only 59.4% of the urban population of Djibouti has access to improved sanitation facilities. In fact, since the start of war, access to improved sanitation facilities has been reduced in Yemen [60]. Meantime, a major problem for achievement of good health outcomes in Yemen and Djibouti is lack of adequate medical staffs.
4.6. Infrastructure Vulnerability
All MENA countries except Yemen, Djibouti and Iraq have managed to access universal basic infrastructures (e.g., water, sanitation, telecommunications, electricity and transport). However, the gap between the infrastructure quality of different MENA countries has widened as an outcome of delayed institutional and structural reforms [61]. Despite significant public investment in electricity production from hydroelectric sources [62], most MENA countries have failed to increase their hydropower generation capacity. Therefore, they have almost failed in coping with the increased power needs that originate from the growth of population, economic growth and rapid urbanization. From another perspective, though both Red and Mediterranean Sea basins have a semi-enclosed nature, sea-level rise is not a serious challenge for the MENA region. Based on historical records, tide gauges in the Mediterranean area indicated below average sea-level rise, that was less than the global average in the twentieth. The records corresponding to Arabian Sea and Red Sea were non-continuous and very limited, in the same period [42].
Moreover, a few MENA countries have prepared themselves against natural and man-made disasters. The example countries are Egypt, Algeria, Morocco and Lebanon. These countries have composed specific policies, in addition to setting up intra-governmental risk management units, to decrease their extent of vulnerability. The established units are meant to assess risk by taking advantage from early warning systems, knowledge centers and risk management laboratories [63]. Despite numerous efforts, disaster preparedness has remained moderate in all clusters.
In total, climate change creates additional stresses on land, exacerbating existing risks to livelihoods, biodiversity, human and ecosystem health, infrastructure, and food systems [38]. The challenges for vulnerability research are to develop robust and credible measures, to incorporate methods to incorporate governance research on the mechanisms that mediate vulnerability and promote adaptive action and resilience [64].
The level of risk posed by climate change depends both on the level of warming and on how population, consumption, production, technological development, and land management patterns evolve. Pathways with higher demand for food, feed, and water, more resource intensive consumption and production, and more limited technological improvements in agriculture yields result in higher risks from water scarcity in dry lands, land degradation, and food insecurity [38]. A wide range of adaptation and mitigation responses, throughout the food system, from production to consumption, including food loss and waste, can be deployed and scaled up. From a comprehensive review of the solution space in the field of climate change mitigation, it can be said that mitigation will be just one of the important goals for decision makers. Decision-makers may seek a broader concept of welfare, for example involving the distribution of limited resources within and across countries, as well as between generations [65].
5. Conclusions
Based on the literature, MENA countries had identified by poor food and water resources and inadequate capacity of adaptation. As such, they are highly vulnerable to climate change. On the other hand, the food and water demand of the MENA countries is projected to increase drastically due to their rapid population growth and high urbanization. Population growth accompanied by climate change can lead to ecosystem degradation and increase in nutritional requirements in the context of relatively inappropriate infrastructures. Additionally, oil-based economy and low contribution of non-oil exports, along with political crises, cannot be ignored in the region. Another feature of this region is violence and political instability. Invasions of Israel to Lebanon, Israel–Palestine crisis, Arabian spring rebellions in Tunisia, Libya and Egypt, and the presence of ISIS in the region (particularly in Iraq and Syria) are some of the exogenous factors that affect vulnerability of the MENA countries. Moreover, considerable climatic events take place in this region. In general, climate change can influence this region in many ways. In order to understand the impacts of climate change, the MENA countries were classified into four clusters. The findings revealed that there are significant differences between the MENA countries on the basis of their water, food, human habitat, ecosystem services, health and infrastructure measures. Consequently, any adaptation and mitigation plan should concern the intrinsic differences of the MENA countries and one-size-fits-all intervention strategies might not be as effective as expected. The results also indicated that the highest level of vulnerability refers to Yemen and Djibouti, followed by Syria, Oman, Iraq and Libya. In addition, investigation of the six vulnerability indices revealed that the MENA countries have an acceptable status regarding the infrastructure and habitat measures, a tolerable status in the field of the health and ecosystem measures, and an inappropriate status about the water and food measures. Waha et al. (2017) confirmed these findings and mentioned that MENA region could be heavily challenged by both rising food and water demand given its projected increase in population that may double by 2070. The regions already substantial import dependency could increase and thus so would its vulnerability to agricultural impacts well beyond its country borders.
The inappropriate status of food in the MENA region can be attributed to the fact that MENA is not self-sufficient in food production and many MENA countries are highly sensitive to volatile food prices on the global market. Furthermore, it is expected that this region will remain increasingly dependent on international commodity markets for food supply due to its rapid population growth and inadequate domestic production. As an overall conclusion, it can be claimed that the MENA countries should confront the climate change crisis differently by considering their different capacities, resources and infrastructures. In addition, there is no single strategy that can be proposed for mitigation of the climate change crisis in MENA. In other words, various variables have deterministic roles in vulnerability of the MENA countries to climate change and the interaction of these variables should be considered to reduce vulnerability.
Supplementary Materials
The following are available online at https://0-www-mdpi-com.brum.beds.ac.uk/article/10.3390/ijgi10110794/s1, Table S1: ND-GAIN Indicators Reference Points.
Author Contributions
Conceptualization, Razieh Namdar, Ezatollah Karami and Marzieh Keshavarz; Methodology, Ezatollah Karami and Marzieh Keshavarz; validation, Razieh Namdar, Ezatollah Karami and Marzieh Keshavarz; Formal Analysis, Razieh Namdar and Marzieh Keshavarz; investigation, Razieh Namdar and Ezatollah Karami; resources, Razieh Namdar and Marzieh Keshavarz; data curation, Ezatollah Karami and Marzieh Keshavarz; writing–original draft preparation, Razieh Namdar and Marzieh Keshavarz; visualization, Razieh Namdar; supervision, Ezatollah Karami. All authors have read and agreed to the published version of the manuscript.
Funding
This research received no external funding.
Acknowledgments
Thanks a lot to Associate professor of Shiraz University, Department of Water Engineering, Amin Shirvani for his invaluable cooperation.
Conflicts of Interest
The authors declare no conflict of interest.
References
- Lingl, P.; Carlson, D. Doing Business in a New Climate: A Guide to Measuring, Reducing and Offsetting Greenhouse Gas Emissions; David Suzuki Foundation Routledge: New York, NY, USA, 2010; pp. 1–96. [Google Scholar]
- Syngenta Crop Protection AG Corporate Affairs. The Syngenta Word Mark, Bringing Plant Potential to Life and the PURPOSE ICON; Trademarks Indicated by TM or ® Are the Property of a Syngenta Group Company; Syngenta Crop Protection AG Corporate Affairs: Basel, Switzerland, 2014; Available online: https://studylib.net/doc/8659081/our-industry (accessed on 15 October 2018).
- AGree. Available online: http://www.foodandagpolicy.org/sites/default/files/Facing_the_Future_0.pdf (accessed on 22 December 2018).
- Karami, E. Climate change, resilience and poverty in the developing world. In Proceedings of the Culture, Politics, and Climate Change Conference, Boulder, CO, USA, 13–15 September 2012. [Google Scholar]
- Hewitson, B.; Janetos, A.C.; Carter, T.R.; Giorgi, F.; Jones, R.G.; Kwon, W.T.; Mearns, L.O.; Schipper, E.L.F.; van Aalst, M. Regional context. In Climate Change 2014: Impacts, Adaptation, and Vulnerability. Part B: Regional Aspects; Barros, V.R., Field, C.B., Dokken, D.J., Mastrandrea, M.D., Mach, K.J., Bilir, T.E., Chatterjee, M., Ebi, K.L., Estrada, Y.O., Genova, R.C., et al., Eds.; Cambridge University Press: Cambridge, UK; New York, NY, USA, 2014; pp. 1133–1197. [Google Scholar]
- Michel, D.; Pandya, A.; Hasnain, S.I.; Sticklor, R.; Panuganti, S. Water Challenges and Cooperative Response in the Middle East and North Africa; The Brookings Project on U.S. Relations with the Islamic World 2012 U.S.-Islamic World Forum Papers; Brookings: Washington, DC, USA, 2012; 44p, Available online: http://www.brookings.edu/about/projects/islamic-world (accessed on 22 December 2018).
- KC, B.; Shepherd, J.M.; Gaither, C.J. Climate change vulnerability assessment in Georgia. Appl. Geogr. 2015, 62, 62–74. [Google Scholar] [CrossRef]
- Smit, B.; Wandel, J. Adaptation, adaptive capacity and vulnerability. Glob. Environ. Chang. 2009, 16, 282–292. [Google Scholar] [CrossRef]
- Zarafshani, K.; Zamani, G.; Gorgievski-Duijvesteijn, M.J. Perceptions and psychological coping strategies of farmers toward drought: Implications for extension professionals. J. Ext. Syst. 2005, 1, 58–71. [Google Scholar]
- Sakmar, S.L.; Wackernagel, M.; Galli, A.; Moore, D. Sustainable development and environmental challenges in the MENA region: Accounting for the environment in the 21st century. Econ. Res. Forum 2011, 592, 1–47. [Google Scholar]
- Tang, C.F.; Abosedra, S. The impacts of tourism, energy consumption and political instability on economic growth in the MENA countries. Energy Policy 2014, 68, 458–464. [Google Scholar] [CrossRef]
- World Bank. Available online: http://web.worldbank.org/archive/website01418/WEB/0__CO-46.HTM (accessed on 17 March 2018).
- Jobbins, G.; Henley, G. Food in an Uncertain Future: The Impacts of Climate Change on Food Security and Nutrition in the Middle East and North Africa; Overseas Development Institute: London, UK; World Food Programme: Rome, Italy, 2015; Available online: https://documents.wfp.org/stellent/groups/public/documents/communications/wfp279986.pdf (accessed on 25 November 2017).
- Zafar, S. Water Scarcity in MENA. 2014. Available online: http://www.ecomena.org/water-scarcity-in-mena/ (accessed on 23 October 2017).
- World Bank. Available online: https://openknowledge.worldbank.org/handle/10986/27659 (accessed on 1 April 2018).
- Fouda, M.; Salama, A. Climate Change & Biodiversity in Africa and MENA Region. 2017. Available online: http://www.eeaa.gov.eg/portals/0/eeaaReports/lecb/Training5/Day4/day4-ppt/1-%20Prof.%20Fouda%201.pdf (accessed on 9 October 2018).
- World Bank. Available online: http://web.worldbank.org/archive/website01418/WEB/0__CO-51.HTM (accessed on 17 March 2018).
- UNDP. Available online: http://hdr.undp.org/en/content/water-scarcity-challenges-middle-east-and-north-africa-mena (accessed on 12 March 2019).
- Climate Change Adaptation in the Middle East and North Africa: Challenges and Opportunities. Available online: https://www.belfercenter.org/sites/default/files/legacy/files/Sowers-Weinthal%20%20DI%20Working%20Paper%202.PDF (accessed on 16 July 2020).
- Terink, W.; Immerzeel, W.W.; Droogers, P. Climate change projections of precipitation and reference evapotranspiration for the Middle East and Northern Africa until 2050. Int. J. Climatol. 2013, 33, 3055–3072. [Google Scholar] [CrossRef]
- Zyadin, A. Water shortage in MENA region: An interdisciplinary overview and a suite of practical solutions. J. Water Resour. Prot. 2013, 5, 49–58. [Google Scholar] [CrossRef] [Green Version]
- Parry, M.L.; Canziani, O.F.; Palutikof, J.P. Technical Summary. In Climate Change 2007: Impacts, Adaptation and Vulnerability; Parry, M.L., Canziani, O.F., Palutikof, J.P., Van der Linden, P.J., Hanson, C.E., Eds.; Cambridge University Press: Cambridge, UK, 2007; pp. 23–78. [Google Scholar]
- Ding, Q.; Chen, X.; Hilborn, R.; Chen, Y. Vulnerability to impacts of climate change on marine fisheries and food security. Mar. Policy 2017, 83, 55–61. [Google Scholar] [CrossRef]
- Hashemi, S.M.; Bagheri, A.; Marshall, N. Toward sustainable adaptation to future climate change: Insights from vulnerability and resilience approaches analyzing agrarian system of Iran. Environ. Dev. Sustain. 2015, 19, 1–25. [Google Scholar] [CrossRef]
- Al-Saidia, M.; Birnbauma, D.; Buritia, R.; Dieka, E.; Hasselbringa, C.; Jimeneza, A.; Woinowskia, D. Water resources vulnerability assessment of MENA countries considering energy and virtual water interactions. Procedia Eng. 2016, 145, 900–907. [Google Scholar] [CrossRef] [Green Version]
- University of Notre Dame Global Adaptation Index, Country index Technical Report. Available online: http://index.gain.org/about/reference (accessed on 11 February 2018).
- Fawcett, D.; Pearce, T.; Ford, J.D.; Archer, L. Operationalizing longitudinal approaches to climate change vulnerability assessment. Glob. Environ. Chang. 2017, 45, 79–88. [Google Scholar] [CrossRef]
- Hill, R.V.; Porter, C. Vulnerability to drought and food price shocks: Evidence from Ethiopia. World Dev. 2017, 96, 65–77. [Google Scholar] [CrossRef] [Green Version]
- Hutton, C.W.; Kienberger, S.; Amoako Johnson, F.; Allan, A.; Giannini, V.; Allen, R. Vulnerability to climate change: People, place and exposure to hazard. Adv. Sci. Res. 2011, 7, 37–45. [Google Scholar] [CrossRef] [Green Version]
- Karimi, V.; Karami, E.; Keshavarz, M. Vulnerability and adaptation of Iranian livestock producers to climate variability and change. Rangel. Ecol. Manag. 2018, 71, 175–184. [Google Scholar] [CrossRef]
- Paloviita, A.; Kortetmaki, T.; Puupponen, A.; Silvasti, T. Vulnerability matrix of the food system: Operationalizing vulnerability and addressing food security. J. Clean. Prod. 2016, 135, 1242–1255. [Google Scholar] [CrossRef] [Green Version]
- Shabbir, R.; Saeed Ahmad, S. Water resource vulnerability assessment in Rawalpindi and Islamabad, Pakistan using Analytic Hierarchy Process (AHP). J. King Saud Univ. Sci. 2016, 28, 293–299. [Google Scholar] [CrossRef] [Green Version]
- Sisto, N.P.; Ramírez, A.I.; Aguilar-Barajas, I.; Magana-Rueda, V. Climate threats, water supply vulnerability and the risk of a water crisis in the Monterrey Metropolitan area (Northeastern Mexico). Phys. Chem. Earth 2016, 91, 2–9. [Google Scholar] [CrossRef] [Green Version]
- Thornton, P.K.; van de Steeg, J.; Notenbaert, A.; Herrero, M. The impacts of climate change on livestock and livestock systems in developing countries: A review of what we know and what we need to know. Agric. Syst. 2009, 101, 113–127. [Google Scholar] [CrossRef]
- Wiebelt, M.; Breisinger, C.; Ecker, O.; Al-Riffai, P.; Robertson, R.; Thiele, R. Compounding food and income insecurity in Yemen: Challenges from climate change. Food Policy 2013, 43, 77–89. [Google Scholar] [CrossRef]
- Milenkovic, N.; Vukmirovic, J.; Bulajic, M.; Radojicic, Z. A multivariate approach in measuring socio-economic development of MENA countries. Econ. Model. 2014, 38, 604–608. [Google Scholar] [CrossRef] [Green Version]
- IPCC. Summary for Policymakers. In Climate Change and Land: An IPCC Special Report on Climate Change, Desertifcation, Land Degradation, Sustainable Land Management, Food Security, and Greenhouse Gas fluxes in Terrestrial Ecosystems; Shukla, P.R., Skea, J., Buendia, E.C., Masson-Delmotte, V., Pörtner, H.-O., Roberts, D.C., Zhai, P., Slade, R., Connors, S., van Diemen, R., Eds.; IPCC: Geneva, Switzerland, 2019; in press. [Google Scholar]
- Pirani, S.I.; Arafat, H.A. Interplay of food security, agriculture and tourism within GCC countries. Glob. Food Secur. 2016, 9, 1–9. [Google Scholar] [CrossRef]
- Katkhuda, N. Food Security in the Middle East. 2017. Available online: https://www.ecomena.org/food-middle-east (accessed on 11 February 2019).
- FAO. Available online: http://www.fao.org/3/a-i4644e.pdf (accessed on 17 April 2018).
- Wright, B.; Cafiero, C. Grain reserves and food security in the Middle East and North Africa. Food Sec. 2011, 3, S61–S76. [Google Scholar] [CrossRef] [Green Version]
- Waha, K.; Krummenauer, L.; Adams, S.; Aich, V.; Baarsch, F.; Coumou, D.; Fader, M.; Hoff, H.; Jobbins, G.; Marcus, R.; et al. Climate change impacts in the Middle East and Northern Africa (MENA) region and their implications for vulnerable population groups. Reg. Environ. Chang. 2017, 17, 1623–1638. [Google Scholar] [CrossRef]
- Oki, T.; Kanae, S. Global hydrological cycles and world water resources. Science 2006, 313, 1072. [Google Scholar] [CrossRef] [Green Version]
- Arab Environment: Future Challenges. Available online: http://www.afedonline.org (accessed on 12 March 2019).
- Mileham, L.; Taylor, R.G.; Todd, M.; Tindimugaya, C.; Thompson, J. The impact of climate change on groundwater recharge and runoff in a humid, equatorial catchment: Sensitivity of projections to rainfall intensity. Hydrol. Sci. J. 2009, 54, 727–738. [Google Scholar] [CrossRef] [Green Version]
- IPCC. Climate Change 2014: Synthesis Report; Contribution of Working Groups I, II and III to the Fifth Assessment Report of the Intergovernmental Panel on Climate Change; Core Writing Team, Pachauri, R.K., Meyer, L.A., Eds.; IPCC: Geneva, Switzerland, 2014; p. 151. [Google Scholar]
- Forouzani, M.; Karami, E.; Zamani, G.; Rezaei Moghaddam, K. Agricultural water poverty: Using Q-methodology to understand stakeholders’ perceptions. J. Arid Environ. 2013, 97, 190–204. [Google Scholar] [CrossRef]
- World Bank. Available online: http://www.worldbank.org/en/news/feature/2014/11/24/future-impact-of-climate-change-visible-now-in-yemen (accessed on 1 April 2018).
- World Bank. Available online: http://www.worldbank.org/en/news/feature/2014/03/20/floods-and-droughts-in-mena (accessed on 1 April 2018).
- World Bank. Available online: http://go.worldbank.org/VU5JBJZ3Y0 (accessed on 17 March 2018).
- Choueiri, E.M.; Choueiri, G.M.; Choueiri, B.M. An overview of the transport sector and road safety in the MENA region. Adv. Transp. Stud. 2013, 30, 43–56. [Google Scholar]
- 2018 Environmental Performance Index. Available online: https://epi.yale.edu/ (accessed on 7 November 2018).
- Cheung, W.W.L.; Lam, V.W.Y.; Sarmiento, J.L.; Kearney, K.; Watson, R.; Pauly, D. Projecting global marine biodiversity impacts under climate change scenarios. Fish Fish. 2009, 10, 235–251. [Google Scholar] [CrossRef]
- Gonzalez, P.; Neilson, R.P.; Lenihan, J.M.; Drapek, R.J. Global patterns in the vulnerability of ecosystems to vegetation shifts due to climate change. Glob. Ecol. Biogeogr. 2010, 19, 755–768. [Google Scholar] [CrossRef]
- Krupp, F.; Al-Jumaily, M.; Bariche, M.; Khalaf, M.; Malek, M.; Streit, B. The Middle Eastern biodiversity network: Generating and sharing knowledge for ecosystem management and conservation. ZooKeys 2009, 31, 3–15. [Google Scholar] [CrossRef]
- Croitoru, L.; Liagre, L. Contribution of forests to a green economy in the Middle East and North Africa. Forêt Méditerr. 2013, 4, 291–298. [Google Scholar]
- AhmadAlipour, A.; Moradkhani, H. Escalating heat-stress mortality risk due to global warming in the Middle East and North Africa (MENA). Environ. Int. 2018, 117, 215–225. [Google Scholar] [CrossRef]
- Khan, S.A.R.; Zaman, K.; Zhang, Y. The relationship between energy-resource depletion, climate change, health resources and the environmental Kuznets curve: Evidence from the panel of selected developed countries. Renew. Sustain. Energy Rev. 2016, 62, 468–477. [Google Scholar] [CrossRef]
- World Bank. Available online: https://data.worldbank.org/indicator/EN.POP.SLUM.UR.ZS?locations=YE&view=chartc (accessed on 10 September 2019).
- World Bank. Available online: https://data.worldbank.org/indicator/SH.STA.ACSN.UR (accessed on 1 September 2018).
- World Bank. Available online: https://core.ac.uk/download/pdf/6305215.pdf (accessed on 12 March 2018).
- El-Katiri, L. The energy poverty nexus in the Middle East and North Africa. OPEC Energy Rev. 2014, 38, 296–322. [Google Scholar] [CrossRef]
- World Bank. Available online: https://openknowledge.worldbank.org/handle/10986/17829 (accessed on 1 April 2018).
- Adger, W.N. Vulnerability. Glob. Environ. Chang. 2006, 16, 268–281. [Google Scholar] [CrossRef]
- IPCC. Climate Change 2014: Mitigation of Climate Change; Contribution of Working Group III to the Fifth Assessment Report of the Intergovernmental Panel on Climate Change; Edenhofer, O.R., Pichs-Madruga, Y., Sokona, E., Farahani, S., Kadner, K., Seyboth, A., Adler, I., Baum, S., Brunner, P., Eickemeier, B., et al., Eds.; Cambridge University Press: Cambridge, UK; New York, NY, USA, 2014; p. 1454. [Google Scholar]
Figure 1.
Flowchart of the variables of the study.

Figure 2.
Vulnerability of Middle East and North Africa (MENA) countries to climate change.

Figure 3.
MENA vulnerability map.


Table 1.
Vulnerability Indicators.
| Sector | Indicators | Description |
|---|---|---|
| Food | E1: Projected change of cereal yields | Projected amount that climate change is expected to change food supply by mid-century for three staples: rice, wheat and maize |
| E2: Projected population change | An indication of food demand by the mid-century | |
| S1: Food import dependency | Proportion of cereal consumption obtained from imports | |
| S2: Rural Population | People living in the rural regions of a country | |
| A1: Agriculture capacity | A combination of four indicators of agricultural technology: capacity to equip agriculture areas with irrigation, N+P205 total fertilizer use on arable and permanent use of crop area, pesticide and tractor | |
| A2: Child malnutrition | The percent of children under 5 years old with a low weight for height ratio | |
| Water | E1: Projected change of annual runoff | The percent decrease or increase in annual runoffs by mid-century |
| E2: Projected change of annual groundwater recharge | The percent decrease or increase in annual groundwater resources by mid-century | |
| S1: Fresh water withdrawal rate | The proportion of total actual renewable water resources that is withdrawn in a specific year | |
| S2: Water dependency ratio | The proportion of the total renewable water resources originated outside the country | |
| A1: Dam capacity | The per capita dam storage capacities within one country to adjust to the changing (temporal and geographical) distribution of freshwater resources | |
| A2: Access to reliable drinking water | The capacity to deliver reliable domestic water supplies | |
| Health | E1: Projected change of deaths from climate change induced diseases | The climate change impacts on several types of diseases |
| E2: Projected change of length of transmission season of vector-borne diseases | The projection of malaria LTS as an indication of the climate change impacts on vector-borne diseases | |
| S1: Dependency on external resource for health services | The percentage of external resources (e.g., bilateral payments, NGO operations etc.) in total national health expenditure | |
| S2: Slum population | Group of individuals living under the same roof lacking one or more of life-supporting facilities: access to improved water or sanitation, sufficient-living area, or durability of housing | |
| A1: Medical staffs | Sum of the number of physicians, nurses and midwives per 1000 population in the country | |
| A2: Access to improved sanitation facilities | Proportion of the population with access to excreta disposal facilities that can effectively prevent human, animal, and insect contact with excreta | |
| Ecosystem services | E1: Projected change of biome distribution | The projected change of terrestrial biome biodiversity within a country by the end of the century |
| E2: Projected change of marine biodiversity | The projected change of marine biodiversity in a country’s exclusive economic zones by mid-century | |
| S1: Natural capital dependency | The dependency of social systems on ecosystem goods and services | |
| S2: Ecological footprint | The number of hectares of land and water that are needed to meet the average demand on ecosystem services by the population’s lifestyle | |
| A1: Protected biomes | The degree to which a country achieves the target of protecting 17% of each terrestrial biome within its borders | |
| A2: Engagement in International environmental conventions | The country’s participation in international forums | |
| Human habitat | E1: Projected change of warm periods | The probability of extreme heat under climate change by mid-century |
| E2: Projected change of flood hazard | The predicted, monthly maximum precipitation in 5 consecutive days | |
| S1: Urban concentration | Concentration of a population within cities and concentration of the urban population within a small number of large population (cities of 750,000 inhabitants or more) centers | |
| S2: Age dependency ratio | The size of the vulnerable population (under 14 or above 65 years old) | |
| A1: Quality of trade and transport infrastructure | Country’s quality of trade and transport related infrastructure (e.g., ports, railroads, roads and information technology) | |
| A2: Paved roads | Proportion of the total length of the roads that are paved | |
| Infrastructure | E1: Projected change of hydropower generation capacity | The proportion of the electricity production from hydroelectric sources |
| E2: Projection of sea level rise impacts | The proportion of land areas, adjacent to the ocean, that are lower than the projected sea level rise and the average height of storm surge | |
| S1: Dependency on imported energy | The percentage of total energy use that is imported and thus not fully within a country’s control | |
| S2: Population living under 5 m above sea level | The proportion of the population living in the area where elevation is 5 m or less | |
| A1: Electricity access | The proportion of the population with access to grid-power | |
| A2: Disaster preparedness | The capacity to deal with climate-related nature disasters |
“E”, “S”, and “A” stand for “exposure”, “sensitivity”, and “adaptive capacity”, respectively.
Table 2.
Vulnerability classes by vulnerability sectors.
| Vulnerability | Vulnerability Class | |||
|---|---|---|---|---|
| Low 1 | Medium 2 | High 3 | Very High 4 | |
| Overall vulnerability | 0.372 | 0.411 | 0.453 | 0.614 |
| Food vulnerability | 0.357 | 0.522 | 0.587 | 0.757 |
| Water vulnerability | 0.709 | 0.651 | 0.712 | 0.649 |
| Human habitat vulnerability | 0.121 | 0.249 | 0.244 | 0.590 |
| Ecosystem services vulnerability | 0.365 | 0.454 | 0.620 | 0.647 |
| Health vulnerability | 0.381 | 0.340 | 0.416 | 0.667 |
| Infrastructure vulnerability | 0.299 | 0.251 | 0.140 | 0.373 |
1 Bahrain, Kuwait, Malta, Qatar and Israel. 2 Tunisia, Saudi Arabia, Morocco, Lebanon, Jordan, Iran, Emirates, Egypt and Algeria. 3 Syria, Oman, Iraq and Libyan. 4 Djibouti and Yemen.
Table 3.
Climate change vulnerability classes by food sector vulnerability indicators.
| Food Sector 1 | Vulnerability 2,3 | F | Sig. | |||
|---|---|---|---|---|---|---|
| Low | Medium | High | Very High | |||
| E: Projected change of cereal yields | 0.355 d | 0.692 b | 0.654 a | 0.569 c | 160.54 | 0.0001 |
| E: Projected population change | 0.555 b | 0.529 b | 0.731 a | 0.632 c | 24.890 | 0.0001 |
| S: Food import dependency | 0.914 c | 0.678 b | 0.792 a | 0.895 c | 34.921 | 0.0001 |
| S: Rural population | 0.073 c | 0.311 a | 0.342 a | 0.508 b | 102.55 | 0.0001 |
| A: Agriculture capacity | 0.862 d | 0.451 b | 0.362 a | 0.052 c | 135.23 | 0.0001 |
| A: Child malnutrition | 0.299 d | 0.401 b | 0.491 a | 0.988 c | 179.87 | 0.0001 |
1 E: exposure; S: sensitivity; and A: adaptive capacity. 2 Low scores of exposure and sensitivity and high score of adaptive capacity reflect low vulnerability. 3 In each row, means followed by the dissimilar letters differ significantly (α = 0.05, LSD).
Table 4.
Climate change vulnerability classes by water sector vulnerability indicators.
| Water sector 1 | Vulnerability 2,3 | F | Sig. | |||
|---|---|---|---|---|---|---|
| Low | Medium | High | Very High | |||
| E: Projected change of annual runoff | 0.991 a | 0.902 b | 0.938 ab | 1.000 a | 6.22 | 0.0001 |
| E: Projected change of groundwater recharge | 0.938 bc | 0.940 b | 0.917 c | 1.000 a | 11.85 | 0.0001 |
| S: Fresh water withdrawal rate | 0.862 a | 0.735 b | 0.865 a | 0.531 d | 21.33 | 0.0001 |
| S: Water dependency ratio | 0.599 a | 0.193 c | 0.460 b | 0.000 d | 39.88 | 0.0001 |
| A: Access to reliable drinking water | 0.889 b | 0.925 b | 0.709 a | 0.892 b | 19.50 | 0.0001 |
| A: Dam capacity | 0.009 a | 0.145 b | 0.383 c | 0.626 d | 199.72 | 0.0001 |
1 E: exposure; S: sensitivity; and A: adaptive capacity. 2 Low scores of exposure and sensitivity and high score of adaptive capacity reflect low vulnerability. 3 In each row, means followed by the dissimilar letters differ significantly (α = 0.05, LSD).
Table 5.
Correlation between water vulnerability and other sectors’ vulnerabilities.
| Vulnerability | Correlation | Sig. |
|---|---|---|
| Overall vulnerability | 0.137 | 0.005 |
| Food vulnerability | 0.065 | 0.183 |
| Habitat vulnerability | 0.007 | 0.893 |
| Ecosystem vulnerability | 0.015 | 0.763 |
| Health vulnerability | 0.199 | 0.000 |
| Infrastructure vulnerability | 0. 147 | 0.003 |
Table 6.
Climate change vulnerability classes by human habitat sector vulnerability indicators.
| Human Habitat Sector 1 | Vulnerability 2,3 | |||||
|---|---|---|---|---|---|---|
| Low | Medium | High | Very High | F | Sig. | |
| E: Projected change of warm period | 0.626 a | 0.363 b | 0.351 b | 0.844 c | 86.42 | 0.001 |
| E: Projected change of flood hazards | 0.377 a | 0.127 b | 0.214 c | 0.586 d | 104.11 | 0.001 |
| S: Urban concentration | 0.494 a | 0.419 b | 0.331 c | 0.241 c | 12.37 | 0.001 |
| S: Age dependency ratio | 0.161 a | 0.281 b | 0.457 c | 0.660 d | 79.50 | 0.001 |
| A: Quality of trade and transport infrastructure | 0.514 a | 0.409 b | 0.306 c | 0.259 d | 77.27 | 0.001 |
| A: Paved roads | 0.886 a | 0.749 b | 0.620 c | 0.269 d | 116.55 | 0.001 |
1 E: exposure; S: sensitivity; and A: adaptive capacity. 2 Low scores of exposure and sensitivity and high score of adaptive capacity reflect low vulnerability. 3 In each row, means followed by the dissimilar letters differ significantly (α = 0.05, LSD).
Table 7.
Climate change vulnerability classes by ecosystem services sector vulnerability indicators.
Table 7.
Climate change vulnerability classes by ecosystem services sector vulnerability indicators.
| Ecosystem Services Sector 1 | Vulnerability 2,3 | |||||
|---|---|---|---|---|---|---|
| Low | Medium | High | Very High | F | Sig. | |
| E: Projected change of biome distribution | 0.478 a | 0.516 b | 0.600 c | 0.629 d | 77.8 | 0.001 |
| E: Projected change of marine biodiversity | 0.370 a | 0.379 a | 0.552 b | 0.366 a | 30.7 | 0.001 |
| S: Dependency on natural capital | 0.029 a | 0.132 b | 0.137 b | 0.100 c | 39.7 | 0.001 |
| S: Ecological footprint | 0.105 a | 0.328 b | 0.302 b | 0.430 c | 92.3 | 0.001 |
| A: Protected biomes | 0.493 a | 0.397 b | 0.048 c | 0.022 c | 51.9 | 0.001 |
| A: Engagement in international environmental conventions | 0.275 a | 0.310 b | 0.106 c | 0.167 d | 54.4 | 0.001 |
1 E: exposure; S: sensitivity; and A: adaptive capacity. 2 Low scores of exposure and sensitivity and high score of adaptive capacity reflect low vulnerability. 3 In each row, means followed by the dissimilar letters differ significantly (α = 0.05, LSD).
Table 8.
Climate change vulnerability classes by health sector vulnerability indicators.
| Health Sector 1 | Vulnerability 2,3 | F | Sig. | |||
|---|---|---|---|---|---|---|
| Low | Medium | High | Very High | |||
| E: Projected change of deaths from climate change | 0.130 a | 0.319 b | 0.325 c | 0.666 d | 109.01 | 0.001 |
| S: Slum population | 0.027 a | 0.031 b | 0.031 b | 0.431 c | 119.21 | 0.001 |
| S: Dependency on external resource for health service | 0.372 a | 0.303 b | 0.292 b | 0.687 c | 64.70 | 0.001 |
| A: Medical staffs | 0.660 a | 0.346 b | 0.356 b | 0.072 c | 134.73 | 0.001 |
| A: Access to improved sanitation facilities | 0.994 a | 0.855 b | 0.876 b | 0.386 c | 372.76 | 0.001 |
1 E: exposure; S: sensitivity; and A: adaptive capacity. 2 Low scores of exposure and sensitivity and high score of adaptive capacity reflect low vulnerability. 3 In each row, means followed by the dissimilar letters differ significantly (α = 0.05, LSD).
Table 9.
Climate change vulnerability classes by infrastructure sector vulnerability indicators.
| Infrastructure Sector 1 | Vulnerability 2,3 | F | Sig. | |||
|---|---|---|---|---|---|---|
| Low | Medium | High | Very High | |||
| E: Projected change of hydropower generation capacity | 0.436 c | 0.444 b | 0.456 a | 0.439 c | 76.18 | 0.0001 |
| E: Projection of sea level rise impacts | 0.090 a | 0.011 b | 0.007 b | 0.005 b | 73.14 | 0.0001 |
| S: Dependency on imported energy | 0.434 a | 0.304 b | 0.015 b | 0.000 b | 26.58 | 0.0001 |
| S: Population living under 5 m above sea level | 0.463 a | 0. 288 b | 0.184 c | 0.289 b | 14.93 | 0.0001 |
| A: Disaster preparedness | 0.499 b | 0.499 b | 0.527 a | 0.350 c | 38.40 | 0.0001 |
1 E: exposure; S: sensitivity; and A: adaptive capacity. 2 Low scores of exposure and sensitivity and high score of adaptive capacity reflect low vulnerability. 3 In each row, means followed by the dissimilar letters differ significantly (α = 0.05, LSD).
Publisher’s Note: MDPI stays neutral with regard to jurisdictional claims in published maps and institutional affiliations. |
© 2021 by the authors. Licensee MDPI, Basel, Switzerland. This article is an open access article distributed under the terms and conditions of the Creative Commons Attribution (CC BY) license (http://creativecommons.org/licenses/by/4.0/).
Share and Cite
MDPI and ACS Style
Namdar, R.; Karami, E.; Keshavarz, M. Climate Change and Vulnerability: The Case of MENA Countries. ISPRS Int. J. Geo-Inf. 2021, 10, 794. https://0-doi-org.brum.beds.ac.uk/10.3390/ijgi10110794
AMA Style
Namdar R, Karami E, Keshavarz M. Climate Change and Vulnerability: The Case of MENA Countries. ISPRS International Journal of Geo-Information. 2021; 10(11):794. https://0-doi-org.brum.beds.ac.uk/10.3390/ijgi10110794
Chicago/Turabian StyleNamdar, Razieh, Ezatollah Karami, and Marzieh Keshavarz. 2021. "Climate Change and Vulnerability: The Case of MENA Countries" ISPRS International Journal of Geo-Information 10, no. 11: 794. https://0-doi-org.brum.beds.ac.uk/10.3390/ijgi10110794
Note that from the first issue of 2016, this journal uses article numbers instead of page numbers. See further details here.