Article

Deducing Flood Development Process Using Social Media: An Event-Based and Multi-Level Modeling Approach

1
State Key Laboratory of Information Engineering in Surveying, Mapping and Remote Sensing (LIESMARS), Wuhan University, Wuhan 430079, China
2
Hubei Luojia Laboratory, Wuhan 430079, China
3
Collaborative Innovation Center of Geospatial Technology, Wuhan 430079, China
4
School of Remote Sensing and Information Engineering, Wuhan University, Wuhan 430079, China
*
Author to whom correspondence should be addressed.
ISPRS Int. J. Geo-Inf. 2022, 11(5), 306; https://doi.org/10.3390/ijgi11050306
Submission received: 28 March 2022 / Revised: 3 May 2022 / Accepted: 7 May 2022 / Published: 10 May 2022

Abstract

:
Social media is increasingly being used to obtain timely flood information to assist flood disaster management and situational awareness. However, since data in social media are massive, redundant, and unstructured, it is tricky to intuitively and clearly obtain effective information. To automatically obtain clear flood information and deduce flood development processes from social media, the authors of this paper propose an event-based and multi-level modeling approach including a data model and two methods. Through the hierarchical division of events (division into spatial object, phase, and attribute status), the flood information structure (including time, space, topic, emotion, and disaster condition) is defined. We built an entity construction method and a development process deduction method to achieve the automatic transition from cluttered data to orderly flood development processes. Taking the flooding event of the Yangtze and Huai Rivers in 2020 as an example, we successfully obtained true flood information and development process from social media data, which verified the effectiveness of the model and methods. Meanwhile, spatiotemporal pattern mining was carried out by using entities from different levels. The results showed that the flood was from west to east and the damage level was positively correlated with the number of flood-related social media texts, especially emotional texts. In summary, through the model and methods in this paper, clear flood information and dynamic development processes can be quickly and automatically obtained, and the spatiotemporal patterns of flood entities can be examined. It is beneficial to extract timely flood information and public sentiments towards flood events in order to perform better disaster relief and post-disaster management.

1. Introduction

Floods have caused a large number of casualties and economic losses around the world, posing severe challenges to global sustainable development [1,2,3,4]. East and South Asia are the areas where the majority of people are affected by flood disasters and the economic losses caused by floods rank first among various natural hazards [5,6]. In China, for example, the “7.20” heavy rainstorm event in Zhengzhou, Henan Province in 2021 caused 14.786 million human casualties, with a direct economic loss of 120.06 billion yuan [7]; in July 2020, the severe flood event in the Yangtze and Huai River Basin caused a total of 34.173 million human casualties, with a direct economic loss of 132.2 billion yuan [8].
Currently, due to global climate change, the frequency and magnitude of floods are increasing [9,10], which has led to the need for the further strengthening of the capacity and efficiency of disaster management and situational awareness. In other words, when a flood event occurs, emergency management agencies need to more quickly and effectively determine the situation and impact of the flood event [11]. Therefore, social media is gradually being used to aid disaster management because of its abundant first-hand information and fast retweeting mechanism [12,13]. During flood events, plenty of disaster information, emergency response information, and public opinion information is sent and spread by the public and government through social media [14,15]. Texts with information sent via social media are defined as Flood Public Opinion data (FPO data) in this paper. In addition, FPO data contain rich spatiotemporal information that enriches the semantic information and aids spatiotemporal pattern mining [16]. Consequently, social media has become a new data source to assist flood disaster management and situational awareness, providing first-hand observation data for understanding flood events [17,18,19].
However, while social media provides abundant data, the difficulties of data processing and information extraction have also greatly increased [20]. FPO data are unstructured, scattered and redundant, so a unified data model is required to reasonably organize information [21], improving information utilization and information value. Additionally, the elements of flood events are complex, and floods develop rapidly. Mastering the development patterns and laws of flood events will be beneficial to disaster management. Therefore, building a multi-level and multi-dimensional FPO data model that combines static elements and dynamic development is conducive to extracting disaster development and public opinion information in a timely manner and to providing reliable information support for disaster prevention, mitigation, and relief.
This paper was aimed to answer three questions:
Q1: What kind of data model should be constructed to organize FPO data; furthermore, which elements should be involved in the model and how should the dynamic development of events be expressed?
Q2: How can the development process of flood events from massive FPO data based on the data model be deduced?
Q3: Are there patterns in emotions and topics during floods?
To answer these questions, we first constructed a multi-level and event-based model to organize FPO data. Considering the complexity of flood event development from the different cognitive dimensions of events (event, spatial object, phase, and attribute status), a multi-level FPO data model involving static elements (time, space, topic, emotion, and disaster condition) and dynamic development was constructed.
Then, taking the multi-granularity and automation requirements of the situational awareness of flood events into account, based on the idea of aggregation, a construction method for flood public opinion entities (FPO entities) with variable spatiotemporal scales and a development deduction method for flood events based on the FPO data model were studied.
Finally, we applied and verified the FPO data model and methods based on actual cases to obtain flood development information and conduct spatiotemporal analyses.
Section 2 covers the literature review. In Section 3 and Section 4, we describe the structure of the FPO data model and the methods of constructing FPO entities and deducing flood event development. Section 5 presents a case study in which we applied our model and methods to a real case and conducted analyses. In Section 6, we evaluate our work and discuss opportunities and challenges.

2. Literature Review

The rich and diverse information about floods shared on social media platforms presents a unique opportunity for emergency managers to obtain large-scale spatiotemporal data of enormous value [22,23] and for individuals to take effective actions to reduce disaster losses [24]. However, of the massive amount of FPO data, only a small part is relevant and helpful for situational awareness and disaster emergency management. Therefore, it is crucial to extract necessary relevant information from massive FPO data [11].
Presently, there are sufficient and relatively mature technologies for FPO data acquisition and information extraction during floods. To extract the location information of FPO data, it is common to use rule matching and named entity recognition technology [25,26]. In addition, Bakillah [27] obtained geographic location data by clustering based on semantic similarity. Imran [28,29] built a human-annotated flood tweet corpus and trained it through machine learning to achieve text classification and disaster information extraction. Both text and image data have been used to judge the severity of floods with remarkable results [30,31].
Meanwhile, FPO data provide not only disaster information but also public opinion information including on popular topics and people’s emotions, which are also vital information for disaster management. Relatively mature technologies for the extraction of such information have also been proposed. For topic detection and tracking without predefined topics, researchers usually use LDA, LDA’s variant, BBTM, and so on [32,33,34]. For predefined topics, tasks are viewed as supervised classifications so that relevant machine learning and deep learning methods can be applied [35,36]. For sentiment extraction, there are abundant efficient algorithms and methods including supervised learning and lexicon-based methods [37], and there are integrated toolkits such as Senta and SentiStrength.
The situational awareness of floods is rapidly developing with rich and effective information extraction techniques, and numerous studies have shown that social media can be used as a tool to improve situational awareness during crises [38,39]. Researchers perceive disaster development and the movement patterns of people by analyzing the spatiotemporal characteristics of disaster and public opinion information [20,40]. Research on mapping floods in near-real-time by leveraging FPO data in geospatial processes has also been published [41,42,43].
However, there is no effective data model for the unified management of extracted disaster and public opinion information, which increases the workload of manual analysis required for situational awareness while insufficiently presenting the development process of events. In this regard, we aimed to propose a flood disaster data model and related methods by realizing the automatic generation of FPO data for the process of flood development and public opinion evolution and expressing flood events from multiple dimensions and perspectives.

3. Model

We propose an Event-based Multi-level Model of Flood Public Opinion Data (EMMFPO), which is used to organize the information from scattered FPO data and evaluate flood development. The data model includes two parts: one is static expression that organizes the element information, and the other is dynamic expression that shows the flood development process. In this section, we introduction the ideas of model construction and the structures of these two types of expression in order.

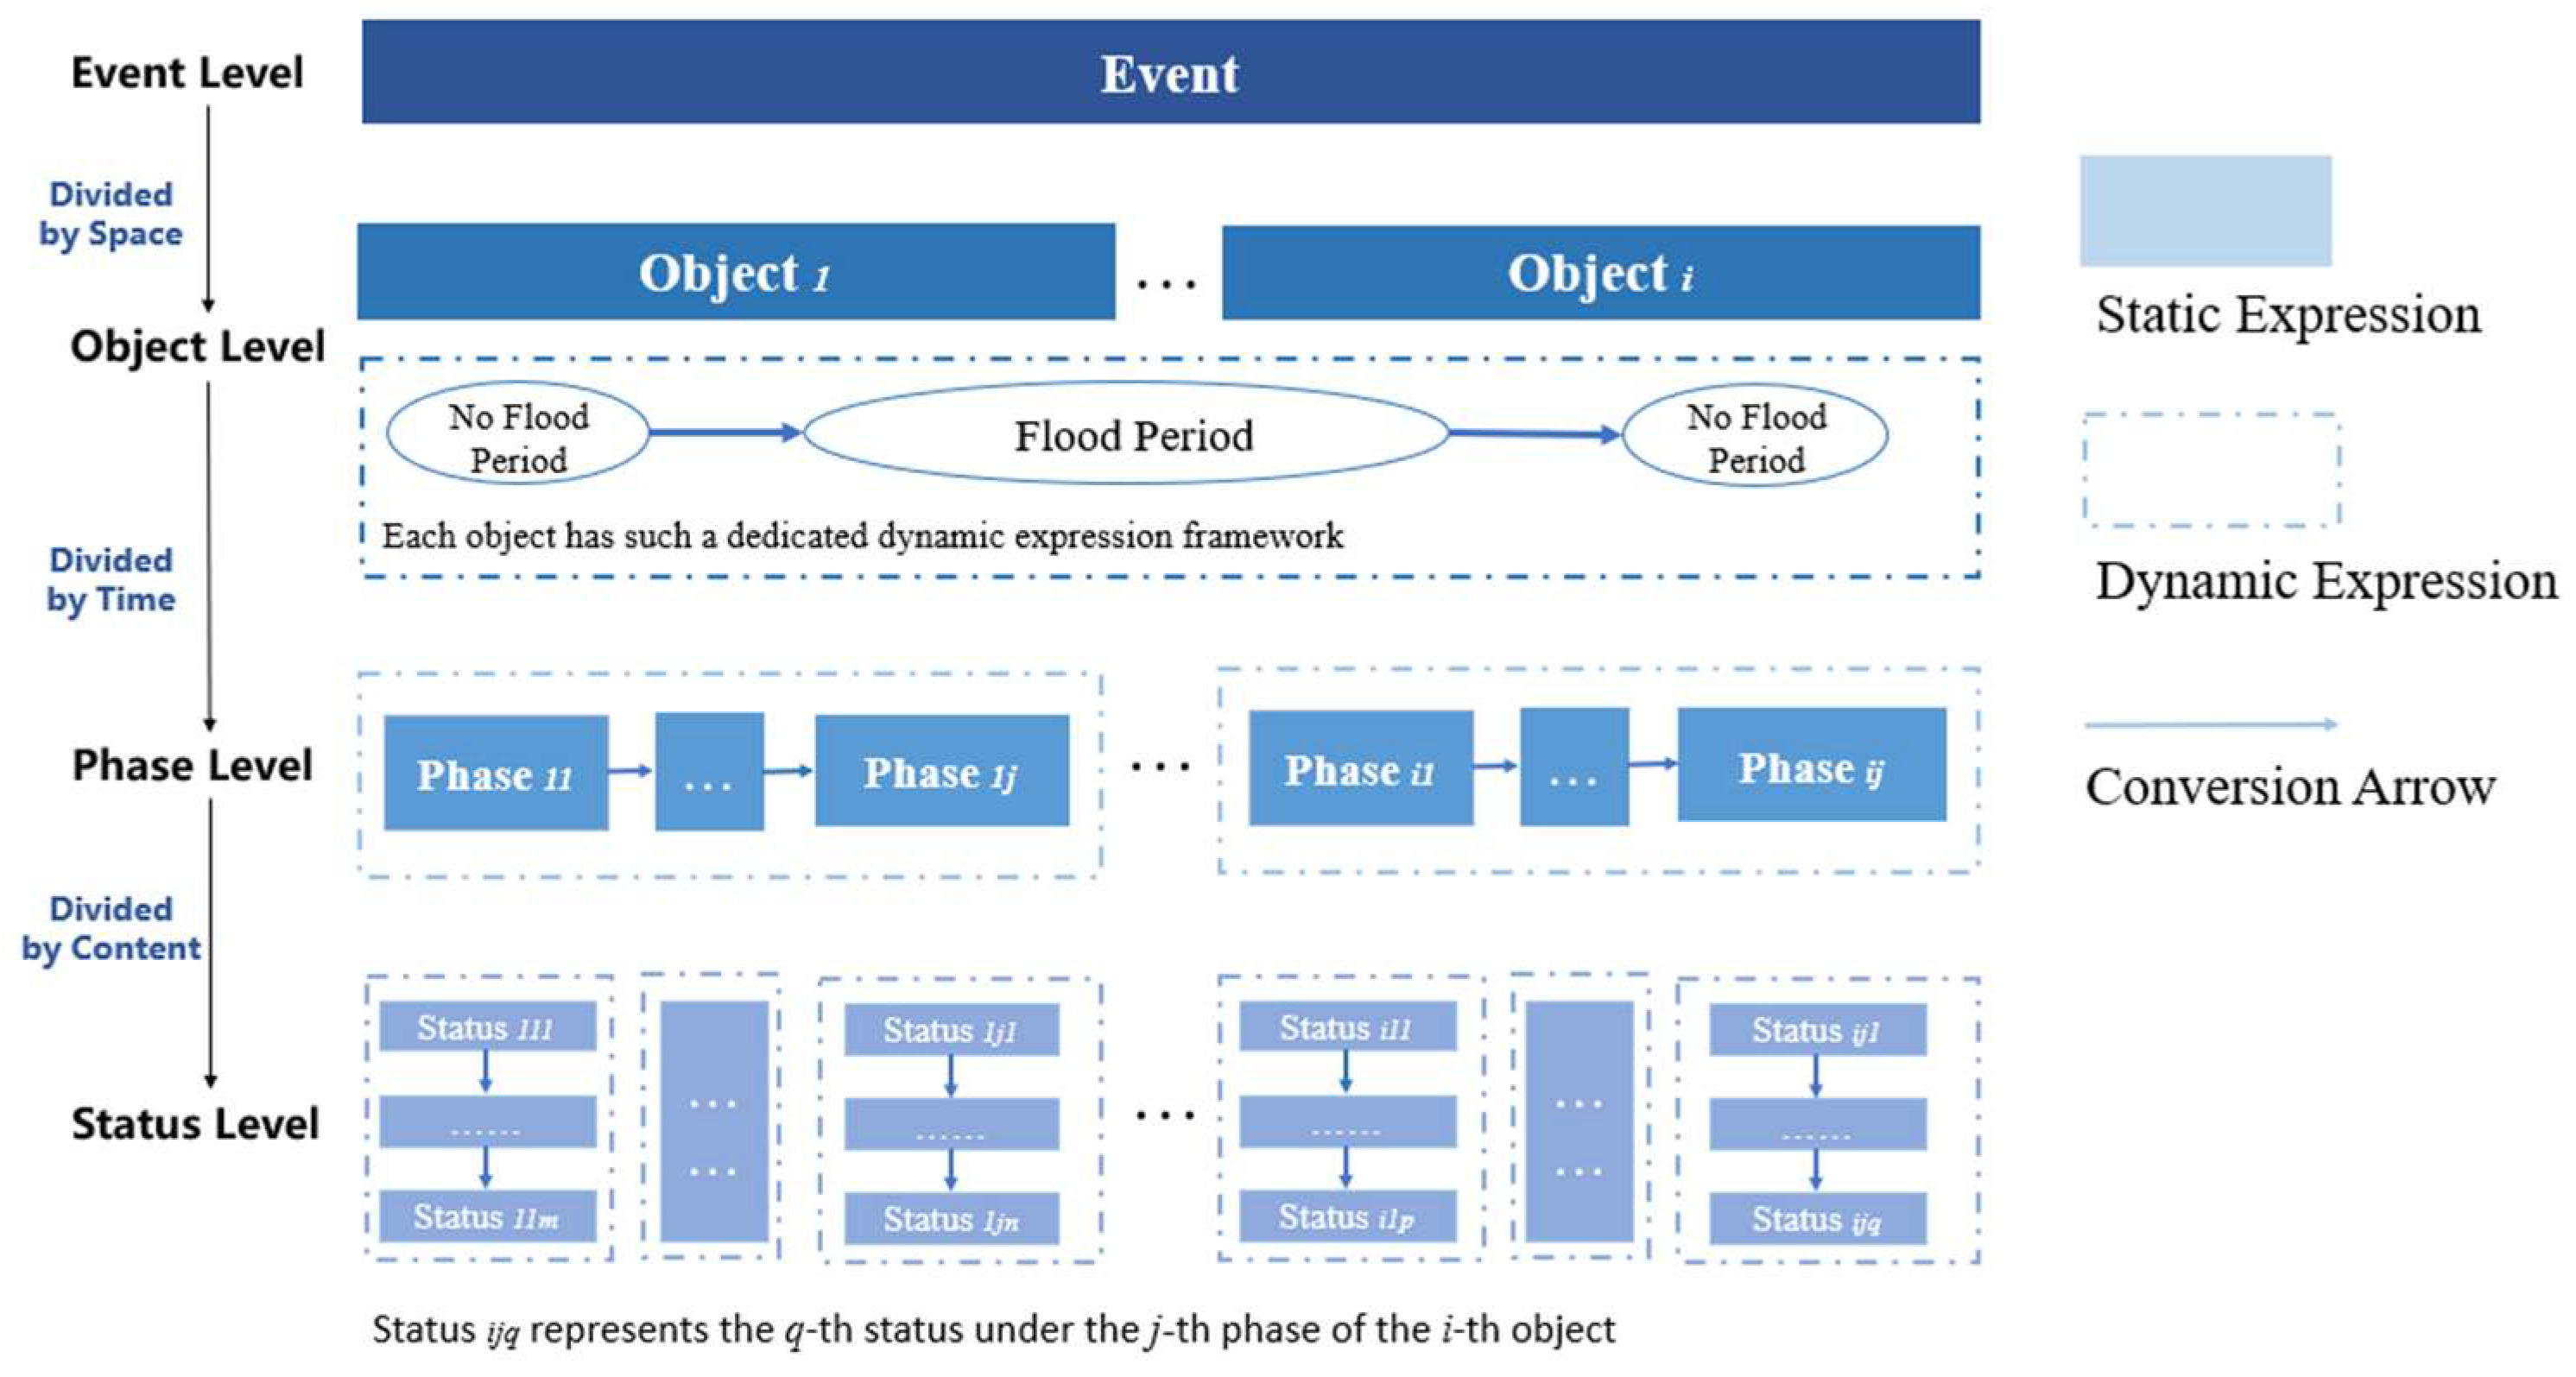
3.1. Description of EMMFPO

Considering people’s awareness of events, we selected three dimensions—space, time and content—and divided events into four cognitive levels—event, object, phase, and status. Based on the spatial location, the model divides the event into multiple spatial objects; each complete life cycle within each object is defined as a phase, and when the situation of the flood within a phase, a new status is generated.
The status, referring to the related research [19,20], is divided into three types: prewarning, response, and recovery, which can be briefly understood as before, during, and after a flood, respectively. Prewarning is the status under which the government issues an early warning to inform everyone that the flood may come. Response is the status under which the government actively participates in rescue and response work, including identifying disaster-stricken areas and rescuing victims. Recovery is the status under which the government evaluates disaster loss after the flood and publicizes flood fighting deeds to inspire people’s emotions.
The model uses the static expression class to describe static element information and derives the dynamic expression class based on the static expression class to obtain dynamic development process information. A schematic of the model is shown in Figure 1, which mainly illustrates the division relationship between various levels and the ideas of dynamic and static expression.
Individuals at each level are called FPO entities, and in Figure 1, each static expression rectangle is an entity. In terms of the selection of entity element information, following relevant work [44,45], we found that time, space and content were the hot dimensions of current research. Therefore, the EMMFPO was set to select these three dimensions to define the elements. In addition, based on the research field of flood disaster, the content can be divided into three aspects: topic, emotion and disaster situation. In summary, the EMMFPO selects the five elements of time, space, topic, emotion and disaster situation to describe static information.
In order to abstract the FPO entity in the geographic world into the computer world, the model defines a static expression base class and a dynamic expression base class. Further, expression classes corresponding to the base class at four cognitive levels are constructed. Since this model only involved one event entity in this research, there was no event dynamic expression class. The UML diagram of the EMMFPO is shown in Figure 2.

3.2. The Static Element Information Expression

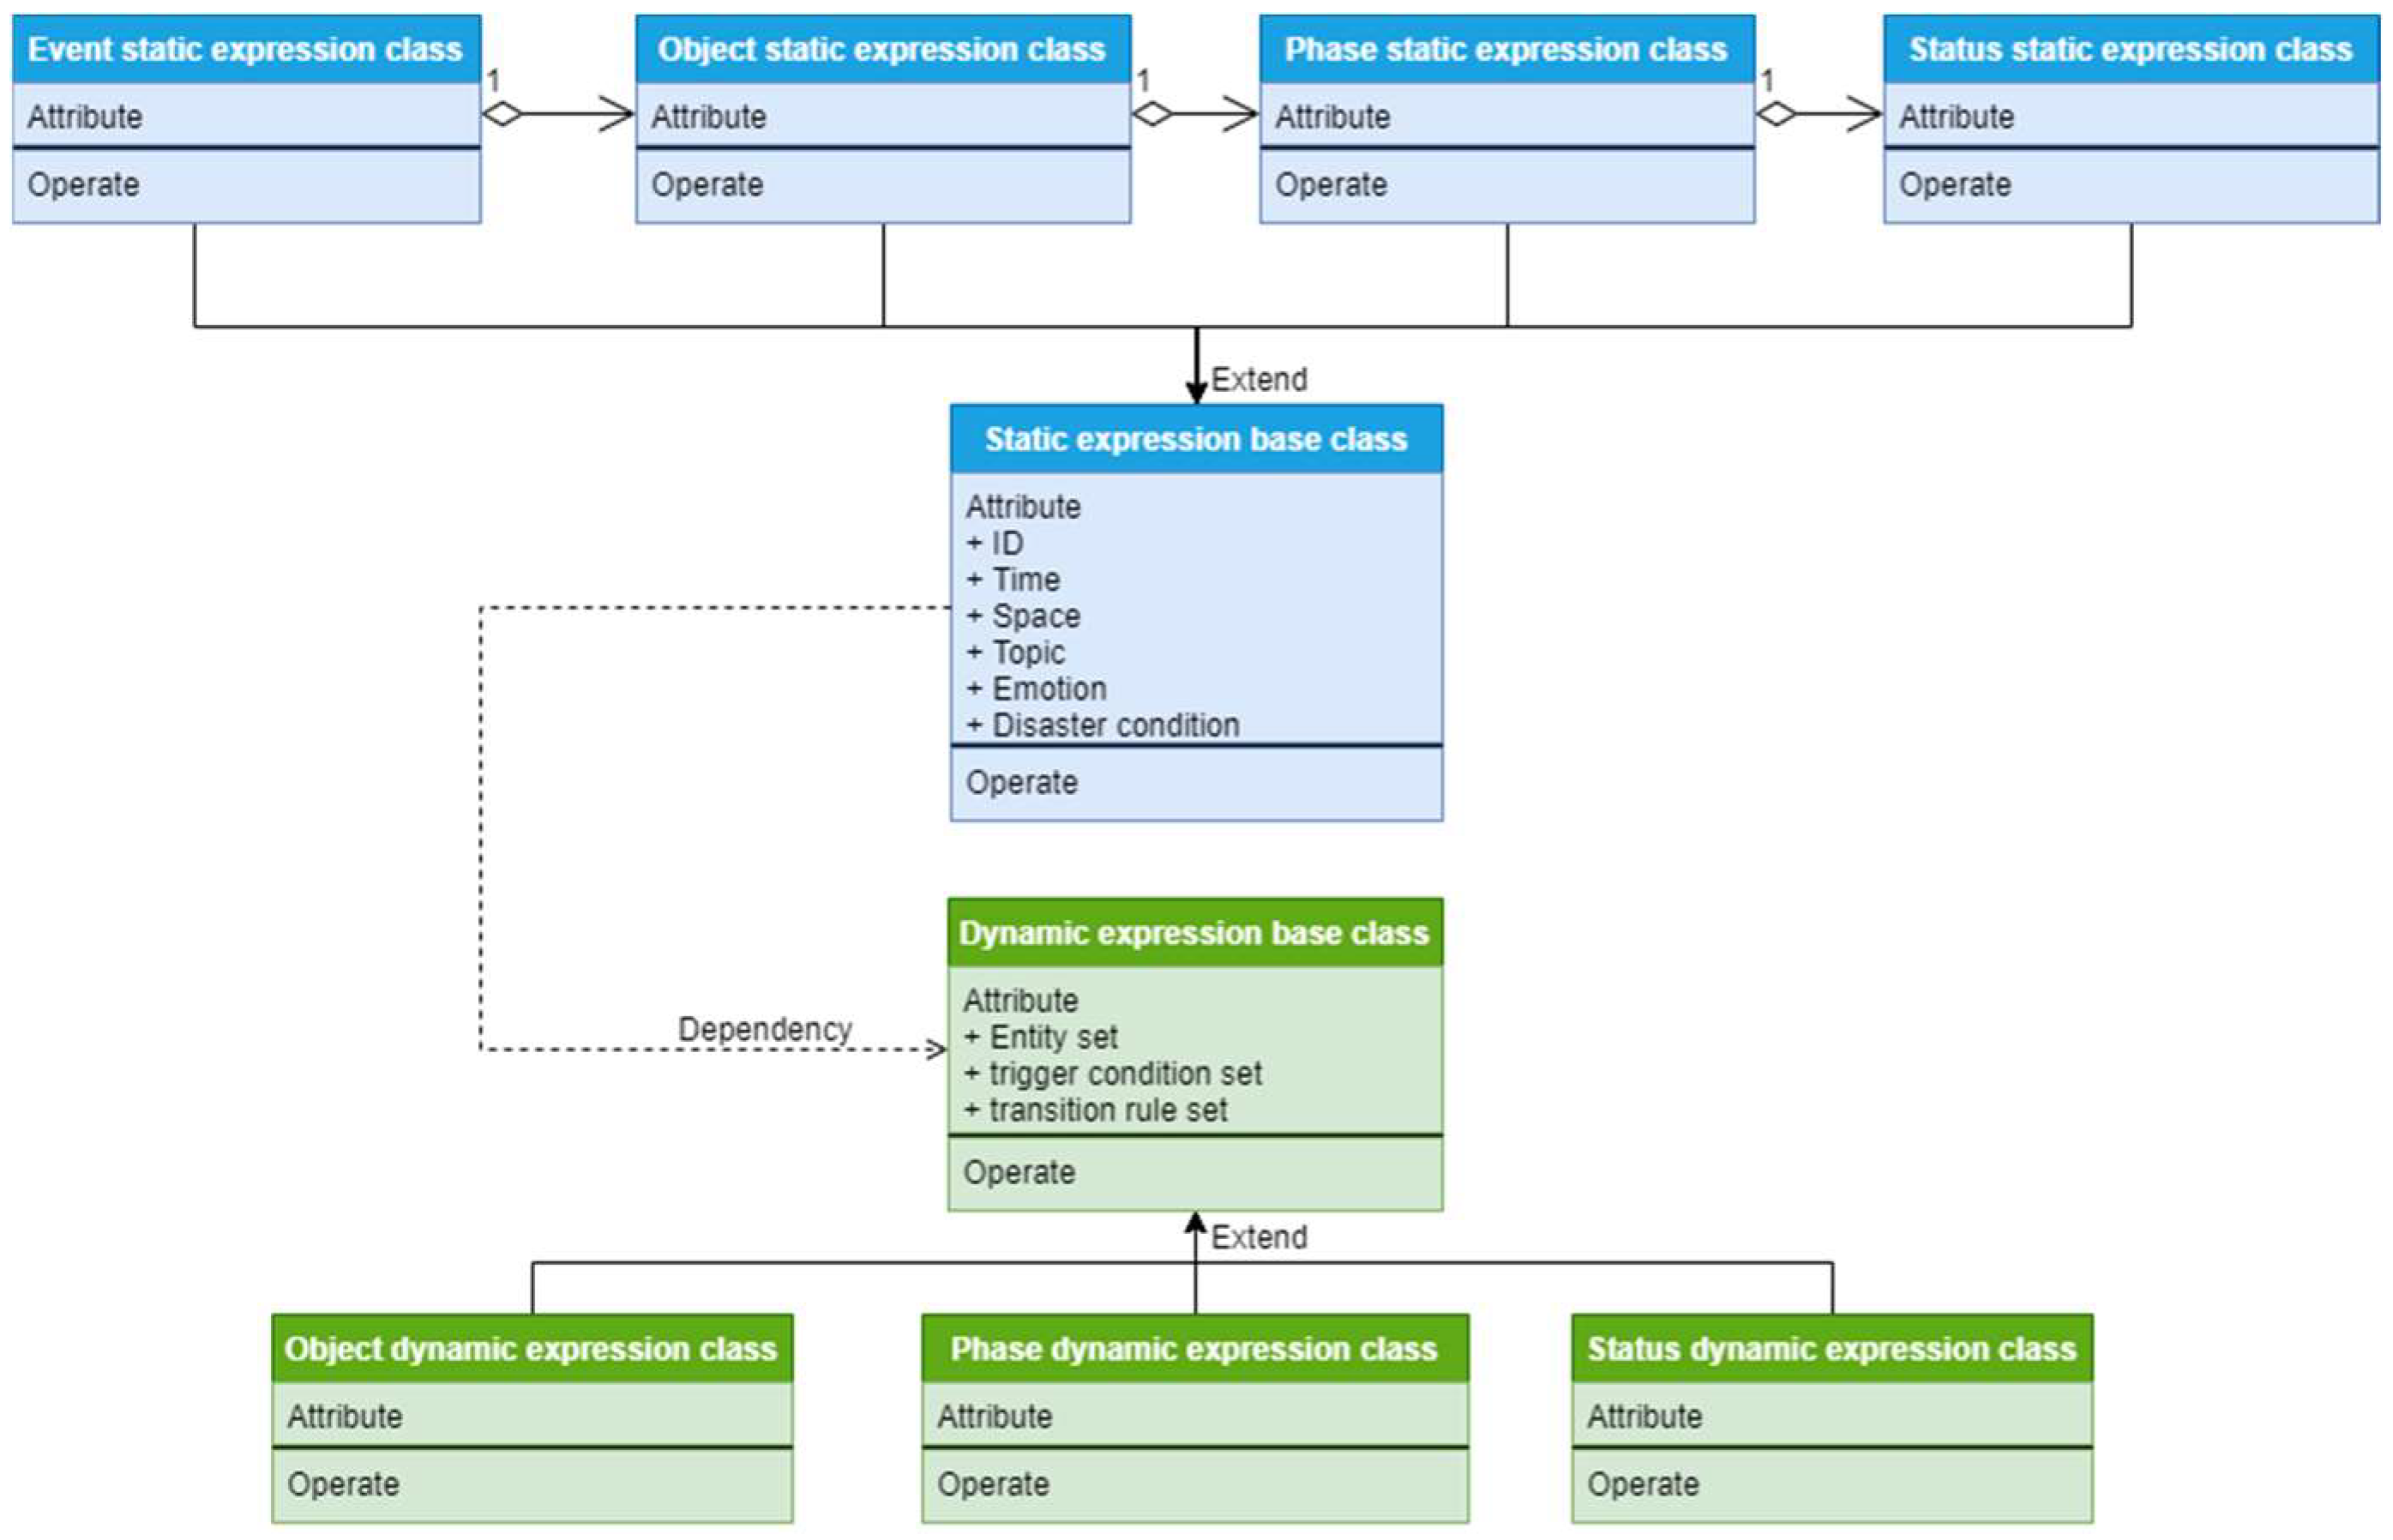
3.2.1. The Structure of the Static Expression Base Class

The static expression base class, as the basis of the EMMFPO, has five types of attributes: the time, space, topic, emotion, and disaster elements, all with unique identification codes.
(I)
ID
IDs are used as the unique codes to distinguish entities and are represented by integer values.
(II)
Time Element
The time element is used to determine the time range of an entity, expressed in the form of a two-tuple, as shown in Equation (1). It records the generation time T 1 and the end time T 2 of an entity. The generation time and the end time are expressed in the form of a six-tuple corresponding to the year, month, day, hour, minute, and second. Based on different research granularities, the six-tuple can be appropriately defaulted. Furthermore, when T 1 and T 2 are the same, this means that the event occurred over one day, e.g., ((2021,4,1), (2021,4,1)) signifies a time range from 0:00 to 24:00 on 1 April 2021.
{ T i m e = ( T 1 , T 2 ) T = ( Y , M , D , h , m , s )
(III)
Space Element
The space element is used to determine the spatial region where an entity is located, expressed in a custom region code.
(IV)
Topic Element
The topic element is used for confirming the hot topic in an entity, expressed in the form of a two-tuple; see Equation (2). It records the set of topic words and the corresponding popularity. The popularity calculation method is the number of texts on the topic divided by the total number of texts. Generally speaking, there are many types of topics in public opinion, and topics with high popularity are the focus of this article. Therefore, the topic element only records the first n groups of topics with high popularity, and n is customized according to the actual situation.
T o p i c = { ( W o r d s , H e a t ) 1 , , ( W o r d s , H e a t ) n }
(V)
Emotion Element
The emotion element reflects the people’s attitudes and emotions in an entity, expressed as a two-tuple; see Equation (3). It records the mean and variance of emotion value, expressed in floating-point format, and the mean ranges from −1 to 1. The closer to −1, the more negative the emotion is; the closer to 1, the more positive the emotion is. Variance reflects the degree of difference in the overall emotional tendency of the public. The value range is all nonnegative real numbers. The smaller the value, the more uniform the public’s emotional tendency.
E m o = ( e M e a n , e R 2 ) ,       e M e a n [ 1 , 1 ] , e R 2 R
(VI)
Disaster Element
The disaster element is expressed in the form of a triple, which records the prewarning, emergency response, and disaster loss. See Equation (4) for details.
C o n d i t i o n = ( D p , D r , D l )
Each element in the triple is expressed in the form of a set. D p , D r , and D l are, respectively, composed of { p 1 , p 2 , , p i } , { r 1 , r 2 , , r j } , and { l 1 , l 2 , , l k } . The structure of each component is shown in Table 1.

3.2.2. The Structure of the Static Expression Class in Levels

Each level of static expression class is inherited from the static expression base class and has all its attributes and methods. Furthermore, due to the close relationship between each level, there is no need to record element information at each level so that it can save storage space. We built an association relationship and conducted calculations based on the relationship to achieve the acquisition of element information at each level.
The event entity records all contained object entities, and it is expressed as Equation (5).
{ E v e n t = ( e I d , e O b j e c t s ) e O b j e c t s = { O b j e c t 1 , , O b j e c t n }
The object entity records the phase entities that it contains and the event entities to which it belongs. At the same time, the object layer is a level based on the spatial location, so the object entity also needs space element information; see Equation (6).
{ O b j e c t = ( o I d , o E v e n t , o P h a s e s , o S p a c e ) o P h a s e s = { P h a s e 1 , , P h a s e n }
The phase entity records the status entities that it contains and the object entities to which it belongs. Then, as the stage layer is divided based on the time range, the phase entity also needs time element information; see Equation (7).
P h a s e = ( p I d , p O b j e c t , p S t a t u s , p T i m e ) p S t a t u s = { S t a t u s 1 , , S t a t u s n }                                
The status entity records the phase entity to which it belongs and the contained text. In addition, the status layer is a level based on content (referring to topics and disasters), so status entities are divided into disaster entities ( S t a t u s _ C ) and topic entities ( S t a t u s _ T ). A disaster entity stores four types of elements: time, space, disaster and emotion, and a topic entity stores four types of elements: time, space, topic, and emotion; see Equation (8). Incidentally, space elements are obtained through association relationships and are not directly stored. s T y p e represents the type of status, including three categories: prewarning, response and loss recovery.
{ S t a t u s _ C = ( s I d , s P h a s e , s T e x t s , s T y p e , s T i m e , s C o n d i t i o n , s E m o ) S t a t u s _ T = ( s I d , s P h a s e , s T e x t s , s T y p e , s T i m e , s T o p i c , s E m o ) s T e x t s = { T e x t 1 , , T e x t n }
The calculation methods of static elements that are not directly stored are:
(1)
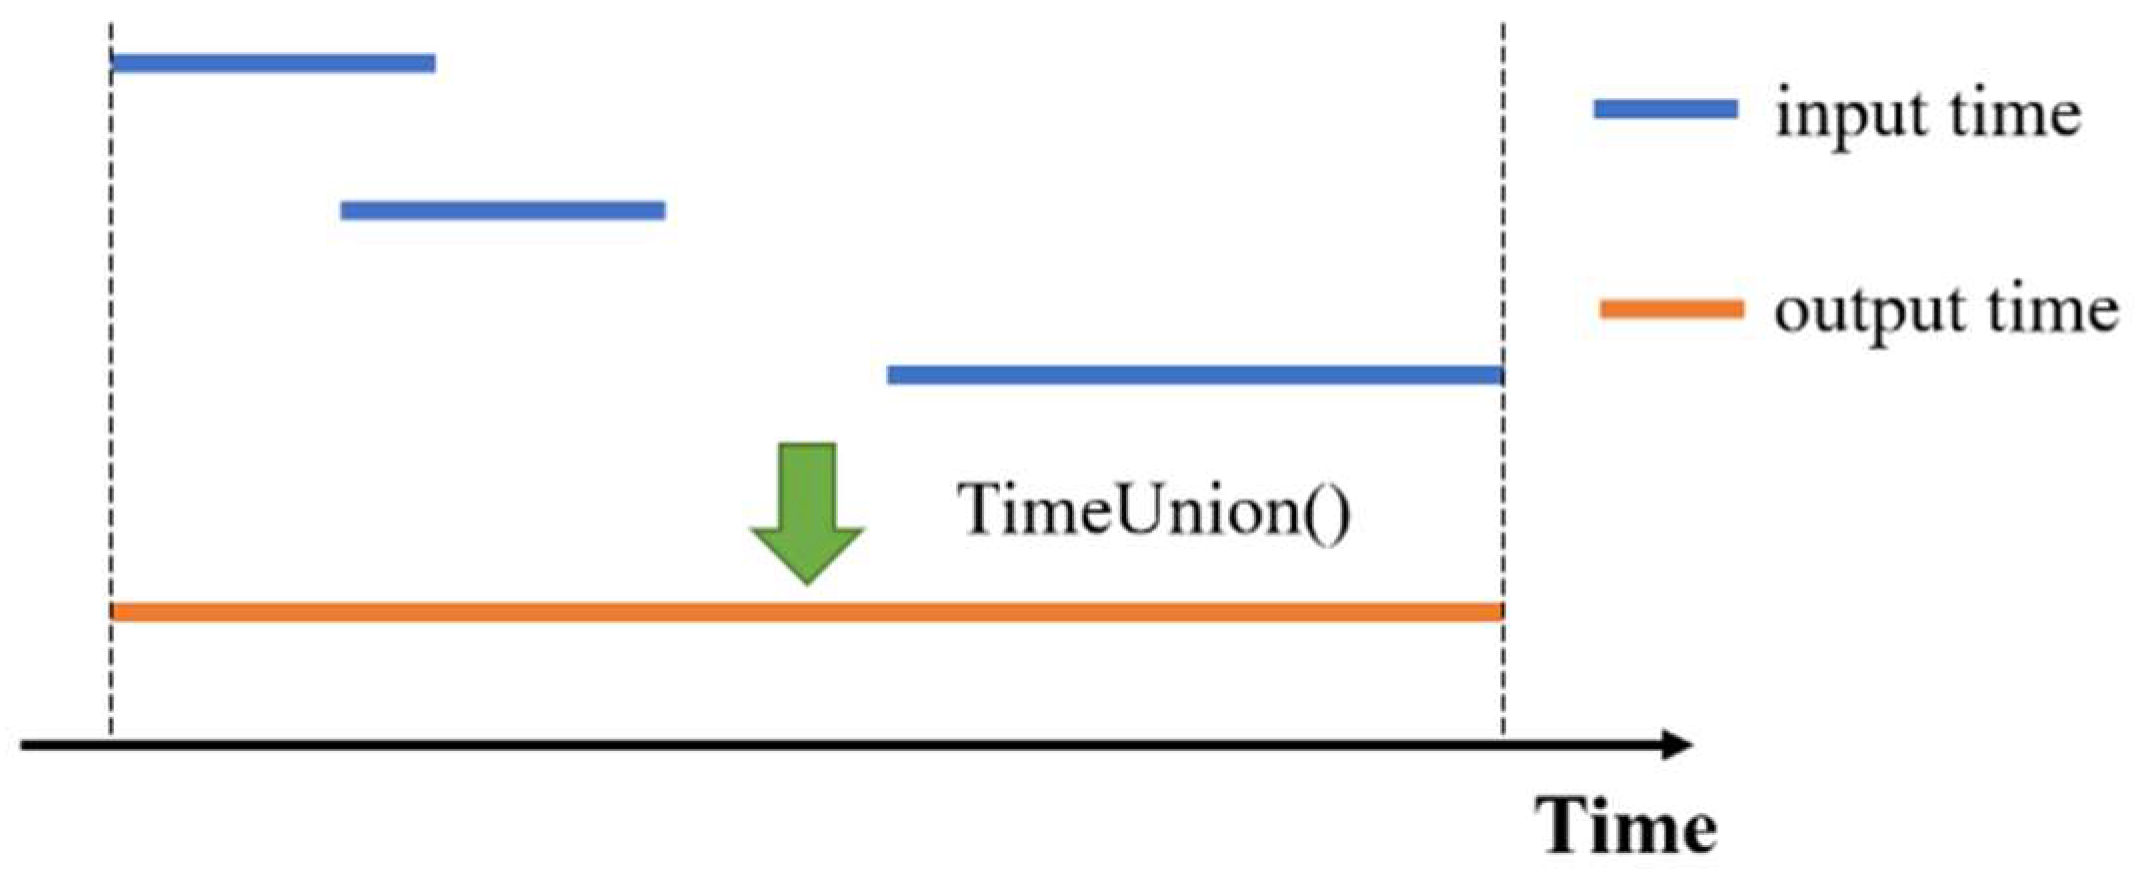
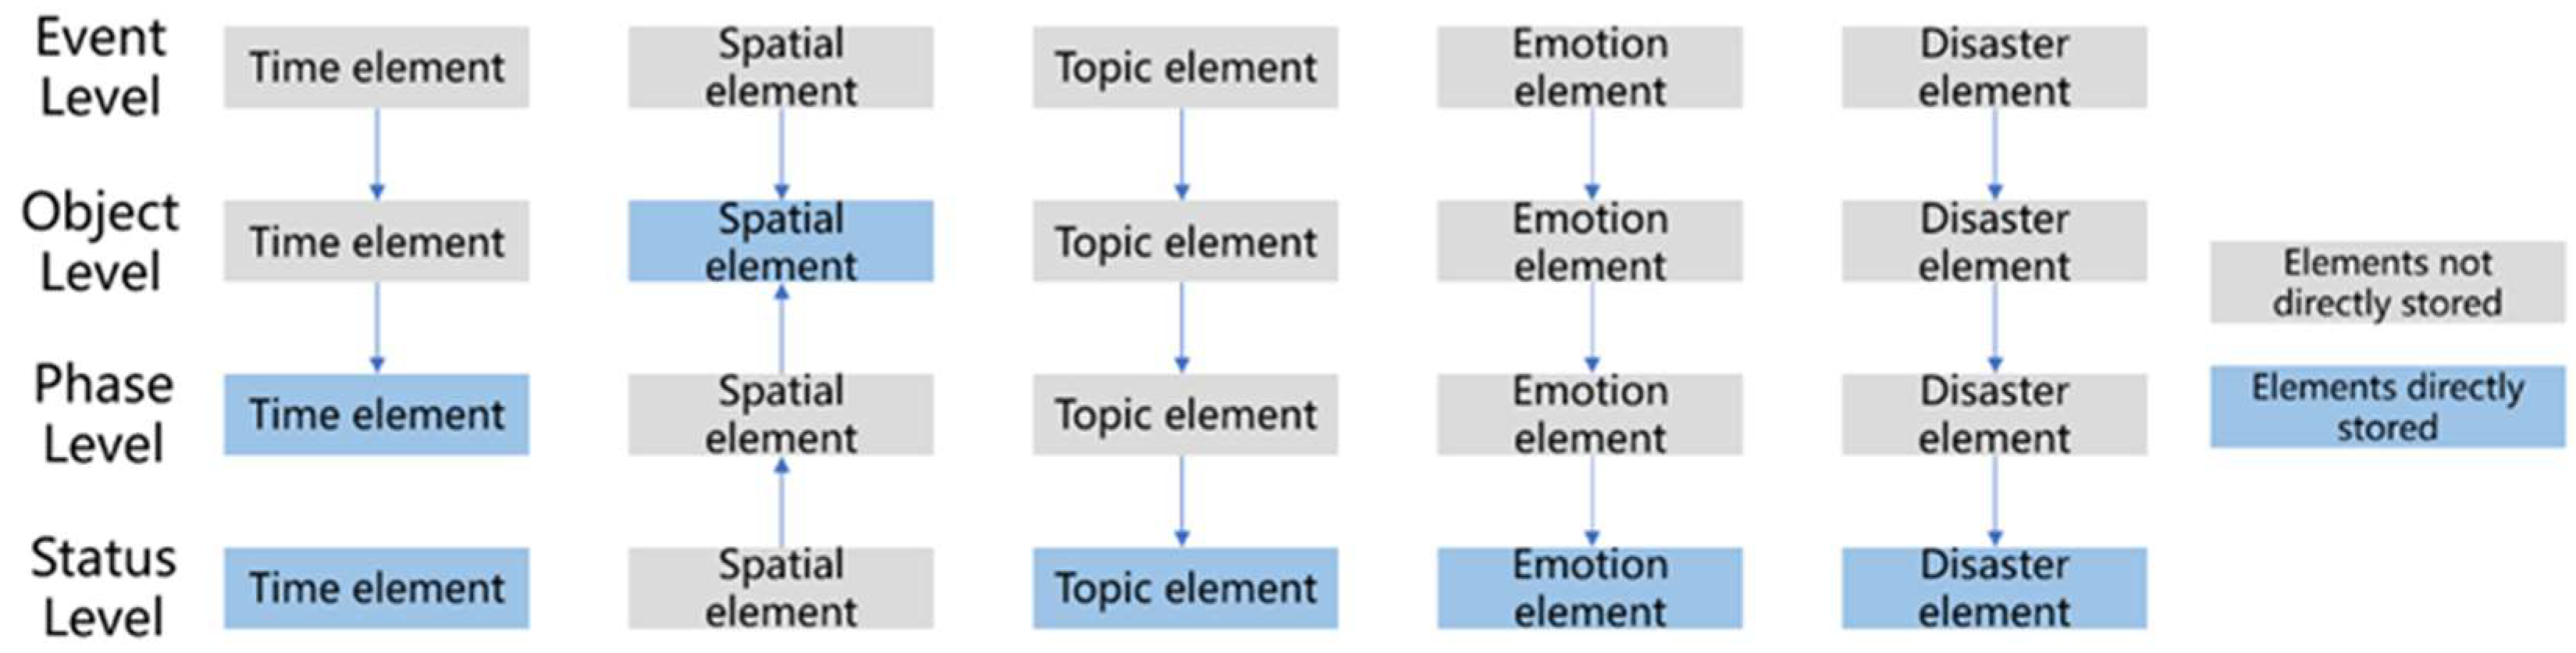
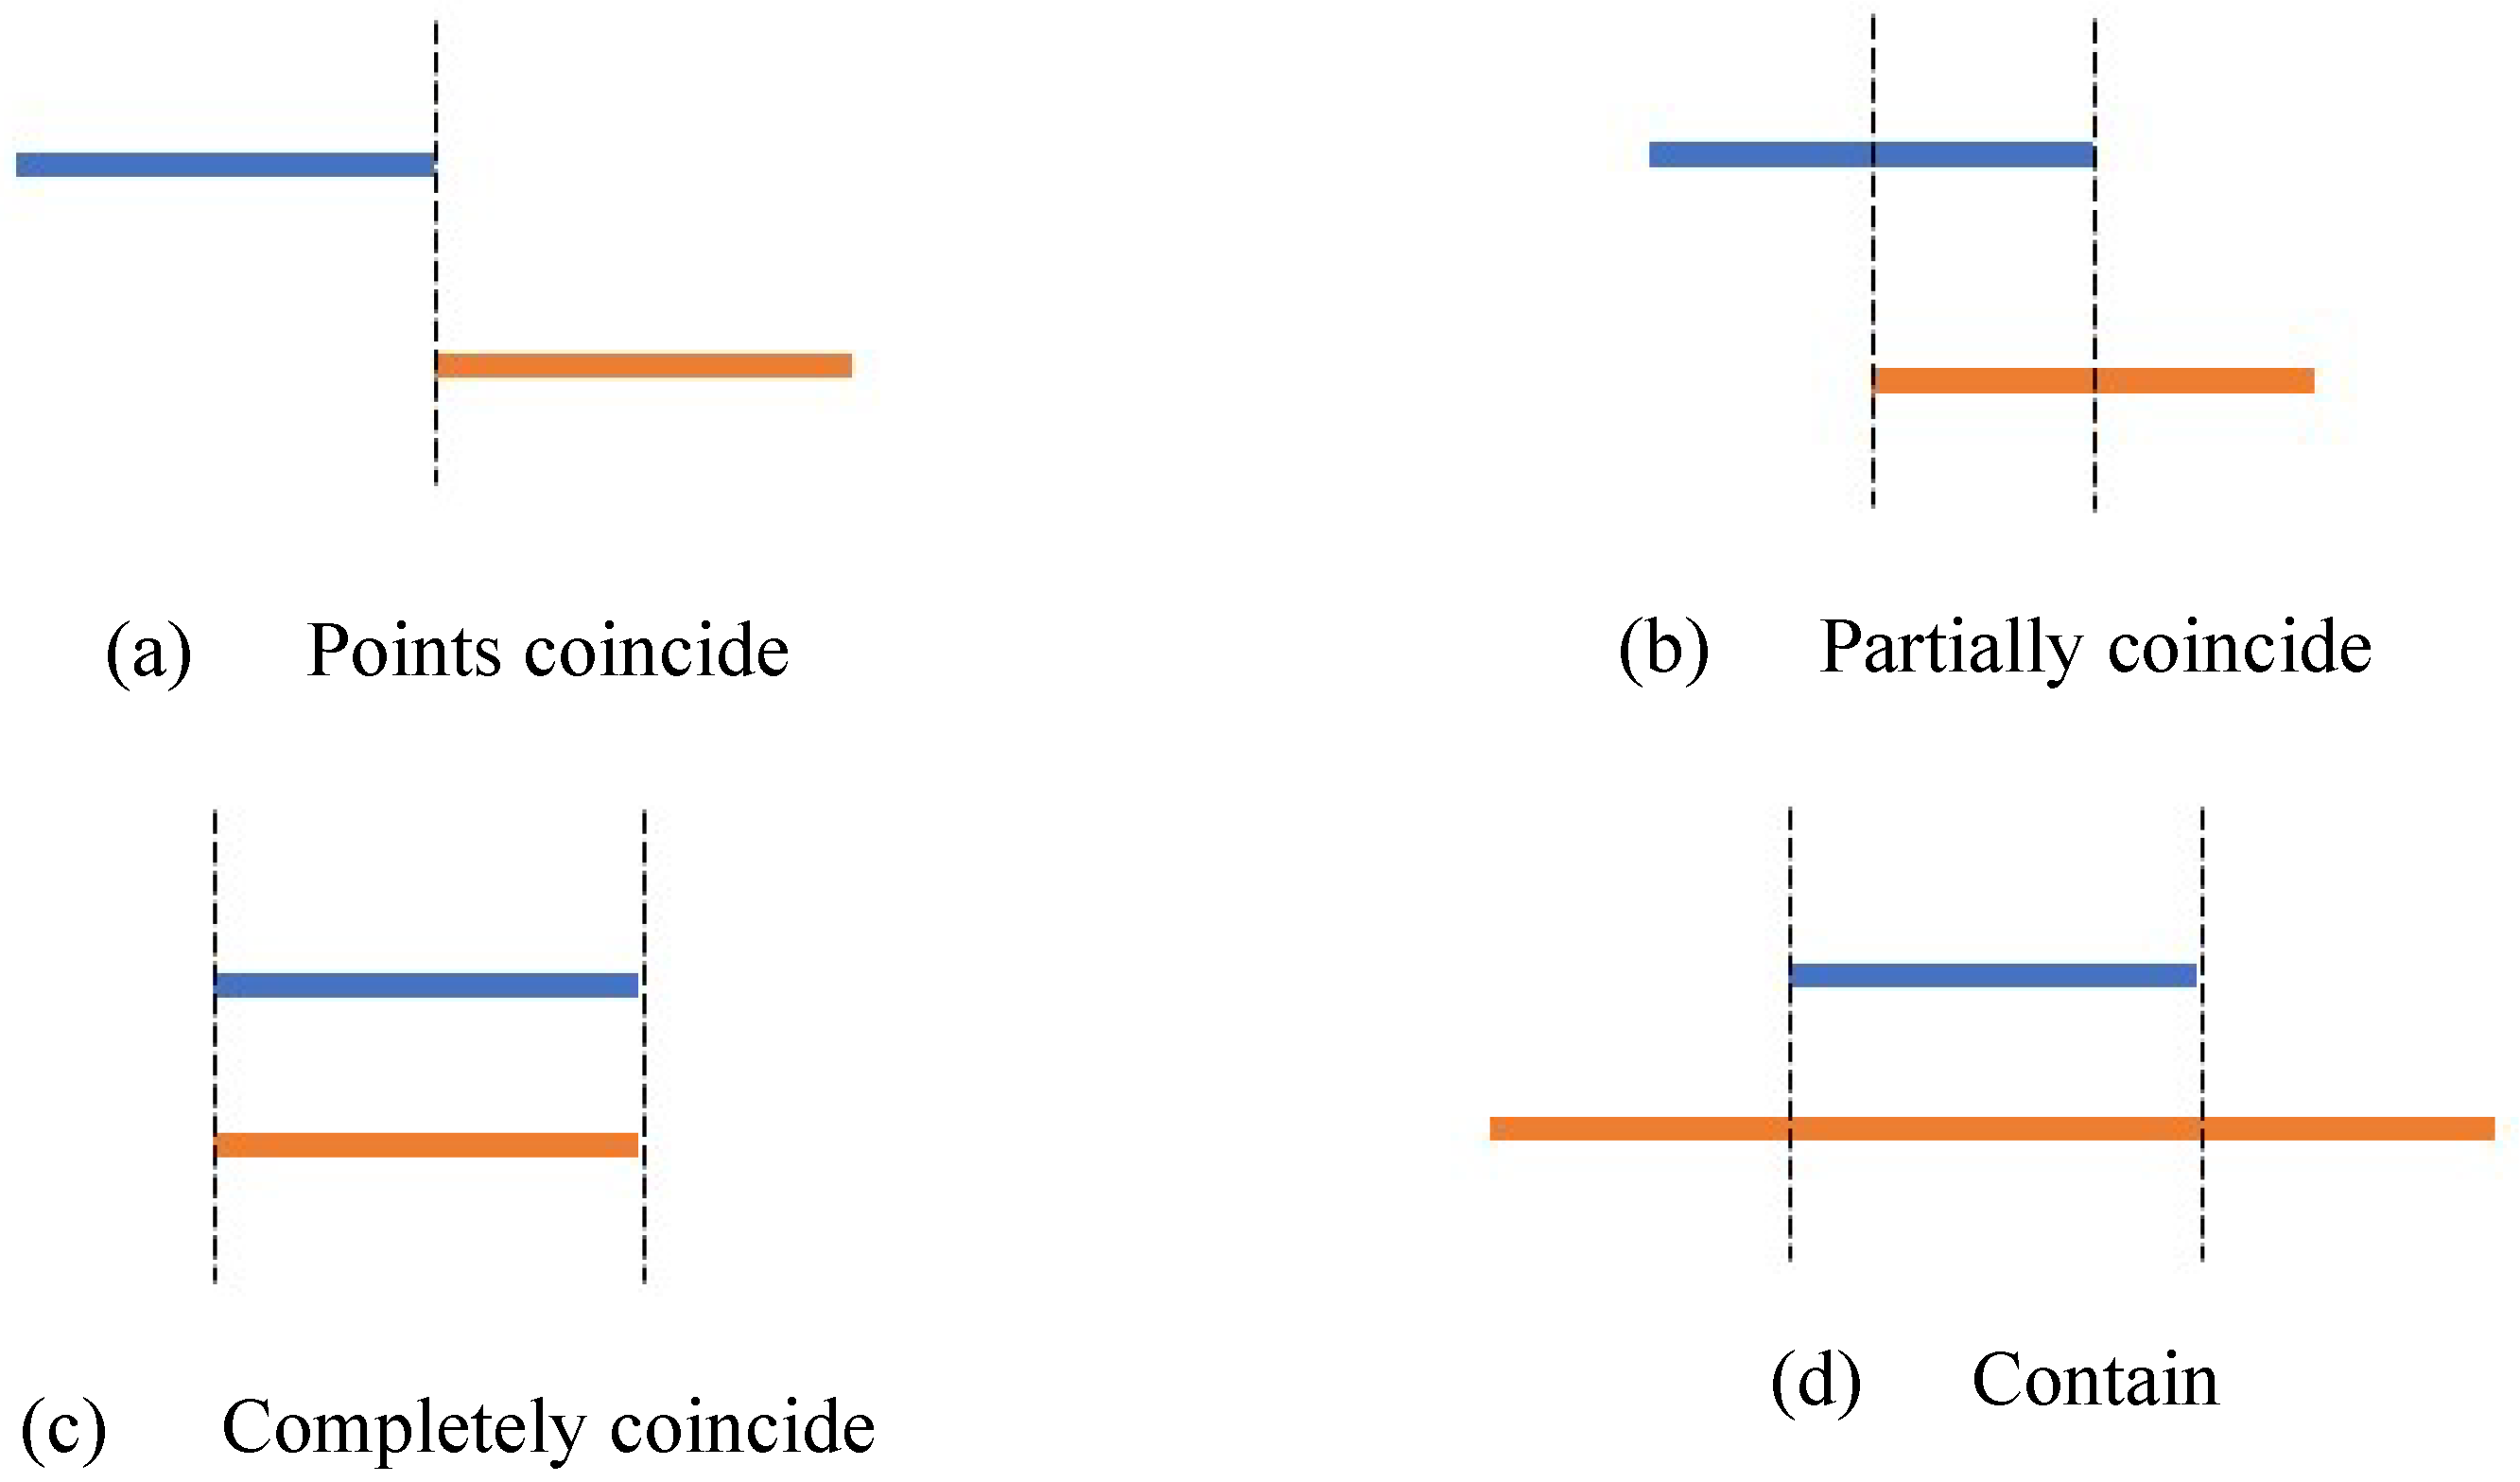
The time element is determined by the union operation including the time element of the lower level T i m e N L ; see Equation (9).
T i m e = T i m e U n i o n ( T i m e N L )
The union operation of time elements is defined as finding the shortest continuous time that can cover all the time elements involved in the lower level. The shortest continuous time is the result of the union operation. As shown in Figure 3, each line represents the time period.
(2)
The space element is obtained by searching the associated object entities. The space elements of the phase and status entities are consistent with the associated object entities, and the space element of the event entities is the union of the contained object entities.
(3)
The topic element is obtained by recalculating and sorting the popularity of topics at lower levels. The calculation method is shown in Equation (10).
{ T o p i c = m a x O r d e r ( { ( w o r d s , H e a t ) j } ) H e a t j = i N L i ( H e a t j )
H e a t j is the popularity of topic j in the entity at this level and NL( H e a t j ) is the popularity of topic j corresponding to the entity contained in the next level. If the topic does not exist for a certain entity, the heat is recorded as 0.
(4)
The emotion elements are weighted and averaged by the emotion elements corresponding to all entities in the lower level; see Equation (11).
{ e M e a n = w i e M e a n N L i e R 2 = w i ( e M e a n N L i e M e a n ) 2
e M e a n N L i represents the mean value of the i-th entity contained in the next level and w i is the corresponding weight that is determined by the number of FPO data involved in each entity.
(5)
The disaster element is obtained by consolidating the next level of disaster factors; see Equation (12).
{ D w = D w N L 1 D w N L 2 D w N L i D r = D r N L 1 D r N L 2 D r N L i       D s = D s N L 1 D s N L 2 D s N L i      
In summary, the static expression uses the four levels of static expression classes, including event, object, phase, and status (which are inherited from the static expression base class), to fully express flood situation at a specific time and place. Figure 4 shows the calling relationship of various levels of elements.

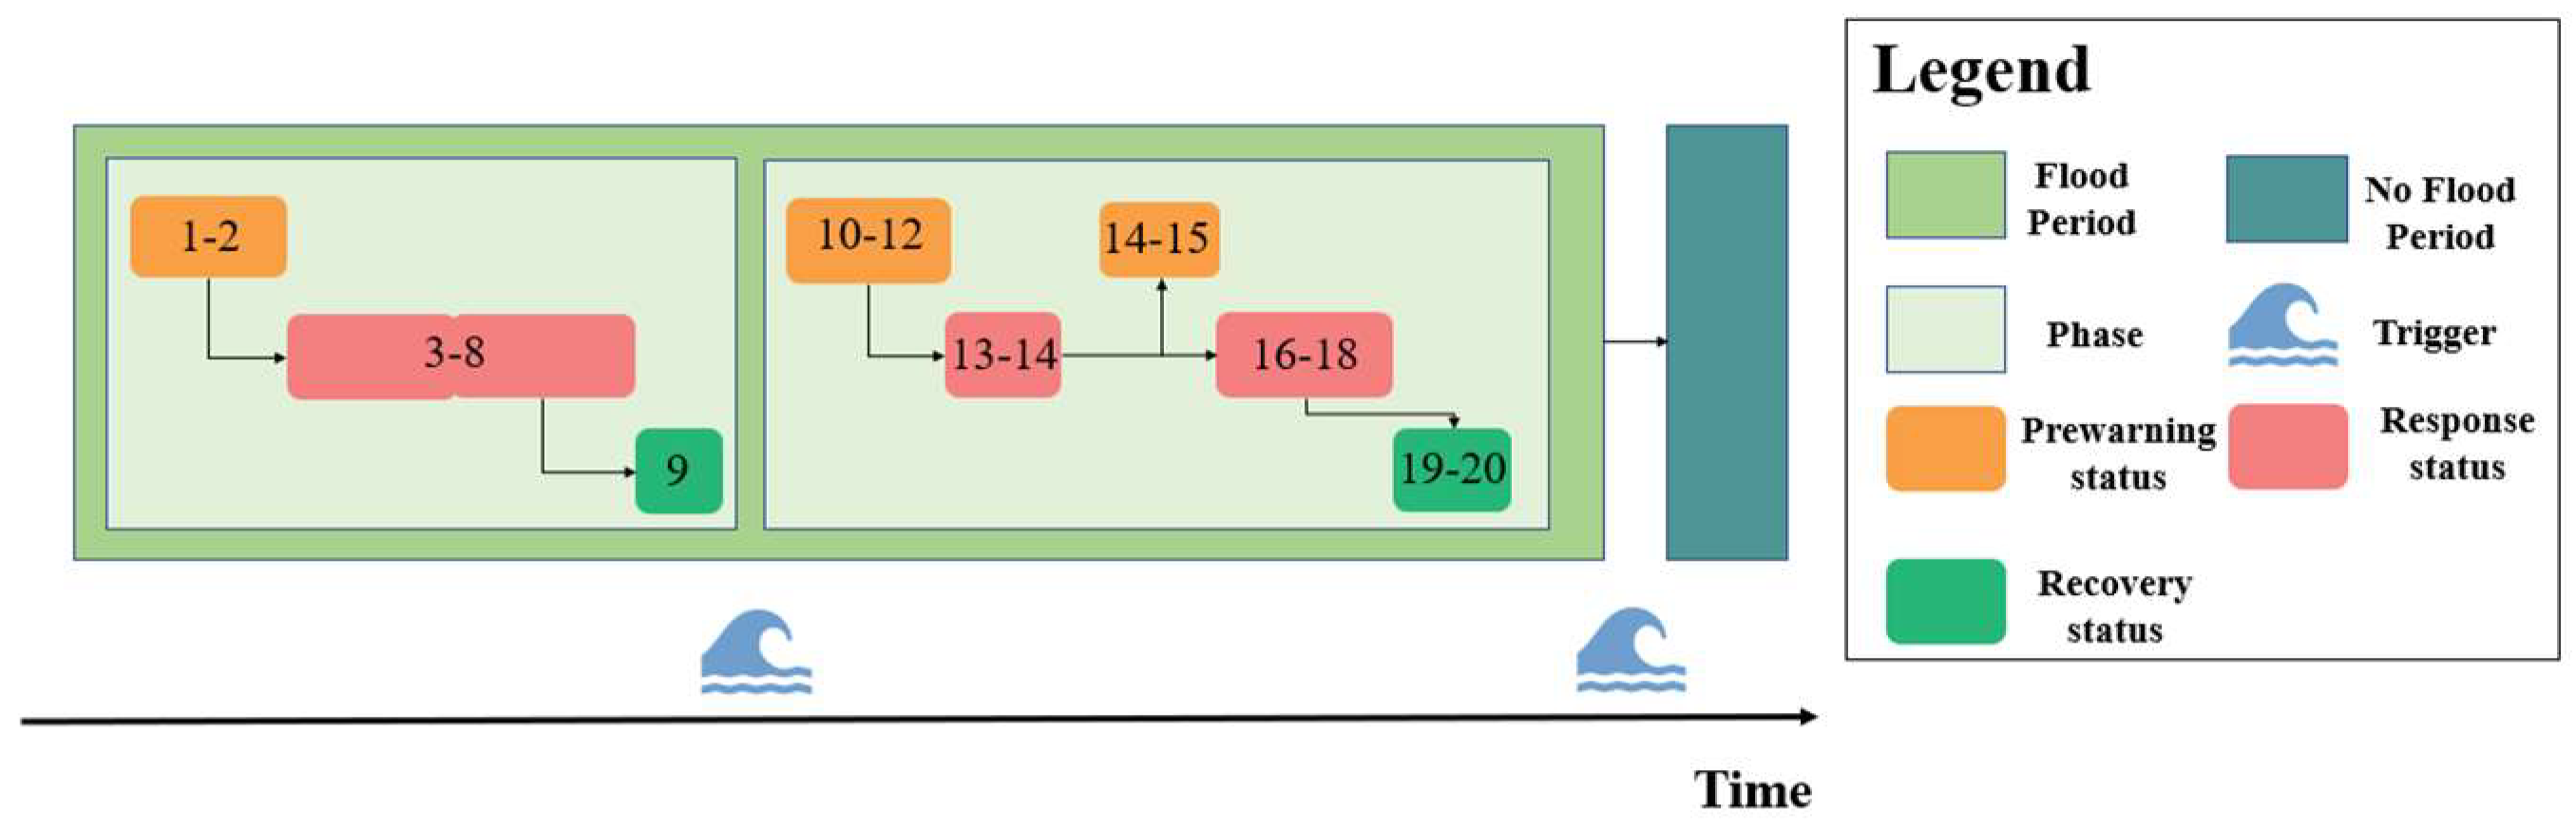
3.3. The Dynamic Development Process Expression

3.3.1. The Structure of the Dynamic Expression Base Class

The dynamic expression is based on static entities. One of the attributes is the entity set that is from the static expression class. It also contains a set of triggers and a set of transition rules. These three attributes refer to the concept of finite state machine, FSM. The basic composition of a finite state machine usually includes the following three parts: the finite state set { q 1 , q 2 , , q l } , the input set { σ 1 , σ 2 , , σ m } , and the state transition rule set δ : { q i × σ j q i } [46]. The operating mechanism is summarized as follows: in a certain state q i , after a given input σ j , the state machine will convert the state to q i according to the state transition rule δ .
The structure of the dynamic expression base class is defined as shown in Equation (13):
D y M o d e l = ( Q O , Q A , Q δ )
Q O represents a set of entities, Q A represents a set of triggers, and Q δ represents a set of transition rules. Equations (14) and (15) express the structure of the trigger condition set and the transition rule set, respectively.
{ Q A = { A 1 , A 2 , , A m } A = ( F a c t o r , f T i m e , f S p a c e )
{ Q δ = { δ 1 , δ 2 , , δ n } δ = ( O i , { A } , O j )

3.3.2. The Structure of the Dynamic Expression Base Class

The dynamic expression of the object layer is carried out for the object entity itself, expressing the conversion between “flood period” and “no flood period”. In other words, it shows when and why the flooding begins to affect the area and when it will end.
Refer to Equation (16) for the definition of the object-level dynamic expression class:
D y _ C l a s s O = ( Q T o , Q A o , Q δ o )
Q T o is the state collection of the object entity, namely “flood” and “no flood”; Q A o is the set of triggers; and Q δ o is the set of transition rules. The structure is shown in Equations (14) and (15). The expression results are shown in Figure 5, which illustrates the conversion process between the “flood” period and “no flood” period of the object i.
See Equation (17) for the definition of phase-level dynamic expression class:
D y _ C l a s s P = ( Q p , Q A p , Q δ p )
Q p represents the set of phase entities which belong to the same object entity and Q A p and Q δ p represent the set of stage triggers and the set of stage transition rules, respectively. The expression form is consistent with Equations (14) and (15). The expression results are shown in Figure 6, which illustrates the transformation process of each phase within the same object.
Equation (18) provides the definition of status level dynamic expression class:
D y _ C l a s s S = ( Q s , Q A s , Q δ s )
Q s is a set of status entities that record elements of the same type, i.e., all are topic entities or all are disaster entities; Q A s and Q δ s represent the set of state triggering conditions and the set of state transition rules, respectively; and the expression form is consistent with Equations (14) and (15). All topic entities or all disaster entities in the same object or in the same phase are in the same status-level dynamic expression instance. In addition, only statuses with different s T y p e could be transferred. The expression result is shown in Figure 7, which illustrates the change process between prewarning, response and recovery at the same phase.

4. Method

Based on the EMMFPO, we proposed an FPO entity construction method and a flood development deduction method to realize the transition from FPO data to flood element information and development process information.

4.1. FPO Entity Construction Method Based on Static Expression

The FPO entity construction process is an operation method based on the EMMFPO used to organize the element information extracted from FPO data. Figure 8 shows the FPO entity construction process.
Step 1 Construct status entity:
The construction of status entities is divided into topic entity construction and disaster entity construction. For topic entities, the model uses the topic status of each area every day as the initial status unit T o p i c _ S i , j , in which i represents the i-th area and j represents the j-th day; see Equation (19). The topic feature stores the top five topics with the highest degree of discussion in the area of the day, and the sentiment feature stores the average sentiment and its variance of the corresponding text.
{ T o p i c _ S i , j [ s T o p i c ] = { ( w o r d s k , H e a t k ) } H e a t k = max ( { H e a t } i j , k )   k = 1 , 2 , , 5
{ H e a t } i j represents the set of topic popularity values corresponding to all texts in the i-th area on the j-th day and max(A,k) represents the k-th element in the A set sorted from largest to smallest. If there are multiple hottest topics on the day, each hot topic is used as an initial status unit and only the corresponding topics and hot topics are recorded.
The construction of a disaster entity is similar to that of a topic entity. Different types of disasters in each area on each day are defined as the initial status unit C o n d i t i o n _ S i , j , k , where i represents the i-th area, j represents the j-th disaster type, and k represents the k-th day; see Equation (20) for details.
C o n d i t i o n _ S i , j , k [ s C o n d i t i o n ] = C S _ U n i o n ( { T e x t _ C o n i , j , k } )
{ T e x t _ C o n i , j , k } represents the disaster information collection of the i-th area, k-th day, and j-th disaster type extracted from the text. The structure of the disaster elements extracted from each text is shown in Table 1. CS_Union () is the aggregation function of the disaster initial status unit, the rules of which are:
(1)
For the structural information of prewarning and response, the release time and the area involved remain unchanged; the rank records the quantity in order of magnitude, and the form is the structure, e.g., [{‘rank’:’quantity’}]. Webid changes from an integer type to a collection, and the collection elements are all aggregated Webids.
(2)
For the structural information of disaster loss, the release time and the Webids are the same as in the above rule. However, it also includes the rules of SP, BL, EL, and FL, which are detailed in Table 1. The rule is mainly intended to select the maximum value of the extraction result.
After the construction of the initial status unit, the topic and disaster status units are aggregated according to the principles of similar time, same space, and similar topic/disaster to form a status entity, as shown in Figure 9. A similar time means that the time interval between two units is less than or equal to one day, the same spatial area means that the two units are located in the same geographic space area, a similar topic means that the most discussed topic stored in the topic elements of the two units is the same, and similar disaster situation means that the two units are the same types of disasters.
Step 2 Construct phase entity:
Phase entity construction is completed based on the status entity, and it is mainly divided into two stages: (1) determine the initial phase scope based on the time element of status; (2) determine the final scope of the phase based on the status type.
First, based on the principle of temporal proximity, status entities belonging to the same area and adjacent time elements are organized into the same phase. The definition of adjacent time is shown in Figure 10.
We decided that in a life cycle, prewarning is the beginning of the cycle and the estimated loss recovery is the end of the cycle. Therefore, each preliminary phase is supposed to be divided. First, the estimated loss recovery state in the preliminary phases must be extracted. If there is no other status on the end day of the status, it is considered that a life cycle has been completed. Thus, the preliminary phase is divided into two new phases using this status as the phase boundary. The phase division process is shown in Figure 11.
Step 3 Construct object and event entity:
The object entity construction is used to associate the phases of the same area. Event entity construction associates all object entities.

4.2. Flood Development Deduction Method Based on Dynamic Expression

Based on the FPO entity, flood development can be deduced with 3 steps.
Step 1 Make entity set:
The entities are grouped according to the association relationship, the status entities belonging to the same phase are in the same entity set, and the phase entities belonging to the same object are in the same entity set.
The object entity set is different. In the object dynamic expression (see Figure 5), it describes the area that is affected by the flood. Thus, the set includes two entities called “flood” and “no flood”, and the division is determined by the time range of the event and the time range of the object; see Equation (21) for details.
{ T i m e F l o o d = ( T o , 1 , T o , 2 )                                                                       T i m e N o   F l o o d = ( T e , 1 , T o , 1 )   a n d   ( T o , 2 , T e , 2 )  
T o , 1 and T o , 2 represent the generation time and end time of the object entity, respectively, and T e , 1 and T e , 2 represent the generation time and end time of the event entity, respectively, to which the object belongs.
Step 2 Make relation:
Next, the entities in the set are associated according to the similarity principle of the time element. The status entities also need to be in the order of status types because prewarning is theoretically generated first, followed response and then recovery. The correlation structure is shown in Equation (22).
R = ( I D 1 , I D 2 )
I D 1 represents the ID corresponding to the associated starting entity and I D 2 represents the ID corresponding to the associated ending entity.
Step 3 Find triggers and complete transition rules:
It is assumed that each relation R has one or more triggers { A } whose time and space elements are similar to the ones of R . R and { A } form a transition rule δ . The structure is shown in Equation (23).
δ = ( U I D 1 , { A } , U I D 2 )
Therefore, based on the time and space scope, relevant triggers to complete the change chain are searched. At the same time, according to the existing rules, the potential triggers can be inferred.
With these steps, a multi-level dynamic expression is formed. Through visualization (as shown in Figure 12), various levels of entities, transfer conditions, and transfer rules are visually expressed to show the flood development process.

5. Case Study

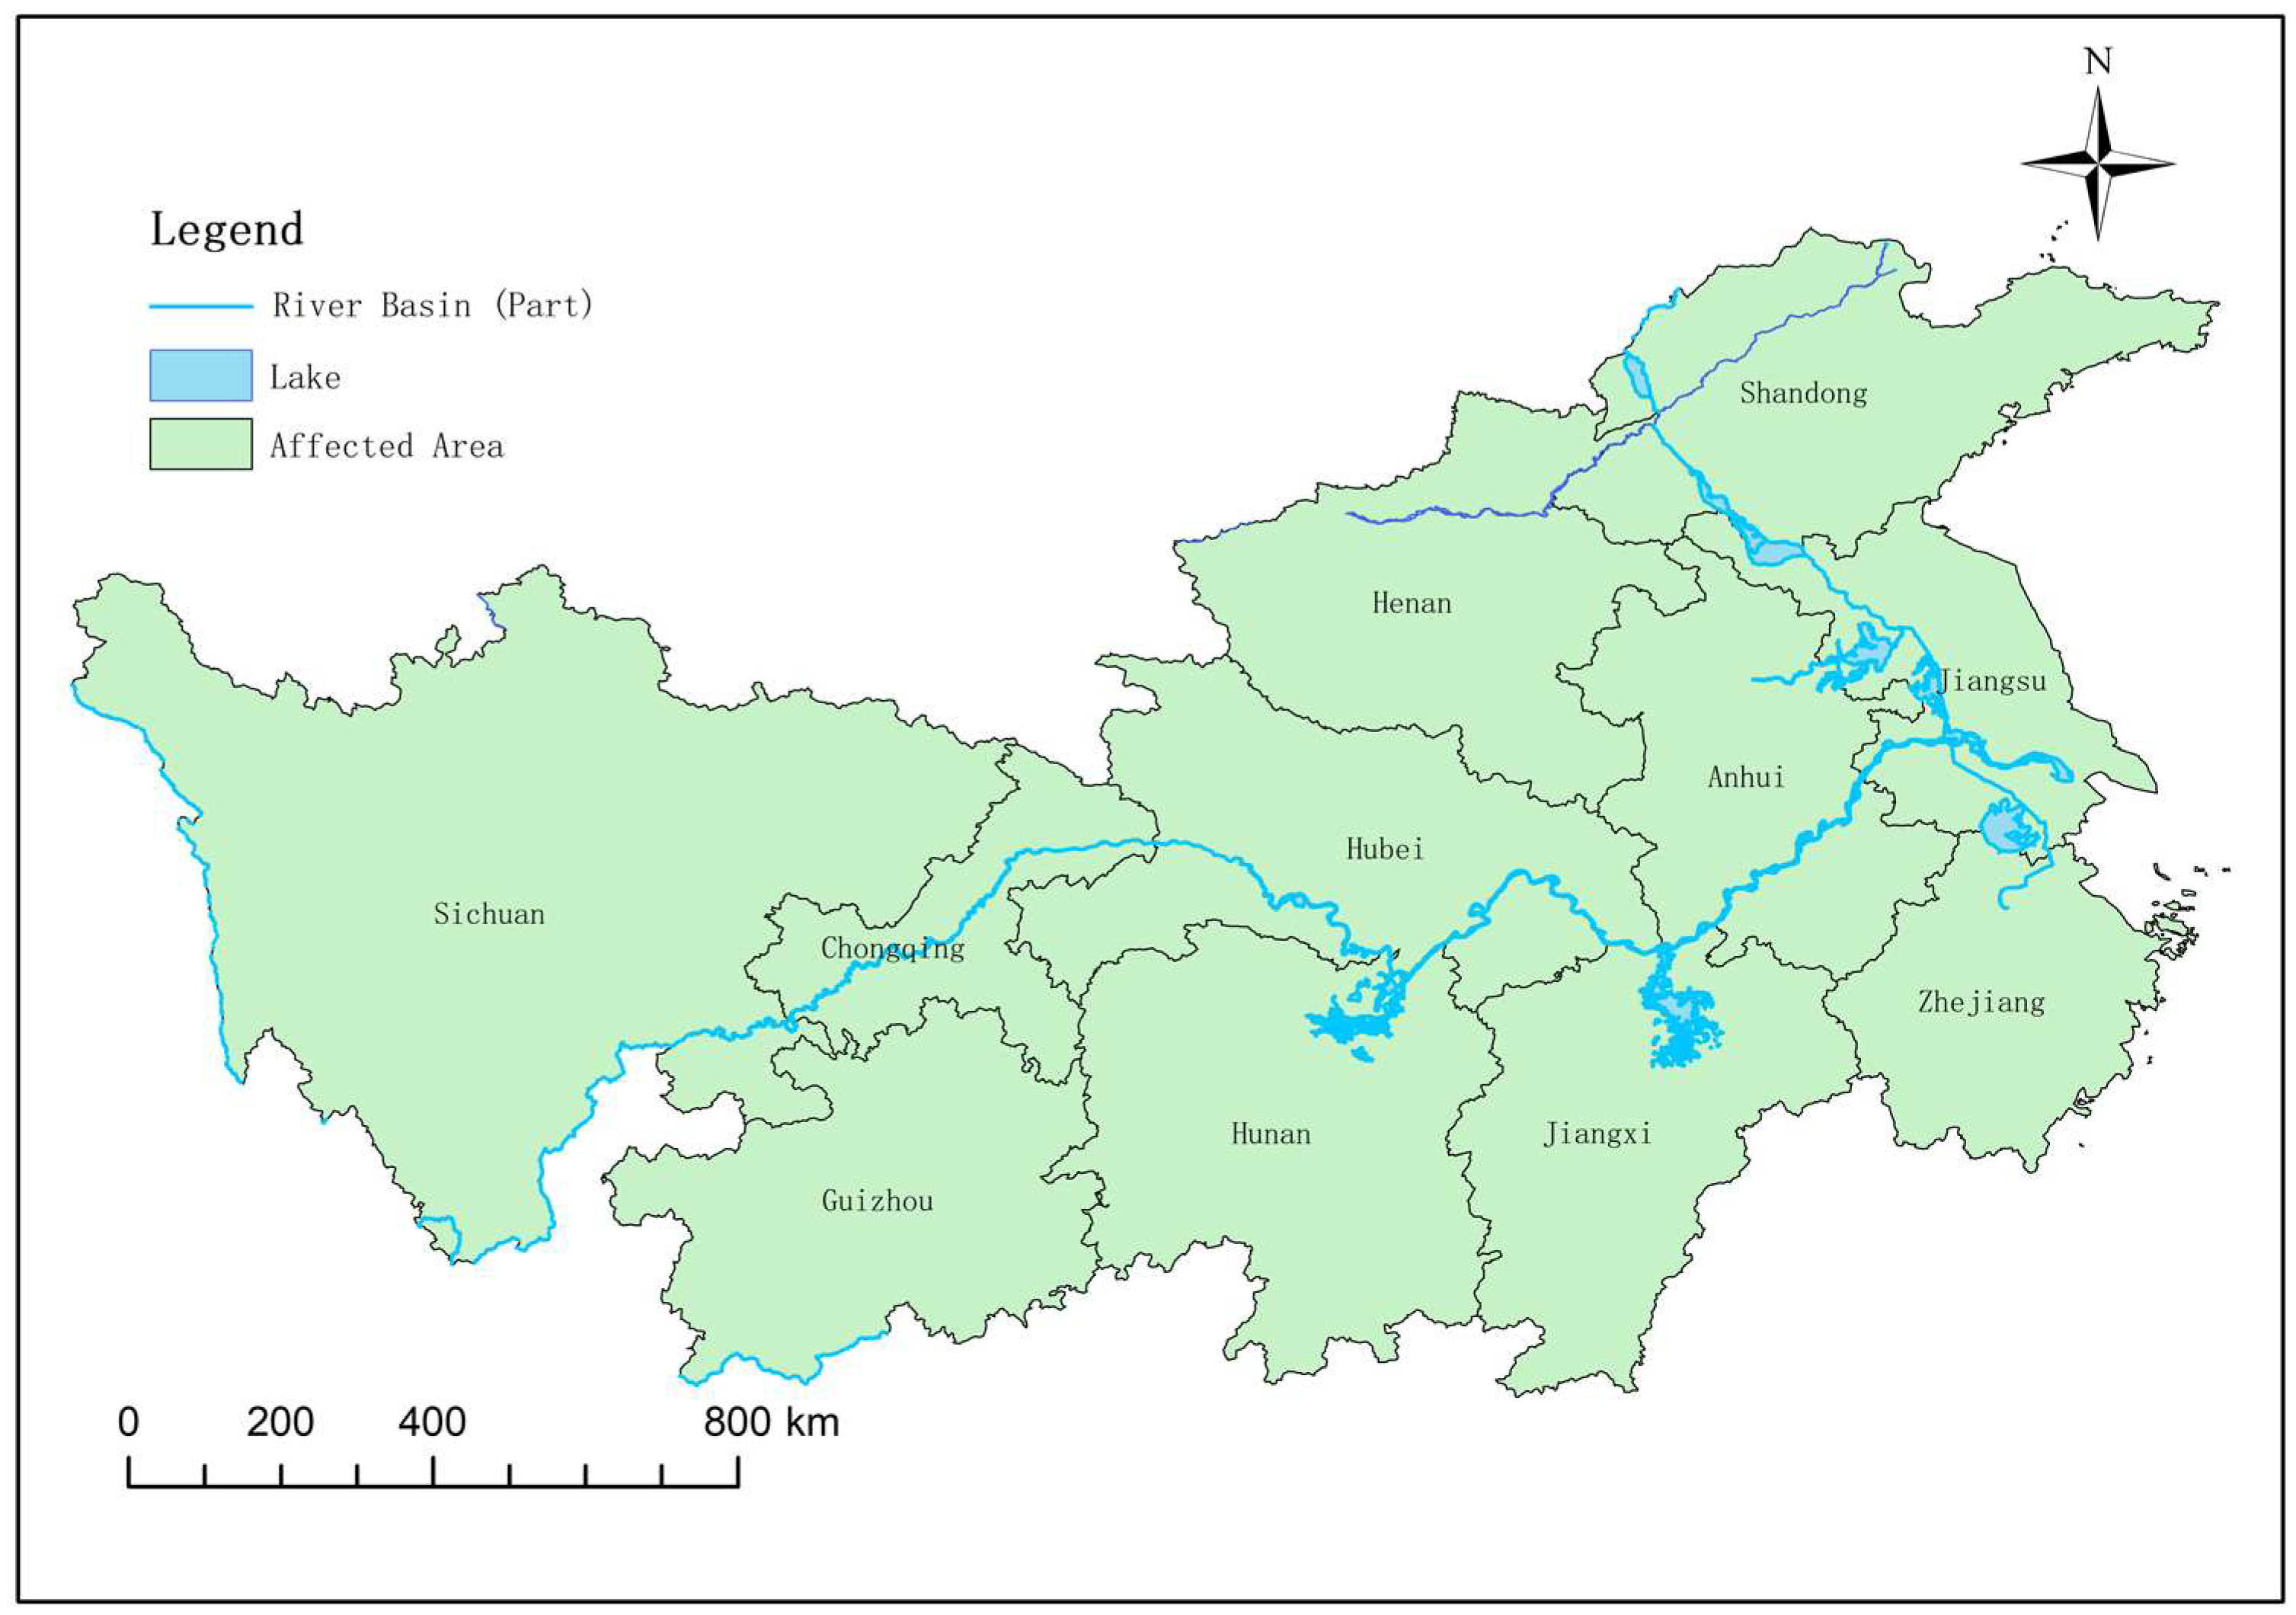
5.1. Brief Introduction

The Yangtze River is a flood-prone area, and large or small floods occur every summer. We selected the “Extraordinary rainstorm and flood disaster in the Yangtze and Huai River Basin in July 2020” as a research case. The flood caused a total of 34.173 million people in 11 provinces (municipalities)—Anhui, Jiangxi, Hubei, Hunan, Zhejiang, Jiangsu, Shandong, Henan, Chongqing, Sichuan and Guizhou—to be affected. Figure 13 shows the study area.

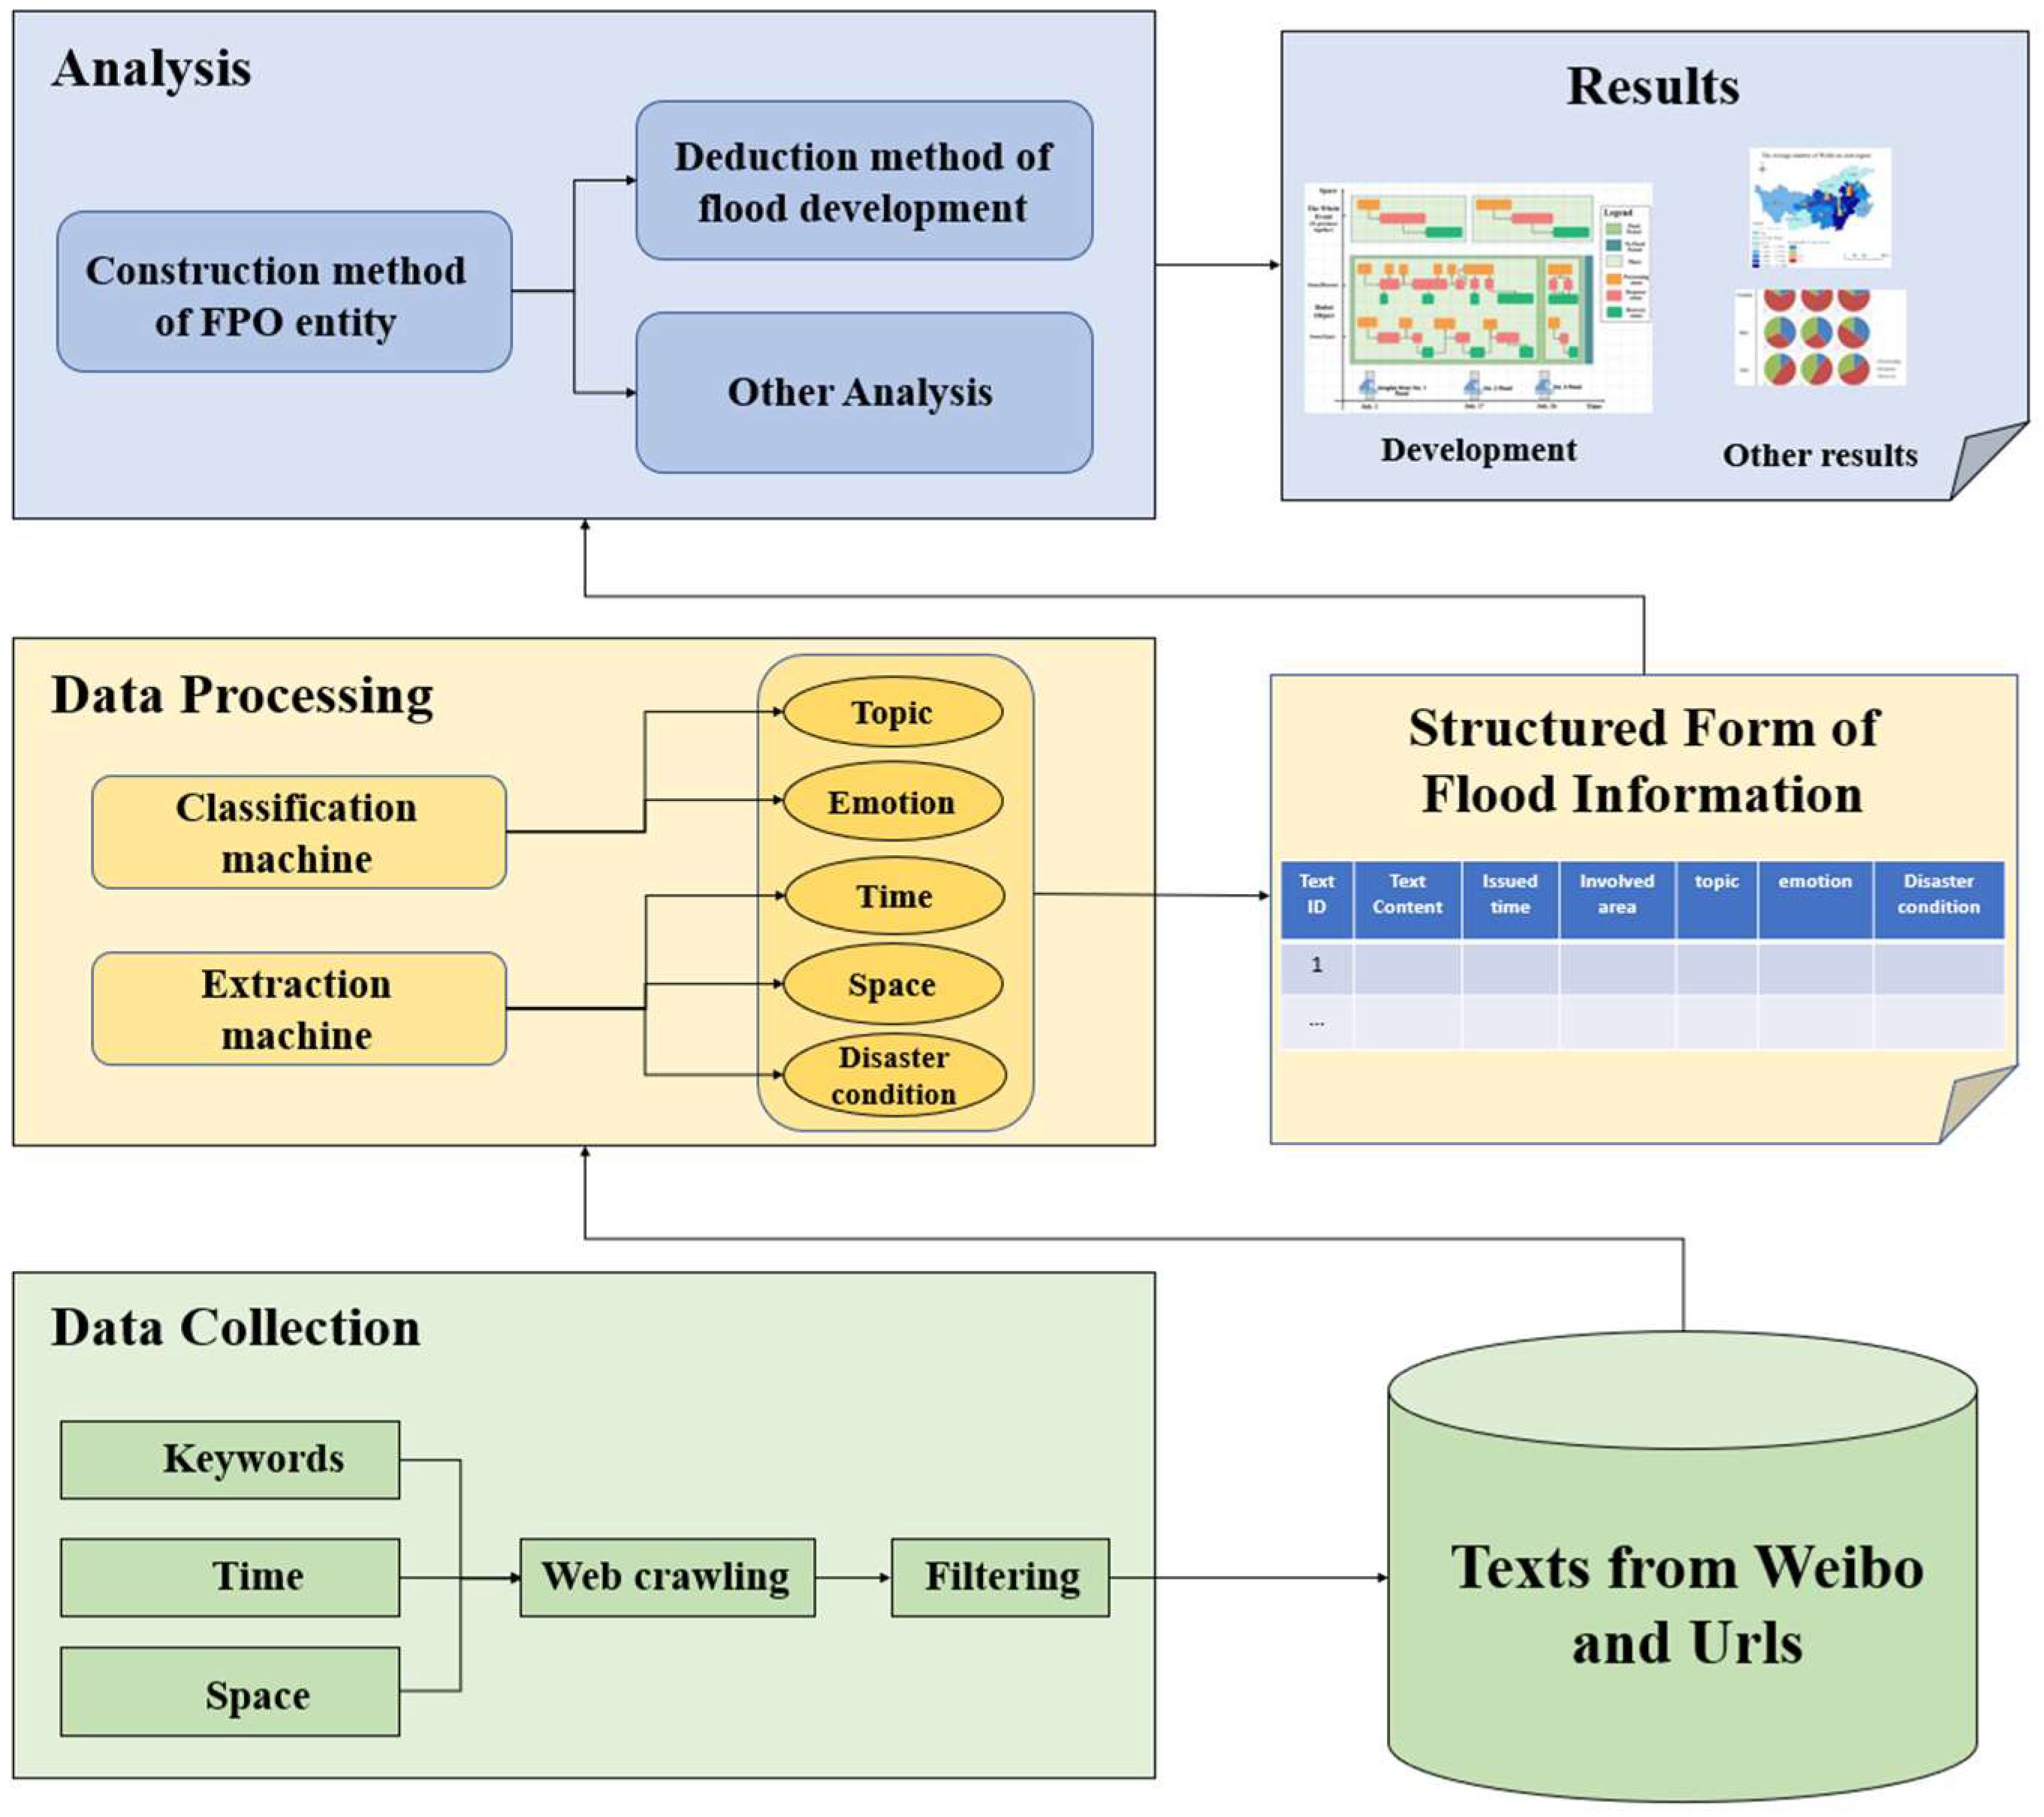
5.2. Experimental Procedure

Guan and Chen [47] indicated that the information released by local emergency management agencies and other government is still the most valuable source of disaster-related information. Thus, in the case, we conducted information retrieval based on keywords, temporal information, and spatial information. We used crawler tools and filtering methods to obtain 5428 Weibo texts from official certified accounts. Using the CRF model, LDA, LSTM, and other machine learning methods, we extracted the time, space, topic, emotion, disaster, and other elements of each text. On the basis of text elements, we used our model and methods to organize the information and conduct analyses. Finally, we constructed a collection of FPO entities and deduced the development process. The flow chart is shown in Figure 14.

5.3. Results

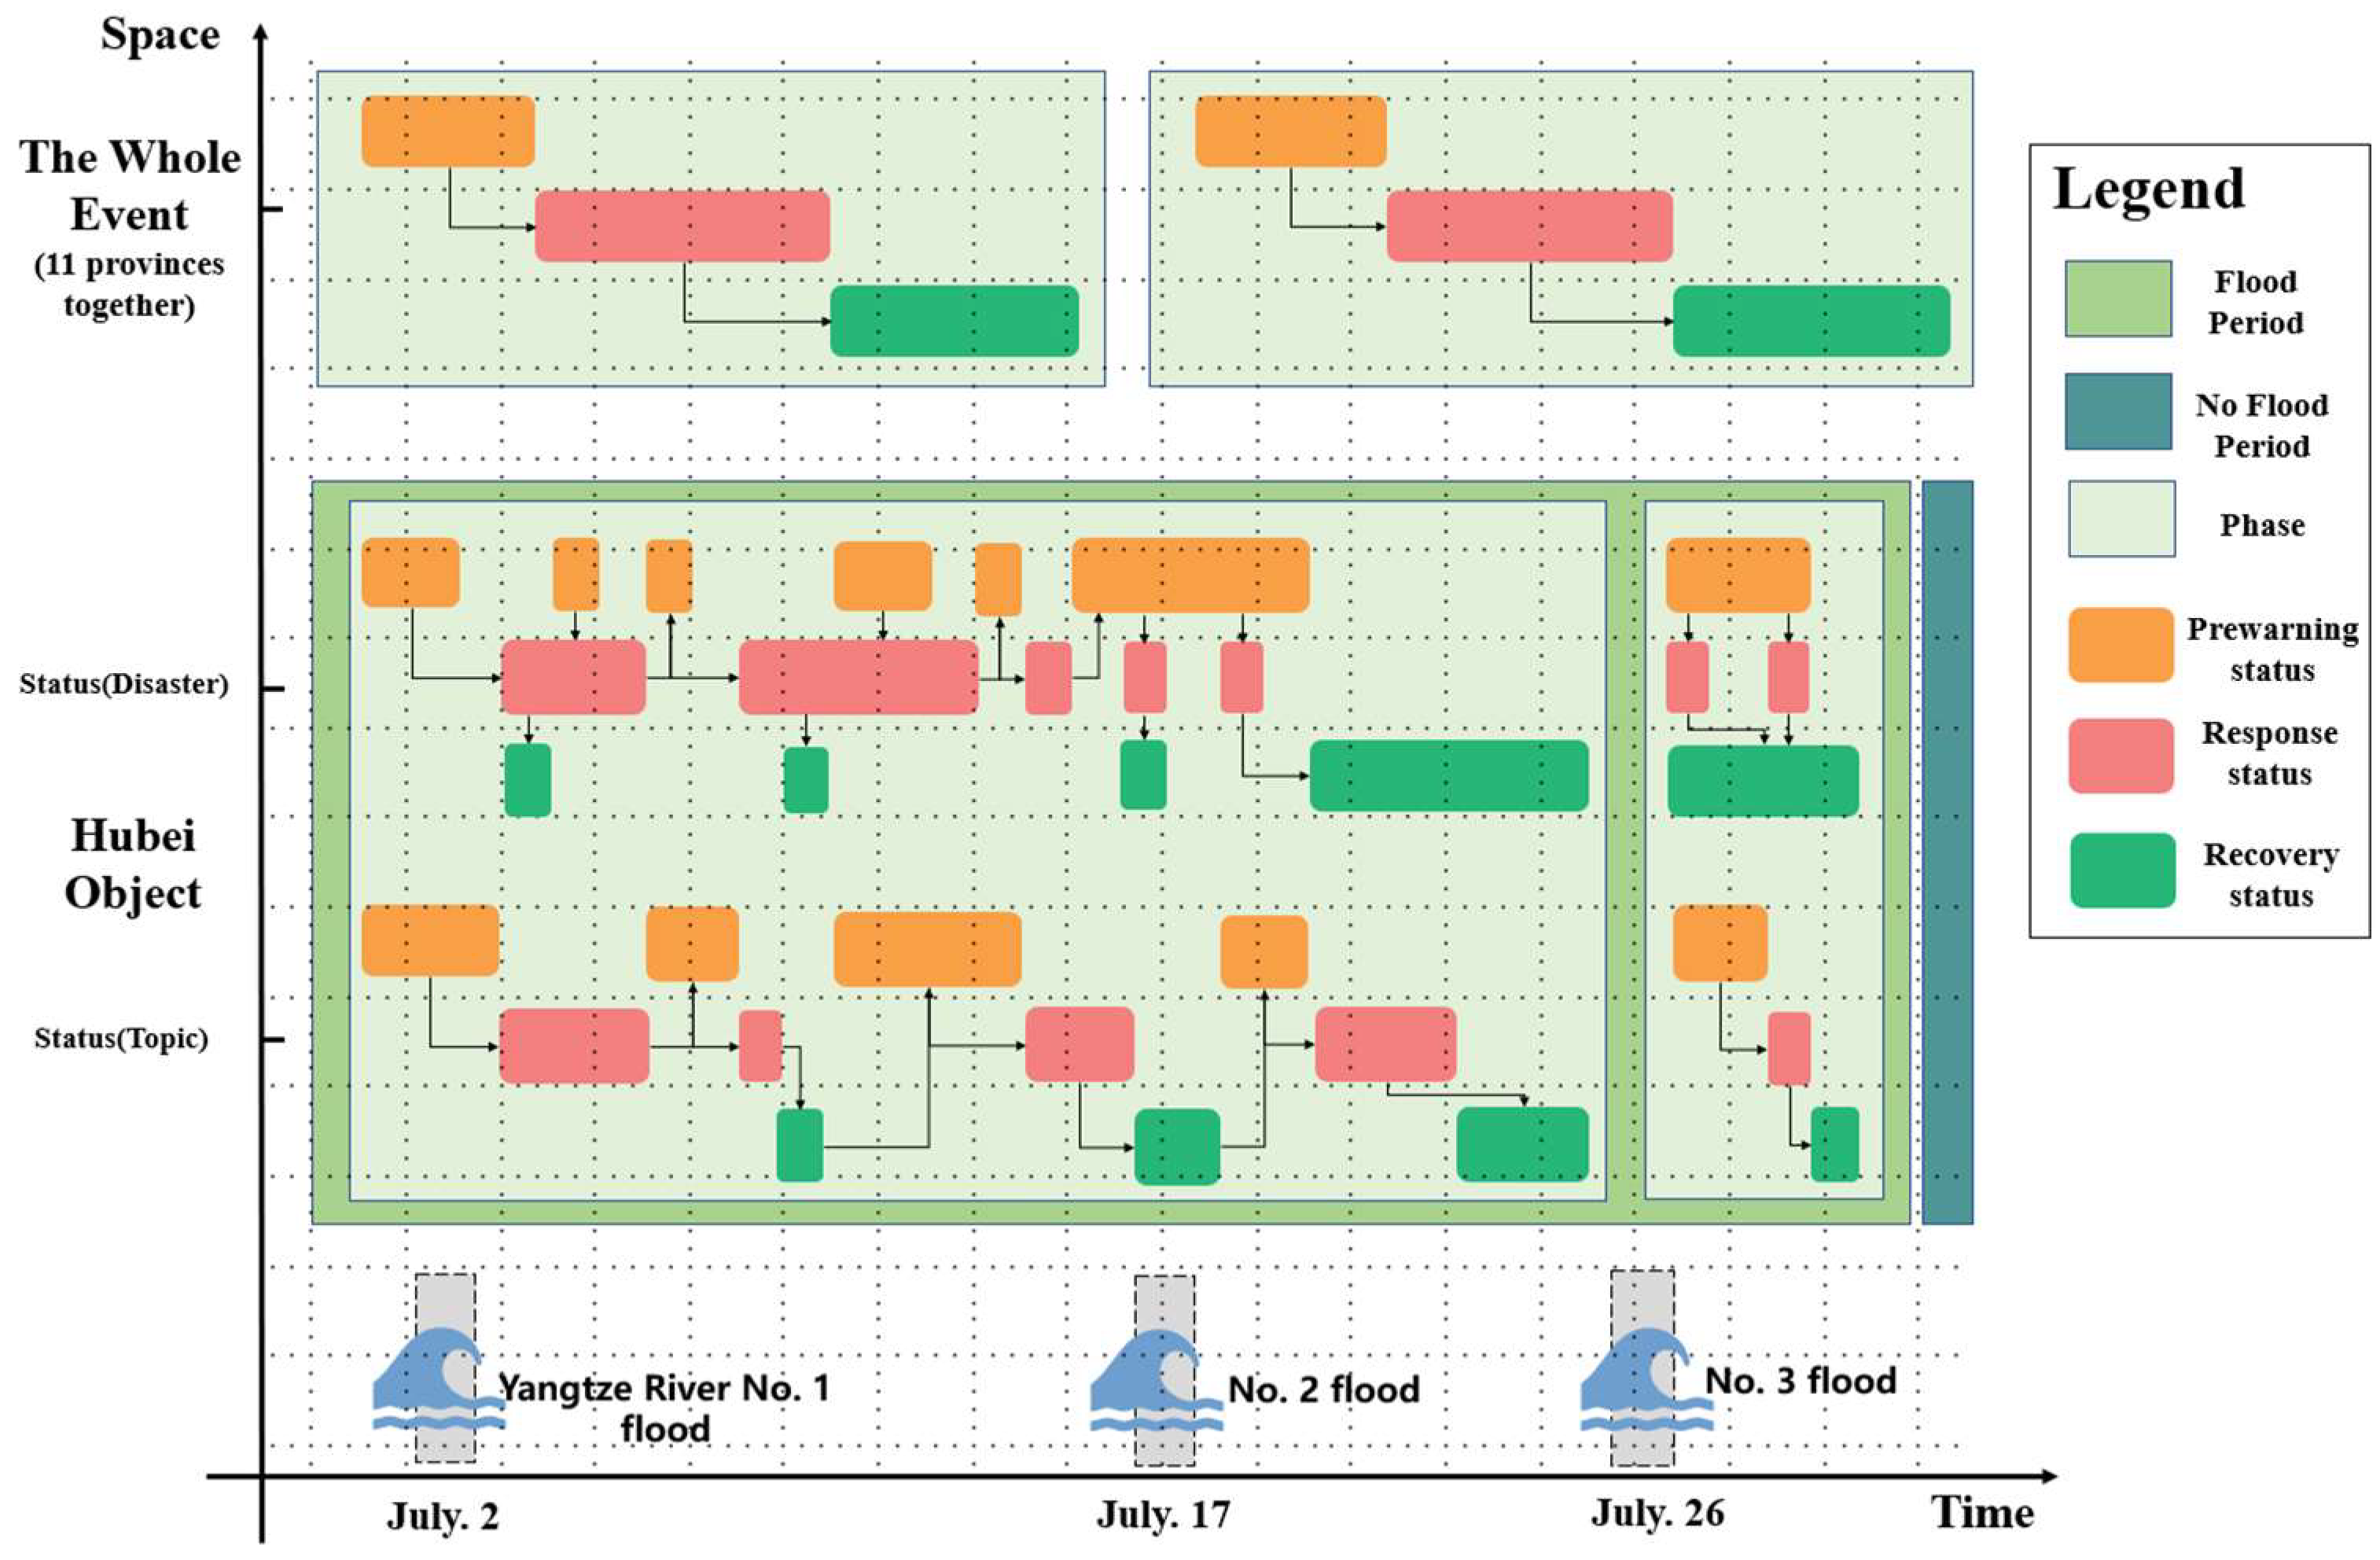
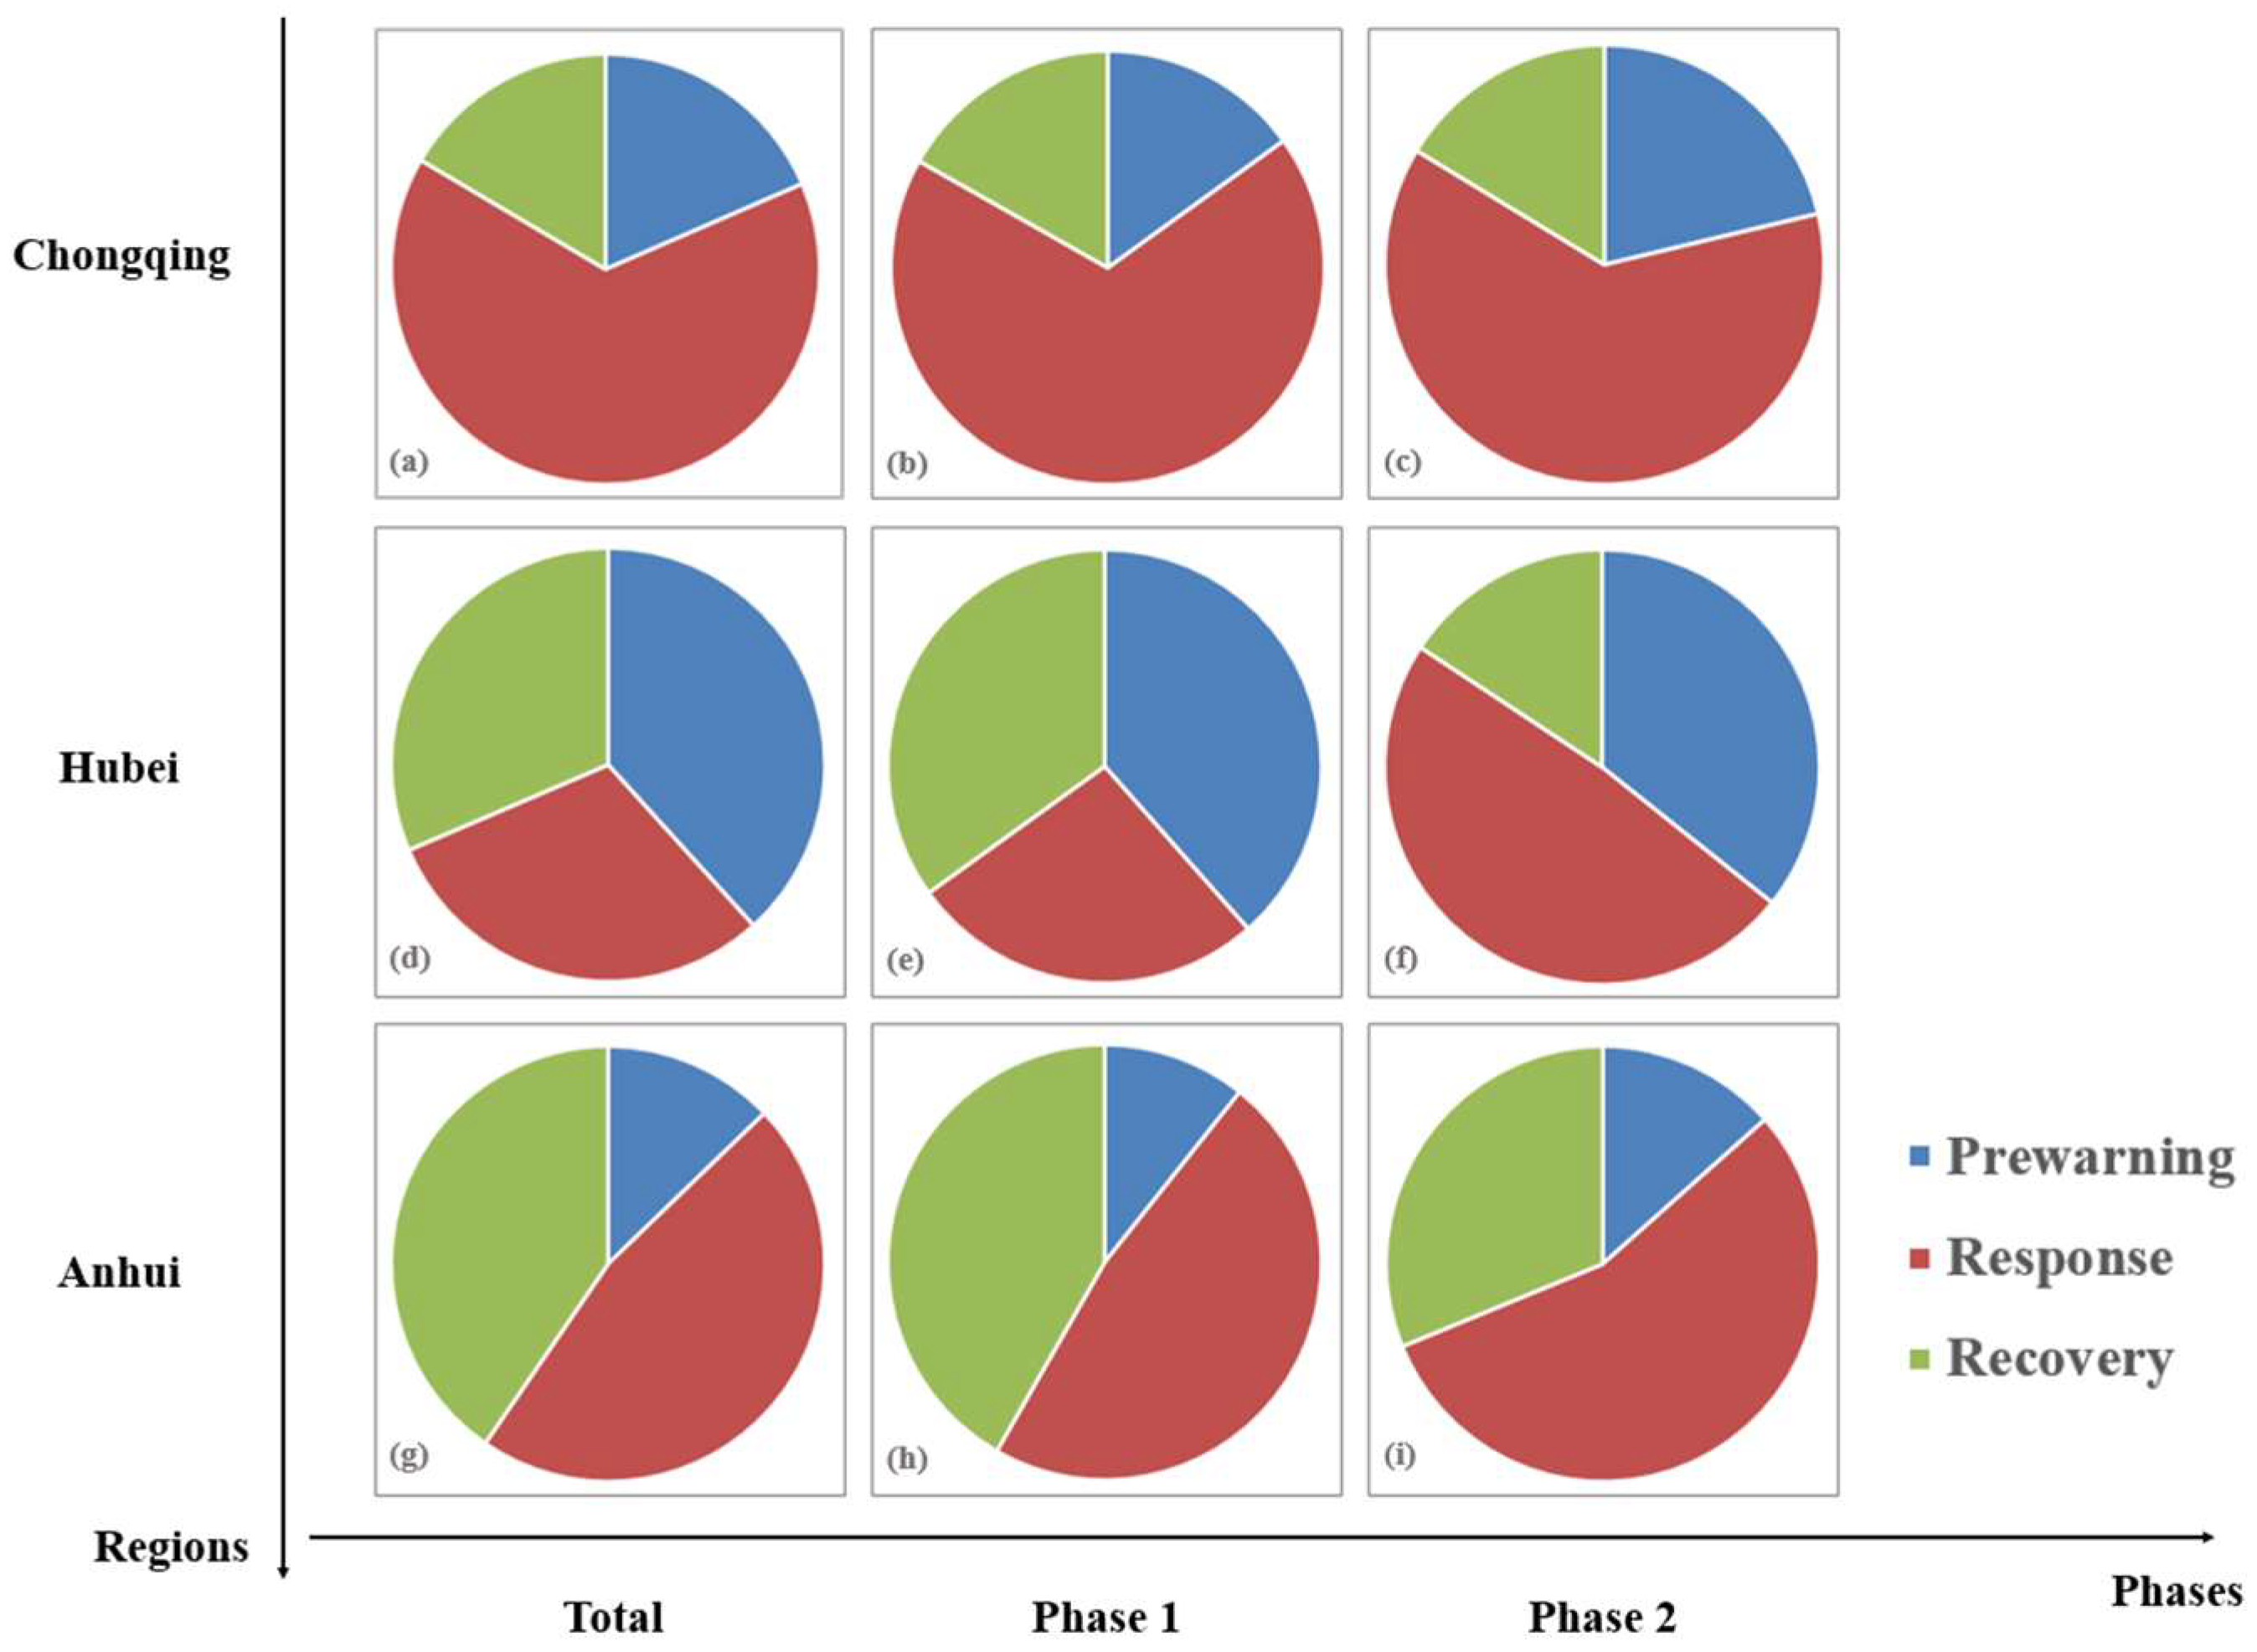
5.3.1. Flood Development Process

According to the process shown in Figure 14, the entity results shown in Appendix A were obtained using the FPO entity construction method. Then, based on the entities, the flood development process was deduced, as shown in Figure 15.
It was found that the entire flood event could be divided into two major phases caused by Yangtze River No. 1 flood and No. 2 flood in 2020 (the No. 3 flood covered a small area and did not cause a new round of disasters). Taking Hubei as an example because the impact of the No. 1 flood has not disappeared, the No. 2 flood was found to have violently affected Wuhan, so there was no obvious phase decomposition. The No. 3 flood began to affect Hubei after the No. 2 flood, resulting in a new phase. This was basically the same as the real situation.
It is worth mentioning that Figure 15 depicts a phenomenon in which the topic entity on the same day has a status that may not be the same of that of the disaster entity because the prewarning topic was focused on the previous day. Therefore, topic entities in the same status are often developed after or at the same time as the disaster entity.

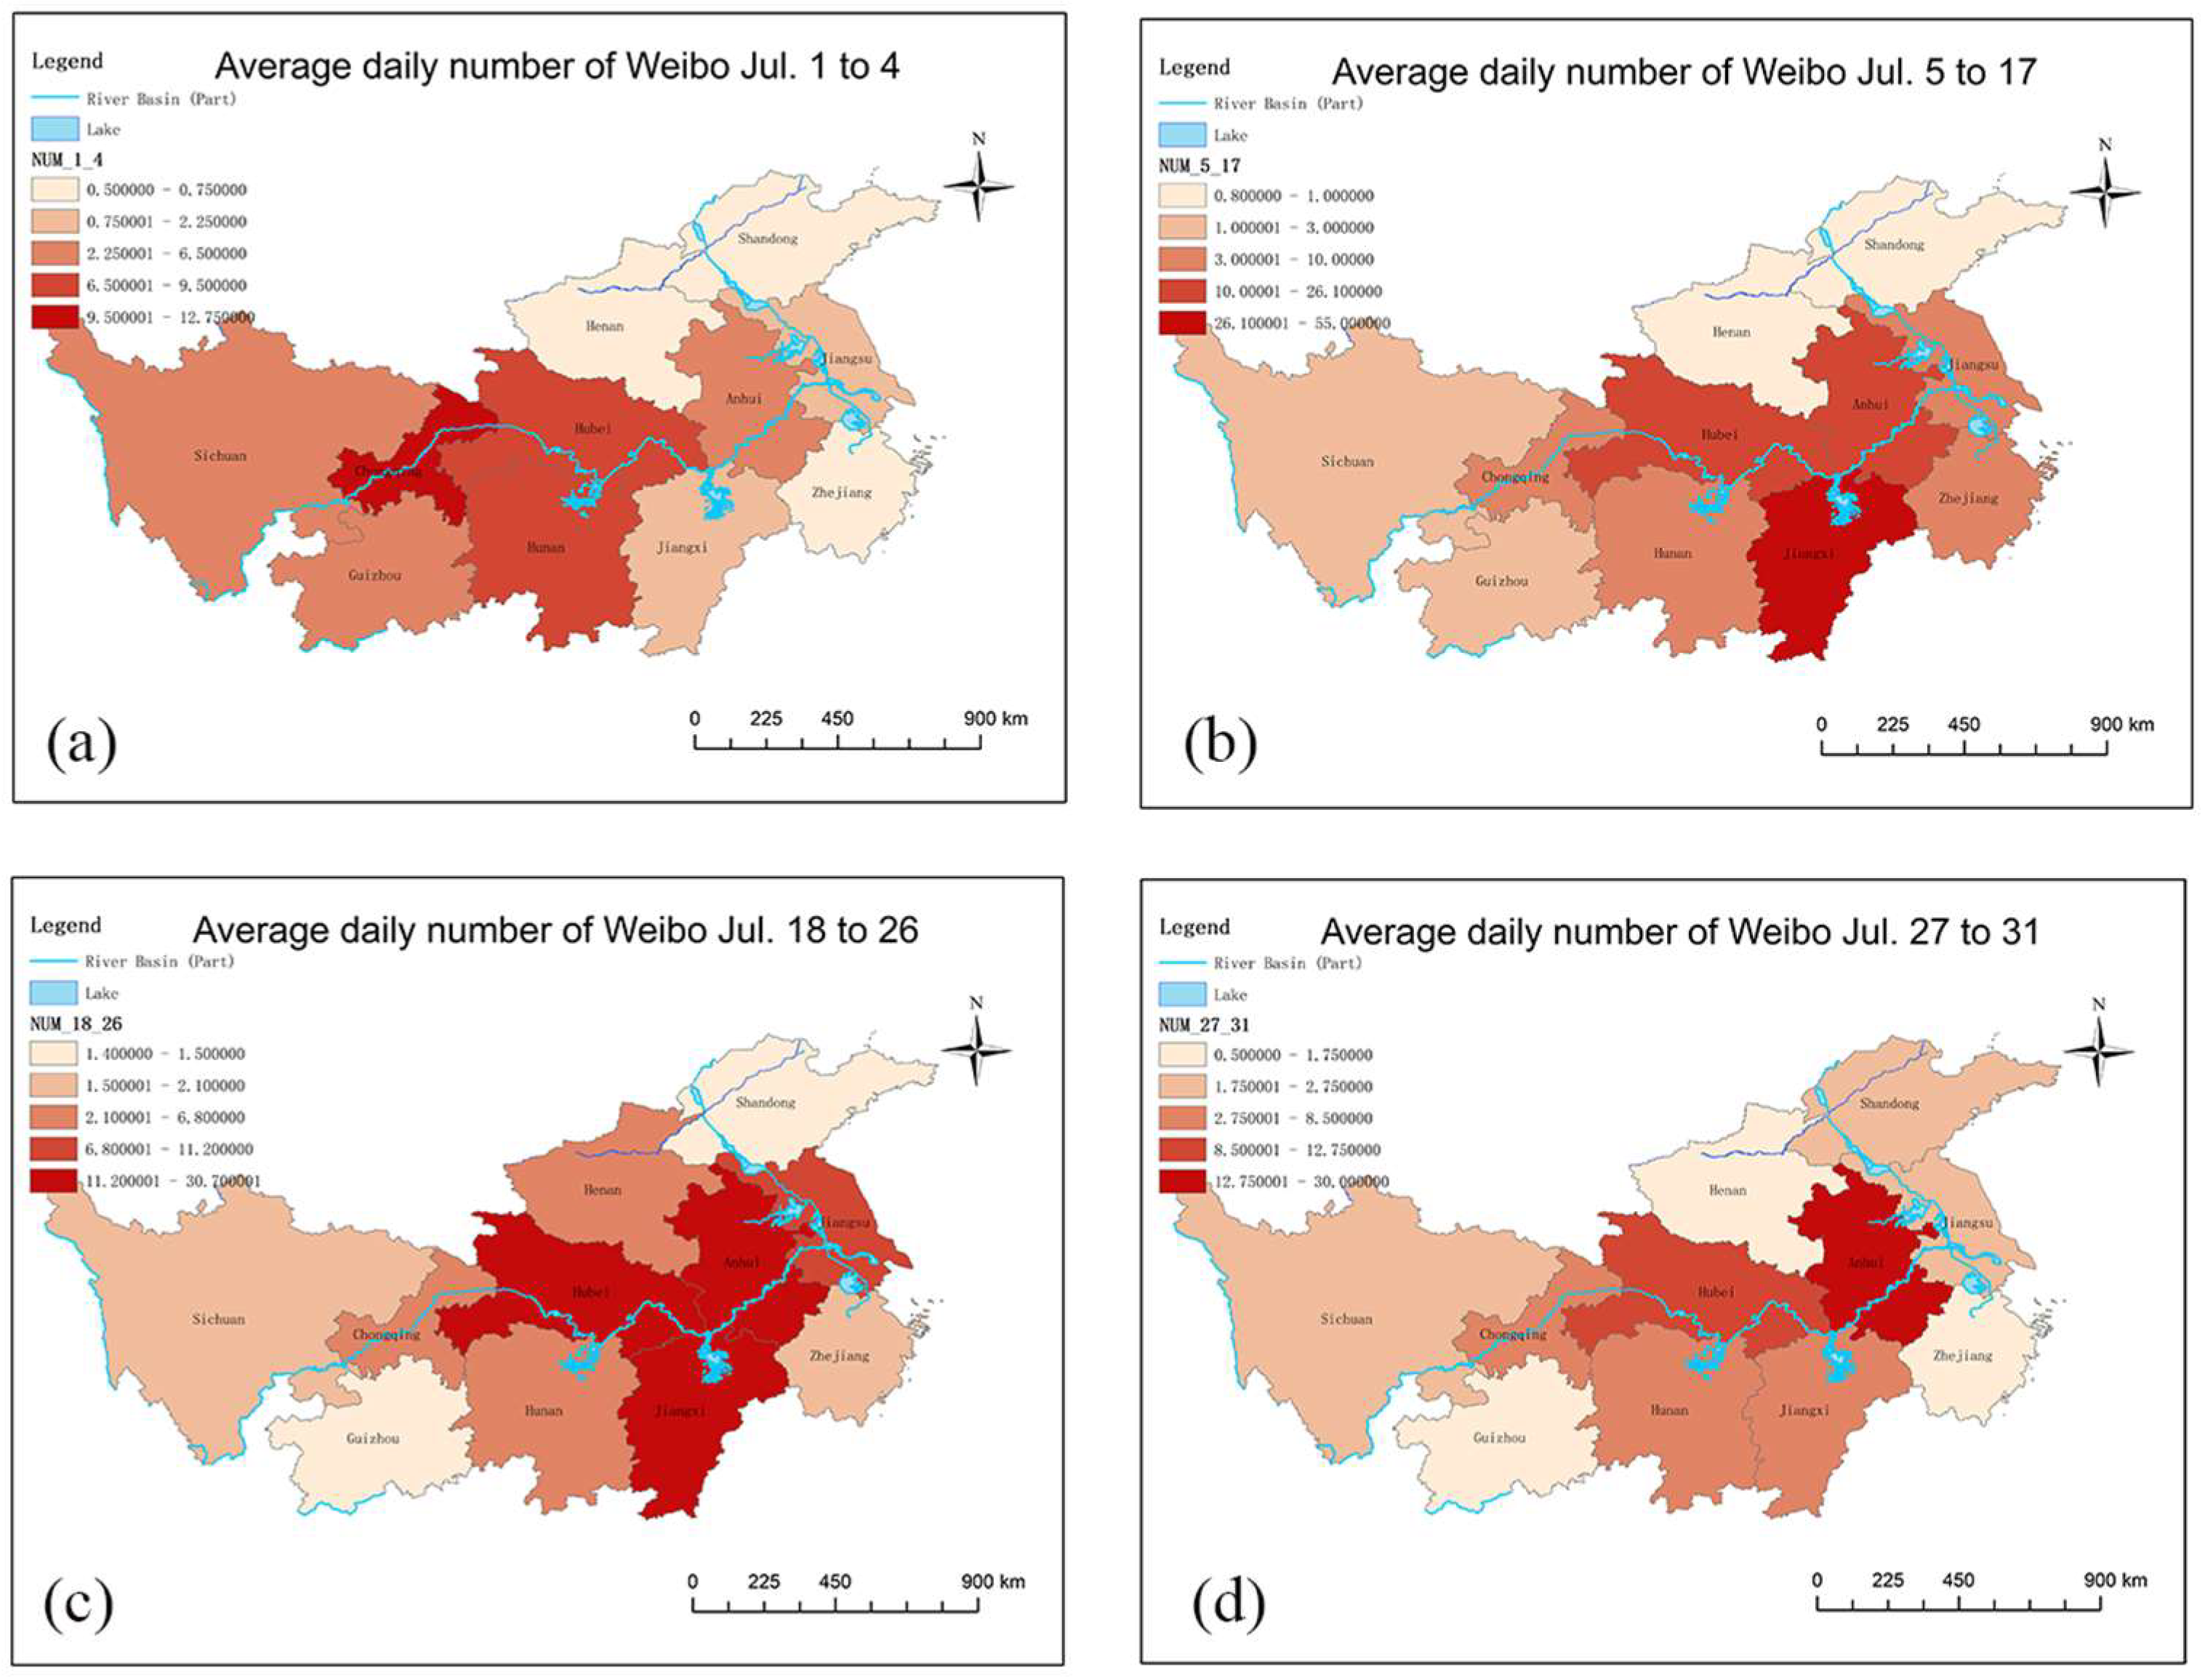
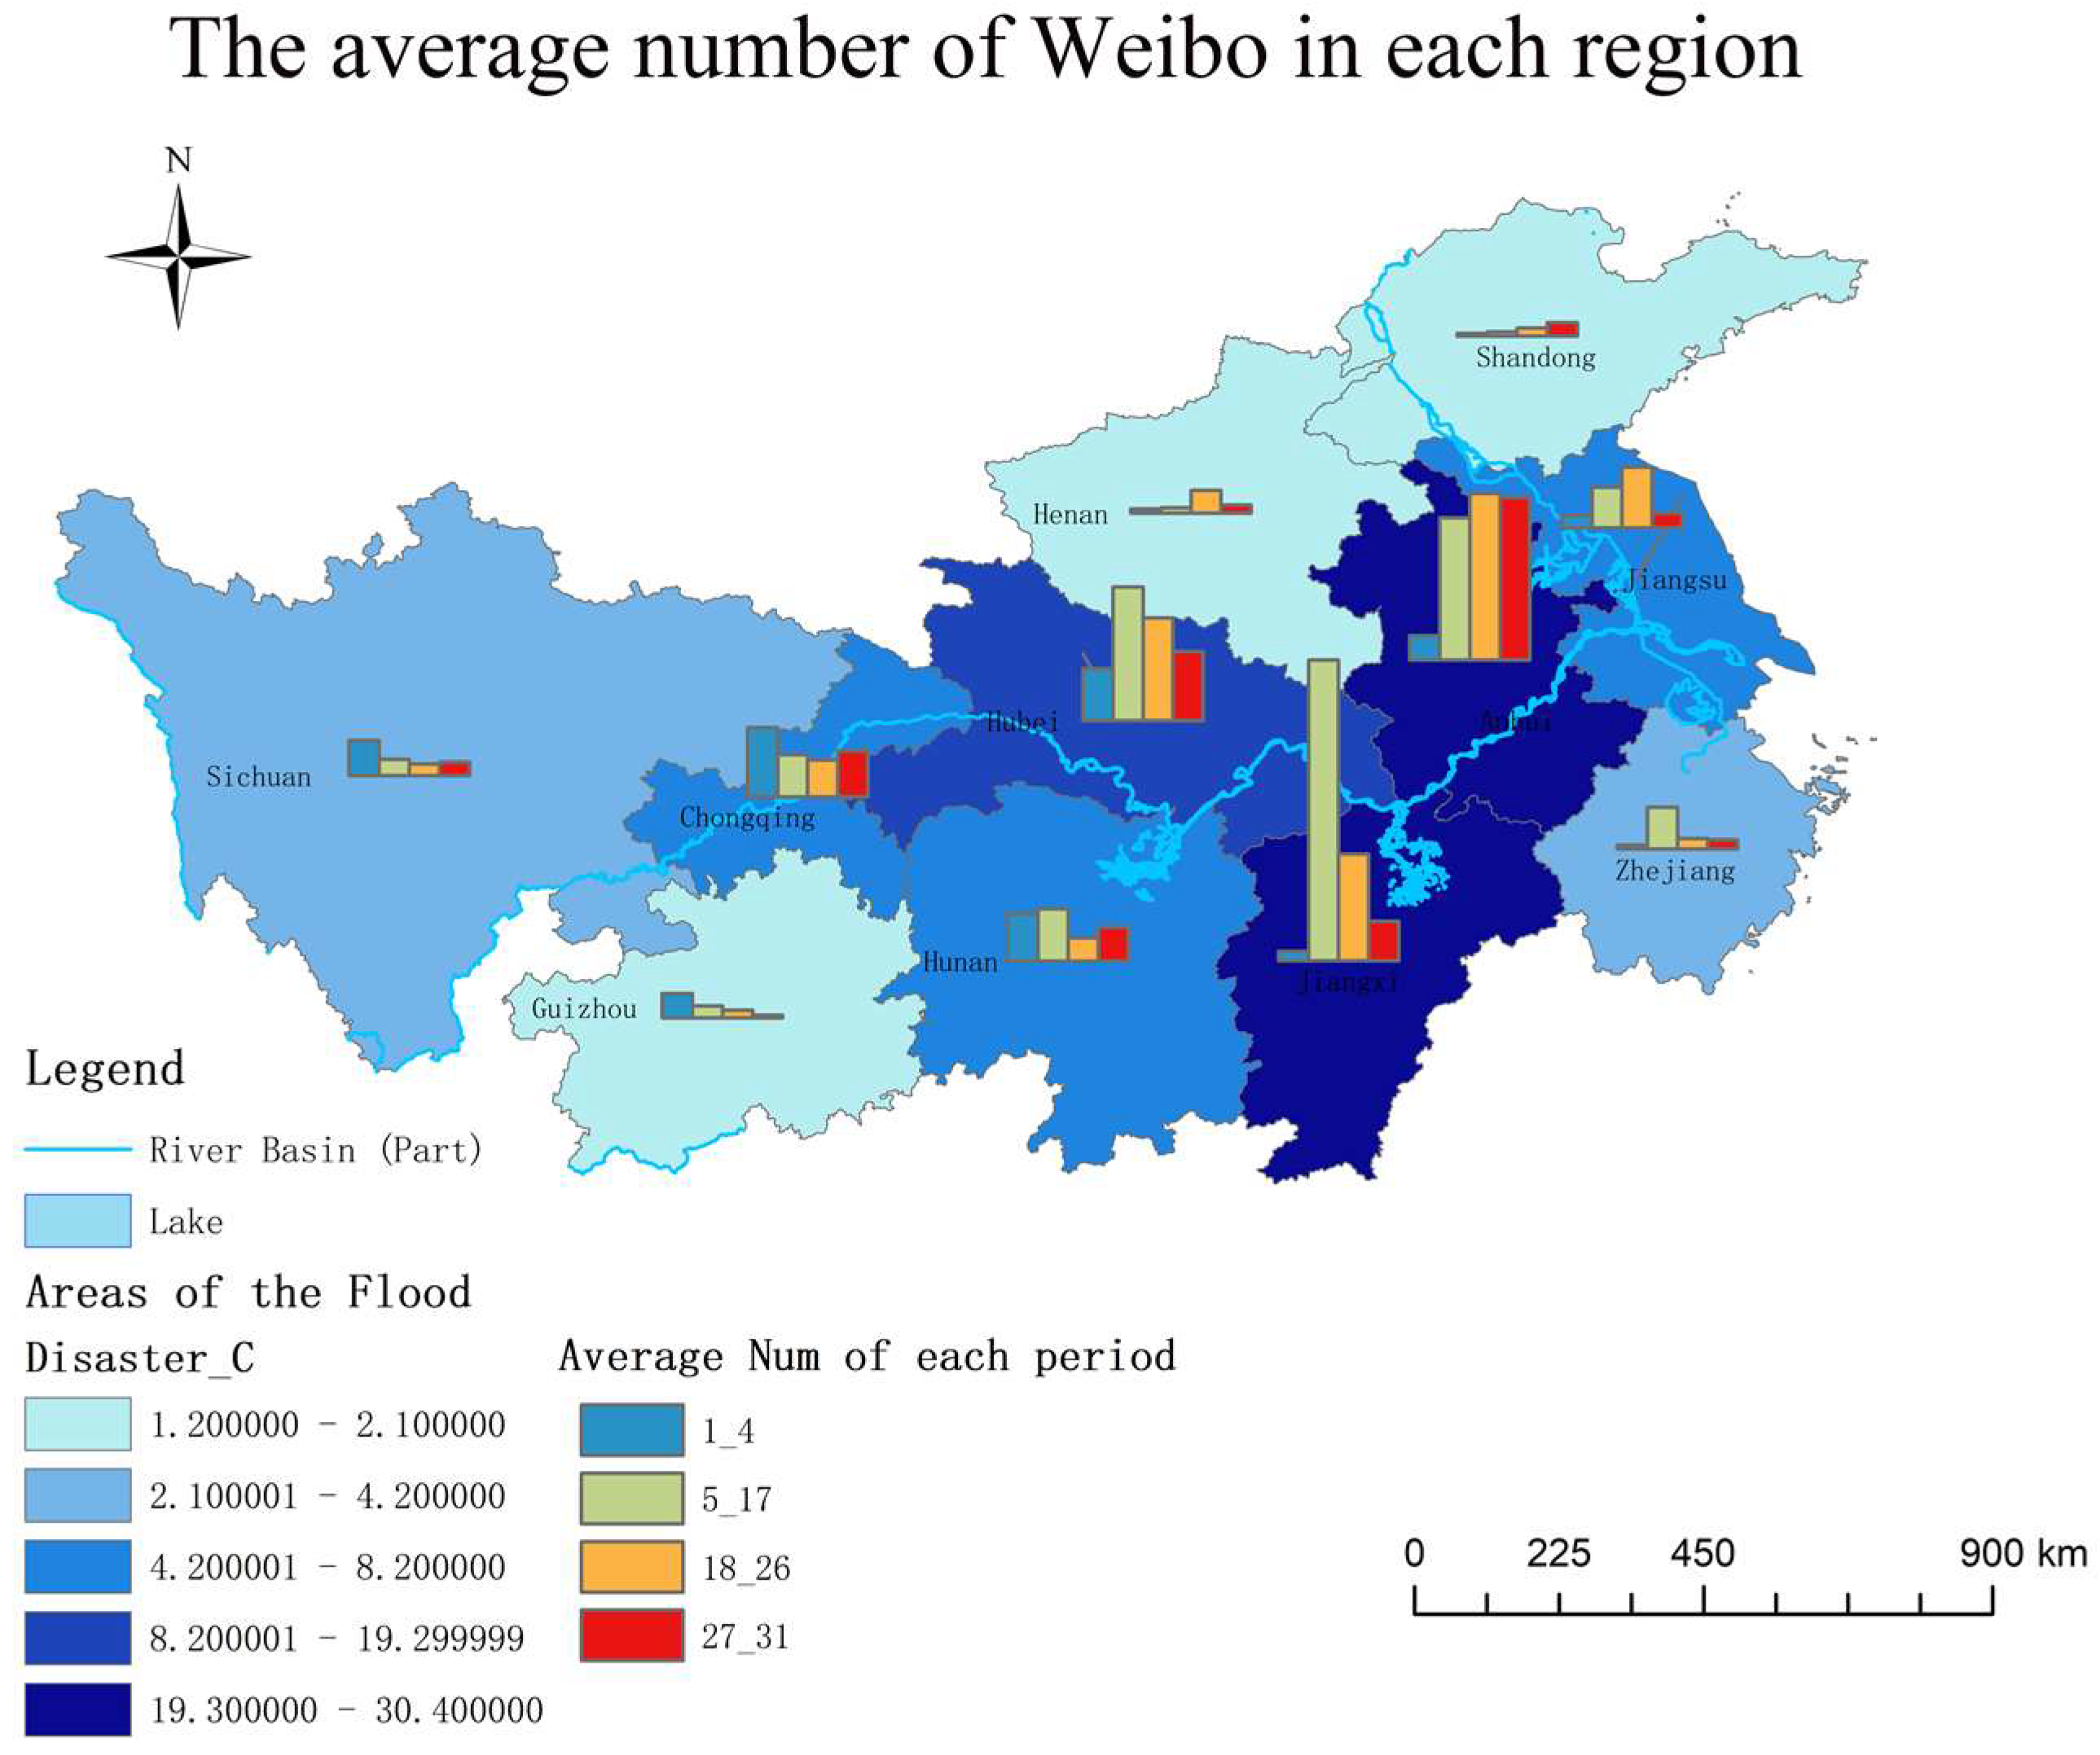
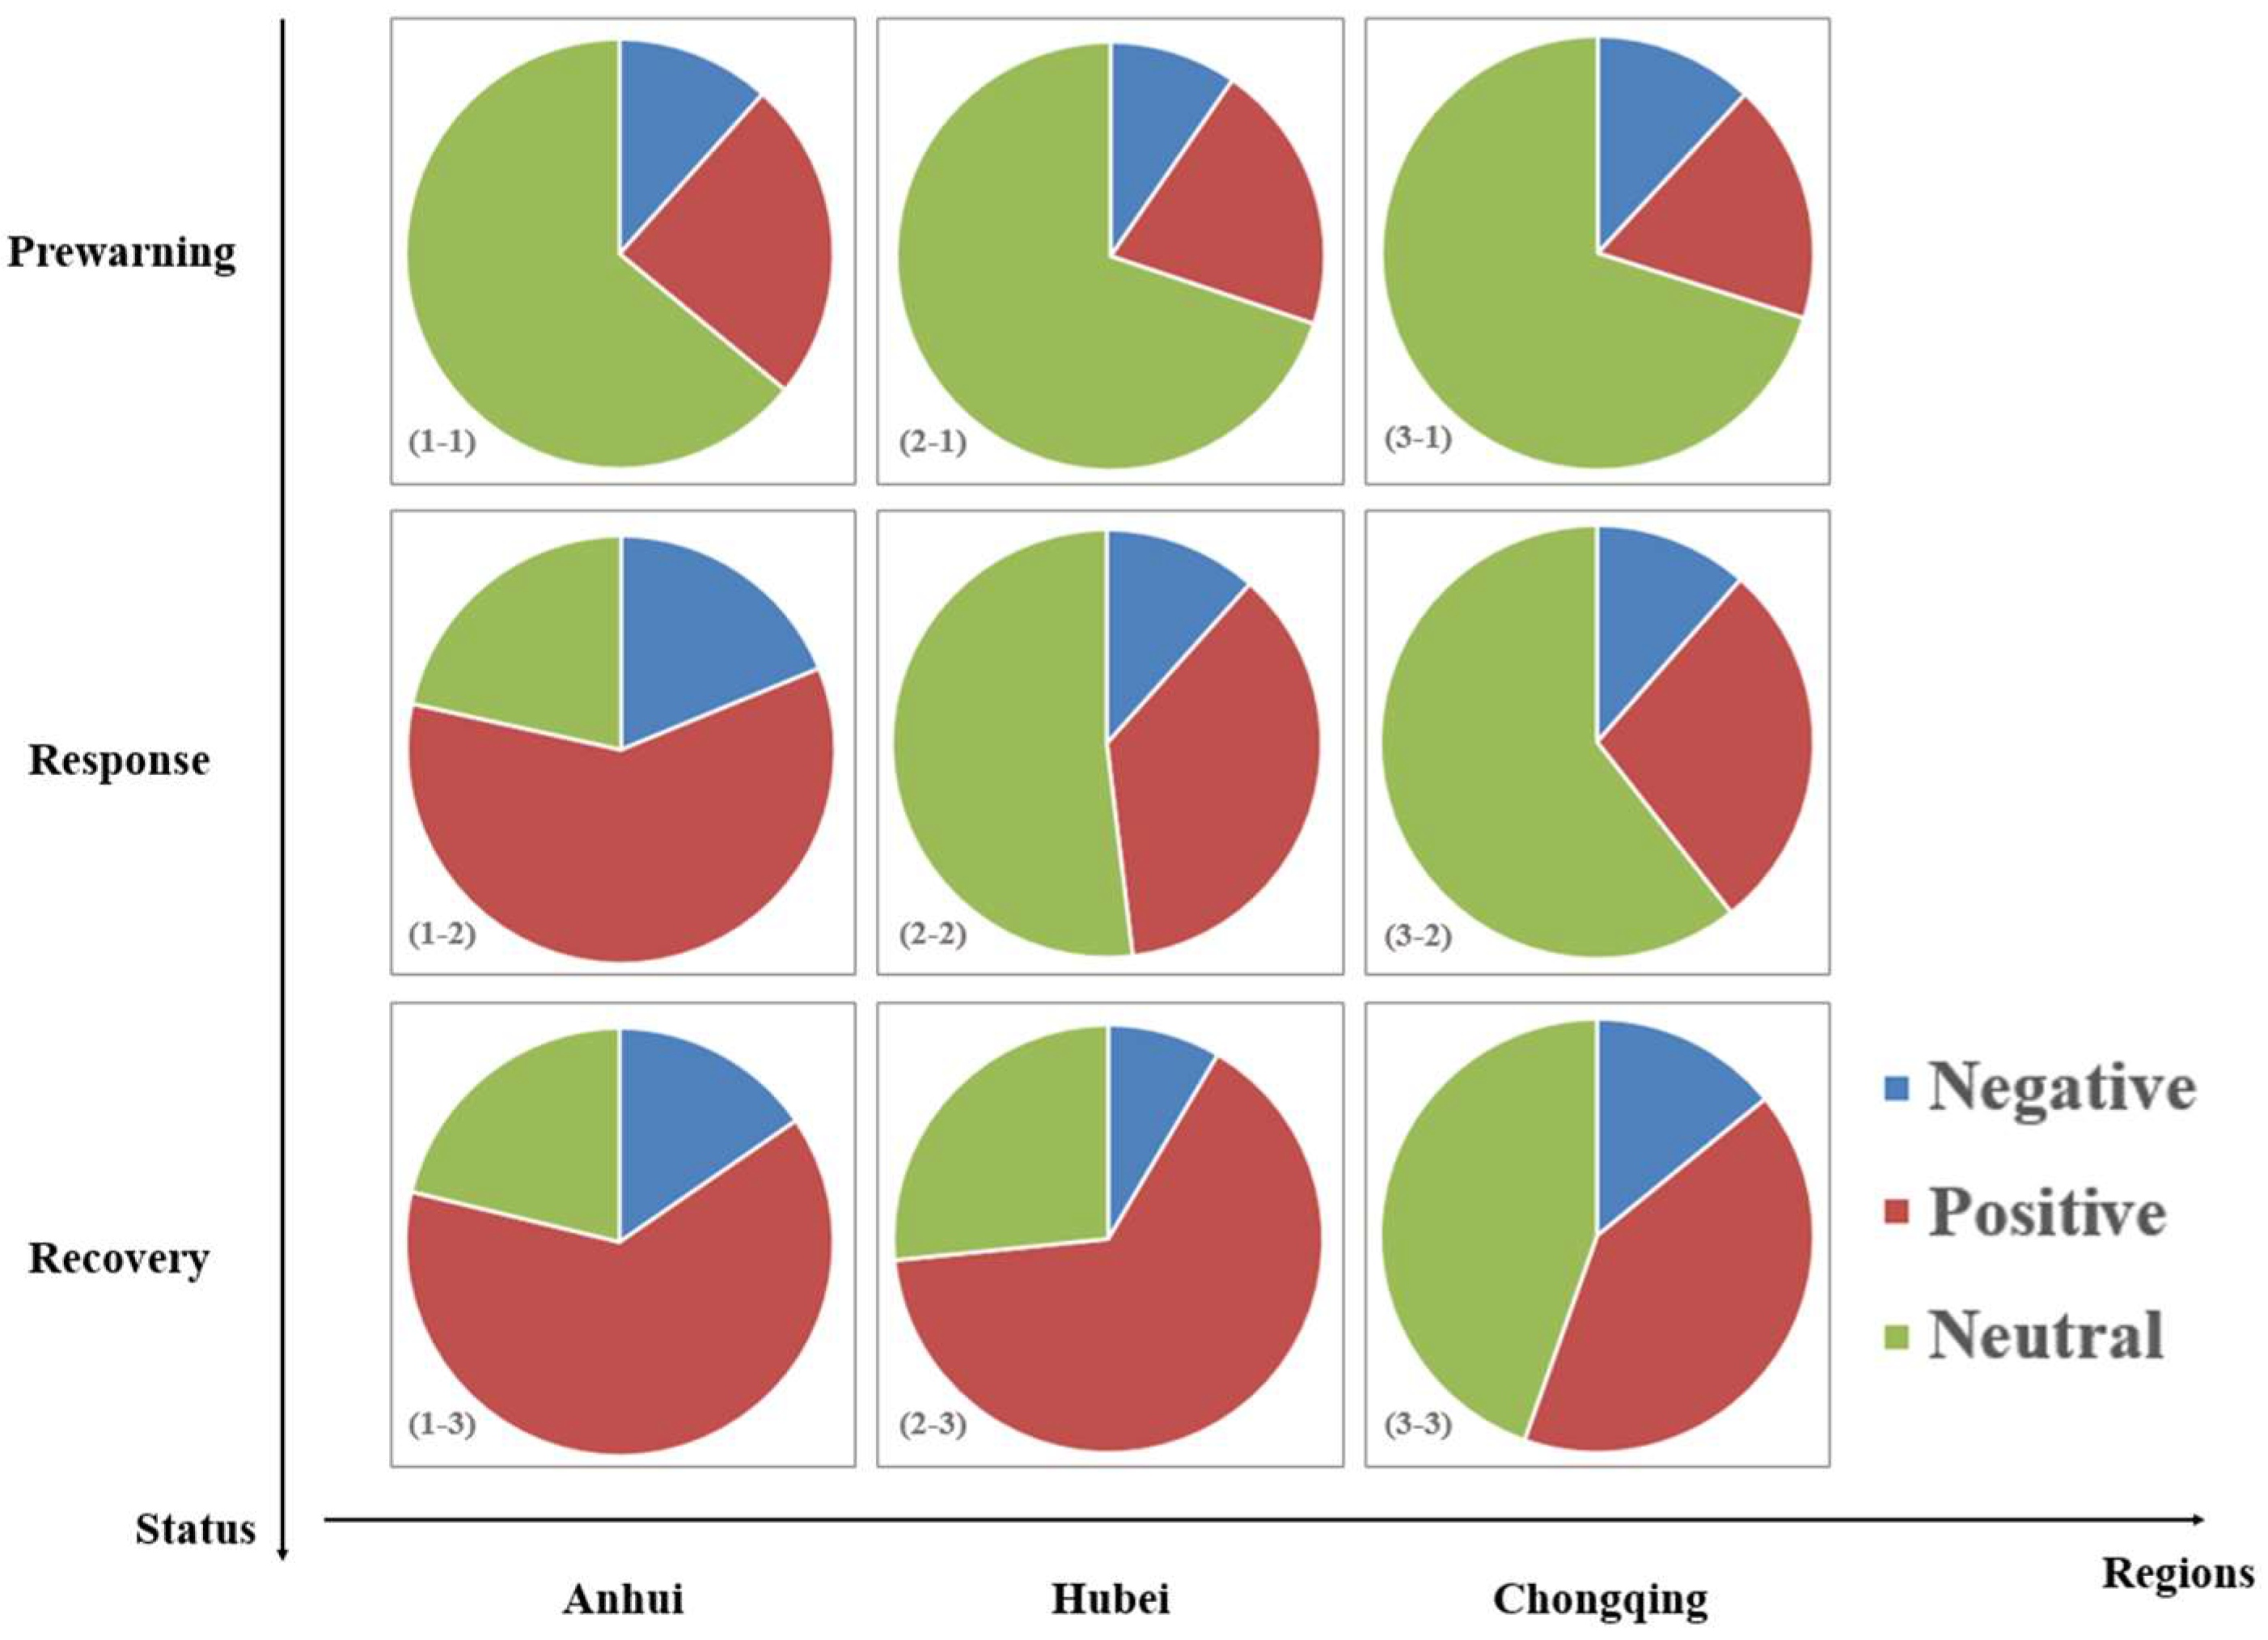
5.3.2. Spatiotemporal Analysis

One of the benefits of the EMMFPO is that the data are effectively organized by location and time so that spatiotemporal pattern mining can be better performed.
First, based on object entity, the model studies the overall trend of changes in spatial dimension and attempts to find the path of the flood-affected area.
Considering the timing of No. 1–3 Yangtze River floods, the event was divided into four periods for analysis. Since the No. 1 flood occurred on the July 2, which was only one day after the start date, July 4th, when the warning began to appear in all areas, was set in place of July 2.
We analyzed the average number of Weibos in each region at each period. We believed that the number of Weibos has a certain correlation with the degree of disaster, as verified in some previous studies [17,39,42], and the results are shown in Figure 16.
The flood first affected the western region, especially Chongqing. Then, the scope of influence gradually spread to the east, with Jiangxi being the most seriously affected. As the No. 2 flood hit, the range continued to move to the northeast, and the Huai River basins such as Anhui and Jiangsu were severely affected. Finally, the impact of the flood gradually decreased.
To further explore the changes in each region, we made a graph of the average number of Weibos in each region during different periods, as shown in Figure 17. The western regions generally fell first and then increased or kept falling with a relatively flat trend. The central and eastern regions showed a trend of first rising and then falling; among these, Anhui was found to be at a relatively high level.
Second, based on phase and status entity, we investigated patterns of topic and emotion.
According to the analysis discussed above, we selected three provinces, Chongqing (western), Hubei (central), and Anhui (eastern), for research. We analyzed the proportion of different topic statuses in each phase and explored the emotional trends in each status. The results are shown in Figure 18 and Figure 19.
According to Figure 18, each area had relatively similar characteristics at different phases, that is, the proportions of each status were close. However, the second phase of Hubei was quite different from the first phase. We assumed that this was because the second phase only lasted 5 days and the rainstorm in Hubei at this phase was rapid, so more attention was paid to the emergency response. In addition, three areas presented different modes. We assumed that more severe a flood, the larger the proportion of recovery. Figure 19 shows that the number of positive texts increased as the status evolved (“prewarning, response, recovery”, “before, during and after the disaster”). At the same time, a greater region severity was correlated with less neutral texts.
By excavating the spatiotemporal patterns of the flood event, we found that there were different spatiotemporal patterns in different regions and constant stages. Generally, a greater region severity was correlated with a larger number of Weibos and more emotional texts. Thus, the government should pay more attention to areas where there are more emotional texts and the number of Weibos is rapidly increasing. The spatiotemporal patterns of Weibo have a decisive place in quickly determining the flood situation.

6. Discussion and Conclusions

6.1. Discussion

We propose a new data model and two new methods to realize the transformation of massive, messy and redundant data into a clear flood event development process. Through a specific case study, the validity of the model and methods was verified. We successfully deduced the development process of a flood event between regions. The flood first affected the western part, represented by Chongqing, then affected the central part, represented by Hubei and Jiangxi, and then affected the eastern part, represented by Anhui. The development process within each region was also evaluated. With Hubei as an example, the No. 1 and No. 3 floods were shown to lead to two phases. The first phase lasted for a long time and had a serious impact. These conclusions were consistent with the real situation, which confirms the validity of the methods proposed in this paper.
Next, we focused on the practical use of the data model and methods in this paper. First, the case study provided out the spatiotemporal patterns to prove that the EMMFPO could effectively organize and manage the FPO data through object, phase and status entities. By analyzing the element information from the model, such as the topics and emotional situation of phase and status, it was possible to quickly perceive the current situation of flood disasters to help take emergency response measures in a timely and effective manner. Furthermore, we effectively visualized the situation and possible triggering conditions of the flood event. By accumulating a large amount of information regarding processes and related triggers, it will be possible to predict flood situations based on social media data and predict the development trend of events in advance. Additionally, a related system can be established to monitor and visualize flood information in real time with the presented model and methods so that the public can more directly and quickly understand a flood disaster situation, which can help aid disaster avoidance and reduce injuries and property loss. The government can also monitor current topics and emotions through the system to conduct strong public opinion management and provide psychological comfort to people in the disaster-affected areas while providing disaster relief.
However, this study had some limitations. First, the elements considered in the data model could be further improved and supplemented. At present, the main considerations were time, area, topic, emotion and disaster situation (including prewarning, response, and loss situation). In the future, the behavior of the masses during disasters, such as public travel, and information transmission in social networks, can be further considered [44,48]. We are additionally conducting more quantitative experiments to demonstrate the effectiveness of the proposed methods. For example, we will improve the model expression and study a more refined index evaluation system to test the effectiveness of the model. In addition, we will try to apply multi-threading technology and GPU–CPU methods to increase operational efficiency. Furthermore, due to data limitations, the model is currently only verified at the large-scale provincial level, and smaller-scale applications, such as for the community level, can be considered in the future. Finally, the current model and methods only contain social media data, and it is possible to further consider the fusion of multi-source data, such as remote sensing data and traffic road data, to achieve flood situation deduction and prediction with higher accuracy and greater spatial and temporal resolution, as shown in [17,49,50].
Ultimately, despite certain limitations, through the construction of a data model and methods, the development process of flood events from prewarning to emergency response and then recovery was realized from multiple perspectives (event, object, phase, and status). It is speculated that through the effective grouping of data, spatiotemporal patterns can be more quickly and more specifically mined. The paper presents an effective attempt to use social media data for disaster management.

6.2. Conclusions

We have proposed a new data model to organize and manage data and information about flood from social media, which we call FPO data. The model expresses both the dynamic and static information of flood from multiple perspectives of the event (event, spatial object, phase and status). Additionally, two new methods have been defined to realize the automatic conversion of massive FPO data into FPO entities, and based on this, flood development processes can be successfully deduced. The validity of the model and methods was verified with a case study of the rainstorm and flood disaster in the Yangtze and Huai River Basin in 2020, in which the development process of the flood event was successfully deduced and the temporal and spatial patterns of the number of Weibos, topics, and emotions were evaluated. Research has shown that these indicators are all related to disaster situations. In future disaster management research, by monitoring these values, it will be possible to quickly judge disaster situations and take appropriate emergency response measures that will significantly enhance situational awareness and help speed-up disaster response and support post-disaster management.

Author Contributions

Conceptualization, Yang Liu and Rui Li; methodology, Yang Liu and Rui Li; software, Yang Liu and Shunli Wang; validation, Yang Liu, Rui Li and Shunli Wang; formal analysis, Yang Liu and Zhipeng Gui; investigation, Yang Liu, Rui Li and Shunli Wang; resources, Rui Li and Huayi Wu; data curation, Yang Liu, Rui Li and Shunli Wang; writing—original draft preparation, Yang Liu; writing—review and editing, Yang Liu, Rui Li, Huayi Wu and Zhipeng Gui; visualization, Yang Liu; supervision, Rui Li, Huayi Wu and Zhipeng Gui; project administration, Rui Li and Huayi Wu; funding acquisition, Rui Li and Huayi Wu All authors have read and agreed to the published version of the manuscript.

Funding

This work was supported by the National Natural Science Foundation of China (Grant No. U20A2091, 41930107) and Hubei Luojia Laboratory (Grant No. 220100010).

Institutional Review Board Statement

Not applicable.

Informed Consent Statement

Not applicable.

Data Availability Statement

Not applicable.

Acknowledgments

The authors would like to thank the reviewers and editors for valuable comments and suggestions.

Conflicts of Interest

The authors declare no conflict of interest.

Appendix A

There is the entity example extracted from the FPO data. Table A1 shows the element information of the Hubei Province object entity. Table A2 shows the element information of the phase2 entity of the Hubei Province object. Table A3 shows the examples of the disaster status and topic status entities of Hubei Province. It should be noted that the “Topic” of the entity is expressed by a set of Chinese words. Hence, for ease of understanding, we translated the words into English.
Table A1. Element information of Hubei Province object entity.
ElementInformation
Time((1 July 2021), (30 July 2021))
Space42, Hubei
Topic{({water level; Yangtze River; flood peak; the middle and lower reaches; a warning water level} which means the middle and lower reaches of the Yangtze River reach a warning water level, 3.12%);
({Hubei; Wuhan; Enshi; rainstorm; prewarning} which means cities of Hubei like Wuhan and Enshi issued rainstorm warnings, 2.49%);
({flood fighting; frontline; fighter; police; salute} which means we should tribute to the flood fighters, 2.40%);
Emotion(0.33, 0.3586)
Disaster Condition{Prewarning: Red 6; Orange 6; Yellow 4; Blue 1,
Response: I 5; II 6;III 2; IV 1,
Disaster Loss:
{Human casualties: 4,550,900 Economy loss: 5,022,000,000 yuan
Building damaged: 1795 Farmland loss: 80,000 acres}
Table A2. Element information of phase2 entity of Hubei Province object.
ElementInformation
Time((26 July 2021), (30 July 2021))
Space42, Hubei
Topic{({rainstorm; flooding; heavy rain; river; flood crossing} which means Heavy rains have caused many houses to be flooded, 0.46%);
({Hubei; Wuhan; Enshi; rainstorm; prewarning} which means cities of Hubei issued a rainstorm warning, 0.40%);
({flood fighting; frontline; fighter; police; salute} which means we should tribute to the flood fighters, 0.35%);}
Emotion(0.16, 0.4113)
Disaster Condition{Prewarning: Red 1; Orange 1; Yellow 1; Blue 1,
Response: I 2; II 0; III 0; IV 1,
Disaster Loss:
{Human causalities: 160,000 Economy loss: 22,000,000 yuan
Building damaged: No mention Farmland loss: No mention}
Table A3. Element information of examples of disaster status and topic status entities of Hubei Province.
Status EntityElementInformation
Disaster Entity iTime(15 July 2021)
Area42, Hubei
TypeResponse
Rank2
Webid[1692, 1693, 16999]
Topic Entity jTime((1 July 2021), (3 July 2021))
Area42, Hubei
TypePrewarning
TopicTop topic: {water level; Yangtze River; flood peak; the middle and lower reaches; a warning water level}
which means the middle and lower reaches of the Yangtze River reach a warning water level
Webid[16, 18, 32, 37, 38, 42, 48, 53, 57, 66, 70, 72]

References

  1. Crooks, A.T.; Wise, S. GIS and agent-based models for humanitarian assistance. Comput. Environ. Urban Syst. 2013, 41, 100–111. [Google Scholar] [CrossRef]
  2. Johnson, B.A.; Estoque, R.C.; Li, X.C.; Kumar, P.; Dasgupta, R.; Avtar, R.; Magcale-Macandog, D.B. High-resolution urban change modeling and flood exposure estimation at a national scale using open geospatial data: A case study of the Philippines. Comput. Environ. Urban Syst. 2021, 90, 101704. [Google Scholar] [CrossRef]
  3. Ishiwatari, M.; Sasaki, D. Investing in flood protection in Asia: An empirical study focusing on the relationship between investment and damage. Prog. Disaster Sci. 2021, 12, 100197. [Google Scholar] [CrossRef]
  4. Uddin, K.; Matin, M.A. Potential flood hazard zonation and flood shelter suitability mapping for disaster risk mitigation in Bangladesh using geospatial technology. Prog. Disaster Sci. 2021, 11, 100185. [Google Scholar] [CrossRef]
  5. Songchon, C.; Wright, G.; Beevers, L. Quality assessment of crowdsourced social media data for urban flood management. Comput. Environ. Urban Syst. 2021, 90, 101690. [Google Scholar] [CrossRef]
  6. Shreevastav, B.B.; Tiwari, K.R.; Mandal, R.A.; Nepal, A. Assessing flood vulnerability on livelihood of the local community: A case from southern Bagmati corridor of Nepal. Prog. Disaster Sci. 2021, 12, 100199. [Google Scholar] [CrossRef]
  7. Ministry of Emergency Management of the People’s Republic of China. The Ministry of Emergency Management Announced the Top Ten Natural Disasters in the Country in 2021. Available online: https://www.mem.gov.cn/xw/yjglbgzdt/202201/t20220123_407199.shtml (accessed on 25 March 2022).
  8. Ministry of Emergency Management of the People’s Republic of China. The Ministry of Emergency Management Announced the Top Ten Natural Disasters in the Country in 2020. Available online: http://www.mem.gov.cn/xw/yjglbgzdt/202101/t20210102_376288.shtml (accessed on 25 March 2022).
  9. Yazdani, M.; Mojtahedi, M.; Loosemore, M.; Sanderson, D. A modelling framework to design an evacuation support system for healthcare infrastructures in response to major flood events. Prog. Disaster Sci. 2022, 13, 100218. [Google Scholar] [CrossRef]
  10. Hagen, J.S.; Cutler, A.; Trambauer, P.; Weerts, A.; Suarez, P.; Solomatine, D. Development and evaluation of flood forecasting models for forecast-based financing using a novel model suitability matrix. Prog. Disaster Sci. 2020, 6, 100076. [Google Scholar] [CrossRef]
  11. Yang, J.; Yu, M.; Qin, H.; Lu, M.; Yang, C. A Twitter data credibility framework—Hurricane Harvey as a use case. ISPRS Int. J. Geo-Inf. 2019, 8, 111. [Google Scholar] [CrossRef] [Green Version]
  12. Kwak, H.; Lee, C.; Park, H.; Moon, S. What is Twitter, a social network or a news media? In Proceedings of the International Conference on World Wide Web, Raleigh, NC, USA, 26–30 April 2010. [Google Scholar]
  13. Sakaki, T.; Okazaki, M.; Matsuo, Y. Earthquake shakes Twitter users: Real-time event detection by social sensors. In Proceedings of the 19th International Conference on World Wide Web, WWW 2010, Raleigh, NC, USA, 26–30 April 2010. [Google Scholar]
  14. Anderson, A.A. Expressions of resilience: Social media responses to a flooding event. Risk Anal. 2021, 41, 1600–1613. [Google Scholar] [CrossRef]
  15. Karmegam, D.; Ramamoorthy, S.; Mappillairaju, B. Near real time flood inundation mapping using social media data as an information source: A case study of 2015 Chennai flood. Geoenviron. Disasters 2021, 8, 25. [Google Scholar] [CrossRef]
  16. Yao, F.; Wang, Y. Tracking urban geo-topics based on dynamic topic model. Comput. Environ. Urban Syst. 2020, 79, 101419. [Google Scholar] [CrossRef]
  17. De Albuquerque, J.P.; Herfort, B.; Brenning, A.; Zipf, A. A geographic approach for combining social media and authoritative data towards identifying useful information for disaster management. Int. J. Geogr. Inf. Sci. 2015, 29, 667–689. [Google Scholar] [CrossRef] [Green Version]
  18. Tim, Y.; Pan, S.L.; Ractham, P.; Kaewkitipong, L. Digitally enabled disaster response: The emergence of social media as boundary objects in a flooding disaster. Inf. Syst. J. 2017, 27, 197–232. [Google Scholar] [CrossRef]
  19. Yu, M.; Yang, C.; Li, Y. Big data in natural disaster management: A review. Geosciences 2018, 8, 165. [Google Scholar] [CrossRef] [Green Version]
  20. Han, X.H.; Wang, J.L. Using social media to mine and analyze public sentiment during a disaster: A case study of the 2018 Shouguang city flood in China. ISPRS Int. J. Geo-Inf. 2019, 8, 185. [Google Scholar] [CrossRef] [Green Version]
  21. Mohan, D.A. Big data analytics: Recent achievements and new challenges. Int. J. Comput. Appl. Technol. Res. 2016, 5, 460–464. [Google Scholar] [CrossRef]
  22. Ogie, R.I.; Clarke, R.J.; Forehead, H.; Perez, P. Crowdsourced social media data for disaster management: Lessons from the PetaJakarta.org project. Comput. Environ. Urban Syst. 2019, 73, 108–117. [Google Scholar] [CrossRef]
  23. Granell, C.; Ostermann, F.O. Beyond data collection: Objectives and methods of research using VGI and geo-social media for disaster management. Comput. Environ. Urban Syst. 2016, 59, 231–243. [Google Scholar] [CrossRef]
  24. Allaire, M.C. Disaster loss and social media: Can online information increase flood resilience? Water Resour. Res. 2016, 52, 7408–7423. [Google Scholar] [CrossRef]
  25. Paradesi, S.M. Geotagging tweets using their content. In Proceedings of the Twenty-Fourth International Florida Artificial Intelligence Research Society Conference, Palm Beach, FL, USA, 18–20 May 2011. [Google Scholar]
  26. Gelernter, J.; Balaji, S. An algorithm for local geoparsing of microtext. GeoInformatica 2013, 17, 635–667. [Google Scholar] [CrossRef]
  27. Bakillah, M.; Li, R.-Y.; Liang, S.H.L. Geo-located community detection in Twitter with enhanced fast-greedy optimization of modularity: The case study of typhoon Haiyan. Int. J. Geogr. Inf. Sci. 2015, 29, 258–279. [Google Scholar] [CrossRef]
  28. Imran, M.; Elbassuoni, S.; Castillo, C.; Diaz, F.; Meier, P. Practical extraction of disaster-relevant information from social media. In Proceedings of the 22nd International Conference on World Wide Web (WWW), Rio de Janeiro, Brazil, 13–17 May 2013; pp. 1021–1024. [Google Scholar]
  29. Imran, M.; Mitra, P.; Castillo, C. Twitter as a lifeline: Human-annotated Twitter corpora for NLP of crisis-related messages. In Proceedings of the 10th International Conference on Language Resources and Evaluation (LREC), Portoroz, Slovenia, 23–28 May 2016; pp. 1638–1643. [Google Scholar]
  30. Pouyanfar, S.; Chen, S.-C. Automatic video event detection for imbalance data using enhanced ensemble deep learning. Int. J. Semant. Comput. 2017, 11, 85–109. [Google Scholar] [CrossRef]
  31. Kanth, A.K.; Chitra, P.; Sowmya, G.G. Deep learning-based assessment of flood severity using social media streams. Stoch. Environ. Res. Risk Assess. 2022, 36, 473–493. [Google Scholar] [CrossRef]
  32. Chen, Z.Y.; Mukherjee, A.; Liu, B.; Hsu, M.C.; Ghosh, R. Leveraging multi-domain prior knowledge in topic models. In Proceedings of the Twenty-Third International Joint Conference on Artificial Intelligence (IJCAI), Beijing, China, 3–9 August 2013. [Google Scholar]
  33. Chen, Z.Y.; Mukherjee, A.; Liu, B.; Hsu, M.C.; Castellanos, M.; Ghosh, R. Discovering coherent topics using general knowledge. In Proceedings of the 22nd ACM International Conference on Information and Knowledge Management (CIKM), San Francisco, CA, USA, 27 October–1 November 2013; pp. 209–218. [Google Scholar]
  34. Wang, Y.K.; Zhang, Z.B.; Su, S.; Zia, M.A. Topic-level bursty study for bursty topic detection in microblogs. In Proceedings of the 23rd Pacific-Asia Conference on Knowledge Discovery and Data Mining (PAKDD), Macau, China, 14–17 April 2019; pp. 97–109. [Google Scholar]
  35. Wang, Y.D.; Wang, T.; Ye, X.Y.; Zhu, J.Q.; Lee, J. Using social media for emergency response and urban sustainability: A case study of the 2012 Beijing rainstorm. Sustainability 2016, 8, 25. [Google Scholar] [CrossRef]
  36. Li, J.; He, Z.; Plaza, J.; Li, S.T.; Chen, J.F.; Wu, H.L.; Wang, Y.D.; Liu, Y. Social media: New perspectives to improve remote sensing for emergency response. Proc. IEEE 2017, 105, 1900–1912. [Google Scholar] [CrossRef]
  37. Saif, H.; He, Y.L.; Fernandez, M.; Alani, H. Contextual semantics for sentiment analysis of Twitter. Inf. Process. Manag. 2016, 52, 5–19. [Google Scholar] [CrossRef] [Green Version]
  38. Yin, J.; Karimi, S.; Lampert, A.; Cameron, M.; Robinson, B.; Power, R. Using social media to enhance emergency situation awareness. In Proceedings of the 1st International Workshop on Social Influence Analysis/24th International Joint Conference on Artificial Intelligence (IJCAI), Buenos Aires, Argentina, 25–31 July 2015; pp. 4234–4238. [Google Scholar]
  39. Herfort, B.; de Albuquerque, J.P.; Schelhorn, S.J.; Zipf, A. Exploring the geographical relations between social media and flood phenomena to improve situational awareness. In Proceedings of the 17th AGILE Conference on Geographic Information Science, Castellon, Spain, 3–6 June 2014; pp. 55–71. [Google Scholar]
  40. Chae, J.; Thom, D.; Jang, Y.; Kim, S.; Ertl, T.; Ebert, D.S. Public behavior response analysis in disaster events utilizing visual analytics of microblog data. Comput. Graph. 2014, 38, 51–60. [Google Scholar] [CrossRef]
  41. Rosser, J.F.; Leibovici, D.G.; Jackson, M.J. Rapid flood inundation mapping using social media, remote sensing and topographic data. Nat. Hazards 2017, 87, 103–120. [Google Scholar] [CrossRef] [Green Version]
  42. Li, Z.L.; Wang, C.Z.; Emrich, C.T.; Guo, D.S. A novel approach to leveraging social media for rapid flood mapping: A case study of the 2015 South Carolina floods. Cartogr. Geogr. Inf. Sci. 2018, 45, 97–110. [Google Scholar] [CrossRef]
  43. Xu, L.; Ma, A. Coarse-to-fine waterlogging probability assessment based on remote sensing image and social media data. Geo-Spat. Inf. Sci. 2021, 24, 279–301. [Google Scholar] [CrossRef]
  44. Wang, Z.Y.; Ye, X.Y. Social media analytics for natural disaster management. Int. J. Geogr. Inf. Sci. 2018, 32, 49–72. [Google Scholar] [CrossRef]
  45. Huang, Q.Y.; Xiao, Y. Geographic situational awareness: Mining tweets for disaster preparedness, emergency response, impact, and recovery. ISPRS Int. J. Geo-Inf. 2015, 4, 1549–1568. [Google Scholar] [CrossRef] [Green Version]
  46. Ibias, A.; Núñez, M.; Hierons, R.M. Using mutual information to test from Finite State Machines: Test suite selection. Inf. Softw. Technol. 2021, 132, 106498. [Google Scholar] [CrossRef]
  47. Guan, X.Y.; Chen, C. Using social media data to understand and assess disasters. Nat. Hazards 2014, 74, 837–850. [Google Scholar] [CrossRef]
  48. Kim, J.; Hastak, M. Social network analysis: Characteristics of online social networks after a disaster. Int. J. Inf. Manag. 2018, 38, 86–96. [Google Scholar] [CrossRef]
  49. Jongman, B.; Wagemaker, J.; Romero, B.R.; De Perez, E.C. Early flood detection for rapid humanitarian response: Harnessing near real-time satellite and Twitter signals. ISPRS Int. J. Geo-Inf. 2015, 4, 2246–2266. [Google Scholar] [CrossRef] [Green Version]
  50. Liu, Z.; Qiu, Q.; Li, J.; Wang, L.; Plaza, A. Geographic optimal transport for heterogeneous data: Fusing remote sensing and social media. IEEE Trans. Geosci. Remote Sens. 2020, 59, 6935–6945. [Google Scholar] [CrossRef]
Figure 1. Schematic diagram of EMMPFO.
Ijgi 11 00306 g001
Figure 2. Schematic diagram of the relationship between EMMFPO expression classes.
Ijgi 11 00306 g002
Figure 3. Schematic diagram of time element union operation.
Ijgi 11 00306 g003
Figure 4. Schematic diagram of the method for obtaining element information in four levels.
Ijgi 11 00306 g004
Figure 5. Schematic diagram of the presentation results of object-level dynamic expression classes.
Ijgi 11 00306 g005
Figure 6. Schematic diagram of presentation results of phase-level dynamic expression class.
Ijgi 11 00306 g006
Figure 7. Schematic diagram of presentation results of the status-level dynamic expression class.
Ijgi 11 00306 g007
Figure 8. Schematic diagram of the FPO entity construction process based on static expression.
Ijgi 11 00306 g008
Figure 9. Schematic diagram of status unit aggregation rules.
Ijgi 11 00306 g009
Figure 10. Several situations where time elements are adjacent (blue and orange line segments indicate two time periods).
Ijgi 11 00306 g010
Figure 11. Schematic diagram of determining the scope of the final phase based on the status type (the number in the circle represents the time element and “1–2” means 1st day to 2nd day).
Ijgi 11 00306 g011
Figure 12. An example of multi-level dynamic expression under a certain object entity (the number in the circle represents the time element).
Ijgi 11 00306 g012
Figure 13. Study area.
Ijgi 11 00306 g013
Figure 14. Experimental procedure of the case study.
Ijgi 11 00306 g014
Figure 15. The flood development process (using Hubei as an example).
Ijgi 11 00306 g015
Figure 16. The average number of Weibos at (a) 1 July to 4 July, (b) 5 July to 17 July, (c) 18 July to 26 July, and (d) 27 July to 31 July.
Ijgi 11 00306 g016
Figure 17. The average number of Weibos in each region.
Ijgi 11 00306 g017
Figure 18. The proportion of different topic statuses in (a) all phases of Chongqing, (b) phase 1 of Chongqing, (c) phase 2 of Chongqing, (d) all phases of Hubei, (e) phase 1 of Hubei, (f) phase 2 of Hubei, (g) all phases Anhui, (h) phase 1 of Anhui, and (i) phase 2 of Anhui.
Ijgi 11 00306 g018
Figure 19. The proportion of different emotions in each status. Row1 represents the prewarning status, Row2 represents the response status, Row3 represents the recovery status, Colum1 represents Anhui, Colum2 represents Hubei, and Colum3 represents Chongqing.
Ijgi 11 00306 g019
Table 1. The structure of each component in the disaster element.
ComponentNameDescription
Prewarning
p i
IDUnique identifier
TypeThe type of prewarning, like heavy rain or flood
RankThe rank of prewarning
TimeThe time when the warning was issued
AreaThe location involved in the warning
WebidThe id set of involved text
Response
r i
IDUnique identifier
RankThe rank of response
TimeThe time when the response was issued
AreaThe location involved in the response
WebidThe id set of involved text
Disaster Loss
l i
IDUnique identifier
TimeThe time when the disaster loss was issued
AreaThe location involved in the disaster
SPNumber of human casualties in the disaster
ELEconomic losses in the disaster
FLLoss of farmland in the disaster
BLLoss of buildings in the disaster
WebidThe id set of involved text
Publisher’s Note: MDPI stays neutral with regard to jurisdictional claims in published maps and institutional affiliations.

