
Sustainable Urban Land-Use Optimization Using GIS-Based Multicriteria Decision-Making (GIS-MCDM) Approach


1
Department of Photogrammetry and Geoinformatics, Faculty of Civil Engineering, Budapest University of Technology and Economics, 1111 Budapest, Hungary
2
Department of Urban and Regional Planning, Rajshahi University of Engineering and Technology, Rajshahi 6204, Bangladesh
*
Author to whom correspondence should be addressed.
ISPRS Int. J. Geo-Inf. 2022, 11(5), 313; https://0-doi-org.brum.beds.ac.uk/10.3390/ijgi11050313
Submission received: 3 April 2022
/
Revised: 8 May 2022
/
Accepted: 13 May 2022
/
Published: 15 May 2022
Abstract
:Land-use optimization is an effective technique to produce optimal benefits in urban land-use planning. There are many approaches and methods to optimize land-use allocation. However, the focus on addressing urban sustainability in land-use optimization is very limited. In this study, we presented a GIS-based multicriteria decision-making (GIS-MCDM) approach to optimize the location of a new residential development considering sustainability dimensions (social, economic, and environmental benefits). Rajshahi City in Bangladesh was taken as a case study. Different types of data, including land use, land cover, ecosystem service value, land surface temperature, and carbon storage, were used to define sustainability criteria. Five physical criteria, three sustainability criteria, and two constraints were used to optimize residential land. Fuzzy membership functions were used to standardize the criteria. The ordered weighted averaging (OWA) was used to produce a residential suitability map. Finally, the multiobjective land allocation (MOLA) module of TerrSet v 19.0 was used to generate optimal locations under an alternative decision scenario. The findings suggest that about 9.00% more sustainability benefits can be achieved using our approach. Using our proposed approach, we also generated six alternative decision scenarios. Among the alternative decision strategies, “high risk–no trade-off” proved to be the most optimal decision strategy that generated the highest sustainability benefit in our case.
1. Introduction
In 2018, the world’s urban population was 55% of the world population, and it has been projected to reach 68% by 2050 [1]. With this increased urban population, it becomes a global concern to devise effective urban land-use planning that can produce optimal benefits. This problem is more acute in high-density countries such as Bangladesh. For example, in 2021, the urban population of Bangladesh was 38.90% [2], and it was projected that the urban population will rise to 57% by 2050 [3]. This higher rate of the urban population causes unplanned urban development in Bangladesh. Current practice in urban land-use planning, especially in developing countries, exhibits inefficient patterns and allocation of land uses, which, in turn, produce a lot of problems in the face of sustainable urban development [4,5,6]. For example, in Bangladesh, it has been acknowledged that problems such as sanitation and drainage, solid waste management, degradation of soil and land, uncontrolled emissions from domestic and industrial activities, traffic jams in the streets, and improper disposal of hazardous waste are consequences of rapid urbanization [7,8]. To address the issue of inefficiency, a new concept of sustainable land-use planning has begun to take focus in planning literature and practice. Sustainable land-use planning ensures increased compatibility of adjacent land uses, promotes compactness, boosts up economic development, and results in desirable social and environmental outcomes [9,10,11]. Like other countries, Bangladesh has also started to prepare proper urban development planning (e.g., structure plan, urban area plan, and detailed area plan), but the inclusion of sustainability in urban development planning is still far from the expectation [12,13,14].
Land-use allocation concerning urban sustainability involves social, economic, and environmental aspects. However, in reality, there exist many conflicting and competing objectives among social, economic, and environmental outcomes. One objective may be optimized at the expense of another objective. For example, if residential development is to take place in a low-lying area, it may fulfill the demand for urban housing, but it will create problems with urban drainage. Construction of building structures may increase economic benefit, but it will deteriorate the environment and urban health. Therefore, careful land allocation is of paramount importance in land-use planning. Sustainable land-use optimization involves optimizing the composition and configuration of land-use types within a geographical area in order to meet the requirements of sustainable development. Typically, this method balances trade-offs between several land-use objectives (e.g., social, economic, and environmental benefits), intending to maximize net benefits across all outcomes. Often, one objective may only be optimized at the expense of other objectives [15]. However, the main problem is that, in early studies, the inclusion of sustainability criteria is very limited due to the complexity of calculating social, economic, and environmental benefits in land-use allocation. For example, Wang, Zhang, and Wang [16] optimized land-use allocation in Dawa District, a district of Northeast China, but they did not include social benefits due to the difficulty in the quantification of social benefits.
Rahman and Szabó [17] conducted an extensive systematic literature review on multiobjective urban land-use optimization using preferred reporting items for systematic reviews and meta-analyses (PRISMA). In their systematic review, they investigated 55 journal papers (screened out from 2291 journal articles) to identify and analyze different aspects of urban land-use optimization problems, where they identified that sustainability criteria were merely touched upon in urban land-use optimization problems. While some studies partially considered sustainability dimensions, the quantifications of sustainability indicators lacked appropriate methods. For example, Song and Chen [18] optimized land-use allocation using the NSGA-II method considering four objectives, including maximization of agricultural suitability, construction suitability, conservation suitability, and spatial compactness; Zheng et al. [19] optimized land-use allocation in Wuhan, China, to balance ecosystem services and economic benefits; Cao, Zhang, and Wang [20] optimized land-use allocation considering land-use compatibility and environmental benefits. A nondominated sorting genetic algorithm (NSGA) was employed by Cao et al. [21] to solve a multiobjective land-use optimization problem (NSGA-II-MOLU) that aimed to reduce conversion costs and increase accessibility while also ensuring that land-use types were compatible with one another. Using a genetic algorithm, Haque and Asami [22] optimized urban land-use allocation by considering the maximization of land price and minimization of incompatibility between nearby land-use categories in an area. Neema and Ohgai [23] used genetic algorithms to find the best locations for urban parks and open spaces based on four objective functions, using the Euclidian distances between the facility and the demand points, in a multiobjective optimization model. If we critically look at the optimization objectives of the above studies, we could see that those studies did not directly include three dimensions of sustainability.
The studies mentioned in the above text also noted that public participation was very negligible to optimize land-use allocation, but only quantitative optimization was insufficient to meet the public agreement. To integrate public opinion decision making, the multicriteria decision-making (MCDM) approach was introduced in many disciplines. MCDM is a collection of techniques that aim to determine a preference order among alternative decision options based on their performance in terms of multiple criteria [24]. Land-use decision is a spatial allocation problem in which the geographic information system (GIS) plays an important role in the spatial planning and management of land-use planning. MCDM integrated with GIS can help in many complex land-use decision supports, and interest in this integration is increasing day by day to solve many complex spatial problems. Combining MCDM procedures with GIS capabilities is becoming increasingly popular because of the GIS’s capacity to handle enormous amounts of complicated geo-referred data from many sources at a variety of spatial, temporal, and spatial scales, resulting in a time-efficient analysis [25]. GIS-based multicriteria decision making (GIS-MCDM) can be defined as a process of integrating and transforming geographic data (input map criteria) and value judgments (decision makers’ preferences and uncertainties) into an overall assessment of the decision alternatives [26]. Due to its applicability to solving the complex spatial problem, GIS-MCDM was applied in the decision making of the many land-use allocation problems. However, although the GIS-MCDM approach incorporated public participation, the inclusion of sustainability criteria was overlooked. It was also noted that only the physical criteria dominated in the GIS-MCDM approach in land-use decision making with little attention to the inclusion of sustainability criteria. For example, Nguyen et al. [27] designed a GIS-based multicriteria land suitability analysis for sustainable land-use planning at the regional level in Central Vietnam. They used seven criteria for their suitability analysis. Although they used environmental criteria, other two criteria (social and economic) were absent.
Given the above, this study aims to fill the gaps by presenting a GIS-based multicriteria decision-making (GIS-MCDM) approach to optimize residential land-use allocation while considering three dimensions of sustainability (maximization of social, economic, and environmental benefits) and incorporating stakeholder opinion. This study specifically seeks two research questions: (a) how can we integrate sustainability criteria into land-use optimization problems, and (b) does inclusion of sustainability criteria increase the overall sustainability benefits? The contribution of this paper is twofold: (a) integration of sustainability factors to optimize residential land-use allocation and (b) use of our developed method (calculation of social and environmental benefit) in the optimization process. Previously, some proxy variables were used to measure social and environmental benefits. In our previous studies, we developed a method for calculating social and environmental benefits in urban land-use allocation [28,29]. In this study, we applied our methods to quantify the social and environmental benefits of land-use allocation.
The rest of the paper is structured as follows. Section 2 describes the literature review. Section 3 describes the data used in this study and the methods followed for optimizing residential location based on selected factors and constraints. This section describes the methods to calculate, standardize, and aggregate the factors to derive combined land-use suitability for residential development. Section 4 presents and discusses the findings of the study. Finally, this paper ends with Section 5, which contains concluding remarks on this study.
2. Literature Review
Urban land-use optimization planning is very important to achieve long-term urban sustainability. However, it becomes a global challenge, especially in developing countries, to optimize urban land-use allocation in the face of rapid urbanization, migration, and climate change [4,30,31,32]. Sustainable urban land-use optimization/allocation is considered an effective tool to achieve urban sustainability. Sustainability is one of the important goals of urban land-use planning, which requires taking into account the social, economic, and environmental benefits of people [33,34]. Sustainable land-use planning encompasses social, economic, and environmental components, each of which has a distinct objective. Additionally, optimality is a fundamental principle of sustainable land-use planning. Owing to this, many researchers conducted land-use optimization. For example, Handayanto et al. [35] combined particle swarm optimization, genetic algorithms, and a local search method into a single hybrid optimization method for land-use planning in Bekasi City, Indonesia. They used four criteria to optimize land-use allocation. These are maximizing compactness, compatibility, dependency, and suitability. Li et al. [36] applied a particle swarm optimization algorithm to optimize urban land-use allocation while maximizing spatial compactness, land ecosystem service value, land-use suitability, and land transformation benefit. Mohammadi et al. [31] optimized land-use allocation using nondominated sorting genetic algorithm-II (NSGA-II) while maximizing spatial compactness, floor area ratio, land-use compatibility, and economic benefit and maximizing mixed use. However, these studies tried to optimize land-use allocation mainly based on the spatial configuration of urban land-use types in which urban sustainability was ignored. While there are some studies on sustainable land-use optimization [37,38], they did not consider all the three dimensions (social, economic, and environmental) of sustainability.
Although some of the early studies included sustainability criteria partially, they did not use any established method to quantify sustainability indicators. They used a single variable-based measure to quantify sustainability dimensions. For example, Zhang et al. [39] quantified social benefit as a function of the value of social security services, Yuan et al. [38] quantified social benefit using the spatial compactness of an area, and Cao et al. [37] used spatial accessibility as a proxy for social sustainability. However, focusing exclusively on a single metric may not be the optimal way to assess social benefit. Jenks and Jones [40], for example, noted that while spatial compactness in cities offers numerous social benefits, it may result in less living space, reduced access to open spaces, less affordable housing, and bad health. Even a compact city may suffer negative consequences if land uses are incompatible. If the land uses are compatible but there is a lack of accessibility, the social benefit is also reduced. Thus, compatibility and accessibility are also factors in determining social benefit. Similarly, there may be additional indicators contributing to the social benefit metric. As a result, we argue that many indicators can be ascribed to the social benefit metric. As a result, some form of the composite index is necessary to quantify societal gain. To resolve this problem, Rahman and Szabó [29] developed a composite index to quantify social benefit in land-use allocation. In the same way, there was no established method to quantify environmental benefits. Several researchers used several methods to measure environmental benefits in urban land-use allocation. Yuan et al. [38], for example, employed carbon storage as a proxy for quantifying environmental benefits, assuming that carbon storage can help sustain air pollution levels. Numerous studies have also used spatial compactness as a proxy for environmental benefits, assuming that a compact city is more sustainable and livable [41], provides better access to city facilities and promotes public health and well-being [42], and can maximize the overall environmental benefits of people [43]. However, environmental benefits can also be measured according to the approach proposed by Rahman and Szabó [29].
In the introduction section, it was mentioned that public participation was very negligible in the early land-use optimization problem. To overcome this, the multicriteria decision-making (MCDM) approach was introduced [44,45]. With the help of an MCDM process, decision making is aided by helping to structure the problem and providing all parties involved with a common language for discussing and learning about the problem [46]. Since its inception, MCDM has been applied in many fields including land-use planning. For example, Zhang et al. [47] proposed a GIS-based multicriteria decision analysis technique to resolve conflicts in urban land-use allocation games. They developed a spatial conflict resolution strategy to help stakeholders and planners to formulate specific land-use proposals through an iterative modification process. However, they did not mention sustainability criteria in conflict resolution. Mendas and Delali [48] integrated multicriteria decision analysis in GIS to develop land suitability for wheat cultivation in the region of Mleta in Algeria. They also did not include sustainability criteria in their suitability analysis. Luan et al. [49] conducted a land-use suitability assessment for urban development using a GIS-based MCDM approach in Ili Valley, China. They used 13 criteria for land suitability assessment. Although they grouped some subcriteria under socioeconomic factors, still, sustainability criteria were not fully addressed. Romano et al. [25] integrated geographical information systems (GIS) and multicriteria decision analysis (MCDA) to evaluate the potential of a rural coastal area, located in northern Puglia (Southern Italy), to improve its sustainable development through the restoration of farmland. They used only physical criteria for sustainable allocation of farmland. In fact, there was no specific inclusion of sustainability criteria. Therefore, it is evident that although stakeholder participation was addressed in the MCDM approach in land-use optimization/allocation, still, the inclusion of sustainability criteria (social, environmental, and economic) is weak. This inevitably requires incorporating both sustainability criteria and a participatory approach in sustainable urban land-use optimization.
In this study, we used the MCDM approach to select the optimal location for a new residential area. We used five physical criteria and three sustainability criteria (social, economic, and environmental benefits) to determine the optimal location while maximizing the sustainability benefits. First, we created suitability maps for each criterion using the fuzzy membership function. Then, we created a combined suitability map using ordered weighted average (OWA) [50] techniques for different decision risk scenarios. Finally, we identified the optimal location considering overall sustainability benefits.
3. Materials and Methods
3.1. Study Area
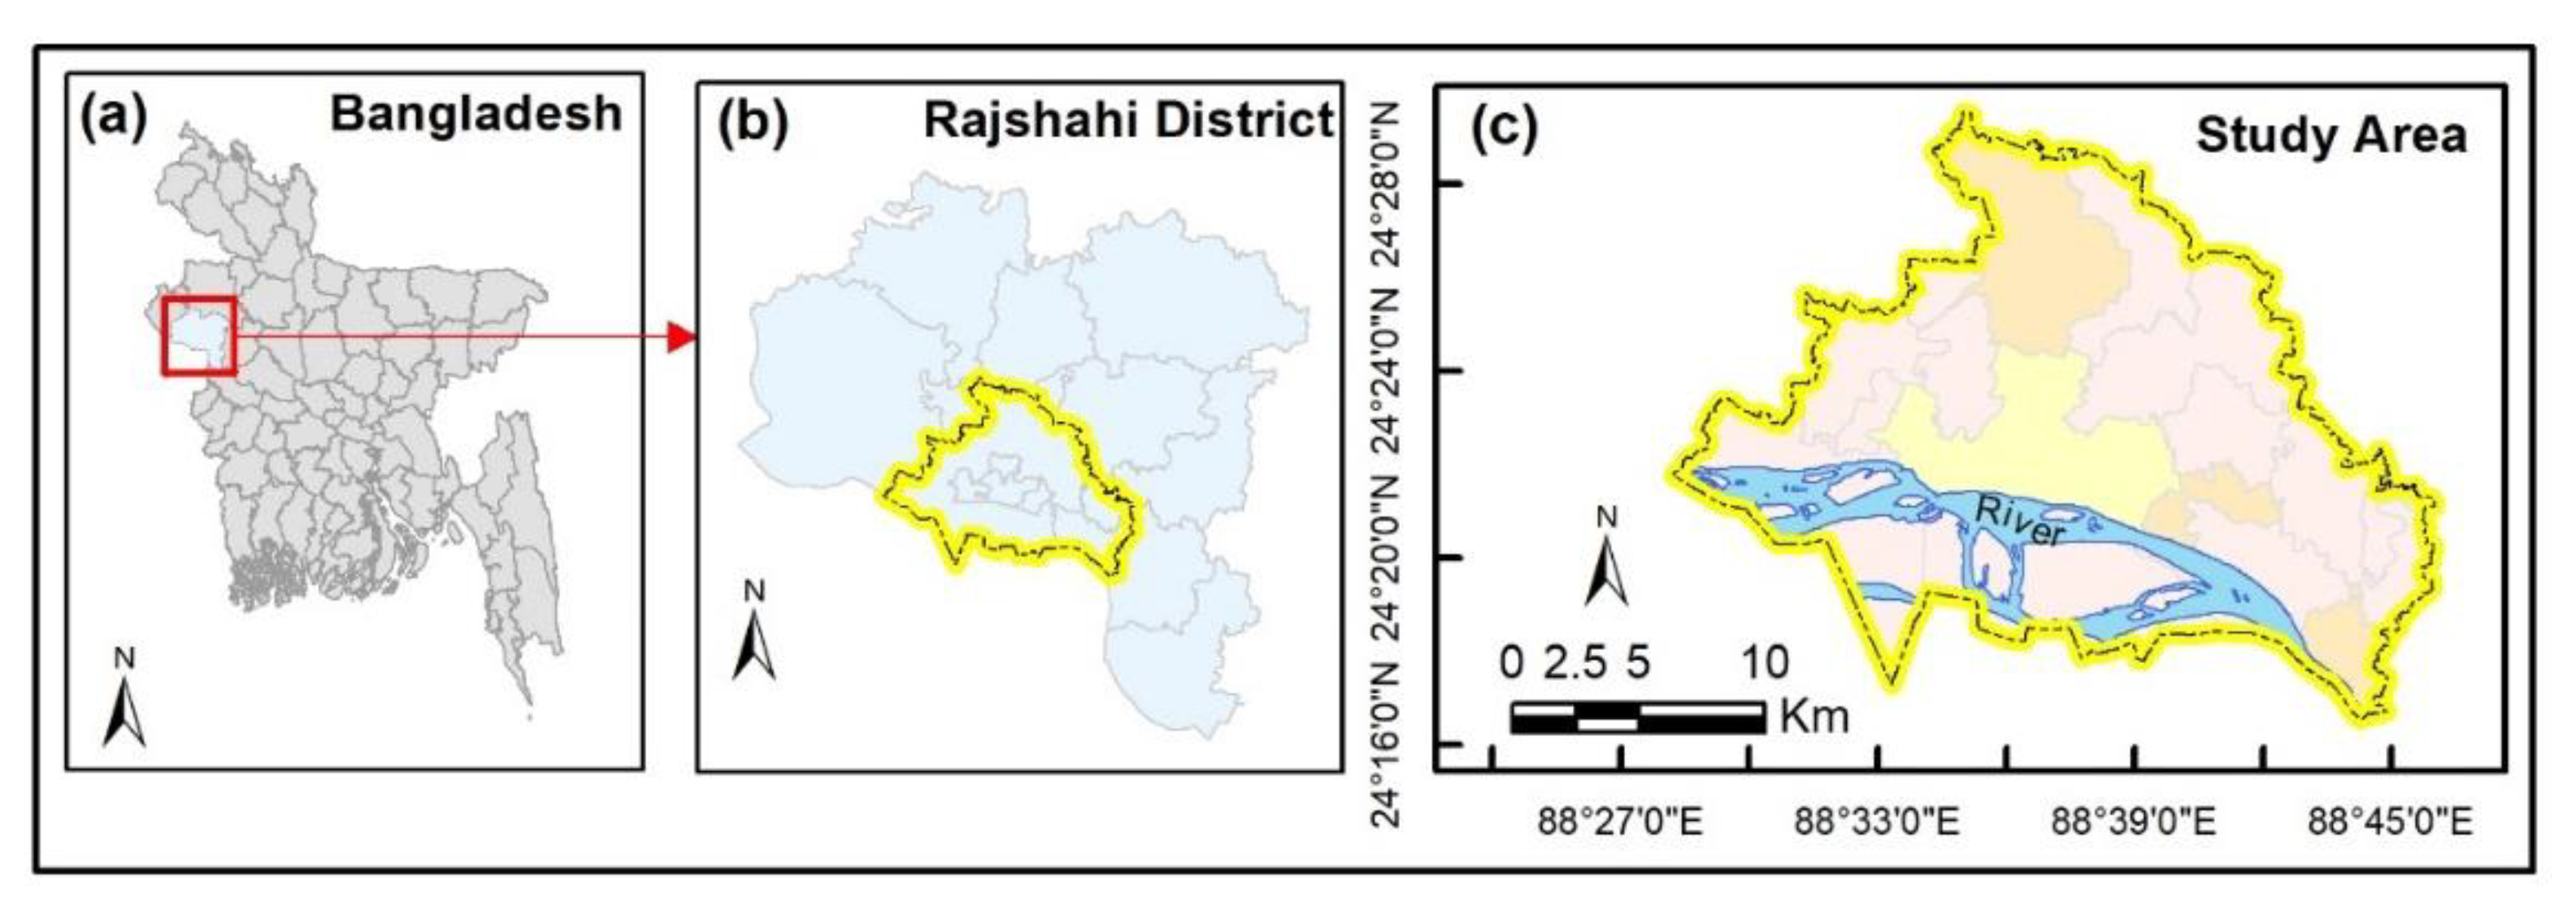
This study was conducted in the Rajshahi Metropolitan Area (RMA) of Bangladesh. It is one of Bangladesh’s eight administrative divisions and one of the country’s eight metropolitan cities. Rajshahi is located in the country’s northwestern region. The famous river the Padma forms the southern border with the Rajshahi division, while another famous river, the Jamuna, forms the eastern border. Rajshahi is located in the Barind Tract at a height of 23 meters above sea level at 24°22′26′′N 88°36′04′′E. The city is about 243 km from the capital city, Dhaka, and is close to the India–Bangladesh border. The area and population of this metropolitan city are 365.55 km2 (Figure 1) and 1.3 million, respectively. Rajshahi is a significant administrative, educational, cultural, and business center. Due to the city’s high concentration of educational institutions and large student population, it is referred to as Bangladesh’s educational city. This city is home to the divisional headquarters. According to the Köppen climate classification, Rajshahi has a tropical wet and dry climate. Monsoons, high temperatures, high humidity, and moderate rainfall characterize Rajshahi’s climate.
3.2. Dataset
In this study, we used a variety of datasets. The primary data used in this study include land use and land cover, road network and other physical features, and a digital elevation model (DEM). These data were sourced from the Rajshahi Development Authority (RDA), Bangladesh. These data were in raster and ESRI shapefile format and were used to derive land suitability maps for different factors. The land cover data were created from Landsat images. The description of the detailed methodology of land cover classification can be found in Rahman and Szabó [51]. In addition, ecosystem service value, land surface temperature, carbon storage, and so forth were used in this study. The description of these data and processing can be found in Rahman and Szabó [28]. All the data were processed using ArcGIS 10.8 software. In addition to these data, other data were used to calculate the social, economic, and environmental benefits. This is described in the relevant section.
3.3. Methodology
In Section 2, we described the different methods used to optimize urban land-use allocation. It was identified that many heuristic approaches and participatory approaches were applied to find the optimal land for future allocation. However, many heuristic approaches merely included public participation, although public participation is an indispensable part of urban land-use decision making. Considering the above, we applied the MCDM approach for land-use optimization.
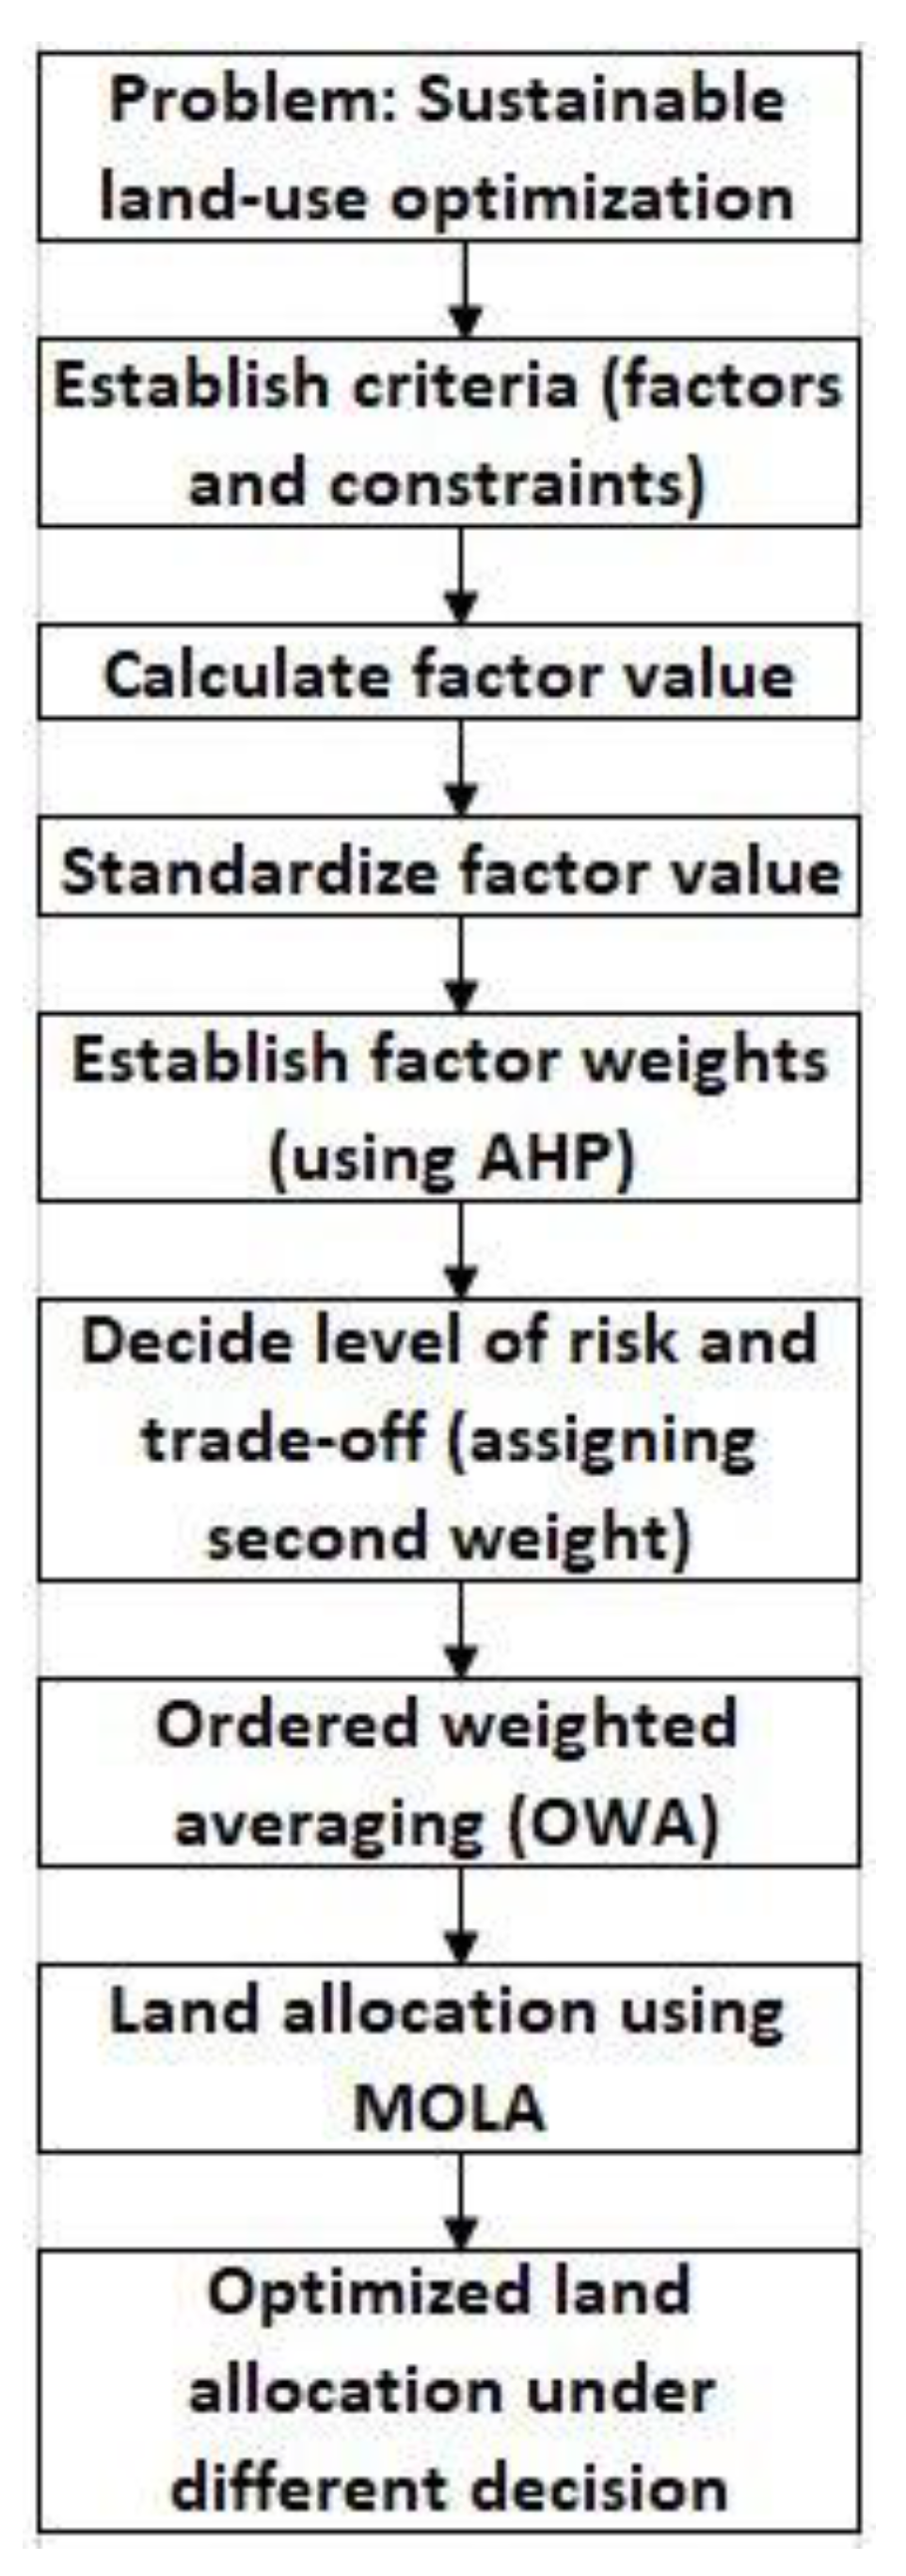
In this study, we used the GIS-based MCDM approach to optimize the location of new residential development. We added sustainability dimensions in the process of land-use optimization. The whole process of optimizing the location for new residential development involves two major steps: (a) evaluation of land suitability mapping of residential development using multicriteria evaluation (MCE) and (b) identification of optimal location for new residential development. The whole process is presented in Figure 2.
3.3.1. Evaluation of Land Suitability
In the MCDM approach, four major steps are performed for the evaluation of land suitability. These are (a) calculation of criteria value, (b) standardization of criteria, (c) weighting of criteria, and (d) weighted aggregation of criteria. A brief description of these steps is given below.
3.3.1.1. Calculation of Criteria Value
The first step in the evaluation of land suitability is to calculate the value of the criteria. A criterion is a basis for judgment that is quantifiable and evaluable. Criteria can be divided into two categories—factors and constraints—and they can apply to either an individual’s attribute or the entire decision set in question. In the context of an activity, a factor is a criterion that either increases or detracts from a given alternative’s suitability. The most frequent scale used to quantify it is a continuous scale, whereas constraints are used to limit the choices considered. An excellent example of a constraint would be the exclusion of areas designated as wildlife reserves from development. Constraints are typically expressed as a Boolean (logical) map, with areas excluded from consideration denoted by a 0 and those available for consideration denoted by a 1 [52]. In this study, we selected five physical factors, three sustainability factors, and two constraints for residential land suitability analysis. The physical factors and constraints were selected based on the local authority and stakeholders through focus group discussion (FGD) as well as existing regulations for new development. We also added sustainability factors to address sustainability in land-use optimization for new residential development. The list of factors and constraints is shown in Table 1.
Distance (Euclidian distance) from main roads, existing residential land, and brickfield were calculated using the “DISTANCE” operator of TerrSet v 19.0 software, and distance from the town center was calculated using the “COST” operator with the “cost grow” algorithm available in the same software. Land elevation value was sourced from secondary sources, as mentioned in Section 3.2. Social benefits were calculated following our earlier developed method [29]. Environmental benefits were calculated using the method developed by Rahman and Szabó [28]. Economic benefit was calculated following the methodology developed by Gong et al. [53]. We are not going to repeat the methods here. Interested readers can find the detailed methodology in the referred literature. Constraints were developed from existing land uses of the study area.
3.3.1.2. Standardization of Criteria Value
Since different scales are used to measure the criteria, it is required to standardize and transform the factors before combining them to ensure that all factors’ maps are positively correlated with suitability. For example, a land residential development is more suitable if it is located near main roads but far from brickfields. Therefore, we need to transform the suitability so that higher value always remains of higher suitability. There are many procedures for standardization, such as fuzzy membership function, Bayesian probability theory, and Dempster–Shafer theory [54]. However, the fuzzy membership function is the most popular and convenient for this kind of study since it provides a strong logical process of standardization [55]. Therefore, the fuzzy membership function (FMF) was used in our study to standardize the factors. A fuzzy set is defined by a fuzzy membership grade (also known as a possibility) that ranges between 0.0 and 1.0, signifying a continuous progression from nonmembership to complete membership. It is very important to determine the shape and type of membership functions and variable threshold values (effective range) before implementing fuzzy sets for standardizing criteria maps. In this study, we followed the guidelines by Eastman [56] to determine the shape and type of fuzzy membership function in the standardization process of factors. There are many procedures of standardization, but the simplest is linear scaling, which can be expressed in Equation (1).
where R = raw score of factor.
The standardized value of factor varies. In this study, we used a standardized range between 0 and 1, where 0 represents the lowest suitability and 1 represents the highest suitability. The evaluation criteria with fuzzy membership function type, control points, and function shape used in this study are presented in Table 2.
Constraint maps were developed by consulting the existing regulations. Two constraint maps were prepared: land-use constraint and water constraint. Existing regulations prohibit new development in water bodies and already-developed land. Only agricultural land is allowed for new development. Control points and other criteria in Table 2 were determined with the consultation of the local authority, stakeholders, and representatives of local people through FGD. Based on the FGD, it was decided that new residential development should take place within proximity of the city center, main roads, and existing residential land. Therefore, the suitability of residential development decreases with the increase in distance from these factors. This decrease in a linearly correlated and thus a linear fuzzy membership function with monotonically decreasing shape was used for standardization of these factors setting control points between the lowest and highest values. Residential development is prohibited within 500 m of brickfields. Participants in the FGD agreed that land suitability for residential development increases beyond 500 m of brickfield, and the maximum suitability reaches 3000 m. The suitability after 3000 m from the brickfield remains the same. This function cannot be described by a simple linear relationship. It is best described by an increasing sigmoidal curve. Therefore, we used a monotonically increasing sigmoidal function to rescale the values in the distance-from-the-brickfield image setting the control points at 500 and 3000 m. Existing regulation also prohibits residential development on land having elevations of less than 12 m. Therefore, land suitability increases beyond 12 m of elevation. This relationship between land suitability and elevation was positively correlated. Thus, a linear fuzzy membership function with a monotonically increasing shape was used to rescale the elevation image setting control points 12 and 22 m (highest value). It was decided in the FGD that the new residential development can be developed in a location where existing social, environmental, and economic benefits are low. The logic is that new development will eliminate the benefits of those locations (although the new development will create some social, economic, and environmental benefits, these are new benefits that will be derived), so the loss of social, economic, and environmental benefits can be minimized. Thus, the social, economic, and environmental benefits can be maximized by allocating land for new residential development in locations where the existing benefits are lower. Therefore, in these cases, we used a monotonically decreasing linear fuzzy membership function to rescale the social, economic, and environmental benefits (values).
3.3.1.3. Weighting of Criteria
In the MCDM approach, the calculation of weights of different factors is very important. Different methods are used to derive weights, including the AHP method [57], entropy method [58], analytic network process [59], and Delphi method [60]. Among others, AHP is the most popular and used globally in the decision-making process. To consider the viewpoints of stakeholders and to reach a consensus on the preferred choices, we used the AHP method to determine the weights of the different factors. Details of the AHP method can be found elsewhere [61,62]. Nonetheless, a basic summary of the AHP procedure is provided here. The AHP technique compares the criteria pairwise and assigns each criterion a numerical value in the range of 1 to 9 based on stakeholder judgments. This number indicates the precedence of one criterion over another in the pair in question [57]. An FGD was held to ascertain the degree of importance attached to the various indicators. This FGD involves a variety of stakeholders, including local development authorities, representatives of the local population, and urban planners. It should be highlighted that the entire FGD group was treated as a single individual. As a result, the consensus values from FGD were utilized to rate the intensity of each indicator’s importance. The value of this scale, its accompanying definition, and an explanation are listed in Table 3.
A pairwise matrix was created once the intensity values for each factor were obtained using the FGD. Then, the weight values of factors can be obtained by computing the primary eigenvector of the pairwise comparison square reciprocal matrix and then normalizing the sum of the components to unity as Equation (2) [64]:
However, decision makers may make incoherent (subjective) assessments, in which case the aforementioned consistency requirement is not always met. As a result, it was critical to verify the matrix’s accuracy after getting the weight values. AHP gives quantitative measures for evaluating this. Consistency is quantified using a consistency ratio. The consistency ratio (CR) is calculated using Equation (3):
where, CI and RI represent the consistency index and the random index, respectively, in which
where is the largest or principal eigenvalue of the matrix and n is the order of the matrix. RI is the average of the resulting consistency index depending on the order n.
If CR < 0.1, the pairwise comparison matrix is considered to be consistent, and the weight values produced can be used. If CR > 0.1, the matrix is judged incoherently and must be corrected by changing the element values [63].
3.3.1.4. Weighted Aggregation of Criteria
The concept of decision rules or evaluation algorithms is central to GIS-MCDM. A decision rule is a process through which criteria are chosen and combined to arrive at a particular evaluation, as well as how evaluations are compared and acted upon. Typically, decision rules include techniques for integrating criteria into a single composite index and an explanation of how alternatives will be compared using this composite index [65]. In GIS, there are three primary types of decision (or combination) rules: Boolean overlay, weighted linear combination (WLC), and ordered weighted averaging (OWA).
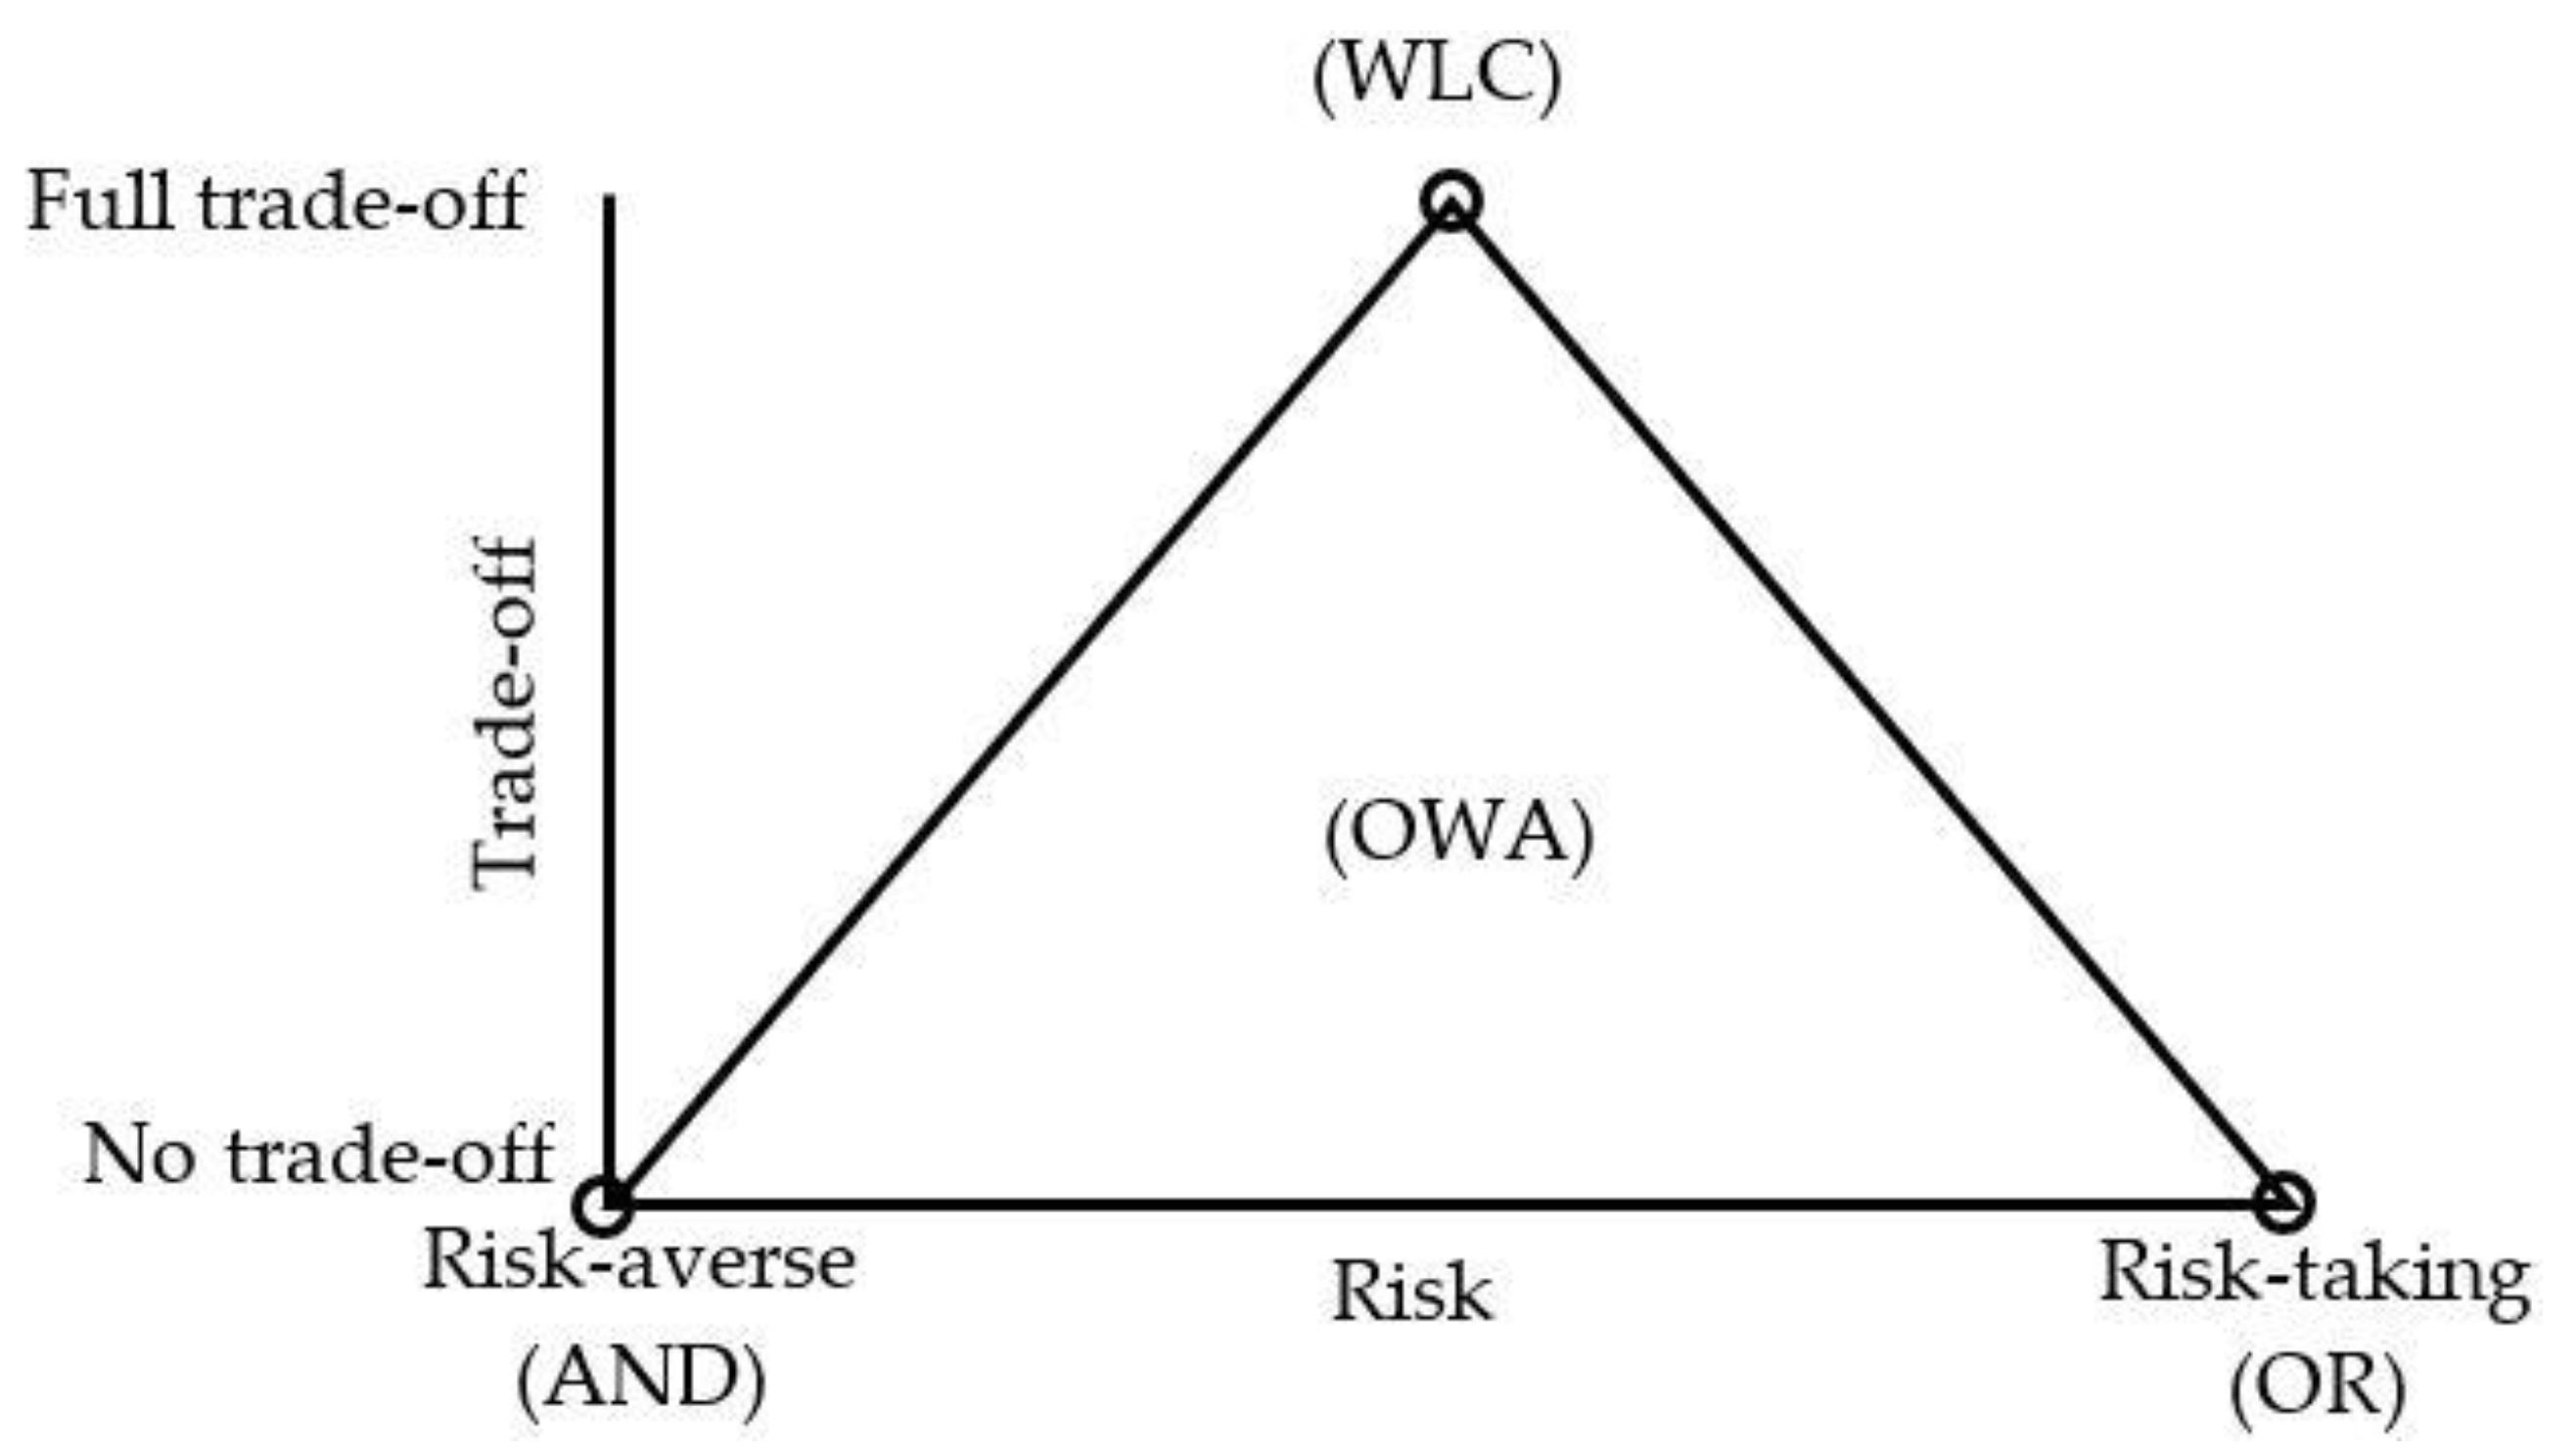
Boolean overlay reduces all criteria to logical declarations of suitability and then combines them using one or more logical operators, such as intersection (AND) and union (OR). Boolean evaluation is a very severe form of decision making. When paired with a logical AND (the intersection operator), a location must satisfy all criteria to be included in the decision set. If even one requirement is not met, the site is eliminated. This technique is fundamentally risk-averse, and it chooses places using the most conservative strategy possible—a location is chosen only if all criteria are met. On the other hand, when a logical OR (union) is utilized, the converse is true—a location is included in the decision set even if only one criterion passes the test [55]. Thus, this is a gambling technique that entails (supposedly) high risk and does not produce decisions with an intermediate level of risk (Figure 3). Boolean overlay results in the selection of appropriate sites and rejection of others without knowing their suitability level. All criteria have equal weight in the final composite suitability map, and a component with a high weight cannot compensate for a minor factor (trade-off) when determining a site’s suitability [66]. These limitations can be solved by introducing weight to the factors and combining them to find the composite suitability of different levels.
WLC involves standardizing continuous criteria (factors) to a common numeric range and then combining them using a weighted average. WLC enables criteria to make trade-offs between their qualities. Very poor quality might be offset by several extremely excellent qualities. This operator is neither AND nor OR—it is in between these two extremes. It is neither risk-averse nor risk-taking. It is proved that vector methods to MCDM are dominated by Boolean strategies, whereas raster systems are dominated by WLC solutions [26]. WLC is defined by complete trade-off and average risk, which is precisely halfway between AND and OR operations, that is, neither excessive risk aversion nor extreme risk-taking (Figure 3). WLC can be expressed by Equation (5):
where is the composite suitability (of the jth pixel or area); wi = weight of factor i; xi = criterion score of factors i; n = total number of factors.
However, none is superior—they merely offer two opposed perspectives on the decision-making process—what can be called a choice strategy. The WLC approach is not always appropriate for territorial analysis due to the inherent risk of concealing a limiting factor between the high values of other criteria. Thus, the decision maker has limited control over Boolean and WLC methods to decide the level of risk and trade-off in decision making. To avoid this problem, the ordered weighted average (OWA) was proposed by Yager [50]. The third method, OWA, is identical to the WLC procedure, except that OWA requires additional weights, referred to as order weights, and calculates the factor weights’ combination. This method provides a comprehensive range of decision methods along the two fundamental dimensions of the degree of trade-off and degree of risk associated with the solution [55] (Figure 3). OWA can be expressed by Equation (6):
where is the suitability at the ith location of the area, n is the number of indicators, is the original weight factor of the criteria, is the ordered weight of the criteria such that and , is the ordered value of the criteria at ith location.
In the case of OWA, two sets of weights are used. The first weight () of the criteria can be determined using many methods, including the analytic hierarchy process (AHP) method, as described in Section 3.3.1.3. The second weight, which is known as ordered weight, was assigned to the ordered criteria based on either increasing order or decreasing order depending on the level of acceptable risk and type of criteria. In this study, we used OWA with different combinations of ordered weights to generate alternatives with different levels of trade-off and risk following the guidelines of Eastman [56]. The combination of ordered weights is presented in Table 4.
3.3.2. Optimized Allocation of Suitable Land
In this study, we used the multiobjective land allocation (MOLA) module of TerrSet v 19.0 software to optimize residential land-use allocation under different levels of risk and trade-off. MOLA is considered a spatial optimization model that allocates appropriate uses to specific land units based on a variety of criteria, factors, and constraints [18]. The MOLA module performs this through a decision heuristic. It is intended to allocate locations by the total area thresholds set by the decision maker. Here, we allocated 1000 hectares of land for new residential development. This area was decided based on consultation with the authority. It can be mentioned that we used a total of eight factors and two constraints (Table 1) to optimize the residential land allocation. Out of these factors, five are physical criteria and three are sustainability criteria. In the traditional GIS-MCDM approach, only physical criteria were used to optimize land allocation. However, in this study, we added the sustainability criteria (social, economic, and environmental) to make sustainable land-use allocation decisions. To compare the result between the traditional approach and our approach (by adding sustainability criteria), we optimized the residential land allocation both adding sustainability criteria and without adding sustainability criteria. Then the sustainability value (social, economic, and environmental benefits) was calculated for both scenarios. Then we generated optimized land allocation, adding sustainability criteria under different levels of risk and trade-off decisions. Finally, we also calculated the values of sustainability in different decision scenarios to compare which decision produces the highest sustainability benefits. The decision strategy that can maximize the sustainability benefit (social, economic, and environmental benefits) can be decided as the optimal solution for land-use decisions.
4. Result and Discussion
4.1. Criteria of Residential Land-Use Decision
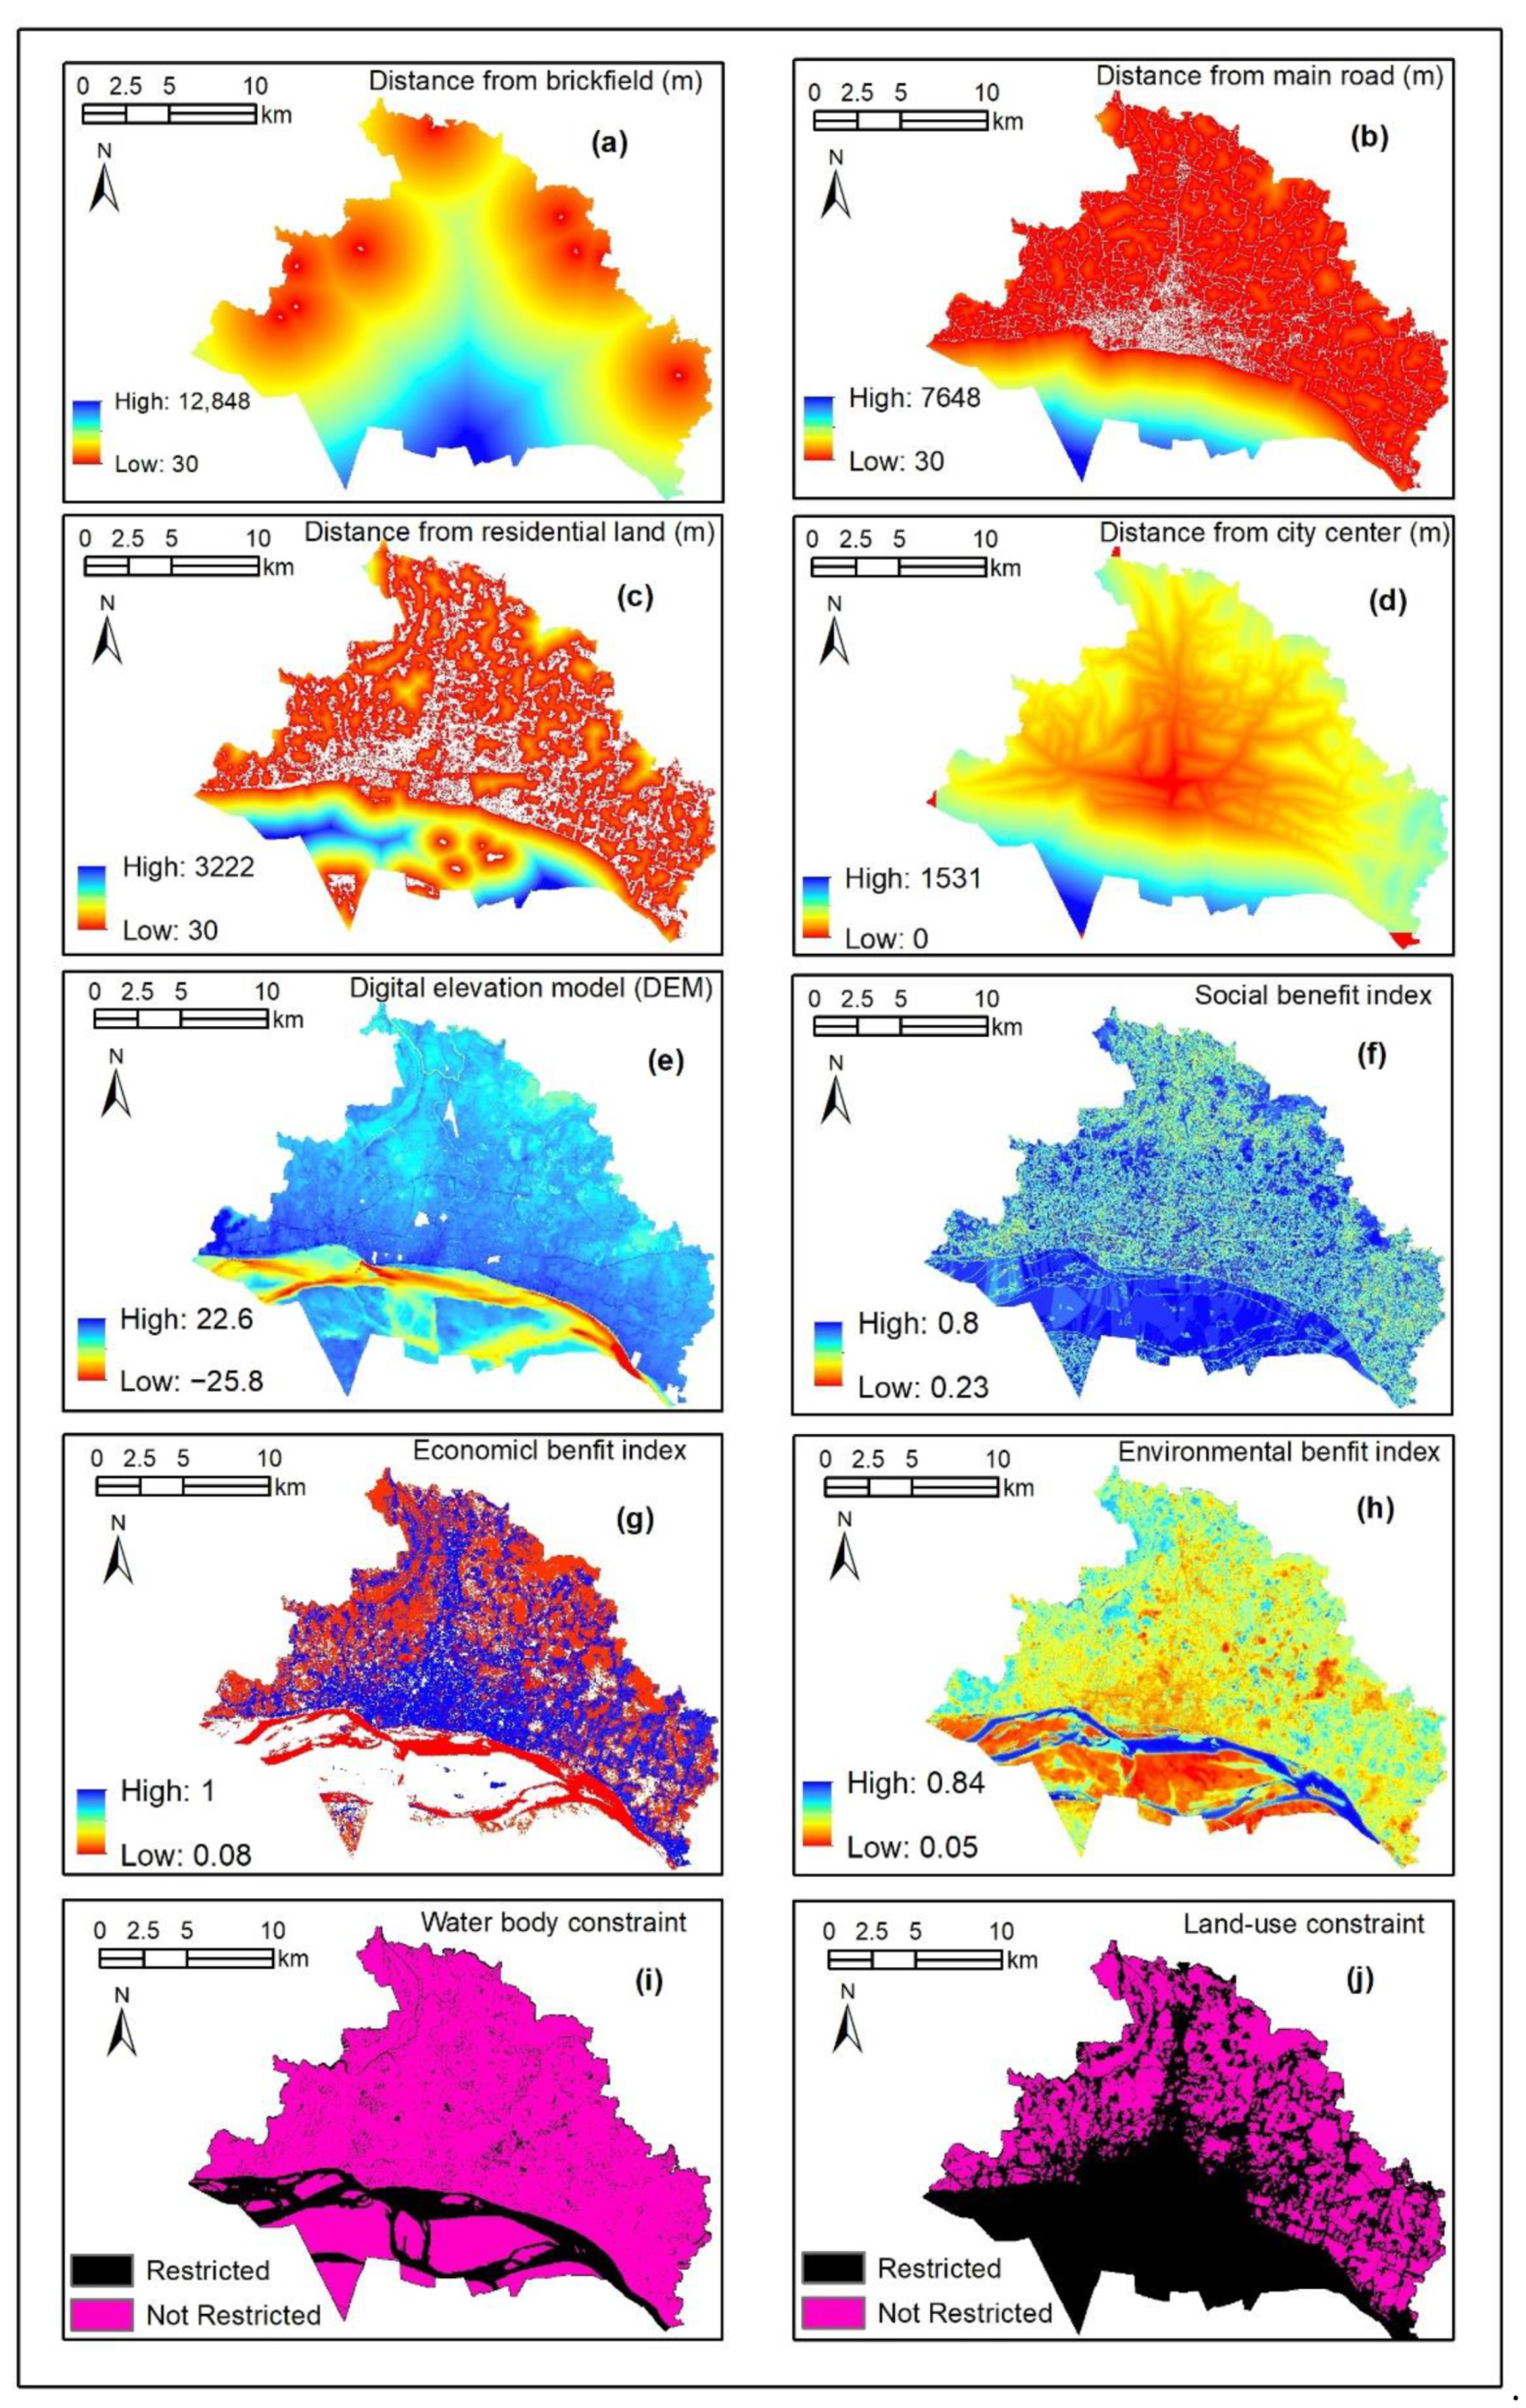
In this study, we used five physical factors, three sustainability factors, and two constraints to optimize residential land-use decisions. The values of the factors are presented in Figure 4. These physical factors are very common and were also used in many other studies for land-use suitability and optimization problems [27,52,66]. However, the sustainability factors are not common to include in the land-use optimization problem.
Distance from the brickfield is the first factor in this study. In the study area, there are six brickfields. The values of distance from brickfields are presented in Figure 4a and the standardized value of the same is presented in Figure 5a. The standardized value illustrates the suitability scale of residential development considering individual criteria. From Figure 4a, it is seen that the brickfields are mainly located at the periphery of the study area. In the suitability map (Figure 4a), it is seen that most of the area is suitable for residential development in terms of the first criteria. Within 500 m, there is no suitability value since, according to existing regulation, residential development within 500 m of brickfield is prohibited. Suitability tends to increase beyond 500 m and continue to increase up to 3000 m. After 3000 m of distance, the suitability is the same since it is considered that there will be no negative impact on residential development beyond 3000 m from the brickfield. In the case of distance from the main road (Figure 4b and Figure 5b), the suitability increase if the land is located near the main road. This strategy was also used in other studies, like the study by Assefa et al. [52]. From Figure 5b, it is observed that the suitability of residential development is comparatively higher throughout the area since the main roads are evenly distributed all over the area. It can be noted that the suitability is very low in the lower part of the study area since there exists a river and there are no roads within the area. In the case of the city center (Figure 5d), the suitability decreased from the city center since the new development is preferred within the proximity of the city center. Therefore, residential suitability is lower along the periphery in case of distance from the city center. Land height is another criterion for the selection of residential development. As per existing regulation, residential development on land having a height of less than 12 m is prohibited since it is low land and these lands are at risk of flooding and waterlogging. Therefore, the suitability increases with the increase in land height as evident in Figure 5e. Although land height was also used in many other studies for suitability analysis, the threshold value of land height is different because the land elevation is different in different places. Some studies also considered land slope for residential site suitability [67], but we did not consider slope since in our cases most of the land is flat.
The values of sustainability benefits were also included in the suitability mapping. The value of the social benefit and its standardized value are presented in Figure 4f and Figure 5f, respectively. According to Figure 5f, the social benefit in the study area is average, with the lowest and highest values being 0.23 and 0.8. The suitability of residential development is higher where the social benefit value is lower. The logic is that if the new residential development takes place in the low-benefit area, then the loss of social benefit will be minimized. The same is also true for economic benefits and environmental benefits. It is wise to select the land for residential development where the benefits of social, economic, and environmental values are lower so that the loss of these benefits can be minimized. In other words, in this way, sustainability benefits can be maximized. In addition to physical and sustainability factors, we also used two constraints to limit the new residential development. These constraints are presented in Figure 4i,j. The constraints were determined according to the existing regulation. Existing regulation prohibits the development of the water body, and only agricultural land is allowed for new development.
4.2. Weighted Suitability of Residential Land
After calculating the land suitability for individual factors, we calculated the combined land suitability based on the weights assigned to different factors. The weights of different factors were calculated based on the AHP method described in Section 3.3.1.3. The weights of different factors are presented in Table 5.
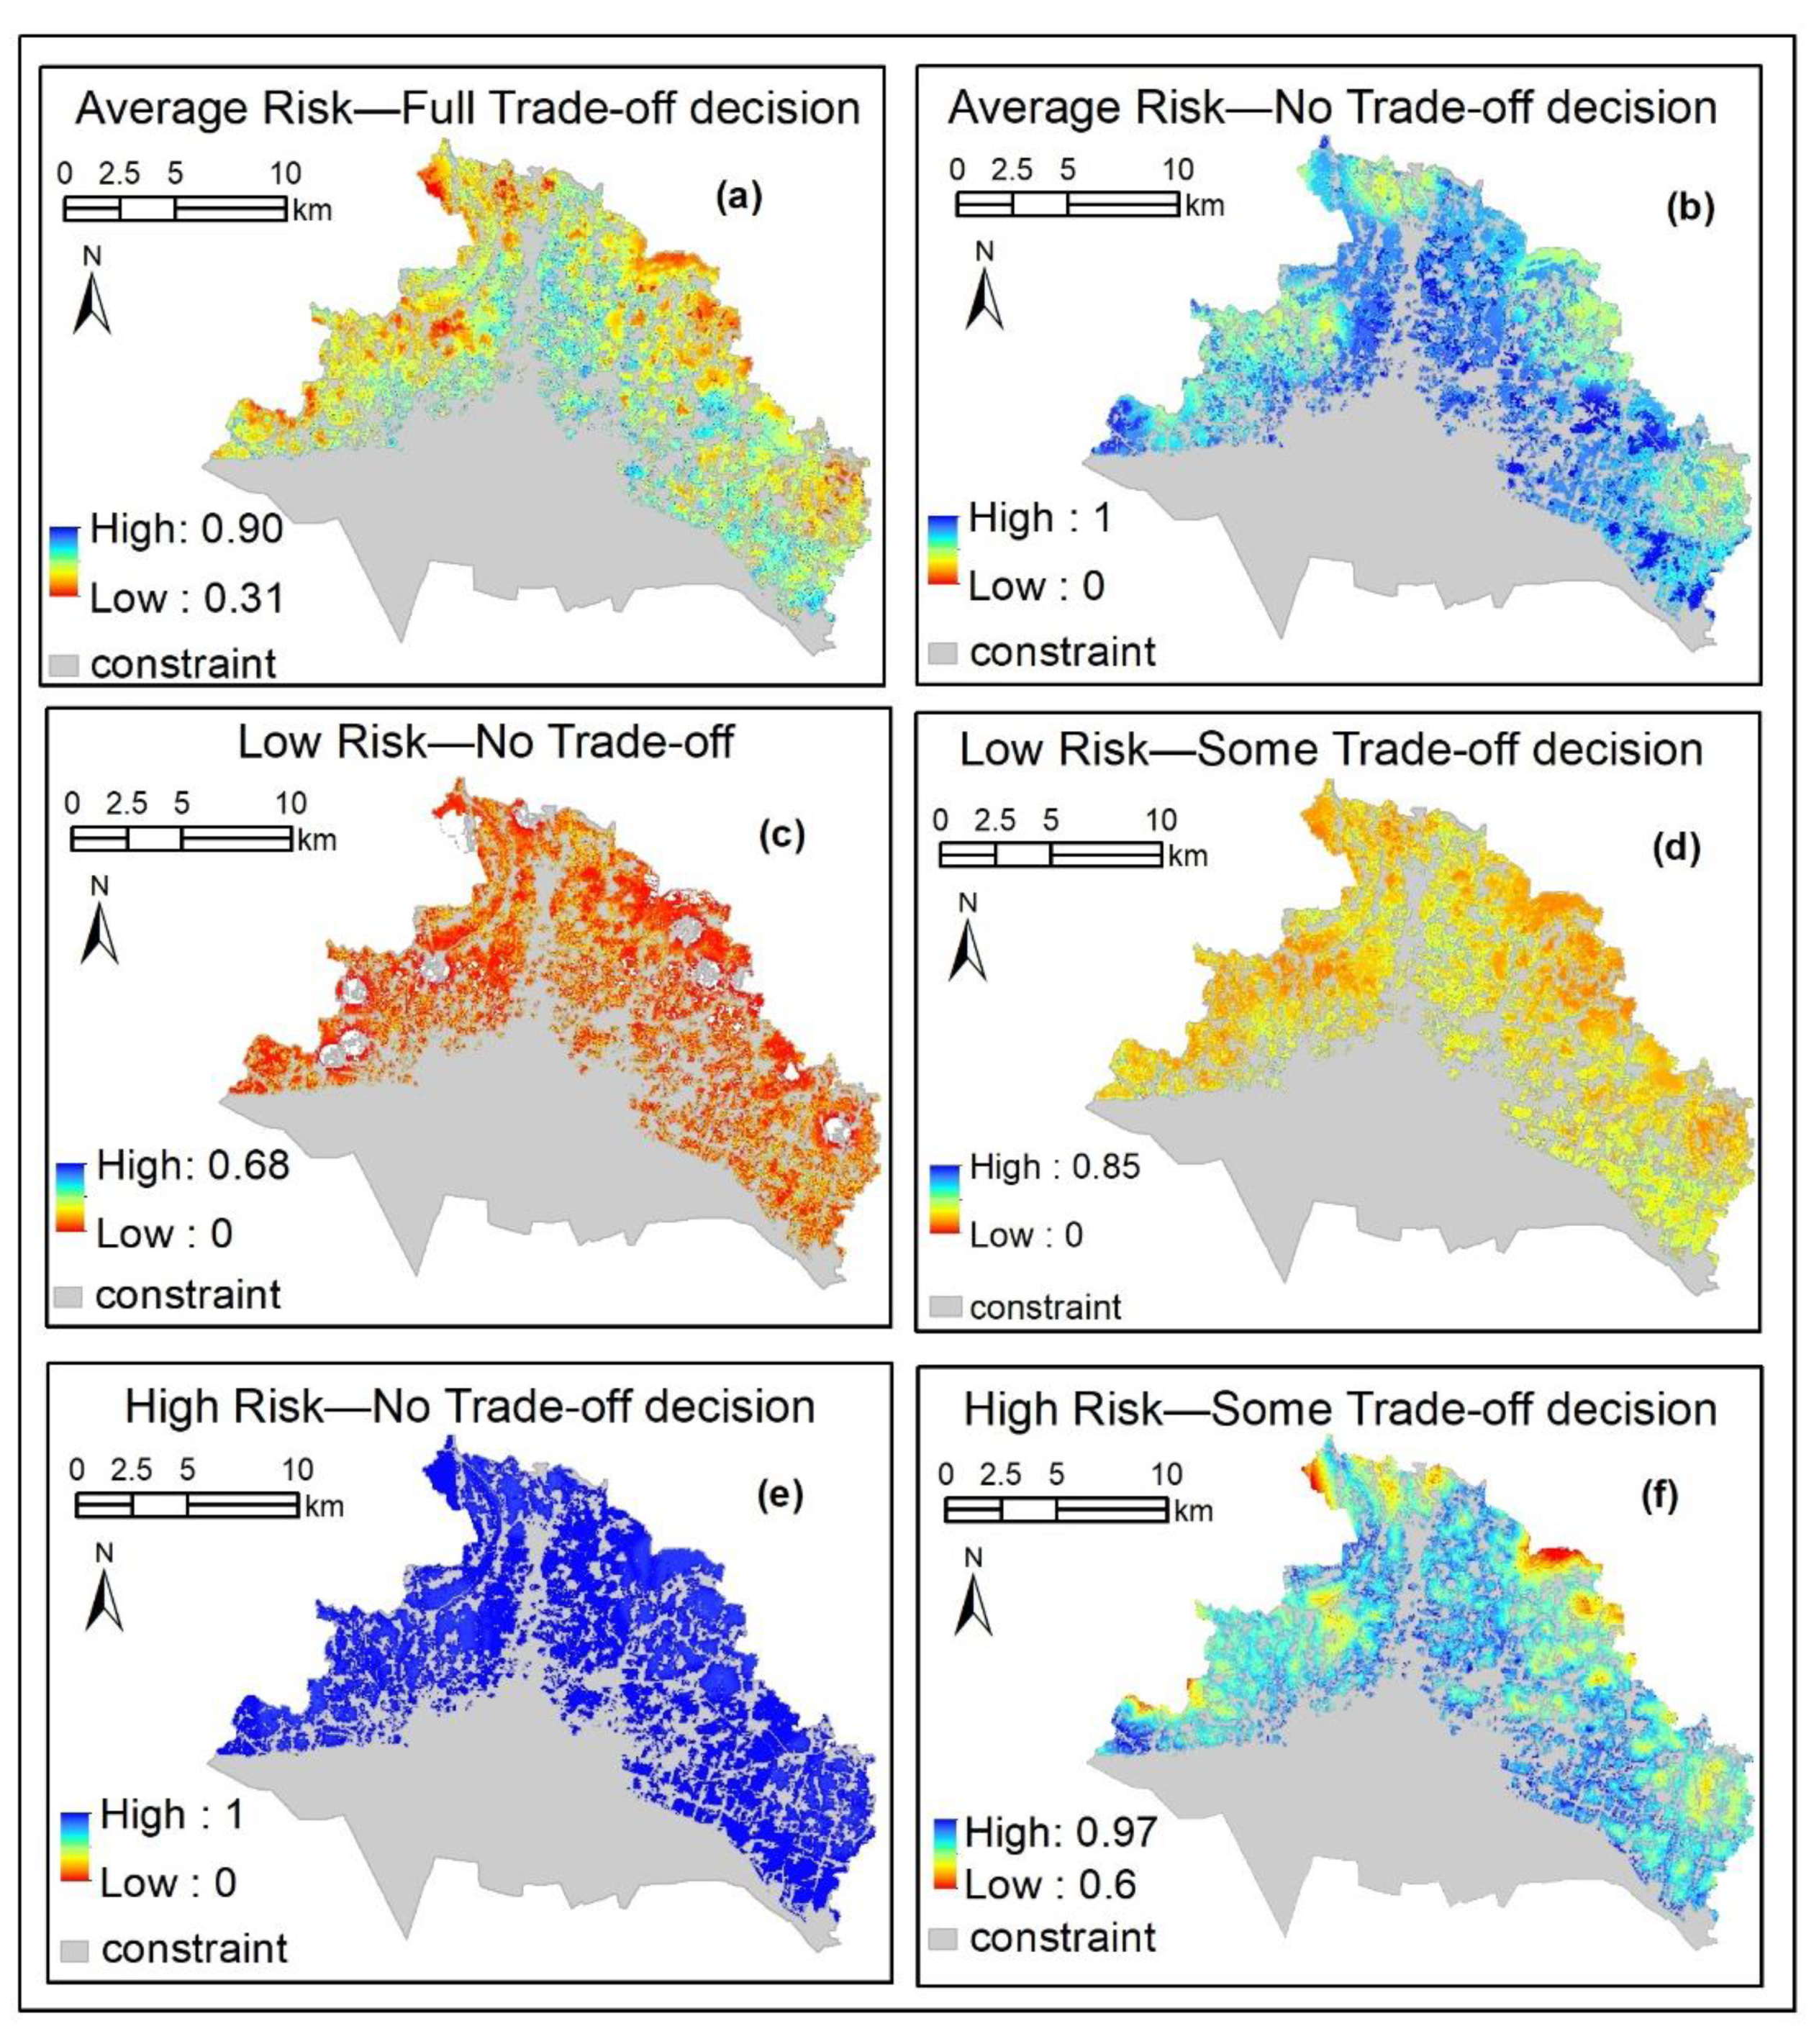
Based on the weights of different factors, we generated the weighted suitability of residential land using the OWA method. The land suitability was derived from varying levels of risk and trade-offs. In this study, we generated a suitability scale for six different land-use decision strategies: (a) average risk—full trade-off, (b) average risk—no trade-off, (c) low risk—no trade-off, (d) low risk—some trade-off, (e) high risk—no trade-off, and (f) high risk—some trade-off, following the ordered weights in Table 4. However, some studies followed different strategies to derive weighted suitability. For example, Masoudi et al. [68] separated environmental factors and applied a low level of risk and no trade-off reorder weight for environmental factors in which the first environmental factor was assigned weight 1, and for the rest of the factor weights, 0 was applied. However, in our study, we generated six alternative decision strategies for the decision makers. The suitability scale for different decision strategies is presented in Figure 6. In the case of the average risk—full trade-off decision (Figure 6a), the lowest and highest suitabilities are 0.31 and 0.90, respectively. This scenario is the output of a simple weighted linear combination. This is the average situation of decision making. In this scenario, it is seen that most of the area is not highly suitable for residential land. In the case of the average risk—no trade-off decision (Figure 6b), the suitability increased since more weight was given to the higher value of each cell. Thus, it is observed that most of the land is highly suitable for residential development. In the case of the low risk—no trade-off decision (Figure 6c), the suitability was suddenly decreased. The reason is that in this strategy, the suitability was determined based on the lowest value of different factors. Therefore, the suitability value was reduced. However, in the next scenario (Figure 6d), the suitability was increased since some extent of trade-off was allowed with the low-risk decision. In the case of the high-risk—no trade-off decision (Figure 6e), the suitability value was highly increased because, in this case, the suitability was determined based on the highest value of the factors. Therefore, the suitability value was increased drastically. If some degree of trade-off was allowed with high risk, then the suitability was decreased to some extent (Figure 6f).
4.3. Optimum Location for Residential Development
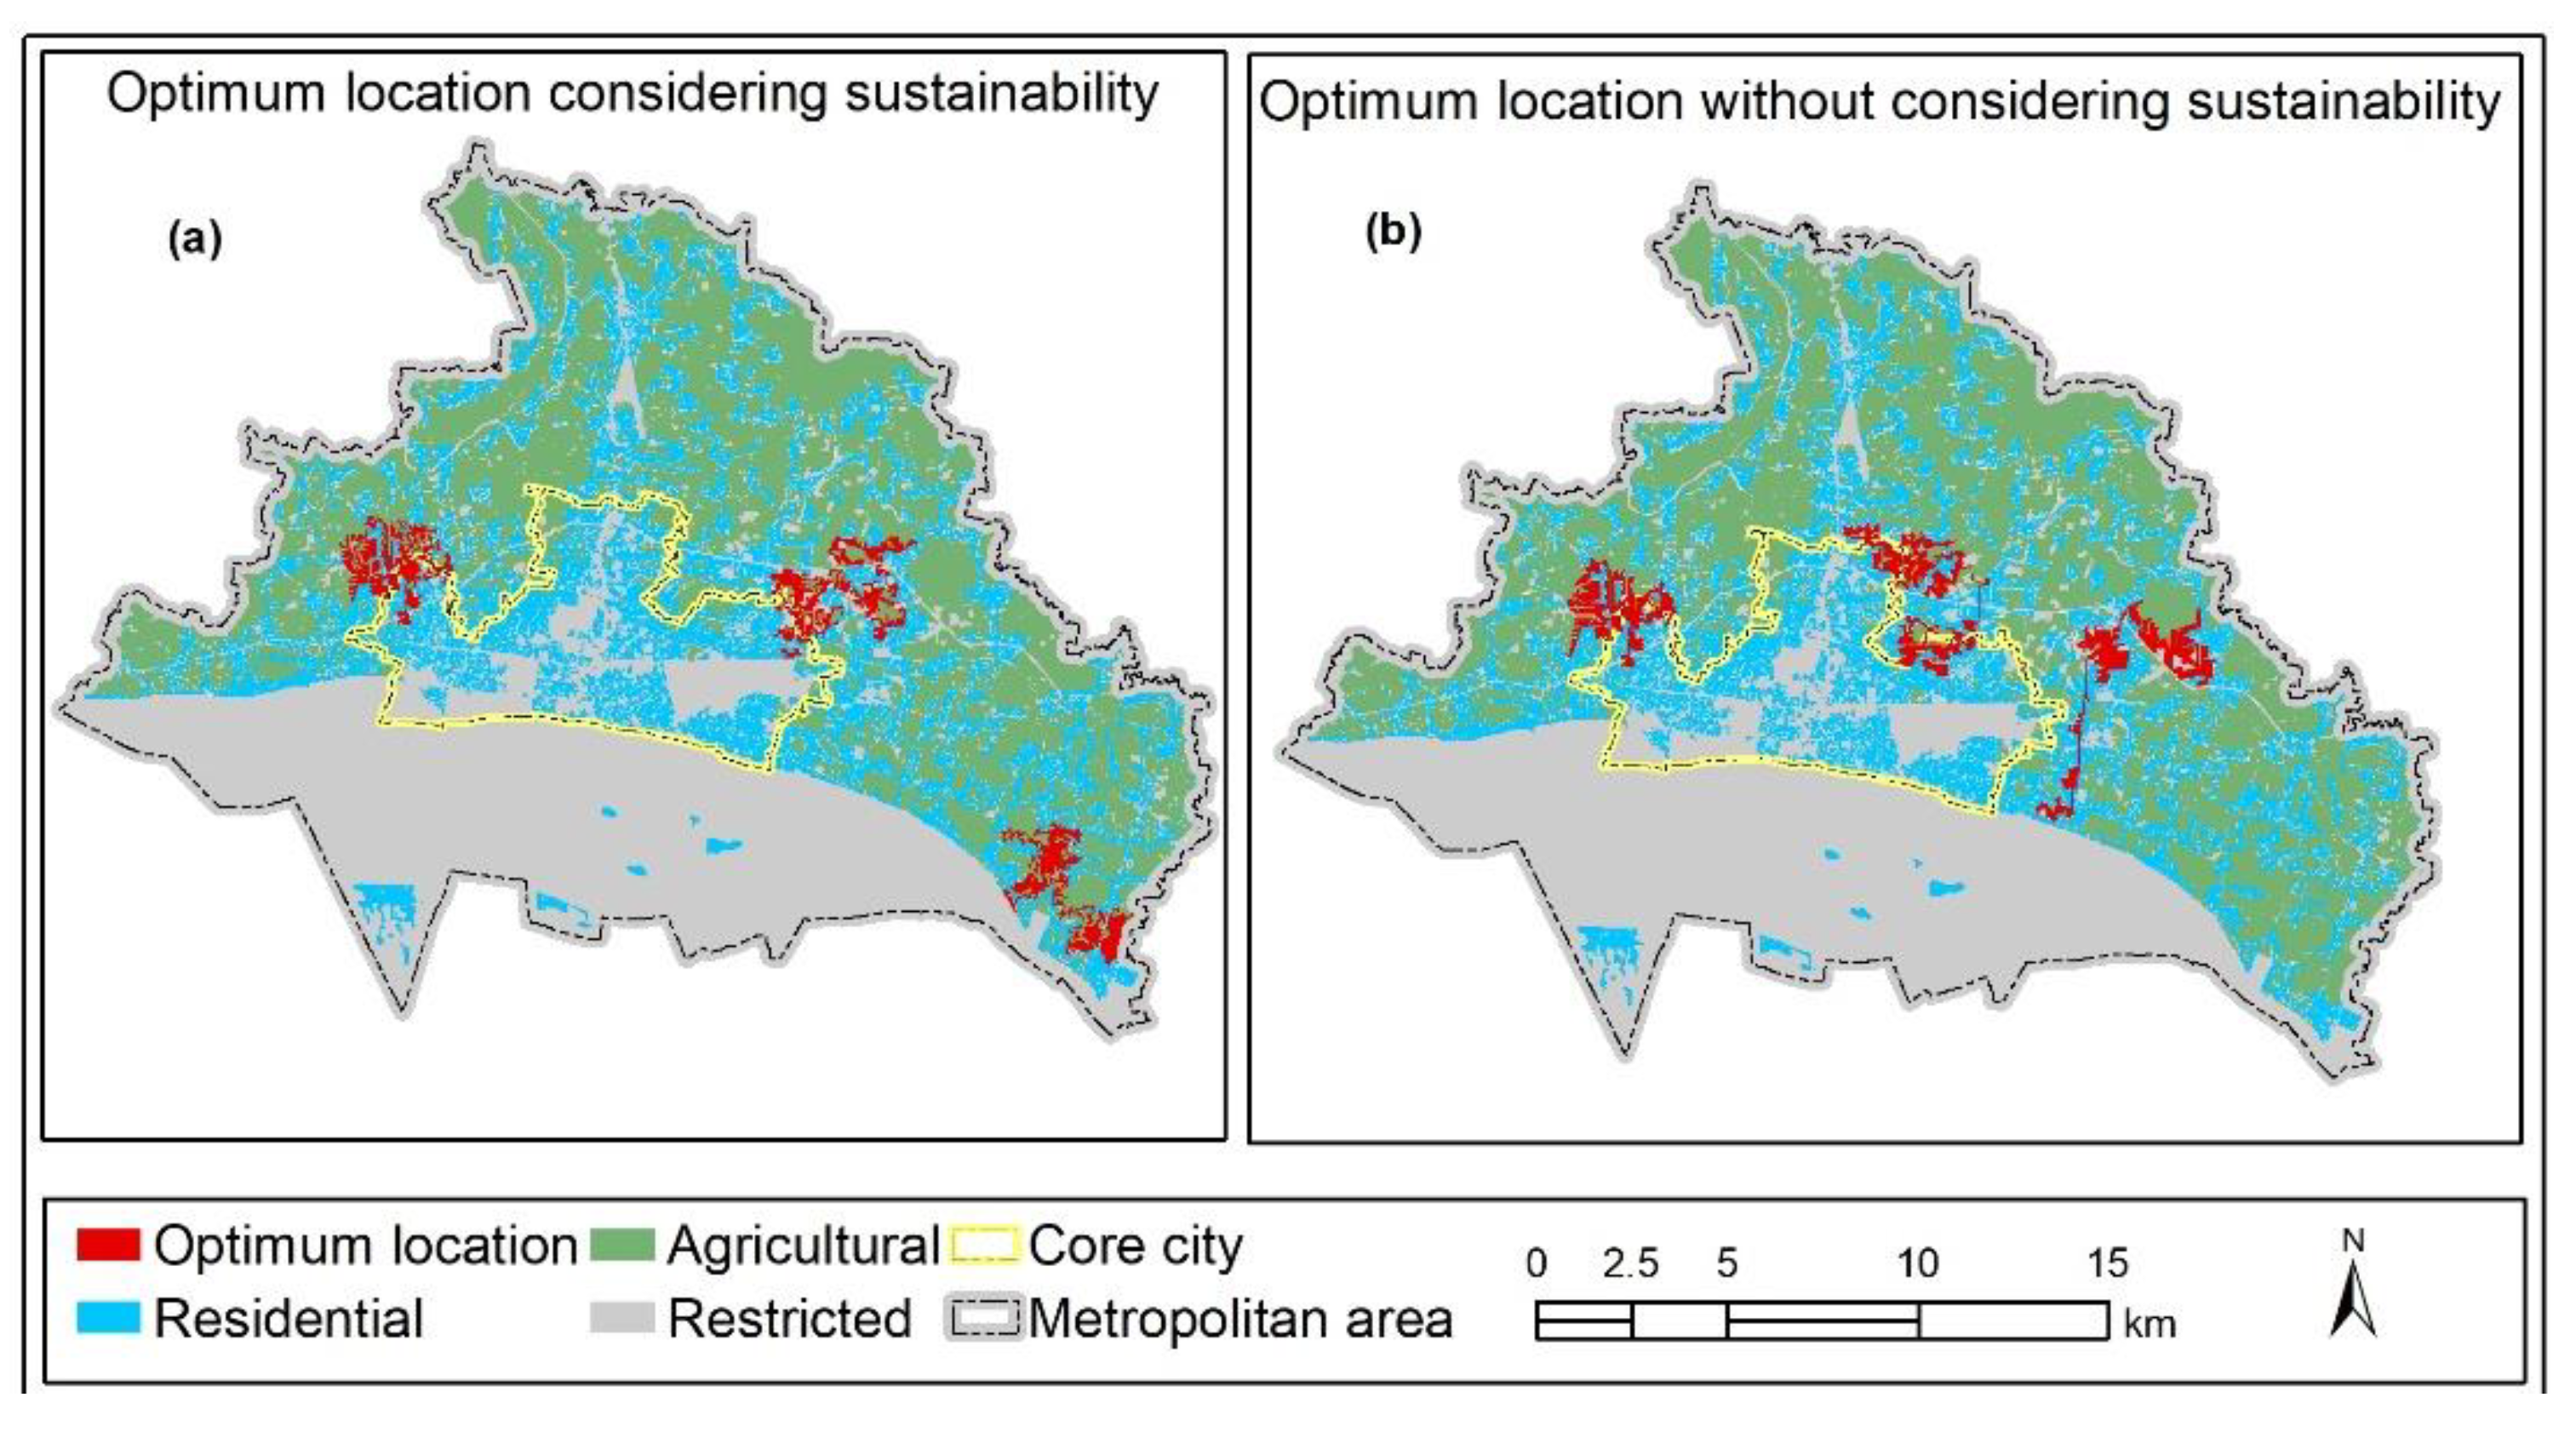
Based on the weighted suitability under different decision strategies, we generated optimal locations for residential development. First, we generated optimal location considering sustainability factors (social, economic, and environmental benefit) and without considering sustainability factors to understand to what extent sustainability benefit was derived in both situations. The result of optimal location is presented in Figure 7.
It is observed from Figure 7 that there is a difference in allocation under the two scenarios. In the case of Figure 7a, the shape of the land allocation is much more compact compared with the output in Figure 7b. In Figure 7b, the right part of the allocated land is linearly scattered. To understand the impact of this allocation on sustainability benefits, we calculated total sustainability benefits for both scenarios. It can be mentioned that the total sustainability value was calculated from Figure 4f–h. To calculate the total sustainability benefit, the restricted land was excluded. The value of sustainability benefits is presented in Table 6.
In the traditional GIS-MCDM approach, sustainability benefits were hardly considered. Although some studies looked at some aspects of sustainability in land-use optimization, the ways they measured sustainability indicators were not well established. For example, Song and Chen [18] used the NSGA-II method to find the best land allocation, taking into account four goals: maximizing agricultural suitability, construction suitability, conservation suitability, and spatial compactness. Zheng et al. [19] maximized ecosystem services and economic benefits while allocating urban land use. However, in these studies, we included all three aspects of sustainability for land-use allocation. From Table 6, it is observed that sustainability benefits were increased when sustainability factors were considered in the land-use optimization process. Table 6 shows that economic benefit was increased by 25.98% and overall sustainability benefit was increased by 9% compared with the traditional GIS-MCDM approach applied in many studies, such as Hajehforooshnia et al. [69], Mendas and Delali [48], and Masoudi et al. [68]. Although the study by Masoudi et al. [68] aimed to evaluate different land-use suitabilities to achieve sustainable land-use planning, the study did not include social, economic, and environmental dimensions directly. Rather, that study considered some environmental factors (e.g., water resource, soil, and cover) to address sustainability.
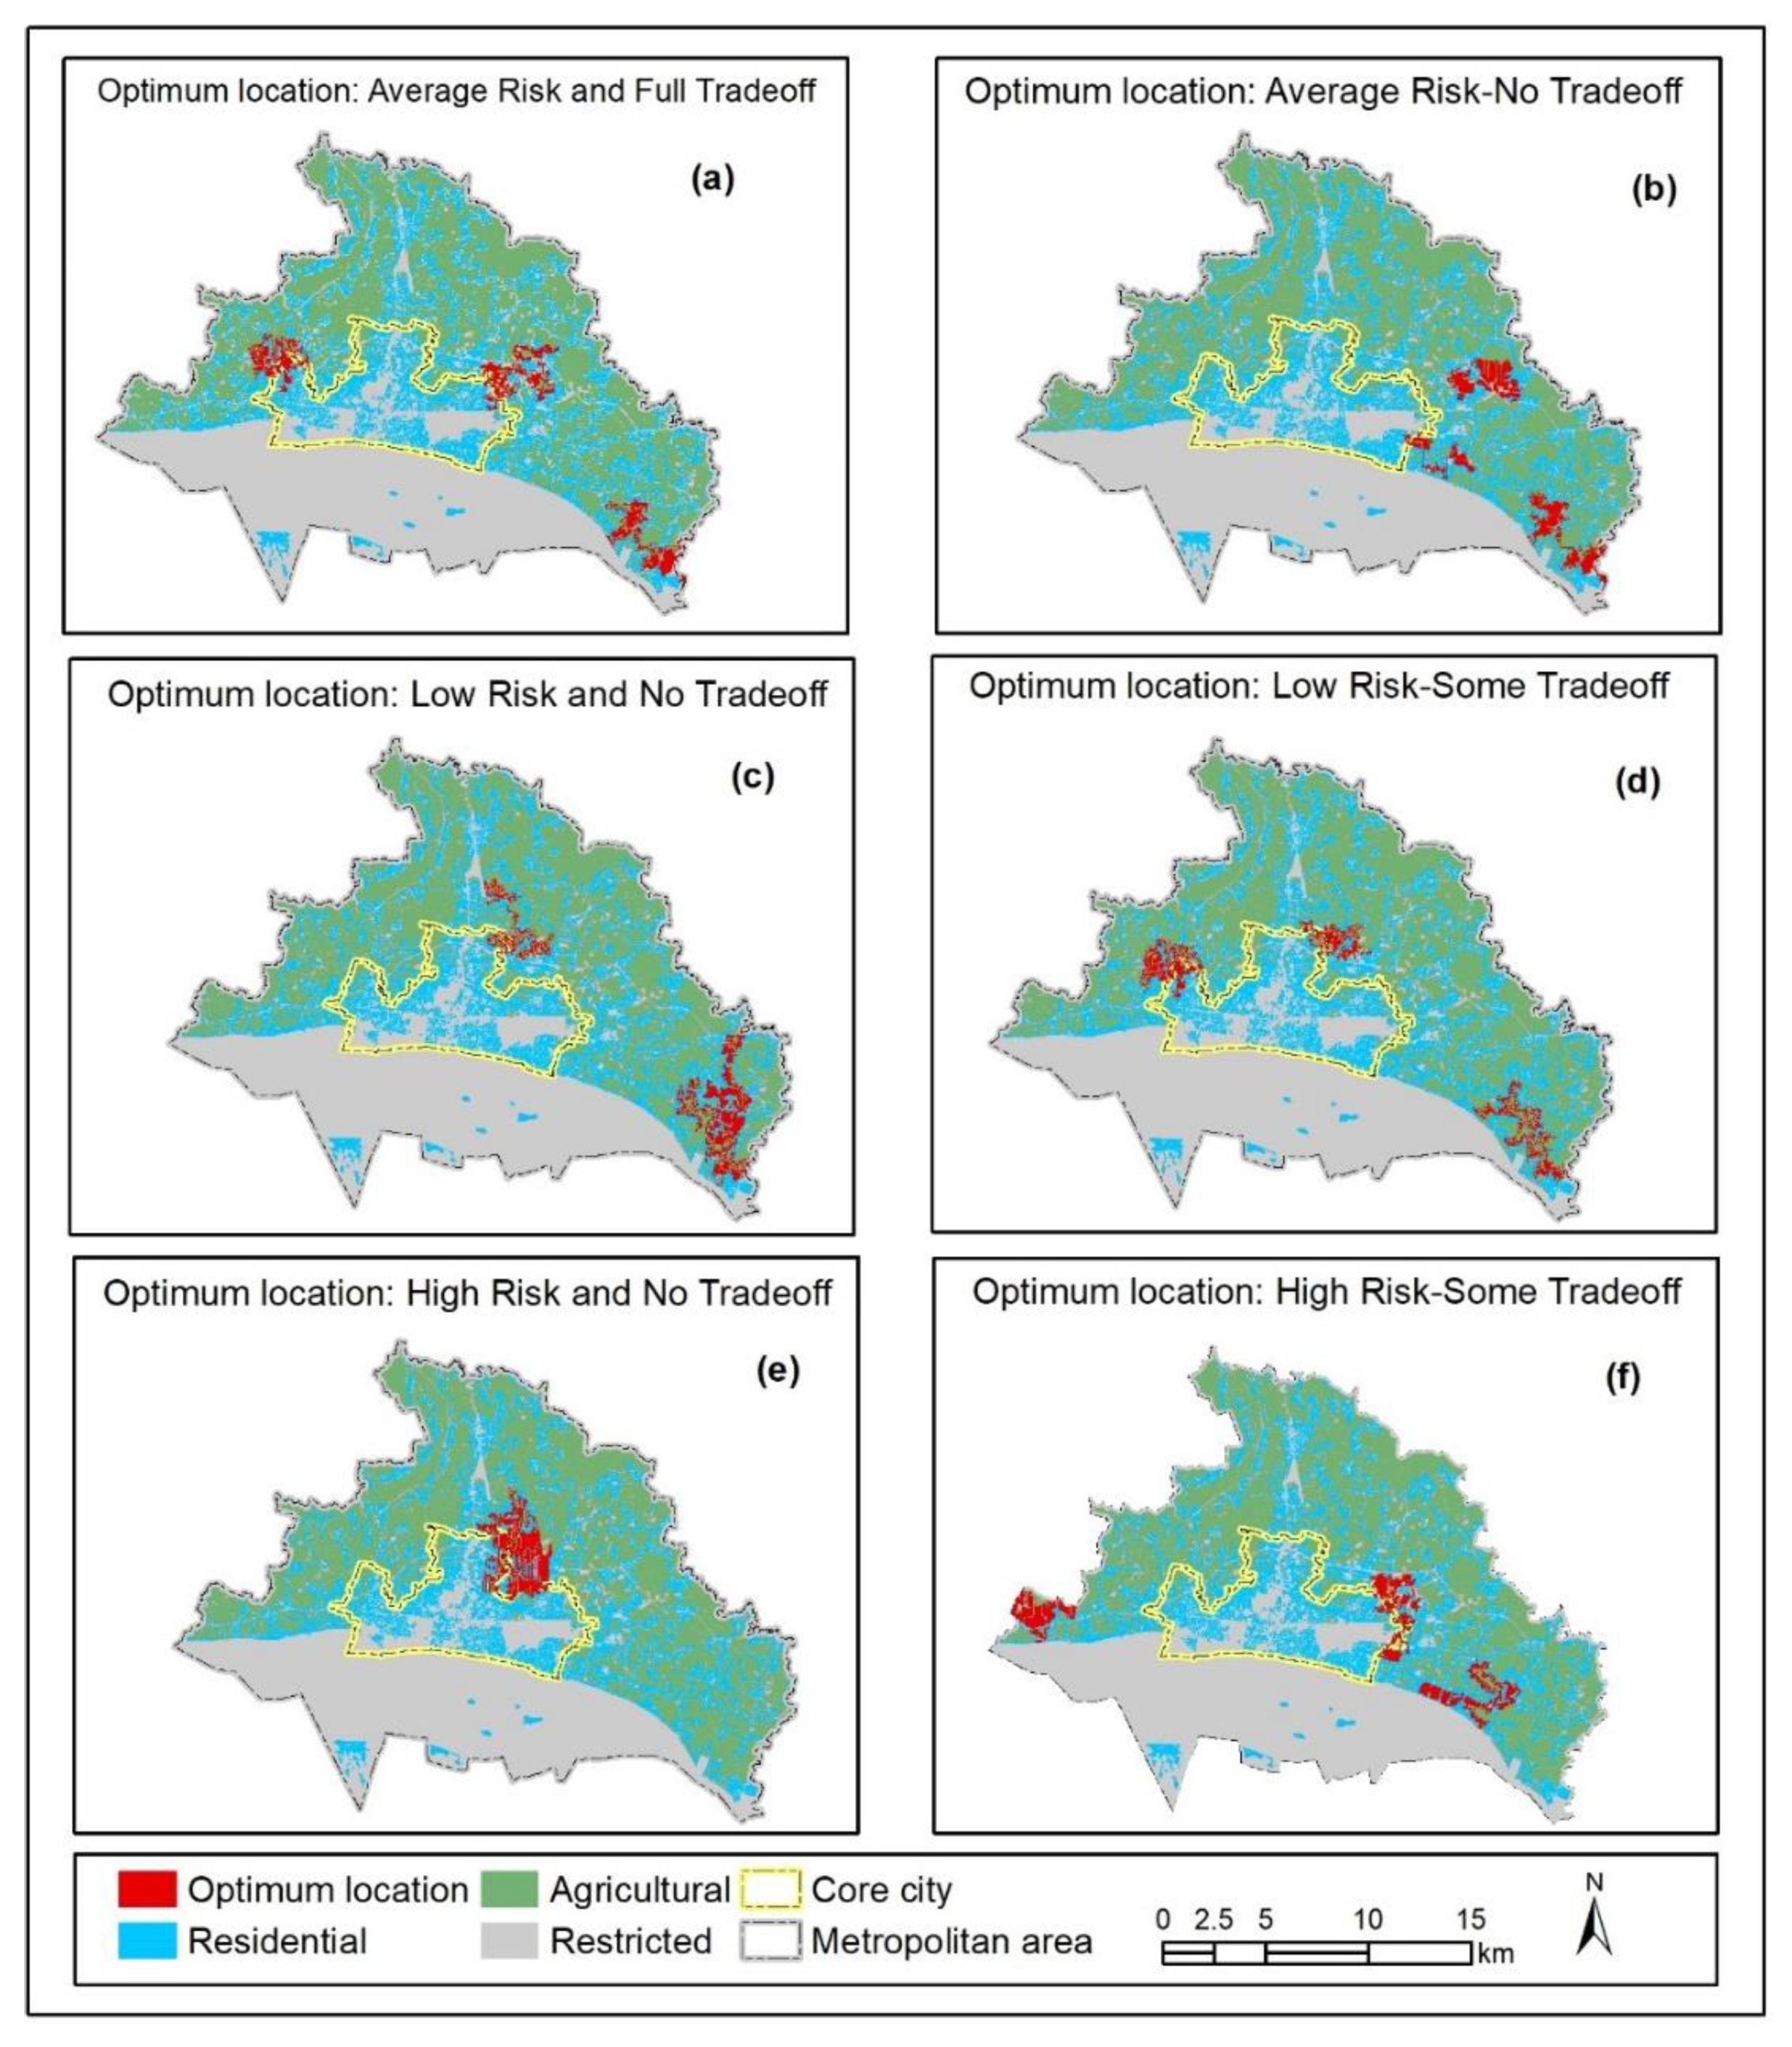
The optimal residential development locations under different decision strategies are presented in Figure 8. By different decision strategies, we mean a different level of risk and trade-off. As we mentioned in Section 3.3.1.4., two sets of weights were used to derive aggregated suitability. The first weights of factors were derived through AHP that cannot be changed. However, the second weight, which is the known ordered weight, can be varied to control the level of risk and trade-off. We applied a different combination of ordered weights to control the level of risk, as presented in Table 4. However, some studies used a different combination of ordered weights to control the level of risk and trade-off. For example, Masoudi et al. [68] applied a low level of risk and no trade-off for environmental factors, so the first environmental factor was assigned weight 1, and for the other factors, weight 0 was applied. They used such order since they grouped environmental factors separately, but we did not divide factors into any group. In fact, for our case, no such social or environmental group was required because we already calculated social and environmental values considering multiple indicators, as described in Rahman and Szabó [29].
Figure 8. The optimum locations of new residential development are illustrated under different decision strategies. It is seen from Figure 8 that the optimum location of new residential development varies under different decision strategies. In the case of Figure 8a,b,d,f, there are three parts of optimal location, whereas in Figure 8c, there are two optimal locations, and in Figure 8e, optimal location is concentrated in one location. These are the alternatives for new residential development. However, to aid the decision maker, we also computed the sustainability values of land allocation under different decision strategies. The sustainability values are presented in Table 7.
Table 7 shows that the sustainability benefit values of optimum land allocation are different under different decision strategies. It is observed that the highest sustainability benefit value was derived from the high risk and no trade-off decision (Figure 8e), followed by low level of risk—some trade-off (Figure 8d) and average level of risk—no trade-off (Figure 8b). The lowest sustainability value was derived from the high level of risk—some trade-off decision (Figure 8f). In this study, we optimized residential land-use locations, focusing on urban sustainability. We also calculated the value of sustainability in a different scenario. However, some other studies considered sustainability in land-use optimization but did not consider all three aspects of sustainability. For example, Cao et al. [37] and Yuan et al. [38] optimized sustainable land-use allocation but only considered the social benefit of land-use allocation; Cao, Zhang, and Wang [20] optimized land-use allocation by taking the compatibility of land-use and environmental advantages into account.
5. Conclusions
This paper presents a GIS-based multicriteria decision-making (GIS-MCDM) approach to optimize the location of new residential development. The traditional GIS-MCDM approach only considered physical factors to optimize urban land-use allocation, and sustainability dimensions (social, economic, and environmental benefits) were rarely addressed to optimize land-use allocation. In this study, we presented a GIS-MCDM approach to optimize residential land-use allocation by addressing social, economic, and environmental factors. The main contribution of this paper is the integration of sustainability factors to optimize residential land-use allocation, which was not addressed earlier. The study demonstrated that about 9.00% more sustainability benefits can be derived using our proposed approach. This proves that the proposed approach is much more efficient compared with the traditional approach. Using our proposed approach, we generated six alternative decision scenarios of optimum locations for new residential development (Figure 8). Among the alternative decision strategies, the “high risk—no trade-off” (Figure 8e, Table 7) decision strategy generated the highest sustainability benefit in our case. In this study, we used the OWA technique to aggregate multiple criteria. There are also some other functions to aggregate the criteria, such as Bonferroni and Choquet integral, which could generate a different result, but we did not use these functions. This is one of the limitations of this study. Future studies can use some other aggregation functions, such as Bonferroni and Choquet integral, to compare the results. The proposed approach and findings of the study can be used to support land-use decision making in cities to achieve sustainable urban development. Since the global urban population is increasing, it becomes a global concern to devise an appropriate technique to plan urban land-use sustainably. However, the previous techniques merely touched upon the sustainability issues in land-use optimization. Against this background, the proposed approach incorporated sustainability criteria to optimize urban land-use location. Therefore, the proposed approach has practical implications for decision makers concerning sustainable urban land-use planning.
Author Contributions
Conceptualization, Md. Mostafizur Rahman; methodology, Md. Mostafizur Rahman; software, Md. Mostafizur Rahman; validation, Md. Mostafizur Rahman; formal analysis, Md. Mostafizur Rahman; investigation, Md. Mostafizur Rahman; resources, Md. Mostafizur Rahman; data curation, Md. Mostafizur Rahman; writing—original draft preparation, Md. Mostafizur Rahman; writing—review and editing, Md. Mostafizur Rahman and György Szabó; supervision, György Szabó. All authors have read and agreed to the published version of the manuscript.
Funding
This research received no external funding.
Institutional Review Board Statement
Not applicable.
Informed Consent Statement
Not applicable.
Data Availability Statement
The datasets used in this study are available from the corresponding author on request.
Acknowledgments
This research work is an output of a doctoral study at the Department of Photogrammetry and Geoinformatics, Budapest University of Technology and Economics. The first author thanks the Ministry of Foreign Affairs and Trade and Tempus Public Foundation of the Hungarian government for providing him with the opportunity to study Ph.D. with a Stipendium Hungaricum Scholarship.
Conflicts of Interest
The authors declare no conflict of interest.
References
- United Nations, Department of Economic and Social Affairs. World Urbanization Prospects: The 2018 Revision (ST/ESA/SER.A/420); United Nations: New York, NY, USA, 2019. [Google Scholar] [CrossRef] [Green Version]
- Knoema. Bangladesh Urban Population, 1960–2021, Jan. 2022. Available online: https://knoema.com/atlas/Bangladesh/Urban-population (accessed on 26 February 2022).
- UN/DESA. World Urbanization Prospect: The 2018 Revision, Key Facts. 2018. Available online: https://population.un.org/wup/Publications/ (accessed on 26 February 2022).
- Jabareen, Y.R. Sustainable Urban Forms: Their typologies, models, and concepts. J. Plan. Educ. Res. 2006, 26, 38–52. [Google Scholar] [CrossRef]
- Persson, C. Deliberation or doctrine? Land use and spatial planning for sustainable development in Sweden. Land Use Policy 2013, 34, 301–313. [Google Scholar] [CrossRef]
- Ward, D.P.; Murray, A.T.; Phinn, S.R. Integrating spatial optimization and cellular automata for evaluating urban change. Ann. Reg. Sci. 2003, 37, 131–148. [Google Scholar] [CrossRef]
- Akash, M.; Akter, J.; Tamanna, T.; Kabir, M.R. The Urbanization and Environmental Challenges in Dhaka City. In Proceedings of the RAIS Conference, Tampa, FL, USA, 19–20 February 2018; pp. 45–57. [Google Scholar] [CrossRef] [Green Version]
- Kudrat-E-Khuda. Causes of Air Pollution in Bangladesh’s Capital City and Its Impacts on Public Health. Nat. Environ. Pollut. Technol. 2020, 19, 1483–1490. [Google Scholar] [CrossRef]
- Ligmann-Zielinska, A.; Church, R.L.; Jankowski, P. Spatial optimization as a generative technique for sustainable multiobjective land-use allocation. Int. J. Geogr. Inf. Sci. 2008, 22, 601–622. [Google Scholar] [CrossRef]
- El Din, H.S.; Shalaby, A.; Farouh, H.E.; Elariane, S. Principles of urban quality of life for a neighborhood. HBRC J. 2013, 9, 86–92. [Google Scholar] [CrossRef] [Green Version]
- Dempsey, N.; Bramley, G.; Power, S.; Brown, C. The social dimension of sustainable development: Defining urban social sustainability. Sustain. Dev. 2011, 19, 289–300. [Google Scholar] [CrossRef]
- Badhan, I.M.; Ching, S.W. The Exploration of Effective Spatial Performance of Accessible Neighbourhood Green (Ang), Including its Proportion and Standard Distance from User in Dhanmondi Residential Area, Dhaka. Creat. Space 2021, 8, 57–66. [Google Scholar] [CrossRef]
- Nancy, D.S.J. Urban Densification and Social Sustainability: A Case Study of Dhaka. Glob. J. Hum.-Soc. Sci. 2021, 21, 17–36. [Google Scholar] [CrossRef]
- Roy, S.; Sowgat, T.; Islam, S.M.T.; Anjum, N. Sustainability Challenges for Sprawling Dhaka. Environ. Urban. ASIA 2021, 12, S59–S84. [Google Scholar] [CrossRef]
- Karimi, A.; Hockings, M. A social-ecological approach to land-use conflict to inform regional and conservation planning and management. Landsc. Ecol. 2018, 33, 691–710. [Google Scholar] [CrossRef]
- Wang, S.-D.; Zhang, H.-B.; Wang, X.-C. Simulating Land Use Structure Optimization Based on an Improved Multi-Objective Differential Evolution Algorithm. Pol. J. Environ. Stud. 2019, 28, 887–899. [Google Scholar] [CrossRef]
- Rahman, M.; Szabó, G. Multi-objective urban land use optimization using spatial data: A systematic review. Sustain. Cities Soc. 2021, 74, 103214. [Google Scholar] [CrossRef]
- Song, M.; Chen, D. An improved knowledge-informed NSGA-II for multi-objective land allocation (MOLA). Geo-Spat. Inf. Sci. 2018, 21, 273–287. [Google Scholar] [CrossRef] [Green Version]
- Zheng, W.; Ke, X.; Xiao, B.; Zhou, T. Optimising land use allocation to balance ecosystem services and economic benefits—A case study in Wuhan, China. J. Environ. Manag. 2019, 248, 109306. [Google Scholar] [CrossRef]
- Cao, K.; Zhang, W.; Wang, T. Spatio-temporal land use multi-objective optimization: A case study in Central China. Trans. GIS 2019. [Google Scholar] [CrossRef]
- Cao, K.; Batty, M.; Huang, B.; Liu, Y.; Yu, L.; Chen, J. Spatial multi-objective land use optimization: Extensions to the non-dominated sorting genetic algorithm-II. Int. J. Geogr. Inf. Sci. 2011, 25, 1949–1969. [Google Scholar] [CrossRef]
- Haque, A.; Asami, Y. Optimizing Urban Land-Use Allocation: Case Study of Dhanmondi Residential Area, Dhaka, Bangladesh. Environ. Plan. B Plan. Des. 2011, 38, 388–410. [Google Scholar] [CrossRef]
- Neema, M.; Ohgai, A. Multi-objective location modeling of urban parks and open spaces: Continuous optimization. Comput. Environ. Urban Syst. 2010, 34, 359–376. [Google Scholar] [CrossRef]
- Steele, K.; Carmel, Y.; Cross, J.; Wilcox, C. Uses and Misuses of Multicriteria Decision Analysis (MCDA) in Environmental Decision Making. Risk Anal. 2009, 29, 26–33. [Google Scholar] [CrossRef]
- Romano, G.; Sasso, P.D.; Liuzzi, G.T.; Gentile, F. Multi-criteria decision analysis for land suitability mapping in a rural area of Southern Italy. Land Use Policy 2015, 48, 131–143. [Google Scholar] [CrossRef]
- Malczewski, J. GIS-based multicriteria decision analysis: A survey of the literature. Int. J. Geogr. Inf. Sci. 2006, 20, 703–726. [Google Scholar] [CrossRef]
- Nguyen, T.T.; Verdoodt, A.; Van, Y.N.T.; Delbecque, N.; Tran, T.C.; Van Ranst, E. Design of a GIS and multi-criteria based land evaluation procedure for sustainable land-use planning at the regional level. Agric. Ecosyst. Environ. 2015, 200, 1–11. [Google Scholar] [CrossRef]
- Rahman, M.; Szabó, G. A Novel Composite Index to Measure Environmental Benefits in Urban Land Use Optimization Problems. ISPRS Int. J. Geo-Inf. 2022, 11, 220. [Google Scholar] [CrossRef]
- Rahman, M.; Szabó, G. A Geospatial Approach to Measure Social Benefits in Urban Land Use Optimization Problem. Land 2021, 10, 1398. [Google Scholar] [CrossRef]
- Abdullah, A.Y.M.; Masrur, A.; Adnan, M.S.G.; Baky, M.A.A.; Hassan, Q.K.; Dewan, A. Spatio-temporal Patterns of Land Use/Land Cover Change in the Heterogeneous Coastal Region of Bangladesh between 1990 and 2017. Remote Sens. 2019, 11, 790. [Google Scholar] [CrossRef] [Green Version]
- Mohammadi, M.; Nastaran, M.; Sahebgharani, A. Sustainable Spatial Land Use Optimization through Non-Dominated Sorting Genetic Algorithm-II (NSGA-II): (Case Study: Baboldasht District of Isfahan). Indian J. Sci. Technol. 2015, 8, 118. [Google Scholar] [CrossRef]
- Huang, B.; Zhang, W. Sustainable Land-Use Planning for a Downtown Lake Area in Central China: Multiobjective Optimization Approach Aided by Urban Growth Modeling. J. Urban Plan. Dev. 2014, 140, 04014002. [Google Scholar] [CrossRef] [Green Version]
- Wang, H.; Zhang, X.; Skitmore, M. Implications for sustainable land use in high-density cities: Evidence from Hong Kong. Habitat Int. 2015, 50, 23–34. [Google Scholar] [CrossRef]
- Kim, M.; You, S.; Chon, J.; Lee, J. Sustainable Land-Use Planning to Improve the Coastal Resilience of the Social-Ecological Landscape. Sustainability 2017, 9, 1086. [Google Scholar] [CrossRef] [Green Version]
- Handayanto, R.T.; Tripathi, N.K.; Kim, S.M.; Guha, S. Achieving a Sustainable Urban Form through Land Use Optimisation: Insights from Bekasi City’s Land-Use Plan (2010–2030). Sustainability 2017, 9, 221. [Google Scholar] [CrossRef] [Green Version]
- Li, F.; Gong, Y.; Cai, L.; Sun, C.; Chen, Y.; Liu, Y.; Jiang, P. Sustainable Land-Use Allocation: A Multiobjective Particle Swarm Optimization Model and Application in Changzhou, China. J. Urban Plan. Dev. 2018, 144, 04018010. [Google Scholar] [CrossRef]
- Cao, K.; Huang, B.; Wang, S.; Lin, H. Sustainable land use optimization using Boundary-based Fast Genetic Algorithm. Comput. Environ. Urban Syst. 2012, 36, 257–269. [Google Scholar] [CrossRef]
- Yuan, M.; Liu, Y.; He, J.; Liu, D. Regional land-use allocation using a coupled MAS and GA model: From local simulation to global optimization, a case study in Caidian District, Wuhan, China. Cartogr. Geogr. Inf. Sci. 2014, 41, 363–378. [Google Scholar] [CrossRef]
- Zhang, H.; Zeng, Y.; Jin, X.; Shu, B.; Zhou, Y.; Yang, X. Simulating multi-objective land use optimization allocation using Multi-agent system—A case study in Changsha, China. Ecol. Model. 2016, 320, 334–347. [Google Scholar] [CrossRef]
- Jenks, M.; Jones, C. (Eds.) Issues and Concepts. In Dimensions of the Sustainable City; Springer: London, UK, 2010; p. 9. [Google Scholar]
- Mouratidis, K. Is compact city livable? The impact of compact versus sprawled neighbourhoods on neighbourhood satisfaction. Urban Stud. 2017, 55, 2408–2430. [Google Scholar] [CrossRef]
- Kotulla, T.; Denstadli, J.M.; Oust, A.; Beusker, E. What Does It Take to Make the Compact City Liveable for Wider Groups? Identifying Key Neighbourhood and Dwelling Features. Sustainability 2019, 11, 3480. [Google Scholar] [CrossRef] [Green Version]
- Nadeem, M.; Aziz, A.; Al-Rashid, M.A.; Tesoriere, G.; Asim, M.; Campisi, T. Scaling the Potential of Compact City Development: The Case of Lahore, Pakistan. Sustainability 2021, 13, 5257. [Google Scholar] [CrossRef]
- Pamučar, D.; Stević, Ž.; Sremac, S. A New Model for Determining Weight Coefficients of Criteria in MCDM Models: Full Consistency Method (FUCOM). Symmetry 2018, 10, 393. [Google Scholar] [CrossRef] [Green Version]
- Hošková-Mayerová, Š.; Talhofer, V.; Otřísal, P.; Rybanský, M. Influence of Weights of Geographical Factors on the Results of Multicriteria Analysis in Solving Spatial Analyses. ISPRS Int. J. Geo-Inf. 2020, 9, 489. [Google Scholar] [CrossRef]
- Köhler, B.; Ruud, A.; Aas, Ø.; Barton, D.N. Decision making for sustainable natural resource management under political constraints—The case of revising hydropower licenses in Norwegian watercourses. Civ. Eng. Environ. Syst. 2019, 36, 17–31. [Google Scholar] [CrossRef]
- Zhang, Y.; Li, A.; Fung, T. Using GIS and Multi-criteria Decision Analysis for Conflict Resolution in Land Use Planning. Procedia Environ. Sci. 2012, 13, 2264–2273. [Google Scholar] [CrossRef] [Green Version]
- Mendas, A.; Delali, A. Integration of MultiCriteria Decision Analysis in GIS to develop land suitability for agriculture: Application to durum wheat cultivation in the region of Mleta in Algeria. Comput. Electron. Agric. 2012, 83, 117–126. [Google Scholar] [CrossRef]
- Luan, C.; Liu, R.; Peng, S. Land-use suitability assessment for urban development using a GIS-based soft computing approach: A case study of Ili Valley, China. Ecol. Indic. 2021, 123, 107333. [Google Scholar] [CrossRef]
- Yager, R. On ordered weighted averaging aggregation operators in multicriteria decisionmaking. IEEE Trans. Syst. Man Cybern. 1988, 18, 183–190. [Google Scholar] [CrossRef]
- Rahman, M.; Szabó, G. Impact of Land Use and Land Cover Changes on Urban Ecosystem Service Value in Dhaka, Bangladesh. Land 2021, 10, 793. [Google Scholar] [CrossRef]
- Assefa, T.; Jha, M.; Reyes, M.; Srinivasan, R.; Worqlul, A.W. Assessment of Suitable Areas for Home Gardens for Irrigation Potential, Water Availability, and Water-Lifting Technologies. Water 2018, 10, 495. [Google Scholar] [CrossRef] [Green Version]
- Gong, J.; Liu, Y.; Chen, W. Optimal land use allocation of urban fringe in Guangzhou. J. Geogr. Sci. 2012, 22, 179–191. [Google Scholar] [CrossRef]
- Božanić, D.; Tešić, D.; Milićević, J. A hybrid fuzzy ahp-mabac model: Application in the serbian army—The selection of thelocation for deep wading as a technique of crossing the river by tanks. Decis. Mak. Appl. Manag. Eng. 2018, 1, 143–164. [Google Scholar] [CrossRef]
- Jiang, H.; Eastman, J.R. Application of fuzzy measures in multi-criteria evaluation in GIS. Int. J. Geogr. Inf. Sci. 2000, 14, 173–184. [Google Scholar] [CrossRef]
- Eastman, J.R. IDRISI Selva Manual—Guide to GIS and Image Processing; Clark University; Worcester, MA, USA, 2012. [Google Scholar]
- Saaty, R.W. The analytic hierarchy process—What it is and how it is used. Math. Model. 1987, 9, 161–176. [Google Scholar] [CrossRef] [Green Version]
- Diakoulaki, D.; Mavrotas, G.; Papayannakis, L. Determining objective weights in multiple criteria problems: The critic method. Comput. Oper. Res. 1995, 22, 763–770. [Google Scholar] [CrossRef]
- Kadoic, N. Characteristics of the Analytic Network Process, a Multi-Criteria Decision-Making Method. Croat. Oper. Res. Rev. 2018, 9, 235–244. [Google Scholar] [CrossRef] [Green Version]
- Olsen, A.A.; Wolcott, M.D.; Haines, S.T.; Janke, K.K.; McLaughlin, J.E. How to use the Delphi method to aid in decision making and build consensus in pharmacy education. Curr. Pharm. Teach. Learn. 2021, 13, 1376–1385. [Google Scholar] [CrossRef] [PubMed]
- Oluleye, I.B.; Ogunleye, M.B.; Oyetunji, A.K. Evaluation of the critical success factors for sustainable housing delivery: Analytic hierarchy process approach. J. Eng. Des. Technol. 2020, 19, 1044–1062. [Google Scholar] [CrossRef]
- Oluleye, I.B.; Oyetunji, A.K.; Olukolajo, M.A.; Chan, D.W. Integrating building information modelling for improving facility management operations: A fuzzy synthetic evaluation of the critical success factors. J. Facil. Manag. 2021. [Google Scholar] [CrossRef]
- Saaty, T.L. How to make a decision: The analytic hierarchy process. Eur. J. Oper. Res. 1990, 48, 9–26. [Google Scholar] [CrossRef]
- Nguyen, T.; Bleys, B. Applying Analytic Hierarchy Process to Adaptation to Saltwater Intrusion in Vietnam. Sustainability 2021, 13, 2311. [Google Scholar] [CrossRef]
- Starr, S.; Zeleny, M. MCDM: State and future of the arts. In Multiple Criteria Decision Making; North-Holland: Amsterdam, The Netherlands, 1977; pp. 5–9. [Google Scholar]
- Malczewski, J. Ordered weighted averaging with fuzzy quantifiers: GIS-based multicriteria evaluation for land-use suitability analysis. Int. J. Appl. Earth Obs. Geoinf. 2006, 8, 270–277. [Google Scholar] [CrossRef]
- Ustaoglu, E.; Aydınoglu, A. Suitability evaluation of urban construction land in Pendik district of Istanbul, Turkey. Land Use Policy 2020, 99, 104783. [Google Scholar] [CrossRef]
- Masoudi, M.; Centeri, C.; Jakab, G.; Nel, L.; Mojtahedi, M. GIS-Based Multi-Criteria and Multi-Objective Evaluation for Sustainable Land-Use Planning (Case Study: Qaleh Ganj County, Iran) “Landuse Planning Using MCE and Mola”. Int. J. Environ. Res. 2021, 15, 457–474. [Google Scholar] [CrossRef]
- Hajehforooshnia, S.; Soffianian, A.; Mahiny, A.S.; Fakheran, S. Multi objective land allocation (MOLA) for zoning Ghamishloo Wildlife Sanctuary in Iran. J. Nat. Conserv. 2011, 19, 254–262. [Google Scholar] [CrossRef]
Figure 1.
(a) Location of Rajshahi district in relation to Bangladesh; (b) location of the study area in relation to Rajshahi district; (c) administrative boundary of the study area.
Figure 1.
(a) Location of Rajshahi district in relation to Bangladesh; (b) location of the study area in relation to Rajshahi district; (c) administrative boundary of the study area.

Figure 2.
Land-use optimization process using the MCDM approach.

Figure 3.
Decision strategy triangle within the continuum of risk and trade-off dimension, adapted from Eastman [56].
Figure 3.
Decision strategy triangle within the continuum of risk and trade-off dimension, adapted from Eastman [56].

Figure 4.
Values of factors and constraints used in the residential land-use optimization problem: (a) distance from brick field; (b) distance from main road; (c) distance from residential land; (d) distance from city center; (e) digital elevation model; (f) social benefit index; (g) economic benefit index; (h) environmental benefit index; (i) water body constraint; (j) land use constraint.

Figure 5.
Residential land suitability scale (standardized value) for different factors: (a) distance from brick field; (b) distance from main road; (c) distance from residential land; (d) distance from city center; (e) digital elevation model; (f) social benefit index; (g) economic benefit index; (h) environmental benefit index.

Figure 6.
Weighted suitability of residential land under different decision strategies: (a) average risk—full trade-off; (b) average risk—no trade-off; (c) low risk—no trade-off; (d) low risk—some trade-off; (e) high risk—no trade-off; (f) high risk—some trade-off.
Figure 6.
Weighted suitability of residential land under different decision strategies: (a) average risk—full trade-off; (b) average risk—no trade-off; (c) low risk—no trade-off; (d) low risk—some trade-off; (e) high risk—no trade-off; (f) high risk—some trade-off.

Figure 7.
Optimal location of residential land: (a) considering sustainability and (b) without considering sustainability.
Figure 7.
Optimal location of residential land: (a) considering sustainability and (b) without considering sustainability.

Figure 8.
Optimum location of new residential development under different decision strategies: (a) average risk and full trade-off; (b) average risk and no trade-off; (c) low risk and no trade-off; (d) low risk and some trade-off; (e) high risk and no trade-off; (f) high risk and some trade-off.
Figure 8.
Optimum location of new residential development under different decision strategies: (a) average risk and full trade-off; (b) average risk and no trade-off; (c) low risk and no trade-off; (d) low risk and some trade-off; (e) high risk and no trade-off; (f) high risk and some trade-off.


Table 1.
List of factors and constraints used for residential land suitability.
| Criteria | Types | Name |
|---|---|---|
| Factors | Physical factors | Distance from the town center |
| Distance from main roads | ||
| Distance from existing residential land | ||
| Distance from brickfield | ||
| Land elevation | ||
| Sustainability factors | Social benefit | |
| Environmental benefit | ||
| Economic benefit | ||
| Constraints | Existing land use | |
| Existing water bodies | ||
Table 2.
The factors, fuzzy membership function, control points, and shape of the function used in this study.
Table 2.
The factors, fuzzy membership function, control points, and shape of the function used in this study.
| Factors | Fuzzy Membership Function | Control Points | Shape of Function | |||
|---|---|---|---|---|---|---|
| a | b | c | d | |||
| Distance from city center | Linear | 0 | 1531 | Monotonically decreasing | ||
| Distance from main roads | Linear | 30 | 7648 | Monotonically decreasing | ||
| Distance from existing residential land | Linear | 30 | 3222 | Monotonically decreasing | ||
| Distance from brickfield | Sigmoidal | 500 | 3000 | Monotonically increasing | ||
| Land elevation | Linear | 12 | 22 | Monotonically increasing | ||
| Social benefit | Linear | 0.23 | 0.8 | Monotonically decreasing | ||
| Environmental benefit | Linear | 0.05 | 0.84 | Monotonically decreasing | ||
| Economic benefit | Linear | 0.08 | 1 | Monotonically decreasing | ||
Table 3.
The fundamental scale of numbers is used in the AHP method.
| Intensity of Importance | Definition | Explanation |
|---|---|---|
| 1 | Equal importance | Two activities contribute equally to the objective |
| 3 | Moderate importance of one over another | Experience and judgment slightly favor one activity over another |
| 5 | Essential or strong importance | Experience and judgment strongly favor one activity over another |
| 7 | Very strong importance | An activity is strongly favored, and its dominance demonstrated in practice |
| 9 | Extreme importance | The evidence favoring one activity over another is of the highest possible order of affirmation |
| 2, 4, 6, 8 | Intermediate values between the two adjacent judgments | When compromise is needed |
Source: adapted from Saaty [63].
Table 4.
Ordered weights used in different strategies.
| Decision Strategies | Ordered Weights | |||||||
|---|---|---|---|---|---|---|---|---|
| Average Level of Risk—Full Trade-Off | 0.125 | 0.125 | 0.125 | 0.125 | 0.125 | 0.125 | 0.125 | 0.125 |
| Low Risk—No Trade-Off | 1 | 0 | 0 | 0 | 0 | 0 | 0 | 0 |
| High Risk—No Trade-Off | 0 | 0 | 0 | 0 | 0 | 0 | 0 | 1 |
| Low Level of Risk—Some Trade-Off | 0.4 | 0.3 | 0.12 | 0.07 | 0.05 | 0.03 | 0.02 | 0.01 |
| High Level of Risk—Some Trade-Off | 0.01 | 0.02 | 0.03 | 0.05 | 0.07 | 0.12 | 0.3 | 0.4 |
| Average Level of Risk - No Trade-Off | 0 | 0 | 0 | 0.5 | 0.5 | 0 | 0 | 0 |
Table 5.
Weights of different factors.
| Factors | Weight |
|---|---|
| Distance from brickfield | 0.06 |
| Digital elevation model (DEM) | 0.05 |
| Distance from main roads | 0.16 |
| Distance from the town center | 0.10 |
| Distance from existing residential land | 0.11 |
| Social benefit | 0.27 |
| Economic benefit | 0.04 |
| Environmental benefit | 0.22 |
Table 6.
Sustainability benefit values of optimal land allocation.
| Sustainability Dimension | Sustainability Benefit Value (Unitless) | ||
|---|---|---|---|
| Without Considering Sustainability | Considering Sustainability | % Increase of Benefit Considering Sustainability | |
| Social benefit | 95,370.08 | 100,775.70 | 5.67 |
| Environmental benefit | 62,277.21 | 67,616.00 | 8.57 |
| Economic benefit | 20,283.13 | 25,553.56 | 25.98 |
| Total | 177,930.42 | 193,945.26 | 9.00 |
Table 7.
Sustainability benefit values under different decision strategies.
| Sustainability Dimension | Sustainability Values Under Different Decision Strategies (Unitless) | |||||
|---|---|---|---|---|---|---|
| ARFT | ARNT | HRNT | HRST | LRNT | LRST | |
| Social benefit | 64,970.11 | 65,502.01 | 66,184.19 | 63,883.22 | 64,851.03 | 65,333.28 |
| Environmental benefit | 21,122.65 | 21,331.75 | 21,432.61 | 20,814.49 | 21,088.68 | 21,256.21 |
| Economic benefit | 184,282.03 | 185,542.07 | 188,179.53 | 182,448.89 | 184,897.84 | 185,908.95 |
| Total benefit | 64,970.11 | 65,502.01 | 66,184.19 | 63,883.22 | 64,851.03 | 65,333.28 |
ARFT = average level of risk—full trade-off, ARNT = average level of risk—no trade-off, HRNT = high risk and no trade-off, HRST= high level of risk—some trade-off, LRNT = low risk and no trade-off, LRST= low level of risk—some trade-off.
Publisher’s Note: MDPI stays neutral with regard to jurisdictional claims in published maps and institutional affiliations. |
© 2022 by the authors. Licensee MDPI, Basel, Switzerland. This article is an open access article distributed under the terms and conditions of the Creative Commons Attribution (CC BY) license (https://creativecommons.org/licenses/by/4.0/).
Share and Cite
MDPI and ACS Style
Rahman, M.M.; Szabó, G. Sustainable Urban Land-Use Optimization Using GIS-Based Multicriteria Decision-Making (GIS-MCDM) Approach. ISPRS Int. J. Geo-Inf. 2022, 11, 313. https://0-doi-org.brum.beds.ac.uk/10.3390/ijgi11050313
AMA Style
Rahman MM, Szabó G. Sustainable Urban Land-Use Optimization Using GIS-Based Multicriteria Decision-Making (GIS-MCDM) Approach. ISPRS International Journal of Geo-Information. 2022; 11(5):313. https://0-doi-org.brum.beds.ac.uk/10.3390/ijgi11050313
Chicago/Turabian StyleRahman, Md. Mostafizur, and György Szabó. 2022. "Sustainable Urban Land-Use Optimization Using GIS-Based Multicriteria Decision-Making (GIS-MCDM) Approach" ISPRS International Journal of Geo-Information 11, no. 5: 313. https://0-doi-org.brum.beds.ac.uk/10.3390/ijgi11050313
Note that from the first issue of 2016, this journal uses article numbers instead of page numbers. See further details here.