Identifying Land Use/Cover Dynamics in the Koga Catchment, Ethiopia, from Multi-Scale Data, and Implications for Environmental Change

Abstract
:1. Introduction
2. Materials and Methods
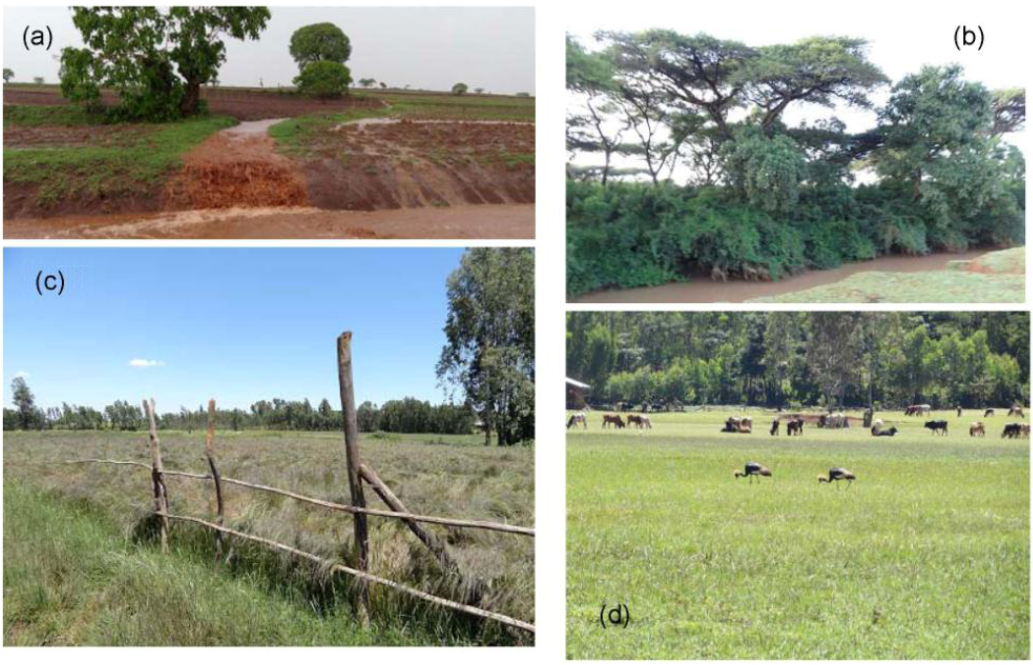
2.1. The Study Area
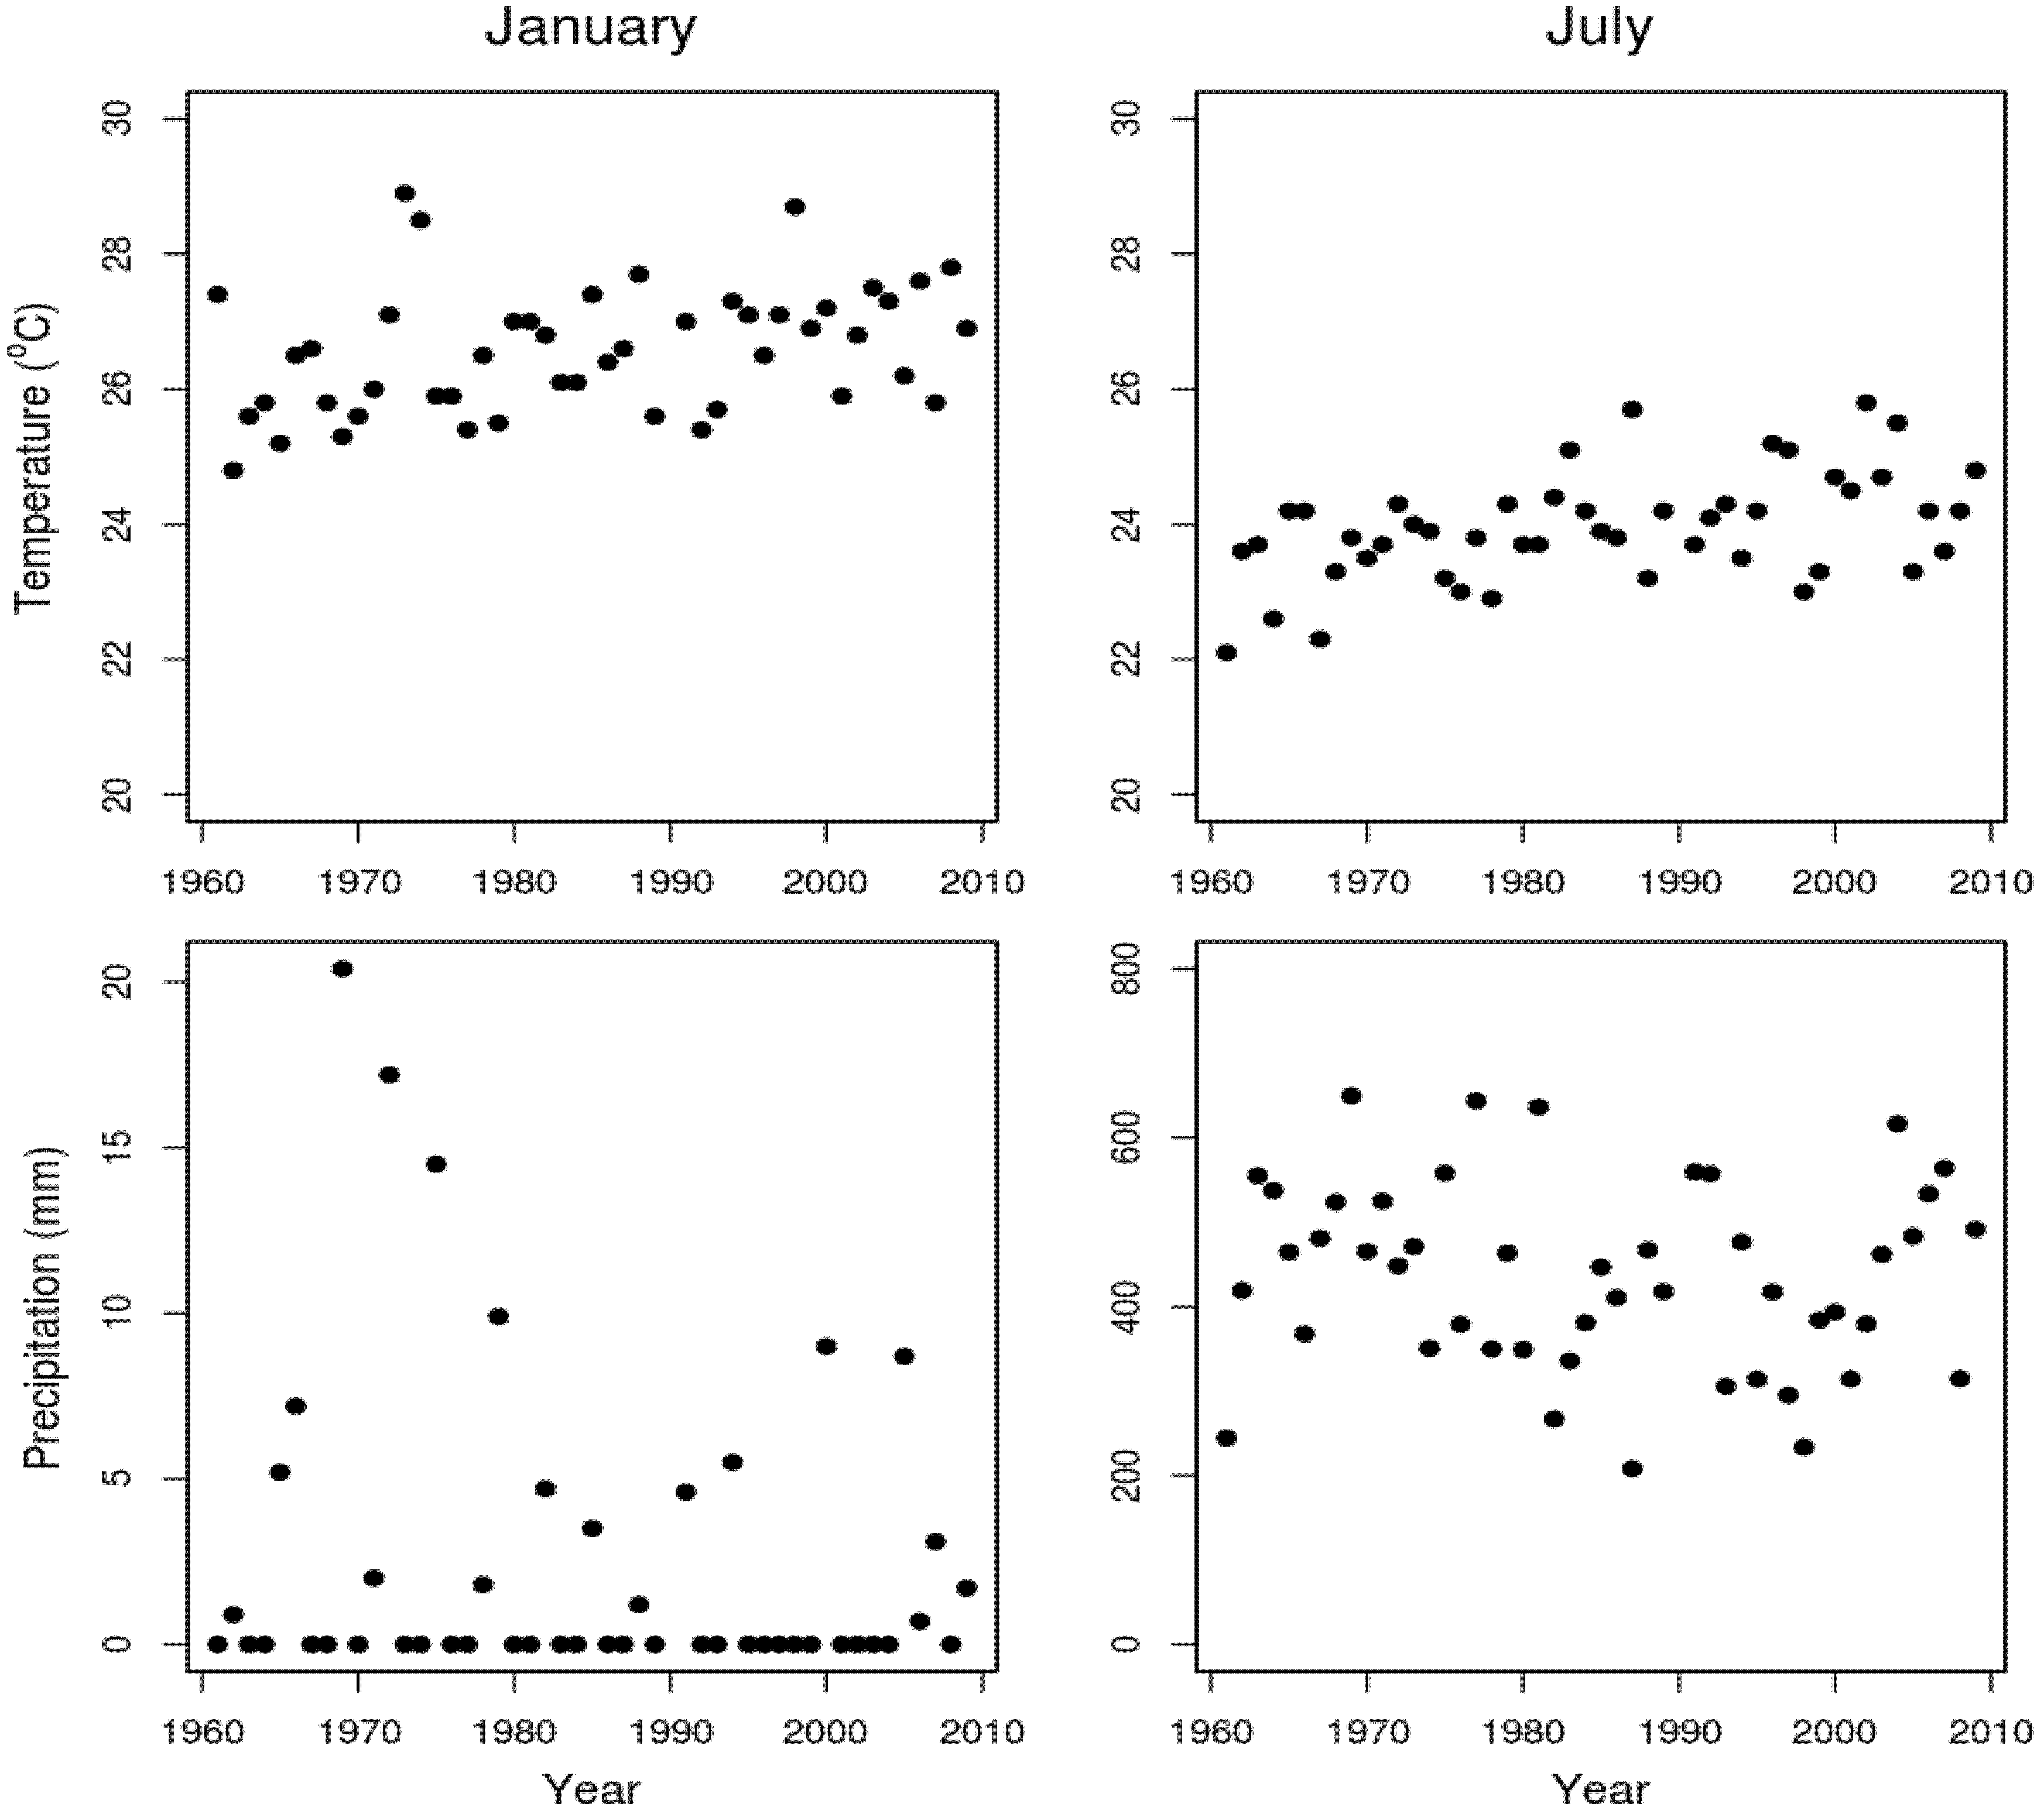
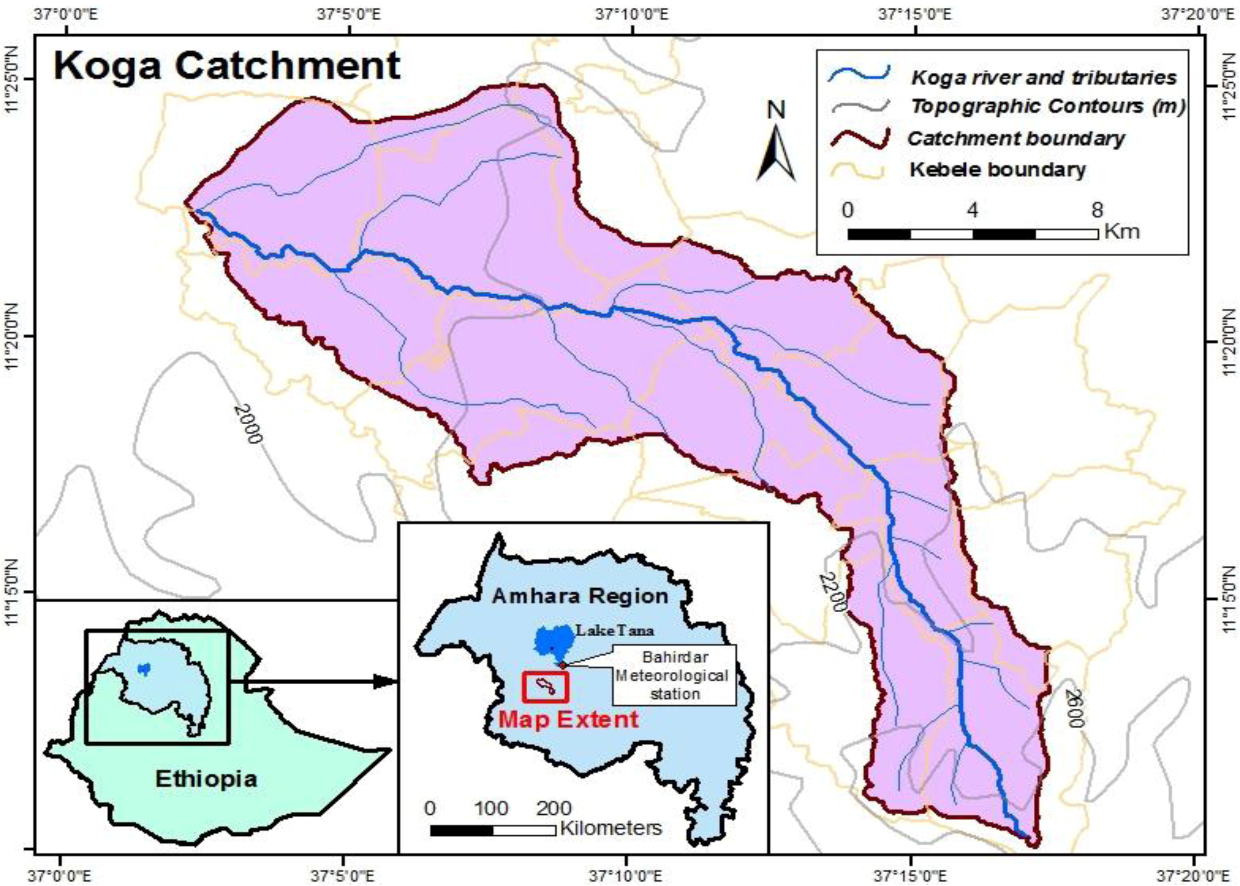
2.1.1. Location, Climate and Topography

2.1.2. Geology and Soils
2.1.3. Population
2.2. Land Use Policy and Interview of Locals


2.3. Remote Sensing Data Analysis

| Land Use/Cover Class | Description |
|---|---|
| Woody vegetation | trees and shrubs with 20% or more crown cover that are taller than 2 m. |
| Crop field | land used for production of food |
| Bare land | areas characterized by bare rock, gravel, sand, silt, clay or other earthen material, with little or no green vegetation present |
| Pasture | areas used for cattle grazing including partially wet lands. |
| Settlement | Residential areas |

| Year | Data Sources | Number of Ground Truth Points | Overall Accuracy | Kappa Coefficient |
|---|---|---|---|---|
| 1957 | December 1957 1:50,000 scale aerial photographs, 2011 ASTER DEM | 70 | - | - |
| 1979 | December 1979 Landsat MSS image of 60 m spatial resolution, 1:50,000 scale aerial photographs for January 1982 | 70 | 96.17 | 0.94 |
| 1986 | December 1986 Landsat TM image of 30 m spatial resolution | 70 | 87.97 | 0.82 |
| 1999 | December and September 1999 Landsat ETM image of resolution 30 m with a panchromatic band of 15 m resolution | 70 | 96.50 | 0.94 |
| 2010 | August 2010 ASTER visible and near infrared image of 15 m spatial resolution | 124 | 99.48 | 0.99 |
3. Results

| 1957 (ha) | 1979 (ha) | 1986 (ha) | 1999 (ha) | 2010 (ha) | Change from 1957 to 2010 (ha) | |
|---|---|---|---|---|---|---|
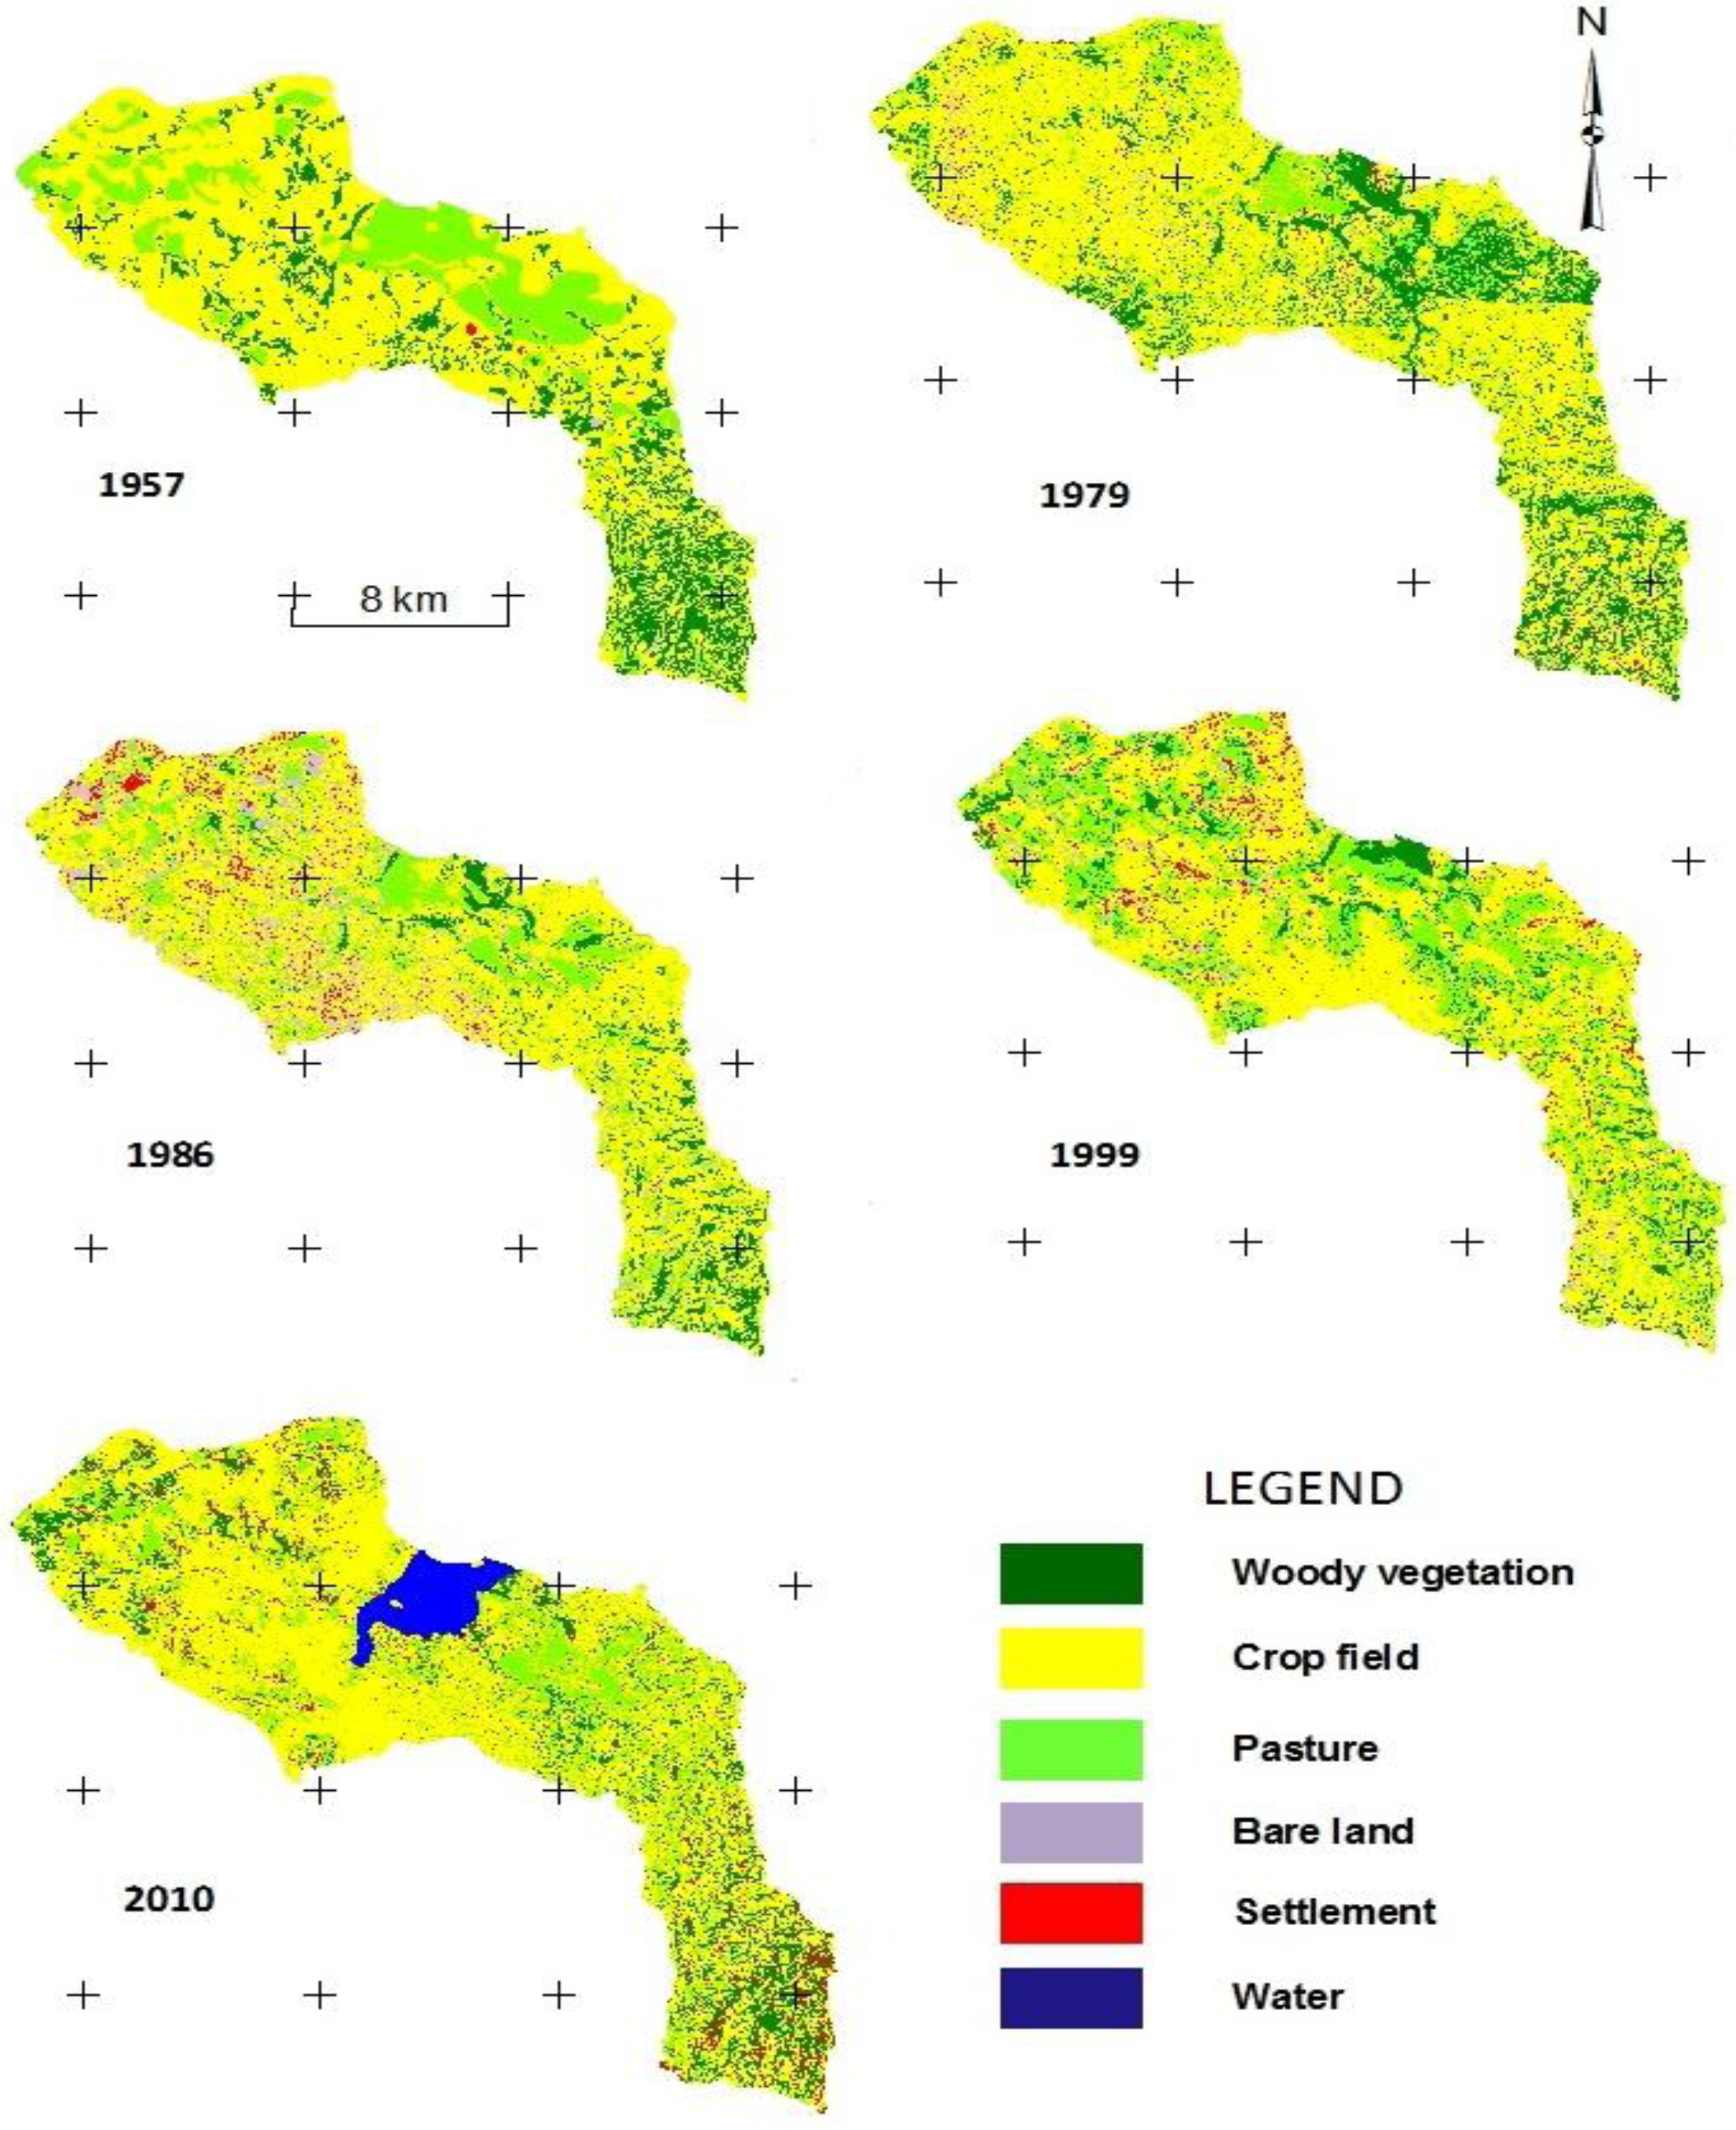
| Woody vegetation | 5,576 | 4,587 | 2,388 | 2,738 | 3,012 | ↓2,563 |
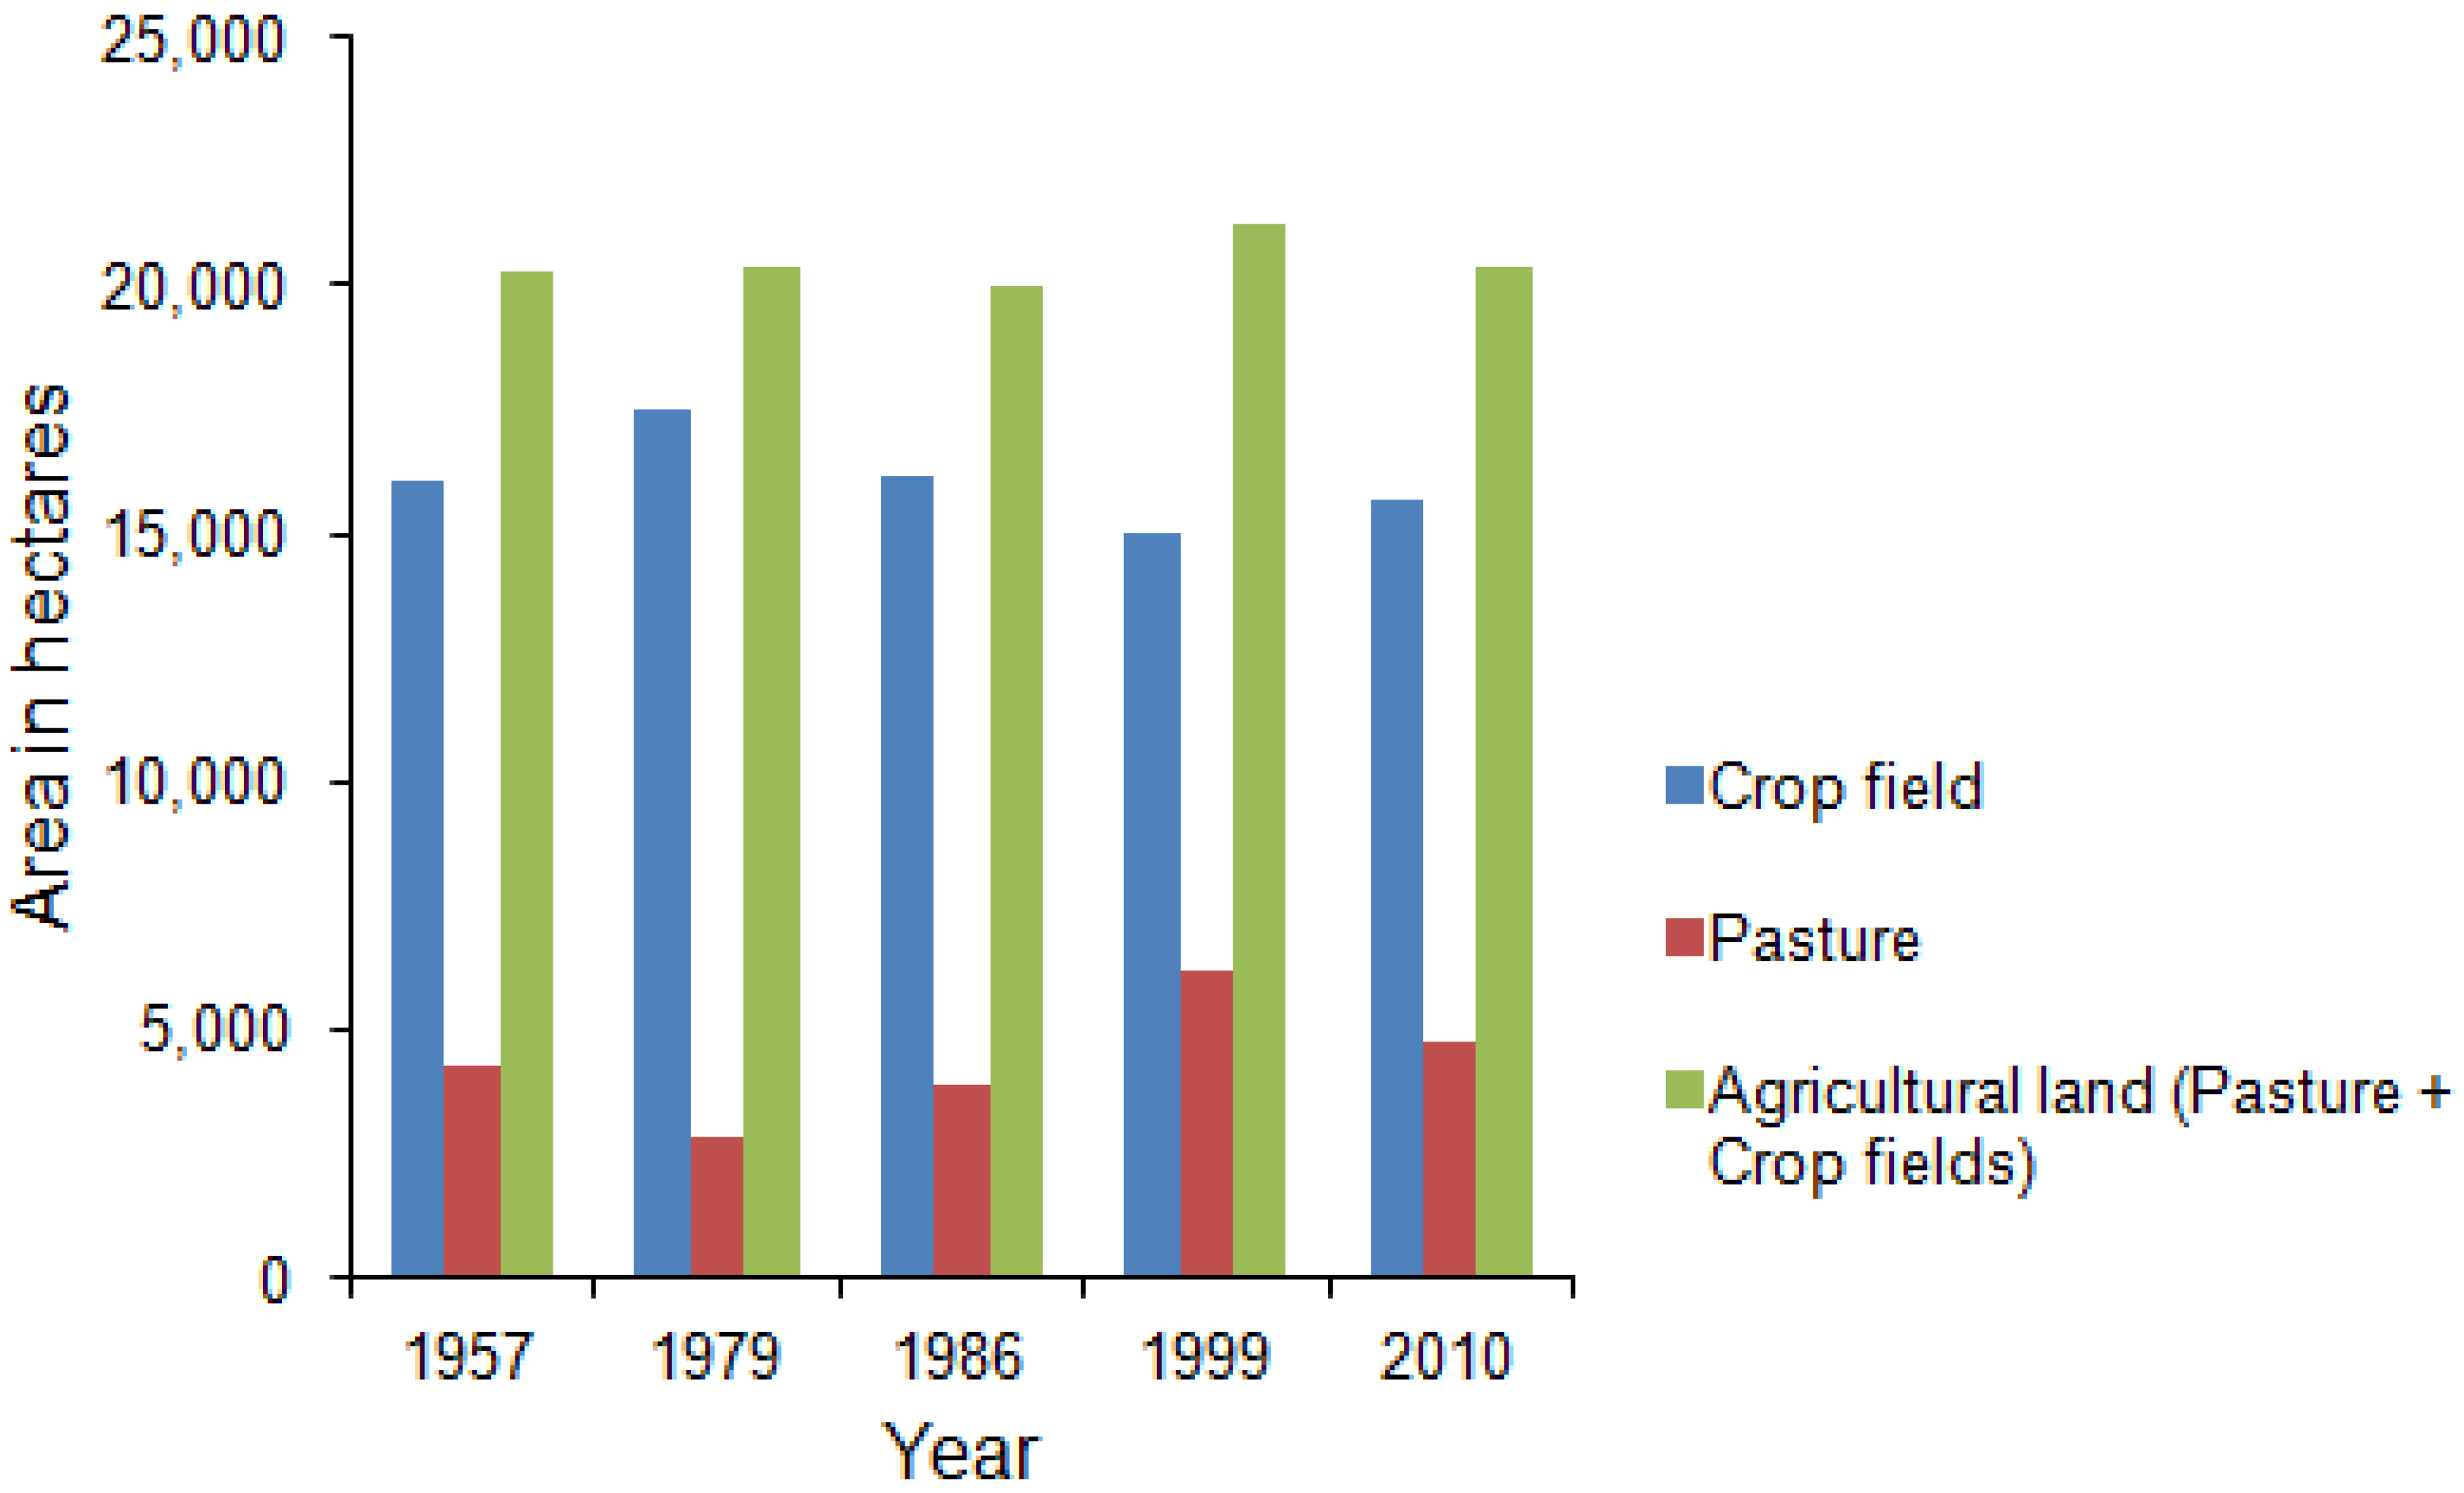
| Pasture | 4,221 | 2,817 | 3,869 | 6,232 | 4,728 | ↑507 |
| Crop field | 16,080 | 17,521 | 16,122 | 15,022 | 15,683 | ↓398 |
| Bare land | 139 | 571.7 | 2,865 | 1,088 | 0 | ↓139 |
| Settlement | 36 | 566 | 832 | 984 | 1,535 | ↑1,499 |
| Water | 0 | 0 | 0 | 0 | 1,108 | ↑1,108 |
| Agricultural land (pasture + Crop field) | 20,302 | 20,338 | 19,991 | 21,253 | 20,411 | ↑109 |


4. Discussion
5. Conclusions
Acknowledgments
References
- Olson, J.; Salome, M.; David, J.C.; Mbonile, M.; Mugisha, S. A Research Framework to Identifying the Root Causes of Land Use Change Leading to Land Degradation and Changing Biodiversity. LUCID Project Working Paper 48. Available online: http://www.lucideastafrica.org/publications/Olson_LUCID_WP48.pdf (accessed on 22 August 2012).
- Lambin, E.F.; Turner, B.L.; Geisa, H.J.; Agbola, S.B.; Angelsend, A.; Bruce, J.W.; Coomes, O.T.; Dirzo, R.; Fischer, G.; Folke, C.; et al. The causes of land-use and land-cover change: Moving beyond the myths. Glob. Environ. Chang. 2001, 11, 261–269. [Google Scholar] [CrossRef]
- The Scientific and Technical Advisors Panel (STAP) of the Global Environmental Facility (GEF). Report of the STAP Expert Group Workshop on Land Degradation Inter Linkages. Available online: http://www.thegef.org/gef/sites/thegef.org/files/documents/gef_c14-inf15.pdf (accessed on 22 August 2012).
- Loveland, T.; Gutman, G.; Buford, M.; Chatterjee, K.; Justice, C.; Rogers, C.; Stokes, B.; Thomas, J. Land-Use/Land Cover Change. In Strategic Plan for Climate Change Science Program; US Climate Change Science Program: Washington, DC, USA, 2003; pp. 118–134, Chapter 6. [Google Scholar]
- Rindfuss, R.R.; Walsh, S.J.; Turner, B.L., II; Fox, J.; Mishra, V. Developing a science of land change: Challenges and methodological issues. Proc. Natl. Acad. Sci. USA 2004, 101, 13976–13981. [Google Scholar]
- Turner, B.L., II; Lambin, E.F.; Reenberg, A. The emergence of land change science for global environmental change and sustainability. Proc. Nat. Acad. Sci. USA 2007, 104, 20666–20671. [Google Scholar]
- Anderson, J.R.; Hardy, E.E.; Roach, J.T.; Richard, E.W. Land Use Land Cover Classification for Use with Remote Sensing Data. Available online: http://pubs.er.usgs.gov/publication/pp964 (accessed on 20 October 2012).
- Dawn, C.P.; Thomas, B.; Steven, M.M.; William, J.M. Agent-Based Models of Land-Use and Land-Cover Change. In Proceedings of an International Workshop, Irvine, CA, USA, 4–7 October 2001.
- Ademiluyi, I.A.; Okude, A.S.; Adanni, C.O. An appraisal of landuse and landcover mapping in Nigeria. Afr. J. Agr. Res. 2008, 3, 581–596. [Google Scholar]
- Pellikka, P.B.; Clark, P.; Hurskainen, A.; Keskinen, M.; Lanne, K.; Masalin, P.; Ghezelbash, N.; Sirviö, T. Land Use Change Monitoring Applying Geographic Information Systems in the Taita Hills, SE-Kenya. In Proceedings of the 5th African Association of Remote Sensing of Environment Conference, Nairobi, Kenya, 17–22 October 2004.
- Garedew, E.; Sandewall, M.; Soderberg, U.; Campbell, B.M. Land-use and land-cover dynamics in the central rift valley of Ethiopia. Environ. Manage. 2009, 44, 683–694. [Google Scholar] [CrossRef]
- Zeleke, G.; Hurni, H. Implications of land use and land cover dynamics for mountain resource degradation in the northwestern Ethiopian highlands. Mt. Res. Dev. 2001, 21, 184–191. [Google Scholar] [CrossRef]
- Bishaw, B. Deforestation and land degradation in the Ethiopian Highlands: A strategy for physical recovery. Northeast Afr. Stud. 2001, 8, 7–25. [Google Scholar] [CrossRef]
- Jayne, T.S.; Yamano, T.; Weber, M.T.; Tschirley, D.; Benfica, R.; Chapoto, A.; Zulu, B. Smallholder income and land distribution in Africa: Implications for poverty reduction strategies. Food Policy 2003, 28, 253–275. [Google Scholar] [CrossRef]
- Awulachew, S.B.; McCartney, M.; Steenhuis, T.S; Ahmed, A.A. A Review of Hydrology, Sediment and Water Resource Use in the Blue Nile Basin; IWMI Working Paper 131; International Water Management Institute: Colombo, Sri Lanka, 2008. [Google Scholar]
- Hansen, M.; DeFries, R. Detecting long term global forest change using continuous fields of tree cover maps from 8 km Advanced Very High Resolution Radiometer (AVHRR) data for the years 1982–1999. Ecosystems 2004, 7, 695–716. [Google Scholar] [CrossRef]
- DeFries, R.; Eshleman, K.N. Land-use change and hydrologic processes: A major focus for the future. Hydrol. Process. 2004, 18, 2183–2186. [Google Scholar] [CrossRef]
- Lambin, E.F.; Geist, H.J.; Lepers, E. Dynamics of land-use and land cover change in tropical regions. Annu. Rev. Environ. Resour. 2003, 28, 205–241. [Google Scholar] [CrossRef]
- Carmel, Y.; Kadmon, R. Computerized classification of Mediterranean vegetation using panchromatic aerial photographs. J. Veg. Sci. 1998, 9, 445–454. [Google Scholar] [CrossRef]
- Zhang, Z.; Peterson, J.; Zhu, X.; Wright, W. Long Term Land Use and Land Cover Change and its Impact on Cool Temperate Rainforest in the Strzelecki Ranges, Australia. In Proceedings of XXI Congress of the International Society of Photogrammetry and Remote Sensing (ISPRS 2008), Beijing, China, 3–11 July 2008.
- Serra, P.; Pons, X.; Saurí, D. Post-classification change detection with data from different sensors: Some accuracy considerations. Int. J. Remote Sens. 2003, 24, 3311–3340. [Google Scholar] [CrossRef]
- Central Statistical Agency (CSA), Population Census Data, 2007; Data Processing Department of CSA: Addis Ababa, Ethiopia, 2007.
- Ambaye, D. Land Rights in Ethiopia: Ownership, Equity, and Liberty in Land Use Rights, FIG Working Week, 2012. Available online: http://www.fig.net/pub/fig2012/papers/ts02d/TS02D_ambaye_5521.pdf (accessed on 20 October 2012).
- Gebreselassie, S. Land, Land Policy and Smallholder Agriculture in Ethiopia: Options and Scenarios. Available online: http://www.future-agricultures.org/pdf%20files/SG_paper_3.pdf (accessed on 10 September 2012).
- Abrams, M.; Hook, S.; Ramachandran, B. ASTER User Handbook, Version 2. Available online: http://asterweb.jpl.nasa.gov/content/03_data/04_Documents/aster_user_guide_v2.pdf (accessed on 22 August 2012).
- Amro, I.; Mateos, J.; Vega, M.; Molina, R.; Katsaggelos, A. A survey of classical methods and new trends in pansharpening of multispectral images. EURASIP J. Adv. Sig. Proc. 2011. [Google Scholar] [CrossRef]
- ENVI User’s Guide; ITT Visual Information Solutions: Boulder, CO, USA, 2009.
- Castro, F.; Silva-Forsberg, M.; Wilson, W.; Brondizio, E.; Moran, E. The use of remotely sensed data in rapid rural assessment. Field Method. 2002, 14, 243–269. [Google Scholar] [CrossRef]
- Mango, L.M. Modeling the Effect of Land Use and Climate Change Scenarios on the Water Flux of the Upper Mara River Flow, Kenya. Available online: http://digitalcommons.fiu.edu/etd/159 (accessed on 20 August 2012).
- Acers International Ltd.; Shawel Consult International, Annexes J–L. In Birr and Koga Irrigation Project—Koga Catchment and Irrigation Studies; Ministry of Water Resources: Addis Ababa, Ethiopia, 1995; p. 9.
- Acers International Ltd.; Shawel Consult International, Annexes M–O. In Birr and Koga Irrigation Project—Koga Catchment and Irrigation Studies; Ministry of Water Resources: Addis Ababa, Ethiopia, 1995; pp. 3–15.
- Gebremedhin, B.; Fernandez-Rivera, S.; Hassen, M.; Mwangi, W; Ahmed, S. Maize and Livestock: Their Inter-Linked Roles in Meeting Human Needs in Ethiopia; Research Report 6; ILRI (International Livestock Research Institute): Nairobi, Kenya, 2007. [Google Scholar]
- Acers International Ltd.; Shawel Consult International, Koga Catchment Prefeasibility Study; Main Report; Ministry of Water Resources: Addis Ababa, Ethiopia, 1995.
- Ethiopian Ministry of Water Resources (MWOR), Koga Project EIA Report; Ministry of Water Resources: Addis Ababa, Ethiopia, 2004.
- Astatke, A.; Running, S.; Anderson, F. Building Ponds with Animal Power in the Ethiopian Highlands, a Manual; International Livestock Center for Africa: Nairobi, Kenya, 1986. [Google Scholar]
- Ethiopian Ministry of Agriculture and Rural Development (MOARD), Disaster Management and Food Security Center. Mecha Woreda and Livelihood Zone Statistics. Available online: http://www.feg-consulting.com/feg-shared-folder/liu/amhara/posters/west-gojjam/mecha.pdf (accessed on 22 August 2012).
- Irit, E.; Tesfai, W. Rebuilding Livelihoods after Dam Induced Relocation in Koga, Blue Nile Basin, Ethiopia; ZEF Working Paper 83; Center for Development Research, University of Bonn: Bonn, Germany, 2011. [Google Scholar]
- Baris, K.; Esbah, H.; Deniy, B. Monitoring and analyzing land use/cover changes in a developing coastal town: A case study of Kusadasi, Turkey. J. Coastal Res. 2013, in press. [Google Scholar]
- Bolca, M.; Özen, F.; Günes, A. Land use changes in Gediz Delta (Turkey) and their negative impacts on wetland habitats. J. Coastal Res. 2012. [CrossRef]
- Msoffe, F.; Said, M.; Ogutu, J.; Kifugo, S.; Leeuw, J.; Gardingen, P.; Reid, R. Spatial correlates of land-use changes in the Maasai-Steppe of Tanzania: Implications for conservation and environmental planning. Int. J. Biodivers. Conserv. 2011, 3, 280–290. [Google Scholar]
- Nduwamungu, J.; Bloesch, U.; Munishi, P.; Hagedorn, F.; Lulu, K. Recent land cover and use changes in Miombo woodlands of eastern Tanzania. Tanzan. J. For. Nat. Conserv. 2008, 78, 50–59. [Google Scholar]
- Bernard, B.; Anthony, E.; Patrick, O.; Fridah, M. Dynamics of land use/cover trends in Kanungu district, South-western Uganda. J. Appl. Sci. Environ. Manage. 2010, 14, 67–70. [Google Scholar]
- Egeru, A.; Majaliwa, M.G.J. Landuse/cover change trend in Soroti District Eastern Uganda. J. Appl. Sci. Environ. Manage. 2009, 13, 77–79. [Google Scholar]
- Braimoh, A. Seasonal migration and land-use change in Ghana. Land Degrad. Dev. 2004, 15, 37–47. [Google Scholar] [CrossRef]
- Gautam, A.; Webb, E.; Shivakoti, G.; Zoebisch, M. Land use dynamics and landscape change pattern in a mountain watershed in Nepal. Agric. Ecosyst. Environ. 2003, 99, 83–96. [Google Scholar] [CrossRef]
- Rimal, B. Application of remote sensing and GIS, land use/land cover change in Kathamandu metropolitan city, Nepal. J. Theor. Appl. Inf. Technol. 2005, 23, 80–86. [Google Scholar]
- Campbell, D.; Lusch, D.; Smucker, T.; Wangui, E. Multiple methods in the study of driving forces of land use and land cover change: A case study of SE Kajiado District, Kenya. Human Ecol. 2005, 33, 763–794. [Google Scholar] [CrossRef]
- Mundia, C.; Aniya, M. Dynamics of land use/cover changes and degradation of Nairobi City, Kenya. Land Degrad. Dev. 2006, 17, 97–108. [Google Scholar] [CrossRef]
- Serneels, S.; Lambin, E. Proximate causes of land-use change in Narok District, Kenya: A spatial statistical model. Agric. Ecosyst. Environ. 2001, 85, 65–81. [Google Scholar] [CrossRef]
- Braimoh, A.; Onishi, T. Spatial determinants of urban land use change in Lagos, Nigeria. Land Use Policy 2007, 24, 502–515. [Google Scholar] [CrossRef]
- Fanan, U.; Oluseyi, I.; Ndalai, A. Detecting changes in land use/cover of Umuahia, South-Eastern Nigeria using remote sensing and GIS techniques. Confluence J. Environ. Stud. 2011, 6, 72–80. [Google Scholar]
- Oyinloye, M.; Kufoniyi, O. Analysis of land use, land cover change and urban expansion in Akure, Nigeria. J. Innov. Res. Eng. Sci. 2011, 2, 234–248. [Google Scholar]
- Oyinloye, R.; Oloukoi, J. Spatio temporal assessment and mapping of the land use land cover dynamics in the central forest belt of Southwestern Nigeria. Res. J. Environ. Earth Sci. 2012, 4, 720–730. [Google Scholar]
- Kamusoko, C.; Aniya, M.; Adi, B.; Manjoro, M. Rural sustainability under threat in Zimbabwe—Simulation of future land use/cover changes in the Bindura district based on the Markov-cellular automata model. Appl. Geogr. 2009, 29, 435–447. [Google Scholar] [CrossRef]
- Jat, M.; Garg, P.; Khare, D. Monitoring and modeling of urban sprawl using remote sensing and GIS techniques. Int. J. Appl. Earth Obs. Geoinf. 2008, 10, 26–43. [Google Scholar] [CrossRef]
- Prakasam, C. Land use/cover change detection through remote sensing approach: A case study of Kodiakanal taluk, Tamil Nadu. Int. J. Geomati. Geosci. 2010, 1, 150–158. [Google Scholar]
- Prakash, A.; Gupta, R. Land-use mapping and change detection in a coal mining area—A case study in the Jharia coalfield, India. Int. J. Remote Sens. 1998, 19, 391–410. [Google Scholar] [CrossRef]
- Alphan, H. Land-use change and urbanization of Adana, Turkey. Land Degrade. Dev. 2003, 14, 575–586. [Google Scholar] [CrossRef]
- Hepcan, C.; Turan, I.; Ozkan, M. Monitoring land use change in the Cesme coastal zone, Turkey using aerial photographs and satellite imaging. Land Degrad. Dev. 2010, 22, 326–333. [Google Scholar] [CrossRef]
- Reis, S. Analyzing land use/land cover changes using remote sensing and GIS in Rize, North-East Turkey. Sensors 2008, 8, 6188–6202. [Google Scholar] [CrossRef]
- Reveshty, M. The assessment and predicting of land use changes to urban area using multi-temporal satellite imagery and GIS: A case study of Zanjan, Iran (1984–2011). J. Geogr. Inf. Syst. 2011, 3, 298–305. [Google Scholar]
- Solaimani, K.; Arekhi, M.; Tamartash, R.; Miryaghobzadeh, M. Land use/cover change detection based on remote sensing data (A case study; Neka Basin). Agric. Biol. J. N. Amer. 2010, 1, 1148–1157. [Google Scholar]
- Dewan, A.; Yamaguchi, Y. Land use and land cover change in greater Dhaka, Bangladesh: Using remote sensing to promote sustainable urbanization. Appl. Geogr. 2009, 29, 390–401. [Google Scholar] [CrossRef]
- Dewan, A.; Yamaguchi, Y. Using remote sensing and GIS to detect and monitor land use and land cover change in Dhaka Metropolitan of Bangladesh during 1960–2005. Environ. Monit. Assess. 2009, 150, 237–249. [Google Scholar] [CrossRef]
- Dewan, A.; Yamaguchi, Y.; Rahman, M. Dynamics of land use/cover changes and the analysis of landscape fragmentation in Dhaka Metropolitan, Bangladesh. GeoJournal 2012, 77, 315–330. [Google Scholar] [CrossRef]
- Alemayehu, F.; Taha, N.; Nyssen, J.; Girma, A.; Zenebe, A.; Behailu, M.; Deckers, S.; Poesen, J. The impacts of watershed management on land use and land cover dynamics in Eastern Tigray (Ethiopia). Resour. Conserv. Recycl. 2009, 53, 192–198. [Google Scholar] [CrossRef]
- Bewket, W. Land cover dynamics since the 1950s in Chemoga watershed, Blue Nile Basin, Ethiopia. Mt. Res. Dev. 2002, 22, 263–269. [Google Scholar] [CrossRef]
- Mulugeta, T.M. Land-use-cover dynamics in Nonno district, Central Ethiopia. J. Sustain. Dev. Afr. 2011, 13, 123–141. [Google Scholar]
- Yang, X.; Lo, C. Relative radiometric normalization performance for change detection from multi-date satellite images. Photogramm. Eng. Remote Sensing 2000, 66, 967–980. [Google Scholar]
- Fisseha, G.; Gebrekidan, H.; Kibret, K.; Yitaferu, B.; Bedadi, B. Analysis of land use/land cover changes in the Debre-Mewi watershed at the upper catchment of the Blue Nile Basin, North West Ethiopia. J. Biodivers. Environ. Sci. 2011, 1, 184–196. [Google Scholar]
- Kidanu, S. Using Eucalyptus for Soil and Water Conservation; Wageningen University and Research Center: Wageningen, The Netherlands, 2004. [Google Scholar]
- Shiferaw, A. Evaluating the land use and land cover dynamics in Borena Woreda of South Wollo Highlands, Ethiopia. J. Sustain. Dev. Afr. 2011, 13, 87–107. [Google Scholar] [CrossRef]
- Tegene, B. Land-vover/land-use changes in the Derekolli catchment of the South Wolo zone of the Amhara Region, Ethiopia. East. Afr. Soc. Sci. Res. Rev. 2002, 18, 1–20. [Google Scholar] [CrossRef]
- Tsegaye, D.; Moea, S.R.; Paul, V.; Aynekulu, E. Land-use/cover dynamics in Northern Afar rangelands, Ethiopia. Agric. Ecosyst. Environ. 2010, 139, 174–180. [Google Scholar] [CrossRef]
- Tekle, K.; Hedlund, L. Land cover changes between 1958 and 1986 in Kalu District, southern Wello, Ethiopia. Mt. Res. Dev. 2000, 20, 42–51. [Google Scholar] [CrossRef]
- Hurni, H.; Tato, K.; Zeleke, G. The implications of changes in population, land use and land management for surface runoff in the upper Nile Basin area of Ethiopia. Mt. Res. Dev. 2005, 25, 147–154. [Google Scholar] [CrossRef]
- Reid, R.S.; Kruska, R.L.; Muthui, N.; Taye, A.; Wotton, S.; Wilson, C.J.; Mulatu, W. Land-use and land-cover dynamics in response to changes in climatic, biological and socio-political forces: The case of southwestern Ethiopia. Landscape Ecol. 2000, 15, 339–355. [Google Scholar] [CrossRef]
- Taddese, G. Land degradation: A challenge to Ethiopia. Environ. Manage. 2001, 27, 815–824. [Google Scholar] [CrossRef]
Appendix
| Ground Truth (Percent) | ||||||
|---|---|---|---|---|---|---|
| Class | Woody Vegetation | Pasture | Settlement | Crop Field | Bare Area | Total |
| Woody vegetation | 92.7 | 0.7 | 0 | 0.3 | 0 | 22.0 |
| Pasture | 1.8 | 73.7 | 0 | 32.6 | 5.8 | 37.4 |
| Settlement | 0 | 0 | 93.6 | 1.3 | 14.4 | 2.7 |
| Crop field | 0.2 | 19.3 | 2.1 | 61.5 | 3.3 | 25.6 |
| Bare area | 0.2 | 6.3 | 4.3 | 4.3 | 76.5 | 12.4 |
| Total | 100 | 100 | 100 | 100 | 100 | 100 |
| Ground Truth (Pixels) | ||||||
|---|---|---|---|---|---|---|
| Class | Woody Vegetation | Pasture | Settlement | Crop Field | Bare Area | Total |
| Woody vegetation | 99.6 | 0 | 0 | 0.3 | 0 | 18.8 |
| Pasture | 0 | 96.6 | 0 | 5.6 | 0 | 45.6 |
| Settlement | 0 | 0 | 91.2 | 0 | 32.4 | 0.2 |
| Crop field | 0.4 | 3.4 | 2.2 | 94.1 | 0 | 35.3 |
| Bare area | 0 | 0 | 6.6 | 0.0 | 67.6 | 0.2 |
| Total | 100 | 100 | 100 | 100 | 100 | 100 |
© 2013 by the authors; licensee MDPI, Basel, Switzerland. This article is an open access article distributed under the terms and conditions of the Creative Commons Attribution license (http://creativecommons.org/licenses/by/3.0/).
Share and Cite
Yeshaneh, E.; Wagner, W.; Exner-Kittridge, M.; Legesse, D.; Blöschl, G. Identifying Land Use/Cover Dynamics in the Koga Catchment, Ethiopia, from Multi-Scale Data, and Implications for Environmental Change. ISPRS Int. J. Geo-Inf. 2013, 2, 302-323. https://0-doi-org.brum.beds.ac.uk/10.3390/ijgi2020302
Yeshaneh E, Wagner W, Exner-Kittridge M, Legesse D, Blöschl G. Identifying Land Use/Cover Dynamics in the Koga Catchment, Ethiopia, from Multi-Scale Data, and Implications for Environmental Change. ISPRS International Journal of Geo-Information. 2013; 2(2):302-323. https://0-doi-org.brum.beds.ac.uk/10.3390/ijgi2020302
Chicago/Turabian StyleYeshaneh, Eleni, Wolfgang Wagner, Michael Exner-Kittridge, Dagnachew Legesse, and Günter Blöschl. 2013. "Identifying Land Use/Cover Dynamics in the Koga Catchment, Ethiopia, from Multi-Scale Data, and Implications for Environmental Change" ISPRS International Journal of Geo-Information 2, no. 2: 302-323. https://0-doi-org.brum.beds.ac.uk/10.3390/ijgi2020302