A Software Reference Architecture for Service-Oriented 3D Geovisualization Systems

Abstract
: Modern 3D geovisualization systems (3DGeoVSs) are complex and evolving systems that are required to be adaptable and leverage distributed resources, including massive geodata. This article focuses on 3DGeoVSs built based on the principles of service-oriented architectures, standards and image-based representations (SSI) to address practically relevant challenges and potentials. Such systems facilitate resource sharing and agile and efficient system construction and change in an interoperable manner, while exploiting images as efficient, decoupled and interoperable representations. The software architecture of a 3DGeoVS and its underlying visualization model have strong effects on the system’s quality attributes and support various system life cycle activities. This article contributes a software reference architecture (SRA) for 3DGeoVSs based on SSI that can be used to design, describe and analyze concrete software architectures with the intended primary benefit of an increase in effectiveness and efficiency in such activities. The SRA integrates existing, proven technology and novel contributions in a unique manner. As the foundation for the SRA, we propose the generalized visualization pipeline model that generalizes and overcomes expressiveness limitations of the prevalent visualization pipeline model. To facilitate exploiting image-based representations (IReps), the SRA integrates approaches for the representation, provisioning and styling of and interaction with IReps. Five applications of the SRA provide proofs of concept for the general applicability and utility of the SRA. A qualitative evaluation indicates the overall suitability of the SRA, its applications and the general approach of building 3DGeoVSs based on SSI.1. Introduction
Geovisualization constitutes an integral part of spatial data infrastructures (SDIs) and most geodata processing software. A 3D geovisualization system (3DGeoVS) is a software system that can facilitate the visual exploration, analysis, synthesis and presentation of geodata [1] represented visually in 3D Cartesian space. Modern 3DGeoVSs are complex and evolving systems required to be adaptable and to leverage distributed resources, including massive geodata. This work focuses on 3DGeoVSs built based on the principles of service-oriented architectures, standards, and image-based representations (SSI) as a specific class of 3DGeoVSs that addresses a specific set of practically relevant challenges and potentials. Designing a 3DGeoVS based on distributed service-oriented architectures (SOAs) [2] facilitates resource sharing and agile and efficient system construction and change. Applying standards when designing a 3DGeoVS [3,4] promotes realizing the potential of a service-oriented system design by improving interoperability. Exploiting image-based representations (IReps) [5,6] of geodata promotes realizing the potential of a service-oriented, standards-based system design by use of an efficient, decoupled and interoperable representation.
An IRep represents specific information using images. Visualization systems commonly generate, output and display color images that represent resulting visualizations intended for visual perception by humans. In addition, images can represent in principle any information required as input or the intermediate result of a visualization process. This work focuses on IReps that are based on G-buffers from 3D computer graphics [5]. Each such IRep represents a view of a georeferenced 3D model from a fixed virtual camera 3D position using a common projection by standard 2D digital raster images. Each image of such IRep encodes a single, fixed set of attributes per pixel. For instance, an IRep can represent a perspective view of a geospatial area using attributes per pixel, such as appearance color, surface geometry (represented as distance between surface and viewing camera), surface normal and object identification.
IReps offer various advantages compared with alternative representations, such as features or scene graphs, and are increasingly exploited for different purposes [5,6]. IReps can act as simple, common, standardized, unified, decoupled and output-sensitive representations. In particular, IReps can represent a 3D model in a manner and with storage requirements independent of the type and complexity of its original representation and processing. For instance, visually styling an image in image space at image resolution instead of processing the original features allows styling an image in a decoupled manner after image generation and implementing styling output sensitively, effectively and efficiently [7]. In a distributed visualization system, an interactive visualization client can generate novel views from locally cached IReps that the client retrieved from servers to improve client-side efficiency, decoupling and platform independence [8]. Common 2D web map viewers apply this general principle. Applications, such as 3D navigation techniques can analyze IReps in an efficient, output-sensitive manner to facilitate camera motion in the 3D model without collisions and to evaluate views for best view selection [9]. In this work, we characterize a system as “applying” or “exploiting” IReps, when such system uses IReps in the visualization process beyond generating images for immediate display.
Designing, describing and analyzing 3DGeoVSs based on SSI are complex activities. Such systems must meet various general requirements [10], including support for high interactivity, high-quality visualization, collaborative visualization (CV) [11–13] and coordinated multiple views (CMV) [14,15]. For this, such systems combine and integrate various technologies from domains, such as geovisualization, GIScience, computer graphics and software engineering.
The objective of this work is to support the effective and efficient design, description and analysis of 3DGeoVSs based on SSI. The software architectures of such systems can serve as a central concept for such activities. The software architecture of a 3DGeoVS represents its fundamental, high-level organization, and its choice has strong effects on a system’s quality attributes regarding development and operation [16]. A software reference architecture (SRA) is a generic template software architecture that captures knowledge about a class of software systems [17,18]. A SRA can assist in designing, describing and analyzing concrete software architectures with the expected benefit of an increase in effectiveness and efficiency in such activities due to the reuse of knowledge. However, currently no SRA for 3DGeoVSs based on SSI exists. Most closely related previous work already proposed reference models for geospatial systems based on SOA and standards [4,19] and concrete software architectures for 3DGeoVSs based on SOA and standards [20–37]. However, previous work does not target a general SRA for 3DGeoVSs that addresses exploiting IReps and further important requirements, such as CV or CMV.
To address these concerns, this article presents a generic, partial SRA for 3DGeoVSs based on SSI, which can be used to design, describe and analyze concrete software architectures. The SRA is of generic abstraction in that it applies to 3DGeoVSs based on SSI without being restricted to specific application domains or organizations and of partial coverage in that it narrowly covers only specific aspects of systems with limited depth and detail [38]. The SRA focuses on 3DGeoVSs for the interactive visualization of 3D geovirtual environments (3DGeoVEs) that constitute static, massive virtual 3D city models (V3DCMs) and virtual 3D landscape models (V3DLMs). The SRA particularly applies, extends and supplements standards from the Open Geospatial Consortium (OGC). This article provides the following contributions:
As a foundation for the SRA, we introduce the generalized visualization pipeline model (Section 3) that generalizes and overcomes expressiveness limitations of the prevalent visualization pipeline model [39–41] in particular with respect to transforming IReps.
We present a SRA for 3DGeoVSs based on SSI (Section 4). The SRA integrates existing and newly proposed concepts and technology in a unique manner. The SRA reuses, combines and integrates concepts and technology from relevant domains, including the Reference Model of Open Distributed Processing (RM-ODP) for organization and presentation [42], architectural patterns and styles [43–45], geospatial data and service models [4], an interaction taxonomy [46] and OGC and ISO standards. In addition, the SRA integrates unique approaches for aspects, including the generalized visualization pipeline, the exploitation of IReps and integration of CV and CMV.
To facilitate exploiting IReps, we propose as an integrated part of the SRA a specific type of IRep and three service types that support the provisioning, styling and interaction with IReps, respectively (Section 4). An image-based view (IView) [7] represents a georeferenced, projected view of a 3D model. A Web View Service (WVS) [47,48] renders 3D models from specified viewpoints and outputs results as IViews. A Web Image-based Styling Service (WISS) [7] styles IViews according to specified styling specifications. A Novel View Service (NVS) [8] interactively renders novel views from specified viewpoints and input IViews. As a supplementary application of the SRA, we propose an interactive navigation technique for V3DCMs that exploits IViews [9]. This article briefly introduces the approaches in the context of the SRA while respective publications provide details.
We present five applications of the SRA, which design, describe and analyze exemplary 3DGeoVSs (Section 5). The applications provide proofs of concept for the applicability and utility of the proposed SRA.
Finally, we contribute an evaluation and discussion of the proposed SRA, its applications and the general approach of building 3DGeoVSs based on SSI (Section 6).
The structure of the remainder of this article is as follows. After reviewing related work (Section 2), we introduce the generalized visualization pipeline model (Section 3), five software architecture views on the SRA (Section 4) and five applications of the SRA to exemplary 3DGeoVSs (Section 5). Finally, we evaluate and discuss the SRA, the introduced applications and the general approach of building 3DGeoVSs based on SSI (Section 6), and close with conclusions (Section 7).
2. Related Work
Visualization models. Models of the visualization process proved to be suitable foundations for the software architectures of 3DGeoVSs [4,49]. Models for generating visual representations can be based on modeling the stepwise, functional transformation of data into visual representations in the form of visualization pipelines and data flow graphs [39–41]. They can also be based on aspects more abstract, such as intent [50], users [51], tasks [52], context [51], data [53] or interaction [54], to automatically generate or recommend appropriate visual representations using encoded expert knowledge, heuristics or design principles [55]. Visualization models introduce specific abstractions as in the case of the visualization pipeline: pipeline, pipeline stage, operators providing stage functionality and operator data products [39–41]. Further employed abstractions relate to visual representation granularity, e.g., pixels [56] marks and visual variables [57], symbols as structured collections of attributed marks [58], layers as symbol or feature collections [58], scene graphs [59,60], visual representations [61] and views [5]. Computer graphics abstractions, such as geometry, material, light and camera are frequently used [55,60,62].
This work proposes a new visualization model as a generalization of the visualization pipeline model. It differs in allowing one to form pipelines generally by combining arbitrarily any number of compatible operators from the three stages in any compatible order beyond the fixed filtering/mapping/rendering, three-stage pipeline scheme. This work uses established abstractions from the visualization pipeline, granularities of visual representations and computer graphics, while introducing IView [7] as a novel abstraction in the context of 3DGeoVSs.
Software reference architectures. SRAs and related models exist that apply to computer graphics, visualization, interactive, geospatial and service-oriented systems, respectively. In computer graphics, the computer graphics reference model [63] describes a computer graphics system abstractly as a five-stage transformation pipeline (construction, virtual, viewing, logical and realization environment). The prevalent rendering pipeline model [5] models rendering as a three-stage pipeline (application, geometry, rasterizer) and is commonly used in differently refined variants [64,65]. For visualization systems, the prevalent visualization pipeline model [39–41] models the visualization process as a three-stage pipeline (filtering, mapping, rendering). The model is refined, extended and complemented to cover aspects, including distributed visualization and CV [11,15], CMV [14], image-space data mapping [66], visual analytics [67], service-oriented systems [49] and service-oriented, geospatial systems [4,19]. Heer and Agrawala [68] present software design patterns for information visualization systems. For interactive systems, proposed models include interaction taxonomies [46], ontologies [69] and reference models [70]. SRAs and architectural patterns and styles are proposed for distributed [44], distributed and collaborative [71], and service-oriented interactive systems [72,73]. For service-oriented systems with a focus on enterprise systems, existing models include ontologies [74], SRAs [18,72,73] and reference models [17]. For geospatial, service-oriented systems, [3] defines a standard reference model for geoinformation and geoinformation services that is detailed through the ISO 19100 series of standards. Reference models for systems based on OGC standards are defined in [4,19] with [75,76] focusing on portal client applications. For SDIs, reference models and SRAs are proposed from various SDI initiatives, such as the USA national SDI [77], the Canadian SDI [78], the European SDI [79] and from academia [80–82] and are commonly based on standards.
This work proposes a SRA for 3DGeoVSs based on SSI. This SRA explicitly reuses existing models, including representation types and abstractions, such as scene graphs and IReps [5,83] from computer graphics, the visualization pipeline model [39–41], an interaction taxonomy [46], a CV model [11] and a CMV model [14] from interactive visualization and SOA, architectural patterns and styles from distributed systems and software engineering [43–45]. Furthermore, the SRA reuses various standards from computer graphics, distributed systems, SOA and the geospatial domain (Section 4.5), the RM-ODP [42] and UML for organization and presentation and an existing framework for evaluation [84]. In contrast to previous work, the proposed SRA applies the proposed generalized visualization pipeline, including a classification of services and a model for composing pipelines from services. It introduces new service types and a service architecture based on the SOA, the generalized visualization pipeline and architectural patterns. It adapts existing CMV and CV models to SOA. The SRA applies and discusses physical service integration to trade off runtime efficiency with system maintainability, and introduces IViews as IReps and the new service types, WVS, WISS and NVS, for exploiting IReps. Moreover, the proposed SRA is unique in the class of systems it targets and the set of models and standards it integrates and combines. To our knowledge, no other SRA for the targeted class of systems exists. Although models exist for various individual aspects of such systems, no model combines required models in a single SRA. For instance, existing reference models for SDIs neglect 3D geovisualization and exploiting IReps. Closest to the proposed SRA are the OGC reference models for standards-based, geospatial SOA systems [4,19] and derived 3DGeoVS implementations (see below). However, these proposals still lack the aforementioned confining properties of the SRA and, in particular, the support for exploiting IReps and the generalized visualization pipeline.
Systems. Interactive visualization systems are already designed as distributed systems [11,15,85], distributed systems based on standards [86], distributed systems based on SOA [49,87] and distributed 3DGeoVSs based on SOA and standards [20–37,88].
This work introduces an architecture of a 3DGeoVS based on SSI as a result of applying the proposed SRA (Section 5.1). The aforementioned similarities and differences of the SRA to previous work also apply to the introduced architecture as an instance of the SRA. In particular, previous systems lack exploiting IReps as characterized in this work. As additional differences to previous work, the introduced architecture integrates a novel navigation technique for V3DCMs exploiting IReps [9]. Moreover, it applies the idea of separating and distributing view-independent and view-dependent computations to improve efficiency. View-independent computations are performed on the server-side and reused on the client-side for different novel views with view-dependent computations applied on top. We discuss further related work in dedicated articles that relate to IViews and WVS [7,47,48], WISS [7], NVS [8] and the proposed navigation technique [9].
3. The Generalized Visualization Pipeline Model
This section introduces the generalized visualization pipeline model as a model of the visualization process. It constitutes a foundation for the SRA introduced in this article and several other contributions in this work. We present the traditional visualization pipeline model and its limitations, the generalized visualization pipeline model to overcome these limitations and uses and applications of the introduced model.
The visualization pipeline model [39–41] is the most prevalent model of the visualization process [41]. This model is chosen as a starting point, because it is prevalent and proven to be a suitable foundation for the software architectures of service-oriented visualization systems [4,49], in particular due to the possibility to map in a straightforward, coarse-grained manner between visualization pipeline stages and architectural services. The visualization pipeline model describes the visualization process as a data transformation pipeline consisting of three consecutive stages: Input data is filtered (F) into enhanced and enriched data, then mapped (M) to geometry and visual attributes and, finally, rendered (R) into a displayable image. It defines the general purpose and semantics of each stage and the general characteristics of each stage’s input and output data. A visualization pipeline can be represented as a data flow graph forming a connected directed acyclic graph [39–41,61]. In such graphs, each directed edge represents data flowing between nodes, and each node represents a data-transforming operator (also module) that either is a stage operator implementing one stage partly or completely or represents a data source or data sink. Source nodes have zero incoming edges and represent source data as operators, sink nodes have zero outgoing edges and represent resulting data as operators, and the order of the stages implemented by stage operators in each path from a source to a sink node is filtering, mapping and rendering. Data flow from the source nodes along the edges through transforming operators and are gathered as results in sink nodes.
Whereas the visualization pipeline model provides valuable, proven general abstractions and separations of concerns, its fixed three-stage pipeline model cannot express many relevant visualization processes. For instance, the visualization pipeline model cannot express the increasingly applied techniques of transforming and post-processing images after rendering [5,7]. Moreover, the visualization pipeline model cannot describe appropriately the architecture of the complex 3DGeoVS presented in Section 5.1. In essence, the visualization pipeline model cannot express specific sequences of stages that are practically relevant. Table 1 enumerates two-stage sequence fragments that the visualization pipeline model cannot express, characterizes them and outlines practically relevant application examples. Figure 1 illustrates both stage sequences that the visualization pipeline can express and those that it cannot express.
To overcome these limitations, we propose the generalized visualization pipeline model based on the traditional visualization pipeline model. The generalized visualization pipeline model generally allows forming pipelines by combining arbitrarily any number of compatible operators from the three stages in any order (Figure 1). The traditional visualization pipeline model classifies an operator as either being of type filtering, mapping or rendering according to the characteristics of both its input and output data and assumes that operators are ordered according to their type. The model classifies data according to its characteristics as being enhanced and enriched, exhibiting geometry and visual attributes, being displayable images, or having none (raw data) of these characteristics. In contrast, the generalized visualization pipeline classifies operators only according to the characteristics of their output data (e.g., rendering operators output IReps from any suitable input) and allows one to combine operator types in any compatible order. For instance, the rendering Operators A and B are compatible and can be combined in this order (Transition 8 in Table 1), if Operator B accepts IReps as input. As abbreviation notation for any conceptual, mathematical or implemented generalized visualization pipeline with a minimum of zero or one operators, we use FMR* or FMR+ (borrowed from the Kleene operator notation), respectively.
The generalized visualization pipeline model can be used to design, describe and analyze visualization pipelines and respective visualization systems more effectively, precisely and in more detail compared with the traditional visualization pipeline mode. The proposed model is a foundation for several contributions in this work. The SRA for 3DGeoVS based on SSI (Section 4) and the architecture of a complex 3DGeoVS (Section 5.1) are based on the proposed model. The preprocessing and runtime processing pipelines of the proposed navigation technique [9] are described using the proposed model. In [7], we present an image-based styling algebra based on the proposed model, which allows modeling image-based styling (IStyling) as a functional composition of elemental operators of types filtering, mapping and compositing (as specialization of rendering) using IReps as unified 3D model representation for operator input and output. This unified representation is a significant property that enables one to compose operators almost arbitrarily.
4. Software Architecture Views
This section presents five views of the SRA for 3DGeoVSs based on SSI. Each view is based on a viewpoint as defined in the RM-ODP [42] and comprises architecture models [16]. RM-ODP provides a “coordinating framework for the standardization of open distributed processing” [42]. We choose RM-ODP for organization, since it is already proposed and used to model SOAs in general and in the geospatial domain [19,80–82,93]. For informing the design of the proposed SRA (Section 4), its applications (Section 5) and their evaluation (Section 6), we reuse a set of generic requirements published in [10].
The following sections present five views as follows: The enterprise viewpoint (Section 4.1) outlines the purpose of targeted systems and introduces two user roles, including related use cases: viewer and author. The information viewpoint (Section 4.2) focuses on information representation and processing and introduces three major classes of data types: 3D model representation types, stage specification types and metadata types. The computational viewpoint (Section 4.3) focuses on the logical, functional decomposition of the system into services and describes the general service architecture, architectural support for CMV and CV and service chaining. The engineering viewpoint (Section 4.4) focuses on the support of distributed interaction in the system and is concerned with the physical architecture of a system. The technology viewpoint (Section 4.5) focuses on the choice of technology, including standards, gives an overview of standards for the technology stack, data models, data encodings and services and explains how to compose visualization pipelines from the introduced technology.
4.1. Enterprise Viewpoint
The enterprise viewpoint focuses on the “purpose, scope, and policies of a system” [42].
Specific high-level enterprise objects, purposes, processes and requirements characterize the system. As high-level enterprise objects, the system is concerned with 3DGeoVEs that as 3D models incorporate and represent the space of V3DCMs and V3DLMs based on geodata. The primary purpose of the system is generating insight in geodata by means of interactive visualization [1]. The system implements a specific value chain for geospatial information [19] that transforms base geodata into value-added derived geodata for the purpose of visualization. The system is not responsible for acquiring or generating base geodata itself. Instead, it relies on being provided with base or derived input geodata. General key requirements for the system relating to technology are identified in [10].
The primary roles of users interacting with the system are viewer and author (Figure 2). A viewer uses the system to interactively explore, analyze, synthesize or present 3D visual representations of geodata [1]. Each of these primary use cases includes seven secondary use cases, which can be active while a viewer interacts with the system in the primary use cases. The secondary use cases allow a viewer to select, navigate, reconfigure, encode, abstract or elaborate, filter or connect presented visual representations. The secondary use cases are based on a taxonomy of interaction techniques in visualization, which are based on the notion of user intent [46]. We choose this taxonomy since its level of abstraction and its being based on user intent make it appropriate for defining use cases, and we find it appropriate for classifying occurring interactions (Section 5.1). An author uses the system to define the system (e.g., by choosing services and composing them to composite services used as parts of the system), configure the system (e.g., by configuring services) or manage data contained or referenced by the system (e.g., to create, read, update or delete data). Multiple viewers and authors can use the system at the same time. The effects of using the system are isolated for viewers not participating in CV and can be visible to other users or authors. The introduced use cases are of high-level, ideal-typical form. For a practical system, they can serve as a starting point for the definition of specific use cases.
4.2. Information Viewpoint
The information viewpoint focuses on the semantics of information, information processing and on modeling of the shared information as manipulated by the system [42]. The SRA uses three major classes of data types for transmitting data between services that constitute visualization pipelines: 3D model representation types, stage specification types and metadata types.
As 3D model representation types, the system employs three established representation types: feature (from the geospatial domain [4]), scene graph (from the computer graphics domain [5]) and IRep (from the computer graphics, image processing and geospatial domains [4–6]). In addition, other data denotes data not represented as features, scene graphs or IReps. Regarding the generalized visualization pipeline, features, scene graphs and IReps can each qualify as being enhanced and enriched for representing filtering operator output or exhibit geometry and visual attributes for representing mapping operator output. However, only IReps qualify as displayable images for representing rendering operator output. The set of proposed 3D model representation types is complete in the sense that there is at least one 3D model representation type for each data category of the visualization pipeline. For specific applications, the generic type feature can be specialized (e.g., using CityGML [94] for representing V3DCMs). In contrast, scene graphs and IReps do not need to explicitly represent application concepts, but instead may be required to encode links to source features to access application specific data from features (e.g., linking a scene graph geometry or an IRep pixel to the source feature it represents via IDs [7,9]).
Stage specification types specify the configuration of the processing of individual visualization pipeline operators belonging to a specific stage. We explicitly define four stage specification types. A filter encoding controls how a filtering operator maps features to filtered features (e.g., by selection) [89]. A feature-based styling specification controls feature-based styling (FStyling), i.e., how a mapping operator maps features to scene graphs [23,58,60,62,95]. A rendering specification controls a rendering operator, e.g., by defining the camera specification, and output image dimensions, encoding and quality [47,48]. An image-based styling specification controls IStyling, i.e., how a filtering, mapping or rendering operator maps an IRep to an output IRep [7]. A multitude of combinations of visualization pipeline stages, input stage specification types and input 3D model representation types exists. We focus on a specific baseline and leave fully exploring and defining all stage specification types for future work. As a baseline, connected paths of operators with defined stage specification types exist that transform input features into displayable output IReps (Figure 3).
Service consumers require metadata about service providers and data served by them to enable them to find and bind the service provides matching their requirements and to adjust to available service capabilities [93,96]. As major metadata types, the system employs standard service instance metadata types [19,93] and dataset metadata types [19,96].
4.3. Computational Viewpoint
The computational viewpoint focuses on the functional decomposition of the system into services that interact at interfaces, thus enabling distribution [42]. The computational viewpoint is concerned with the logical architecture of a system [93]. The logical architecture employs the classes of data types introduced in Section 4.2 as described below. This section describes the general service architecture, architectural support for CMV and CV and service chaining.
Service Architecture
We relate and integrate SOA concepts [2], the interactive generalized visualization pipeline and architectural patterns (short patterns) [44,45]. From these concepts, we derive a decomposition of a basic, generic 3DGeoVS into services and the data flow between the services (Figure 4). As the main organizing principle, functionality is partitioned and categorized according to different levels of abstraction into SOA layers using the layer pattern and vertically into subdomains. Functionality is separated and modularized into services using the domain object pattern that provide explicit interfaces for well-defined access and encapsulated implementations to decouple service consumers from service implementations. Service communication and the overall architecture, respectively, apply the client-server and SOA architectural style.
In the Viewersubdomain, the generalized visualization pipeline is modeled as applications of the pipes and filters (potentially using the tee and join variant) and transform view patterns and is represented by the sequence of services Data (as data source), Functional FMR*, Interaction FMR* and Viewer Display (as the data sink). The Data layer and Data services shield higher-level services from data-storage specifics using the database access layer pattern. Both FMR* services implement a generalized visualization pipeline implementing in total at least one stage and can each be represented as zero or more connected services. The Functional FMR* service provides visualization processing that can have high latency response times and is potentially distributed, whereas the Interaction FMR* service provides visualization processing that explicitly supports user interaction with low latency response times and can potentially be physically integrated with other interaction layer services. For supporting the user role Viewer, the Viewer Display service receives an IRep from a FMR* service and displays it to the Viewer. It accepts input from the Viewer through input devices. The Viewer Controller service transforms input events (e.g., touch or mouse click coordinates) into commands for updating the visualization. The Viewer Process acts as a facade, mediator and application controller that separates the Viewer Controller from the visualization pipeline and transforms these commands into a sequence of service calls and corresponding parameters for executing the pipeline. The process can be split into the Viewer Process Interaction for coordination of the interaction layer between Viewer Display, Interaction FMR* and lower layers and the Viewer Process Functional for coordination of the functionality and data layers between services of the pipeline. The Viewer Process closes the interaction loop. Figure 4 presents a mapping of the presented services to the model-view-control pattern. The services collectively support the primary use cases of the Viewer and allow the Viewer to explore, analyze, synthesize and present visual representations (Section 4.1).
The Author subdomain supports the use cases of the Author and allows the Author to define the system, configure the system and manage data. For this, the Author Display service presents a view of the system’s service composition, configuration and data to the Author and accepts input from the Author. The Author Controller transforms input events into commands to be executed by the Author Process Interaction for interaction-related commands and Author Process Functional for pipeline-related commands. The Author Process services collectively allow one to update the Author Display, query the Catalogue service (as application of the lookup pattern) to find suitable service instances for defining the system’s service composition and bind and configure Data, FMR* and Viewer Display services. Following the SOA design principles [2], the services on the process and interaction layer are typically stateful, the services on the functionality layer should be stateless and the services on the data layer are stateful.
Coordinated Multiple Views
CMV is a key technique for exploratory visualization where multiple views present data to a user and operations on the views are coordinated [12]. We describe an adoption of an existing model for CMV [14] to SOA (Figure 5, Viewer1 and Viewer2 represent the same user viewing two different, but coordinated displays) [10]. The model is chosen because it is based on the visualization pipeline model and can be used to describe a wide range of instances of CMV [14]. We use it to extend the presented service architecture with support for CMV. Central to the adoption is the introduction of a Coordinator service. A Coordinator coordinates and synchronizes aspects of two or more connected pipelines, such as parameters of display, pipeline stages and data. A Coordinator receives Viewer Controller events and transforms them into calls of the Viewer Process from connected pipelines. For instance, a Coordinator may transform an event to change the viewpoint from Pipeline 1 into an event to change the viewpoint in Pipeline 2 accordingly. The pipelines of different displays can share data and stages (fan-in/out), but this is not essential. A characteristic of CMV is that at least two displays are presented to one user and that at least one parameter change in one extended pipeline affects the other extended pipeline. We give an example of a service-oriented CMV system in Section 5.2.
Collaborative Visualization
Support for CV is required to allow a group of people to work together on tasks involving geovisualization [13]. We describe an adoption of an existing model for distributed, synchronous (different place, same time) CV [15] to SOA [10]. The model is chosen because it is based on the visualization pipeline model and can be used to describe a wide range of instances of CV [11,15]. We use it to extend the presented service architecture with support for CV. Synchronous CV can be characterized by the selective sharing of data, functionality (e.g., stages) or control between users [11]. A distributed CV system can be modeled as a collection of pipelines. The pipelines can be complete or partial and can share data and stages. Each participating user receives the output of at least one pipeline and can control the collection of pipelines at specific stages. The control information for a stage in one pipeline can be used for a corresponding stage in a different pipeline to synchronize the stages. The originally proposed models for CMV [14] and for CV [15] share many similarities. In both models, at least two displays are present (for one user in CMV and two users in CV) and data, functionality and control can be shared. For CMV, sharing is not essential. However, at least one parameter change in one pipeline must result in a transformed parameter change in a different pipeline. For CV, sharing of data, functionality or control is essential. When sharing control, parameter changes are typically shared untransformed between pipelines. Because of the similarities, the adoption of the CMV to SAO (Figure 5, Viewer1 and Viewer2 represent two different users) can be used to model CV, as well. For CV, the sharing of control can be seen as just another instance of coordination. The user input events from different users all pass through the central Coordinator. The Coordinator encapsulates the knowledge of what event from what user affects what viewer process in what way.
Service Chaining
The service architecture uses multiple collaborating services to provide its functionality. Service chaining is a model for combining services in a dependent series to achieve larger tasks. A service chain is a specific composite service defined as a sequence of services where, for each adjacent pair of services, the occurrence of the first action is necessary for the occurrence of the second action [93]. Preceding descriptions of service chains in this article focused on the major data flow between services. This subsection presents various combinable architectural patterns to facilitate designing in more detail the data passing, control flow and transparency and control of service chains. The choice of patterns can influence the quality attributes of a software architecture [43,93]. As a constraint, the specific service interfaces occurring in a service chain determine which patterns can be used in what combinations.
For passing data between two adjacent services in a service chain, we distinguish four data passing chaining patterns (Figure 6). The persistent pattern enables storing potentially voluminous processing results for decoupled access and reuse. The direct and mediated patterns are appropriate for on-demand processing if data is transient and not voluminous. The direct pattern might cause the lowest overhead, since the data do not pass through a third service. The mediated pattern gives the higher-level service the opportunity to evaluate and process the data for delivering its service and controlling and mediating subordinate services. The mediated persistent pattern combines the characteristics of the mediated pattern and the persistent pattern.
For designing the control flow of the execution of a service chain, we distinguish three patterns [43,93] (Figure 7). In the mediated control flow pattern, the composite service in turn calls the participating services. In the nested pull control flow pattern, the composite service calls one participating service that itself may call further participating services. Computations are modeled hierarchically, and any computation result may pass up the call graph to the composite service. In the nested push control flow pattern, the composite service calls one participating service that itself calls the next participating service in the chain. The last participating service may pass any computation results to the composite service. Computations are modeled as a pipeline where the composite service triggers the first service in the pipeline, and the last service in the pipeline may pass any results to the composite service. Both nested patterns simplify the composite service’s coordination responsibilities and makes chaining more opaque. However, they also limit the composite service’s ability to control the execution and introduce complexities when passing information to the composite service, e.g., relating to metadata or exceptions.
For adjusting the transparency and control that a human user has regarding a service chain, three patterns can be distinguished [43,93] (Figure 7). In client-coordinated (transparent) chaining, the user interacting with the client may define the service chain, has full knowledge of the participating services and controls the execution of the service chain and participating services. This pattern offers full visibility and control for a user, but requires full knowledge of participating services and deep involvement. In workflow-managed (translucent) chaining, the user interacting with the client knows about the involved services, but invokes a composite workflow management service, which controls the execution of the service chain. Participating services may provide their execution status directly to the client. This pattern strikes a balance between transparent and opaque chaining regarding transparency, control and flexibility. In static (opaque) chaining using aggregate services, the user interacting with the client does not know about the participating services. They are hidden by a composite service, which controls their execution. This pattern hides chaining complexities from the user, but offers less flexibility and control.
4.4. Engineering Viewpoint
The engineering viewpoint focuses on the “mechanisms and functions required to support distributed interaction between objects in the system” [42].
The engineering viewpoint is concerned with the physical architecture of a system [42] and includes decisions on physically integrating services. The logical architecture of the system (Section 4.3) is mapped to one of many possible physical architectures (also deployment architectures), which consist of entities, including networked computers [93]. The distribution of services from a layered logical architecture to a layered physical architecture results in defining a number of physical layers (also physical tiers). Services on the same physical layer or computer can be physically integrated with each other (e.g., a service consumer using a service provider’s API where both execute on the same CPU using shared memory), whereas services on different physical layers or computers typically communicate over a network. Physically integrating services can increase a system’s efficiency (e.g., by eliminating communication overhead or enabling further optimizations). However, it also limits the potential for sharing and reusing the resources provided by the services. Distributing services facilitates the distinction between thin clients or services and thick clients or services depending on the amount of integrated functionality or data [93]. Physical integration can be indispensable to meet interactivity requirements of a system, while retaining appropriate logical separations of concerns. To facilitate this choice, all service types should allow both physical integration and distribution.
Moreover, the engineering viewpoint generally encompasses specifying the required distributed computing platform (DCP), middleware and system infrastructure and specifying how the system supports required distribution transparencies [42]. However, these aspects are not in the scope of the presented SRA.
4.5. Technology Viewpoint
The technology viewpoint focuses on the choice of technology, including standards [42]. This section gives an overview of the standards for the technology stack, data models, data encodings and services and explains how to compose service chains that implement generalized visualization pipelines from the introduced data models and services. The presented technology standards substantiate the concepts of the previously described viewpoints with a focus on visualization pipelines.
Technology Standards Stack
Table 2 gives an overview of a technology stack and lists for each layer a selection of standards that are relevant when building 3DGeoVSs based on SSI. This SRA is based on, specializes, extends and supplements specifications, including those listed under the category concepts and architecture. The following subsection detail standards for services and data. The listed DCP, middleware and network technology represents commonly used based technology primarily facilitating connectivity and communication, while providing distribution transparencies.
Data Models and Encodings
Table 3 gives an overview of a selection of relevant standards and proposals that detail the abstract information models introduced in the information viewpoint (Section 4.2). Various additional standards can supplement the overview that, e.g., relate to base technology (e.g., XML), process models (e.g., business process model and Notation (BPMN), Business Process Execution Language (BPEL)) or come from the ISO 19100 series of standards.
Regarding 3D model representations, features can be represented using GML [97] or WKT/WKB [98] for generic geospatial features, CityGML [94] as an application schema of GML for V3DCMs, IFC [99] for building information model data and IReps for coverages [100,101]. 3D scene graphs can be represented with X3D [59] or COLLADA [102] from the computer graphics domain, or KML [103] from the geospatial domain. IReps can be encoded using standard formats, which can be grouped according to their purpose: encoding single color or gray-scale images (e.g., JPEG), compact encoding and decompression by the GPUs (e.g., S3TC/DDS [104]), including the representation of high dynamic range color ranges (e.g., OpenEXR [105]) and the representation of images as triangle meshes (e.g., using X3D [48,59]), augmenting images with geospatial attributes (e.g., GeoTIFF) and encoding georeferenced views on 3D models (e.g., image-based view (IView) [7]).
Regarding stage specifications, filter encoding [89] enables one to express query expressions for filtering GML encoded features. SLD/SE [58,95] facilitates 2D styling and SLD3D/SE3D [23,60,62] 3D styling of GML encoded features. ISLD/ISE/ISA [7] facilitates 3D styling of IReps encoded as IViews. The WCPS language [100] facilitates the retrieval and processing of multidimensional geospatial coverages. For specifying rendering, parameters from various standards are reused (e.g., X3D [59], KML [103]).
The concept of IViews and ISLD/ISE/ISA are the author’s contributions and are formally introduced in [7]. An IView is a georeferenced, projected view of a 3D model that can be represented as an ordered list of images (encoded using formats listed above), a camera specification and further data. ISLD/ISE/ISA are declarative, domain-specific languages for the image-based 3D styling of IReps.
Services
Table 4 gives an overview of a selection of relevant standards and proposals for services. The overview lists for every SOA architecture layer relevant service interface standards and proposals. Various additional standards from the Open Geospatial Consortium (OGC) and the ISO 19100 series of standards can supplement the overview.
The data layer contains services that manage and grant access to data. A Catalogue Service for the Web (CSW) manages metadata about data and services and supports publishing and searching collections of metadata [108]. A Web Map Tile Service (WMTS) serves “map tiles of spatially referenced data using tile images with predefined content, extent, and resolution” [109]. Moreover, the data layer can contain data resources, such as stage specification documents or image files, which can be accessed via HTTP/FTP file access.
The functionality layer contains services that provide domain-specific functionality on a high level of abstraction. A portrayal service provides visualizations of geodata [19]. A WISS [7] is a 3D portrayal service for geodata that provides styling IReps. It outputs styled IViews from input IViews and input image-based styling specifications. Instances of the following services can be associated with the data layer, the functionality layer or both, depending on the capabilities of a specific service instance. Services exist for generic data processing (WPS), access to and transactions on features (WFS), access to coverages (WCS), access to and processing of coverages (WCPS) and 2D portrayal of geodata in the form of 2D maps (WMS). A W3DS is a 3D portrayal service for geodata that outputs scene graphs representing 3D visual representations of geodata for a given geographic area [114]. A WVS [47,48] is a 3D portrayal service for geodata that outputs IReps in the form of IViews representing views on 3D models comprised of geodata.
Services in the process layer execute portrayal or view processes by orchestrating services on the functionality and data layers. Services on the interaction layer offer interfaces to human users or other software components. For both the process and the interaction layer, no dedicated service standard proposals exist yet. However, the generic WPS can encapsulate services on each layer. In addition, we propose the following two services for use on the interaction layer to implement Interaction FMR* services (Section 4.3) that support interaction. A WISS provides interactive IStyling. A Novel View Service (NVS) [8] outputs IReps representing novel views from input IReps and input camera specifications using image-based rendering [83].
The WVS, WISS and NVS are standardization proposals that are the author’s contributions and are introduced in detail in the dedicated publications [47,48], [7] and [8], respectively.
Composing Generalized Visualization Pipelines
The introduced standards for data and services provide various possibilities to compose service chains that implement generalized visualization pipelines. This subsection further categorizes instances of introduced service types and then shows how to combine these to form generalized visualization pipelines. Such pipelines refine and substantiate the Functional FMR* and Interaction FMR* services of the service architecture (Section 4.3).
Typically, instances of service types can vary in provided functionality within the bounds set by the respective specification. Table 5 categorizes service instances of the introduced service types suitable for composing generalized visualization pipelines differentiated according to implemented stages, input and output. Each service instance type is denoted with an identifier that indicates the service type, the implemented stages and input and output 3D model representation types (e.g., WVS-MRFeature→IRep). The listed service instance types represent each input and output 3D model data with one type only. This reflects the convention of existing standards and proposals. However, additional service instance types for WPS can be conceived that use multiple types for input or output.
Figure 8 depicts the possibilities to compose linear service chains from service instance types (Table 5) where each service chain implements a generalized visualization pipeline. Each service chain starts with data represented with any of the introduced 3D model representation types and ends with data represented as IRep consumed by a Display→IRep. The introduced service instance types allow composing service chains of arbitrary length. The shortest possible service chain provides and displays an IRep (e.g., WVS-DFMRIRep→ and Display→IRep). The diagram states only depict the types that 3D model data are represented with when exchanged between services. Internally and particularly when implementing multiple visualization pipeline stages, a service can use multiple and arbitrary types for representation. Comparing the 3D model representation types in the diagram, an IRep can be further processed in the most versatile ways. An IRep is either directly displayed, transformed into a value-added IRep, transformed into a scene graph, interpreted as a texture for use as part of a scene graph, transformed into a set of features or interpreted as a coverage feature. Since a WPS only defines a generic interface for user-defined functionality, a WPS can represent arbitrary transformations. The diagram only depicts the possibilities to compose linear service chains. Multiple linear service chains can be combined into a graph representing a more complex generalized visualization pipeline.
5. Applications
This section describes the results of applying the proposed SRA and its concepts to design, describe and analyze exemplary 3DGeoVSs. The objective is to provide proofs of concept for the applicability and utility of the proposed SRA and its concepts. As exemplary 3DGeoVSs, we present a composable 3DGeoVS based on SSI (Section 5.1), a CMV mashup (Section 5.2), an existing 3DGeoVS as part of a 3D SDI (Section 5.3), a range of systems resulting from the combination of components from multiple software systems as part of an interoperability experiment (Section 5.4) and industry implementations (Section 5.5).
5.1. A Composable 3D Geovisualization System Based on SSI
This section presents the architecture of a prototype 3DGeoVS based on SSI (Figures 9–11) [10,47]. The architecture is the result of applying the proposed SRA to design a composable system in the target domain with requirements refined from the generic target domain requirements published in [10]. The architecture conforms to the presented viewpoints of the SRA (Section 4) and applies and refines them as follows.
Enterprise Viewpoint
The main technical purpose of the system is to enable multiple concurrent viewers with resource-limited client devices to interact with visual representations of distributed, massive, static V3DCMs. As particular characteristics, the system supports:
concerns of both authoring the system and viewing contained data,
distributed CV between authors and viewers,
IStyling separated into view-dependent and view-independent IStyling for more efficient processing,
two physical viewer client configurations, which trade off client device resource consumption with interactivity,
efficiently processing and mapping unique, massive surface textures (including building model textures) and
a novel navigation technique denoted as assisting, constrained 3D navigation technique (ACNavTech) tailored to V3DCMs both suitable for novice and expert users [9].
The presented architecture is intended as a base architecture, which can be extended to support specific applications (e.g., civil services, tourism, entertainment). The system focuses on providing interaction techniques tailored to V3DCMs and providing high quality and flexibly styled visual representations of massive, static V3DCMs. The system separates the concerns of authoring from the concerns of viewing. Authoring comprises the author role and its use cases, including an off-line preprocess that generates a data representation optimized for interactive 3D rendering and navigation. Viewing comprises the viewer role, its use cases and an interactive runtime process that uses the preprocessed data.
The system supports the seven secondary use cases of the viewer role as follows. For select, the viewer selects a feature by pointing at it, resulting in visually highlighting the feature. For navigate, the viewer can control the camera’s viewpoint by rotating, panning, or moving the camera automatically to a feature selected in the view or from a predefined list. For reconfigure, the viewer can rotate the camera on a sphere around a selected feature. For filter, the viewer can control the set of features to be portrayed by selecting feature layers from a predefined list (e.g., terrain, buildings) and optionally selecting an image-based style from a predefined list (e.g., terrain elevation or route visualization). For encode, the viewer can control the style of the visual representation by selecting a style for each selected feature layer (e.g., orthophoto, map) and an image-based style (see above) from predefined lists. For abstract/elaborate, the client offers geometric zooming (implemented by modifying the camera’s field of view), tool-tips for displaying additional information about selected features (implemented by retrieving additional information encoded in GML for a feature identified by its object identification (OID)) and measuring Euclidean distances between arbitrary two points in the view as simple analysis functionality (Figure 9). For connect, the system’s display can be combined with additional displays to create CMV configurations (e.g., as part of a mashup as presented in Section 5.2). For camera control, the client offers a set of standard navigation techniques (e.g., pan, zoom, orbit) and a navigation technique denoted as ACNavTech tailored to V3DCMs.
The system supports the three use cases of the author role as follows. To define the system, the author can query and select available distributed service instances to provide services designated in the system’s predefined visualization pipeline (see below). To configure the system, the author can specify stage specification documents for each composed service, including definitions of lists presented to the viewer in the viewer client for features of interest, feature layers and styles and image-based styles. To manage data, the author can initiate the data preprocessing that overwrites present preprocessed data with new preprocessed data. The system does not support managing source data, but can be extended for this purpose.
Information Viewpoint
In addition to the data types introduced in Section 4.2, the system uses a proprietary stage specification type for configuring the preprocessing and runtime processing of the ACNavTech services and proprietary data types for Author Client and Viewer Client configuration data.
Computational Viewpoint
Figure 10 gives an overview of the logical software architecture. In the following, we describe the system’s services and their relationships, its relation to CV and CMV and its use of service chaining patterns.
The architecture can be divided coarsely into five parts: the Author Client, the Preprocessor, the Viewer Client, the Styled View Generator and the data services. The Author Client provides a GUI for author use case functionality. It can query the Catalogue for available service instances and stores and manages stage specifications for the system centrally in the Stage Specification Store.
The Preprocessor generates scene graphs from source geodata optimized for efficient 3D rendering and suitable for supporting the ACNavTech. The composite Author Process Functional service orchestrates the preprocessing. It calls the Preprocessor services (partly parallelized) to transform Source Geodata into persistent Preprocessed Geodata. The Terrain Mapping and CityGML Mapping services generate tiled scene graph hierarchies from Terrain Store and CityGML Feature/Texture Store data, respectively. The Texture Preprocess service restructures the textures of the CityGML scene graph tiles for more efficient rendering by arranging them in a multiresolution virtual texture atlas [119]. The ACNavTech Preprocess service augments an existing scene graph with information that the Viewer Client exploits at runtime for navigation. It automatically generates a semantic, multiscale navigation hierarchy for a given V3DCM and encodes this hierarchy as OIDs stored in the scene graph and referenced textures. OSM data complements CityGML data with detailed definitions of structural features (e.g., streets, administrative borders).
The Viewer Client provides a GUI for viewer use case functionality and allows a viewer to interact with styled views of the 3DGeoVE. The Viewer Controller implements the controller part of the interaction and navigation techniques. The Viewer Process orchestrates the runtime part of the visualization pipeline. For this, it retrieves for the current camera specification an IView from the Novel View or Styled View Generator service. If a server does the rendering to relieve the client, then the Novel View service interposed at the client-side generates novel IViews with low latency from IViews retrieved asynchronously with high latency from the server-side generator. The ACNavTech Overlay generates an IView that acts as a 2D overlay to be displayed on top of an independently created view to support navigation. The IStyling View Dependent service augments the IView representing the current view with view-dependent IStyling, the navigation overlay and additional GUI overlay elements. Finally, the augmented IView is passed to the Display.
The Styled View Generator generates styled IViews from preprocessed geodata as part of the interactive runtime processing. The 3D Rendering service renders IViews from scene graphs that are already styled using FStyling and retrieved from the Scene Graph Tile Store. The IStyling View Independent service provides IViews retrieved from the 3D Rendering service and augmented with view-independent IStyling. If a Novel View service is used, IStyling must separated be into a view-independent service (before Novel View, e.g., applying diffuse lighting) and a view-dependent service (after Novel View, e.g., applying fog) to yield visually correct results. This is because a Novel View service reuses locally cached IViews captured from specific viewpoints to generate novel IViews from different viewpoints.
The system provides distributed CV (Section 4.3) where the author and the viewer user roles share data and services. Since no control is shared, there is no need for a coordinator service in this case. The system does not provide CMV (Section 4.3), but can be reused or extended for this purpose (Section 5.2).
The architecture exhibits three distinct service chaining assemblies, which apply different chaining patterns (Section 4.3) for different purposes. In the first assembly as part of the preprocessing, the persistent data passing pattern is used for storing source and preprocessed geodata. The nested pull (Preprocessor calls Source Geodata) and push (Preprocessor calls Preprocessed Geodata) control flow pattern is used to align control and data flow for more efficient processing and because it reflects properties of given service interfaces. The translucent chaining pattern is used with Author Process Functional as composite service to automate and separate process execution while at the same time giving the author execution feedback. In the second assembly as part of the runtime processing, the Viewer Process acts as a composite service of a mediated data passing pattern and mediated control flow pattern to compose service calls from service invocation results as required. The Viewer Process acts as a composite service of the opaque chaining pattern to hide service composition and execution details from the viewer. In the third assembly as part of the runtime processing, the Novel View and ACNavTech Overlay services apply the direct data passing pattern and nested control flow pattern (i.e., nesting service calls in service calls) for efficient data transmission.
Engineering Viewpoint
The deployment diagram in Figure 11 depicts a mapping of the logical software architecture to a physical architecture. The mapping assigns software artifacts derived from the services to hardware devices and software execution environments. Artifacts are assigned to six devices: Author Client, Viewer Client Light, Viewer Client Medium, Authoring Server, Viewer Server and Data Server. The Viewer Server device contains GPUs, which offer hardware-accelerated processing to its contained Styled View Generator. The Authoring Server does not require GPUs. The Viewer Server physically integrates the Preprocessed Geodata to reduce communication overhead between the Styled View Generator and the Preprocessed Geodata. The Viewer Client Light and the Viewer Client Medium are two different configurations, which trade off client device resource consumption with interactivity and are suitable for different requirements [8]. The Viewer Client Light offers less computing resources. It off-loads processing from the client to the server at the cost of decreased interactivity by using a local Novel View service and the Styled View Generator on the Viewer Server to retrieve IViews. In contrast, the Viewer Client Medium physically integrates a Styled View Generator.
Technology Viewpoint
Various technologies can be reused for implementing the system’s services. For instance, the OGC maintains a listing of OGC compliant implementations and products [120]. Technology aspects of the proposed WVS, WISS, NVS and ACNavTech can be found in respective publications [7–9,47,48].
5.2. A Coordinated Multiple Views Mashup
We present a second architecture of a prototype 3DGeoVS based on SSI (Figures 12, 13) [10,47]. This architecture demonstrates reusing and extending the SRA and the architecture presented in Section 5.1 to create a web-based mashup that realizes CMV and integrates geodata and services from different organizations on the interaction layer. The JavaScript-based client presents two displays to the viewer. The first display inside package Google Maps Client displays 2D maps using the Google Maps JavaScript API retrieved from a Google Maps Server (conceptually implementing a generalized visualization pipeline internally). The second display inside package Viewer Client displays 3D perspective views retrieved from a Styled View Generator. Both displays show models of the same geospatial area, but the underlying data and functionality for generating the displayed images are completely disjoint. Input events pass from either display to the Coordinator. The Coordinator then synchronizes both displays by translating interactions on one display (e.g., moving the viewpoint or selecting features) to changes visible in the second display.
5.3. Description and Analysis of an Existing System
In this section, we use the proposed SRA to describe and analyze an existing system documented in the literature and through web resources (Figure 14) [29,33]. The system is the result of a research project pursuing the following main objectives: “interoperable implementation of 3D city models, building up the required 3D spatial infrastructure, development of prototypical applications using the 3D service infrastructure”, and integration of OSM data in a 3D SDI at global scale [29,33]. The system represents an effort that has been developed independently and in parallel to the work presented in this article. The following summarizes the system’s enterprise and computational viewpoints.
The enterprise viewpoint of the system in general conforms to that of the SRA (Section 4.1). We further characterize this system (“System B”) by comparing it to the previously described system (“System A”, Sections 5.1 and 5.2):
The main technical purpose of the system is to enable multiple concurrent viewers to interact with visual representations of distributed, massive, static V3DCMs. Similar to System A, System B separates the concerns of authoring (including off-line preprocessing) from the concerns of viewing (including interactive runtime processing), focuses on flexibly styled visual representations, offers standard navigation techniques and realizes CMV by integrating a 2D overview map.
In contrast to System A, System B does not provide navigation techniques tailored to V3DCMs, IStyling, a physical viewer client configuration that reduces client resource consumption by off-loading rendering to the server-side, and unique, massive surface texturing for buildings.
In contrast to System A, System B does provide FStyling as part of the runtime processing (instead of as part of preprocessing with a fixed set of styles to choose from at runtime), feature labeling, integration of additional data sources (e.g., sensors, routes) and additional viewer functionality. System B supports the viewer role use cases through additional viewer functionality: Pointing at a location displays its postal address (abstract/elaborate). Entering a postal address teleports the camera to the corresponding location (navigate). Selecting categories of yellow pages displays respective points of interests in space (filter). Selecting additional data, such as sensor data (e.g., temperature, smoke alarms) or GPS tracks displays respective data (filter). Street network routes can be computed and displayed (connect).
From the computational viewpoint, processing can be divided into authoring, including preprocessing, and viewing, including interactive runtime processing (Figure 14). The overall structure is very similar to the structure of System A. The Author Process Functional controls the Preprocessor to transform Source Geodata into Preprocessed Geodata for consumption by the Web 3D and Web Mapping services. The Map 3D Client allows users to interact with styled views and provides orchestration of viewer processes. The Subset and Filter service provides incremental data integration. The Terrain Tile Generator and Building Generator services generate scene graph tiles. The Labeling Generator generates feature labels encoded as scene graphs. The Map 3D Client retrieves scene graphs from the functionality layer (in contrast to System A, which retrieves IViews).
Summarizing the comparison of System B to System A, both systems share similar main objectives and are based on SOA and standards (“SS” of SSI). Therefore, their architectures share major principal similarities. However, System B does not support IReps and their processing as discussed in this work (“I” of SSI). Thus, System B does not exploit the potential of IStyling. For instance, in System B, applying a style using contour lines requires rebuilding and transmitting all relevant scene graph tiles (using FStyling) [60,62]. In contrast, in System A, applying such style is performed ad hoc on a rendered image immediately before display and more efficiently using IStyling [7]. In addition, System B does not support lightweight clients through server-side rendering (WVS interface) and generating novel views on the client-side (Novel View interface) in a service-oriented and interoperable manner. Thus, clients must be capable of rendering potentially voluminous scene graphs. Interoperability is impeded by storing preprocessed geodata in proprietary formats in relational databases and by providing mapping preprocessing through WPS instead of W3DS interfaces. In addition, the use of the mediated persistent data passing pattern by the preprocessing services may limit performance. Both systems differ in their support of specific features, e.g., navigation techniques, texturing, or labeling. Such features are common requirements for 3DGeoVSs and their support does not mutually exclude each other in a 3DGeoVS based on SSI. Therefore, future work can build systems and architectures that combine features as required using the proposed SRA.
5.4. 3D Portrayal Interoperability Experiments
A series of experiments as conducted in the 3D portrayal interoperability experiment project [34] demonstrates the interoperability and proof of concept of elements of the proposed SRA. Nine organizations from academia and the industry conducted the project to test and demonstrate different approaches for service-oriented 3D portrayal focusing on the W3DS and WVS proposals. The experiments employ implementations of the geodata preprocessor, WVS and viewer clients that were developed in the course of this work. The experiments tested real-world data sets with combinations of services and clients from ten different software systems for the general use case of urban planning.
As results, the experiments successfully tested and demonstrated setting up 3DGeoVSs based on the W3DS and WVS. In particular, the experiments demonstrated the integration of complex, detailed V3DCMs encoded as CityGML or OSM data into various W3DS and WVS servers and the delivery to various viewer clients executing as native or web-based applications on personal computers or on mobile devices. The experiments demonstrated a high degree of interoperability between the employed systems using respective standards and proposals. However, the experiments revealed minor interoperability issues and conceptual issues in the tested implementations and specifications. Results suggest that further community debate and testing (e.g., regarding tiling mechanisms, OID assignment) can improve the W3DS and WVS proposals prior to final standardization.
5.5. Industry Implementations
Industry implementations of the proposed WVS and NVS provide proofs of concept and hint at their practical relevance. The companies Autodesk Inc. and Bentley independently implemented 3D rendering services and viewer clients based on the WVS and NVS proposals. The implementations are integrated in the products Autodesk LandXplorer [121] (now superseded by Autodesk InfraWorks) and Bentley Geo Web Publisher [122], respectively. Both implementations result from immediate collaboration between the author and the companies.
6. Evaluation and Discussion
This section evaluates and discusses the proposed SRA, the 3DGeoVSs introduced as applications of the proposed SRA and the general approach of building 3DGeoVSs based on SSI. The objective is to contribute to answering the following questions that each is addressed in one of the following subsections:
Does the SRA support designing, describing and analyzing 3DGeoVSs based on SSI effectively and efficiently (Section 6.1)?
Does the SRA support exploiting the potentials of SSI (Section 1) when designing 3DGeoVSs based on SSI (Section 6.2)?
For answering the first question, we examine the set of systems that the SRA can be applied to (Figure 15, set B) using an existing evaluation framework [84]. For the second question, we examine the set of systems from the previous question narrowed to 3DGeoVSs based on SSI (Figure 15, set C = B ∩ D) using identified potentials for SSI (Section 1).
6.1. Effectiveness and Efficiency
The objective of this section is to assess whether the SRA supports designing, describing and analyzing 3DGeoVSs based on SSI effectively and efficiently. For this, the SRA is applied in five exemplary cases (Section 5) and we reflect critically and analyze the SRA using an existing evaluation framework for reference models [84] to obtain an initial, basic assessment. This section discusses the applications of the SRA as proofs of concept, an assessment of the SRA using four evaluation perspectives, a discussion of the effectiveness of the SRA and closes with conclusions.
Summarizing the five applications of the SRA (Section 5), these provide proof of concept for the following aspects and uses of the SRA. The applications demonstrate designing, describing, analyzing and comparing 3DGeoVSs based on SSI and SS with aspects, including CV and CMV. Furthermore, the applications demonstrate the concepts of WVS, W3DS and NVS, the interoperability of respective specifications and prototype implementations and their practical, industrial use and relevance. Dedicated publications provide additional proofs of concepts, implementations, applications on real-world data and evaluations of the WVS [47,48], WISS [7], NVS [8] and services for enabling 3D navigation by exploiting IReps [9].
Table 6 summarizes the results of a critical reflection of the SRA using four evaluation perspectives and derived criteria [84]. As fundamental properties of the SRA, we rate positively that currently no other SRA exists that addresses the same challenges and that it combines and relates proven, standard, common and state-of-the-art concepts and techniques in an open and technology independent manner while exceeding the expressiveness of the traditional visualization pipeline. We rate neutral that the SRA due to its partial and generic nature requires additional effort for deployment and is currently limited with regard to organizational and industrial spreading and commitment. We rate negatively that using the SRA requires specifying implementation details beyond visualization pipeline design (e.g., detailed control and data flow, optimizations), lacks standardization of the SRA and core concepts (e.g., WVS, WISS) and introduces overhead through distribution.
We further investigate the effectiveness of the SRA by examining the class of systems that the SRA can or cannot be applied to (Figure 15):
Can the SRA be applied to 3DGeoVSs based on SSI (i.e., is C 6= ∅)? Yes, as the proof of concept applications (Section 5) and the construction of the SRA demonstrate. The SRA applies to 3DGeoVSs because it covers systems for the interactive visualization of geodata represented in 3D Cartesian space. The SRA applies to SSI since it applies the defining conceptual elements of a SOA (service-oriented application domain-IT-alignment, service concept, SOA reference architecture, [2,123]), applies and proposes standards and allows exploiting the potentials of IReps by using WVS, WISS, NVS and other services.
Can the SRA be applied to all 3DGeoVSs based on SSI (i.e., is B ⊇ D)? Probably not, because without further investigations we cannot exclude that a system can be built that qualifies as 3DGeoVS based on SSI, but uses concepts that contradict the SRA.
Can the SRA be applied to systems that are not 3DGeoVSs based on SSI (i.e., is B ∩ D 6= B)? Yes, as the proof of concept application in Section 5.3 demonstrates. This application does not exploit the potentials of IReps beyond the generation of images for immediate display. Generally, the SRA can be applied to a subset of 3DGeoVSs based on SS (SSI without “I”). To exploit the potential of IReps, a system must use services that generate (e.g., WVS) and consume IReps (e.g., WISS, NVS).
In conclusion, the results suggest that the SRA supports designing, describing and analyzing a specific class of 3DGeoVSs based on SSI effectively and efficiently. Furthermore, results suggest that using the proposed SRA is beneficial compared with the alternatives of using no SRA at all or developing a new SRA from scratch.
6.2. Exploiting the Potentials of SSI
Applying the principles of SSI when building 3DGeoVSs offers potential benefits as introduced in Section 1. The objective of this section is to reflect critically whether the SRA supports exploiting these potentials when designing 3DGeoVSs based on SSI.
SOA
Designing a 3DGeoVS as distributed system enables benefits as demonstrated by the applications in Section 5. Benefits include sharing of resources, including geodata, services and computing capacity, enabling CV and multiuser access, improving runtime efficiency through parallelization (e.g., parallelizing preprocessing and runtime processing, application logic and database access) and cost efficiency through the use of multiple inexpensive standard computers for most tasks. The presented applications do not demonstrate improving reliability, but assumedly can be extended for this purpose. SOA offers the potential to build and adapt 3DGeoVSs in an efficient and agile manner [2]. The application of elemental SOA concepts [2,123] supports exploiting this potential in different ways.
The application domain-IT-alignment results in services that are aligned to and focus on the domain (i.e., 3D geovisualization) and support designing, describing and analyzing systems as visualization pipelines. However, these activities are impeded by the need to represent on the architectural level details beyond the design of a visualization pipeline related to, e.g., control flow, data flow, persistence and optimizations. These activities are further impeded by the coarse-grained aggregation of multiple visualization pipeline stages in indivisible services (e.g., for optimization as in WISS-FMR*IRep→IRep, or for encapsulating legacy components or abstracting proprietary visualization pipeline subgraphs as in ACNavTech Preprocess, Section 5.1).
The service concept facilitates various potentials. Preferably stateless services can be less complex to use or implement (with moderate overhead for service implementation optimizations, such as caching as used, e.g., for the prototype WVS, WISS and NVS implementations). Coarse-grained, cohesive services can improve performance (e.g., the WISS executing complex, programmable IStyling with one invocation [7]). Loosely coupled services can be easily combined (e.g., coupling the same WVS instance at runtime with different simultaneous consumers, Section 5.4). Interface-oriented services separate implementation from interface facilitating the exchangeability of service instances and implementations (e.g., accessing different W3DS instances and implementations from the same consumer, Section 5.4). Opportunities can arise to reuse and integrate different existing services and implementation components and technologies (e.g., implementations of different cooperating services are implemented with C++ and Java and reuse existing frameworks, such as OpenSceneGraph and Java3D, respectively, Section 5.4). However, stateless services can be less efficient or effective than stateful services (Section 5.4) and physically integrating services can improve efficiency with the drawback of a tight coupling of service provider and consumer (Section 5.1).
The SOA reference architecture facilitates creating unified architectural views of systems. Thus, for instance, we demonstrated that representing the independently developed systems from the same domain described in Sections 5.1 and 5.3, respectively, with means of the same SRA makes them easier to compare and supports identifying similarities and differences. Moreover, the SOA reference architecture enforces structure through layering and subdomains (e.g., authoring and viewing subdomains, Sections 5.1–5.3).
The application domain process management facilitates efficient and agile specification, adaption and execution of processes. The proposed SRA supports process management and its potentials only partly through, e.g., a dedicated process layer, service templates (e.g., Viewer Process) and the WISS interface, including a language for specifying IStyling processes. However, the SRA lacks an explicit, appropriate representation for visualization pipelines that abstracts from extraneous, unrelated details (as noted above).
The SOA infrastructure provides various distribution transparencies and technical services. The proposed SRA does not specify an infrastructure and the applications of the SRA only use a basic infrastructure and DCP that fulfills basic requirements without exploring further uses and benefits.
In summary, the SRA and its applications demonstrate supporting potential benefits of distributed systems and SOA with minor limitations. Some aspects, such as process management and infrastructure, demand further work.
Standards
Standards offer the potential to improve interoperability by allowing to couple systems more effectively and efficiently. The application in Section 5.4 demonstrates coupling effectiveness and efficiency for a subset of the SRA by coupling different real-world data sets, services and implementations from different organizations effectively with low overhead. However, for various service interfaces, standards are not available (e.g., Viewer Process, Section 4.3) or only standard proposals (e.g., W3DS, WVS, WISS, or NVS, Section 4.3) or weakly interoperable standards (e.g., WPS, which only provides syntactic and no semantic interoperability, Section 4.3) are available. As further benefits, we demonstrate system comparability by comparing two systems from Sections 5.1–5.3. A reduced risk of vendor lock-in and a competition between service providers and implementors is evident in different products and implementations for the same services (e.g., for W3DSs, Section 5.4, [120]). The integration and reuse of existing third-party service instances and implementations (Section 5.4) demonstrates outsourcing services. Platform independence is evident in the range of different platforms used for implementing the services of the applications (Section 5).
IReps
IReps exhibit various beneficial properties, which can be exploited for different applications [7–9,47,48].
IReps can serve as representations that are unified and decoupling (e.g., integrating and styling geodata represented as IReps in ACNavTech Preprocess and WISS regardless of source and preceding storage, representation, processing and rendering) and output-sensitive (e.g., image storage requirements with upper bound depending on resolution and WISS IStyling processing execution times largely independent of image content). They can be efficient to generate, process and store on GPUs (e.g., as demonstrated by the WVS and WISS implementations), can be easier to obtain, to handle and more realistic to render (e.g., using photographs as textures for terrain and buildings in V3DCMs). IReps can be the only option to process when source descriptions of models are not available (e.g., WISS IStyling examples [7]).
However, although existing standards can be used for representing IReps of 3D models, they lack the ability to represent all required attributes (e.g., camera specification) in a standard compliant and integrated manner. No standard is available for the proposed IView representation. Thus, future standardization of appropriate encodings is required. Additionally, IReps are prone to sampling artifacts and aliasing. IReps tend to be incomplete with regard to a source model limiting processing effectiveness. Enabling interaction with IReps can be challenging. Storage and processing efficiency of IReps compared with other representation significantly depends on the complexity of the represented model and can be inferior for less complex models.
Several applications demonstrate exploiting IReps. We discuss a distributed visualization pipeline where a client-side NVS generates novel views from IReps retrieved from a server-side WVS to improve client-side efficiency, decoupling and platform independence. The WISS provides decoupled, output-sensitive, effective and efficient IStyling, which leverages existing image processing techniques. The ACNavTech exploits IReps in an efficient, output-sensitive manner to integrate geodata and reuse robust image processing techniques, to generate display overlays from an IReps, and to analyze 3D models to facilitate camera motion within the 3D model and to evaluate views for best-view selection.
In conclusion, results suggest that the SRA significantly supports exploiting the potentials of SSI. However, results also indicate limitations that hinder exploiting the potentials of SSI and demand future work. Such limitations include SOA process management and the general level of abstraction being suboptimal for visualization, the lack of standards for various core concepts, and the limited interactivity and efficiency when using IReps as representation for transferring a 3D model from the server-side to the client-side.
7. Conclusions
The software architecture of a 3DGeoVS and its underlying visualization model reflect their quality attributes and support various system life cycle activities. In this article, we introduced the generalized visualization pipeline model, a SRA for 3DGeoVSs based on SSI, applications of the SRA and an evaluation and discussion of the SRA and its applications. The proposed generalized visualization pipeline model is an appropriate foundation for building software architectures of 3DGeoVSs based on SSI. It generalizes and overcomes expressiveness limitations of the prevalent, proven visualization pipeline model, in particular with respect to transforming IReps. To facilitate exploiting IReps, the proposed IView representation and service types, WVS, WISS and NVS, are building blocks and integral parts of the SRA, which support the provisioning, styling and interaction with IReps, respectively. In addition, the proposed navigation technique for V3DCMs is an application of the SRA that supports interaction. The proposed SRA is a generic template software architecture for 3DGeoVSs based on SSI. The SRA integrates existing, proven concepts and technology and novel contributions, such as the generalized visualization pipeline model as a foundation and mechanisms for exploiting IReps. It is applicable to a specific subset of 3DGeoVSs based on SSI and a specific subset of 3DGeoVSs based on SOA and standards. This work is based on current, official, published standards and standardization proposals and proposes new standards and advancements of existing standards and proposals. Results of this work are intended to contribute to current and upcoming standardizations by the OGC.
The applications demonstrate proofs of concept for the general applicability and utility of the SRA by means of designing, describing and analyzing conceived and existing systems from academia and industry. Evaluation results suggest that the SRA significantly supports such activities effectively and efficiently and supports exploiting the potentials of SSI. However, the evaluation also indicates limitations and challenges. The general level of abstraction achieved by the SRA is estimated as suboptimal due to the need to specify implementation details beyond the design of a visualization pipeline on the architectural level related to, e.g., control flow, data flow, persistence and optimizations. In particular, the SRA lacks an explicit, appropriate visualization pipeline process representation and management that focuses on visualization pipeline concerns and abstracts from extraneous details. Various core concepts lack standardization or provide only weakly interoperable standards. Further challenges include achieving interactivity and efficiency when using IReps and generally supporting high degrees of interactivity and massive, dynamic data.
In future work, the approach can be further advanced by addressing the identified limitations and challenges, extending and refining the SRA beyond its original scope and focus and further applying and evaluating the SRA through case studies and user studies.
Conflicts of Interest
The authors declare no conflicts of interest.
References
- MacEachren, A.M.; Kraak, M.J. Research challenges in geovisualization. Cartogr. Geogr. Inf. Sci. 2001, 28, 3–12. [Google Scholar]
- Krafzig, D.; Banke, K.; Slama, D. Enterprise SOA: Service-Oriented Architecture Best Practices; Prentice Hall: Upper Saddle River, NJ, USA, 2004. [Google Scholar]
- International Organization for Standardization (ISO), Ed.; ISO 19101:2002, Geographic Information—Reference model; International Organization for Standardization: Geneva, Switzerland, 2002.
- Open Geospatial Consortium, OGC Reference Model, Version 2.1; Open Geospatial Consortium: Wayland, MA, USA, 2011.
- Akenine-Möller, T.; Haines, E.; Hoffman, N. Real-Time Rendering, 3rd ed.; A. K. Peters, Ltd.: Natick, MA, USA, 2008; p. 1045. [Google Scholar]
- Gonzalez, R.C.; Woods, R.E. Digital Image Processing, 3rd ed.; Pearson Prentice Hall: Upper Saddle River, NJ, USA, 2008; p. 954. [Google Scholar]
- Hildebrandt, D. Image-based styling. Vis. Comput. 2014. under review. [Google Scholar]
- Hildebrandt, D.; Hagedorn, B.; Döllner, J. Image-based strategies for interactive visualisation of complex 3D geovirtual environments on lightweight devices. J. Locat. Based Serv. 2011, 5, 100–120. [Google Scholar]
- Hildebrandt, D.; Timm, R. An assisting, constrained 3D navigation technique for multiscale virtual 3D city models. GeoInformatica 2014, 18, 537–567. [Google Scholar]
- Hildebrandt, D.; Döllner, J. Service-oriented, standards-based 3D geovisualization: Potential and challenges. J. Comput. Environ. Urban Syst. 2010, 34, 484–495. [Google Scholar]
- Duce, D.A.; Giorgetti, D.; Cooper, C.S.; Gallop, J.R.; Johnson, I.J.; Robinson, E.; Seelig, C.D. Reference models for distributed cooperative visualization. Comput. Graph. Forum 1998, 17, 219–233. [Google Scholar]
- Roberts, J.C. State of the art: Coordinated & multiple views in exploratory visualization, Proceedings of the Conference on Coordinated and Multiple Views in Exploratory Visualization (CMV 2007), Zurich, Switzerland, 2 July 2007; IEEE Computer Society: Washington, DC, USA, 2007; pp. 61–71.
- Isenberg, P.; Elmqvist, N.; Scholtz, J.; Cernea, D.; Ma, K.L.; Hagen, H. Collaborative visualization: Definition, challenges, and research agenda. Inf. Vis. 2011, 10, 310–326. [Google Scholar]
- Boukhelifa, N.; Roberts, J.C.; Rodgers, P.J. A Coordination model for exploratory multi-view visualization, Proceedings of the Conference on Coordinated and Multiple Views in Exploratory Visualization (CMV 2003), London, UK, 15 July 2003; IEEE Computer Society: Washington, DC, USA, 2003; pp. 76–85.
- Brodlie, K.; Duce, D.A.; Gallop, J.R.; Walton, J.P.R.B.; Wood, J. Distributed and collaborative visualization. Comput. Graph. Forum 2004, 23, 223–251. [Google Scholar]
- International Organization for Standardization (ISO), Ed.; ISO/IEC/IEEE 42010:2011, Systems and Software Engineering—Architecture Description; International Organization for Standardization: Geneva, Switzerland, 2011.
- OASIS. Reference Model for Service Oriented Architecture 1.0, 2006, Available online: http://docs.oasis-open.org/soa-rm/v1.0/ accessed on 13 October 2014.
- OASIS. Reference Architecture Foundation for Service Oriented Architecture Version 1.0, 2012, Available online: http://docs.oasis-open.org/soa-rm/soa-ra/v1.0/cs01/soa-ra-v1.0-cs01.html accessed on 13 October 2014.
- Open Geospatial Consortium, OGC Reference Model, Version 0.1.3; Open Geospatial Consortium: Wayland, MA, USA, 2003.
- Altmaier, A.; Kolbe, T. Applications and Solutions for Interoperable 3D Geo-Visualization. In Photogrammetric Week 2003; Fritsch, D., Ed.; Wichmann; Heidelberg, Germany, 2003. [Google Scholar]
- Coors, V. Graphical Abstraction and Progressive Transmission in Internet-Based 3D Geoinformationsystems. Ph.D. Thesis, Technische Universität Darmstadt, Darmstadt, Germany, 2003. [Google Scholar]
- Zhang, J.; Gong, J.; Lin, H.; Wang, G.; Huang, J.; Zhu, J.; Xu, B.; Teng, J. Design and development of Distributed Virtual Geographic Environment system based on web services. Inf. Sci. 2007, 177, 3968–3980. [Google Scholar]
- Haist, J.; Figueiredo Ramos, H.M.; Reitz, T. Symbology encoding for 3D GIS—An approach to extending 3D city model visualization to GIS visualization, Proceedings of the Urban Data Management Symposium, Stuttgart, Germany, 10–12 October 2007; pp. 121–131.
- Environment Agency for England & Wales. Virtual Environmental Planning System, 2008. Available online: http://www.veps3d.org/ accessed on 13 October 2014.
- Reitz, T.; Krämer, M.; Thum, S. Processing Pipeline for X3D Earth-based Spatial Data View Services, Proceedings of the Web3D, Darmstadt, Germany, 16–17 June 2009; ACM: New York, NY, USA, 2009; pp. 137–145.
- Simões, B.; Conti, G.; Piffer, S.; de Amicis, R. Enterprise-level Architecture for Interactive Web-based 3D Visualization of Geo-referenced Repositories, Proceedings of the Web3D, Darmstadt, Germany, 16–17 June 2009; ACM: New York, NY, USA, 2009; pp. 147–154.
- Bogdahn, J.; Coors, V. Using 3d urban models for pedestrian navigation support, Proceedings of the ISPRS Joint Workshop Cityscapes at GeoWeb, Vancouver, Canada, 27–31 July 2009.
- Niño-Ruiz, M.; Stock, C.; Bishop, I.; Pettit, C. Service oriented support for heterogeneous software tools in environmental modelling and visualisation, Proceedings of the MODSIM2009, Cairns, Australia, 13–17 July 2009; 9.
- University of Heidelberg, Department of Geography, GIScience. GDI3D—Spatial Data Infrastructure for 3D-Geodata—Towards Service Oriented Interoperable 3D City Models, 2010. Available online: http://www.gdi-3d.de/ accessed on 13 October 2014.
- Willmes, C.; Baaser, U.; Volland, K.; Bareth, G. Internet based distribution and visualization of a 3D model of the University of Cologne Campus, Proceedings of the 3rd ISDE Digital Earth Summit, Nessebar, Bulgaria, 12–14 June 2010.
- Ross, L. Virtual 3D City Models in Urban Land Management—Technologies and Applications. Ph.D. Thesis, Technische Universität Berlin, Berlin, Germany, 2010. [Google Scholar]
- Mao, B. Visualisation and Generalisation of 3D City Models. Ph.D. Thesis, Royal Institute of Technology, Stockholm, Sweden, 2011. [Google Scholar]
- University of Heidelberg, GIScience Group. OpenStreetMap-3D, 2012. Available online: http://www.osm-3d.org/ accessed on 13 October 2014.
- Open Geospatial Consortium, OGC 3D Portrayal Interoperability Experiment; Final Report; Open Geospatial Consortium: Wayland, MA, USA, 2012.
- Prieto, I.; Izkara, J.L. Visualization of 3D City Models on Mobile Devices, Proceedings of the Web3D, Los Angeles, CA, USA, 4–5 August 2012; ACM: New York, NY, USA, 2012; pp. 101–104.
- Rodrigues, J.I.J.; Figueiredo, M.J.G.; Costa, C.P. Web3DGIS for City Models with CityGML and X3D, Proceedings of the 17th International Conference on Information Visualisation, London, UK, 16–18 July 2013; pp. 384–388.
- Fraunhofer Institute for Computer Graphics Research (IGD). CityServer3D, 2014. Available online: http://www.cityserver3d.de/ accessed on 13 October 2014.
- Kreger, H., Estefan, J., Eds.; Navigating the SOA Open Standards Landscape Around Architecture; The Open Group: San Francisco, CA, USA, 2009.
- Upson, C.; Faulhaber, T., Jr.; Kamins, D.; Laidlaw, D.H.; Schlegel, D.; Vroom, J.; Gurwitz, R.; van Dam, A. The application visualization system: A computational environment for scientific visualization. Comput. Graph. Appl. 1989, 9, 30–42. [Google Scholar]
- Haber, R.; McNabb, D.A. Visualization Idioms: A Conceptual Model for Scientific Visualization Systems. In Visualization in Scientific Computing; IEEE Computer Society Press: Los Alamitos, CA, USA, 1990; pp. 74–93. [Google Scholar]
- Moreland, K. A survey of visualization pipelines. IEEE Trans. Vis. Comput. Graph. 2013, 19, 367–378. [Google Scholar]
- International Organization for Standardization (ISO), Ed.; ISO/IEC 10746-3:2009, Information Technology—Open Distributed Processing—Reference Model: Architecture; International Organization for Standardization: Geneva, Switzerland, 2009.
- Alameh, N. Chaining geographic information web services. IEEE Internet Comput 2003, 7, 22–29. [Google Scholar]
- Buschmann, F.; Henney, K.; Schmidt, D.C. Pattern-Oriented Software Architecture, Volume 4 A Pattern Language for Distributed Computing; John Wiley & Sons, Ltd.: Chichester, UK, 2007; p. 636. [Google Scholar]
- Clements, P.; Bachmann, F.; Bass, L.; Garlan, D.; Ivers, J.; Little, R.; Merson, P.; Nord, R.; Stafford, J. Documenting Software Architectures: Views and Beyond, 2nd ed.; Addison-Wesley Professional: Boston, MA, USA, 2010. [Google Scholar]
- Yi, J.S.; Kang, Y.a.; Stasko, J.; Jacko, J. Toward a Deeper Understanding of the Role of Interaction in Information Visualization. IEEE Trans. Visual. Comput. Graph.ics 2007, 13, 1224–1231. [Google Scholar]
- Hagedorn, B.; Hildebrandt, D.; Döllner, J. Web View Service Discussion Paper, Version 0.3.0; Open Geospatial Consortium: Wayland, MA, USA, 2010; p. 128. [Google Scholar]
- Hildebrandt, D.; Klimke, J.; Hagedorn, B.; Döllner, J. Service-Oriented Interactive 3D Visualization of Massive 3D City Models on Thin Clients, Proceedings of the 2nd International Conference on Computing for Geospatial Research & Applications COM.Geo, Washington, DC, USA, 23–25 May 2011; ACM: New York, NY, USA, 2011.
- Charters, S.M. Virtualising visualisation: A distributed service based approach to visualisation on the Grid. Ph.D. Thesis, Durham University, Durham, UK, 2006. [Google Scholar]
- Seligmann, D.D. Interactive Intent-based Illustration: A Visual Language for 3D Worlds. Ph.D. Thesis, Columbia University, New York, NY, USA, 1993. [Google Scholar]
- Voigt, M.; Franke, M.; Meißner, K. Using expert and empirical knowledge for context-aware recommendation of visualization components. Int. J. Adv. Life Sci. 2013, 5, 27–41. [Google Scholar]
- Casner, S.M. A task-analytic approach to the automated design of graphic presentations. ACM Trans. Graph. 1991, 10, 111–151. [Google Scholar]
- Gilson, O.; Silva, N.; Grant, P.W.; Chen, M. From web data to visualization via ontology mapping. Comput. Graph. Forum 2008, 27, 959–966. [Google Scholar]
- Gotz, D.; Wen, Z. Behavior-driven visualization recommendation, Proceedings of the 14th International Conference on Intelligent User Interfaces (IUI 2009), Sanibel Island, FL, USA, 8–11 February 2009; ACM: New York, NY, USA, 2009; pp. 315–324.
- Häberling, C. Topografische 3D-Karten—Thesen für kartografische Gestaltungsgrundsätze. Ph.D. Thesis, Institute of Cartography, ETH Zürich, Zürich, Switzerland, 2003. [Google Scholar]
- Rost, R.J.; Licea-Kane, B.; Ginsburg, D.; Kessenich, J.M.; Lichtenbelt, B.; Malan, H.; Weiblen, M. OpenGL Shading Language, 3rd ed.; Addison-Wesley: Boston, MA, USA, 2009; p. 792. [Google Scholar]
- Bertin, J. Semiology of Graphics: Diagrams, Networks, Maps; University of Wisconsin Press: Madison, WI, USA, 1983. [Google Scholar]
- Lupp, M., Ed.; Styled Layer Descriptor Profile of the Web Map Service Implementation Specification, Version 1.1.0; Open Geospatial Consortium: Wayland, MA, USA, 2007.
- International Organization for Standardization (ISO), Ed.; ISO/IEC 19775-1:2008, Information Technology—Computer Graphics and Image Processing—Extensible 3D (X3D), Version 3.2, ISO/IEC; International Organization for Standardization: Geneva, Switzerland, 2008.
- Neubauer, S., Zipf, A., Eds.; 3D-Symbology Encoding Discussion Draft v0.0.1; Open Geospatial Consortium: Wayland, MA, USA, 2009.
- Rio, N.D. A Declarative Domain Independent Approach for Querying and Generating Visualizations. Ph.D. Thesis, University of Texas at El Paso, El Paso, TX, USA, 2012. [Google Scholar]
- Neubauer, S.; Zipf, A. Suggestions for Extending the OGC Styled Layer Descriptor (SLD) Specification into the Third Dimension, Proceedings of the Urban Data Management Symposium, Stuttgart, Germany, 10–12 October 2007.
- International Organization for Standardization (ISO), Ed.; ISO/IEC 11072:1992, Information Technology—Computer Graphics—Computer Graphics Reference Model; International Organization for Standardization: Geneva, Switzerland, 1992.
- Leech, J., Ed.; OpenGL ES, Version 3.1(June 4, 2014); The Khronos Group Inc.: Beaverton, OR, USA, 2014.
- Microsoft Corporation. Direct3D 11 Reference, 2014. Available online: http://msdn.microsoft.com/en-us/library/windows/desktop/ff476079 accessed on 13 October 2014.
- McDonnel, B.; Elmqvist, N. Towards utilizing GPUs in information visualization: A model and implementation of image-space operations. IEEE Trans. Visual. Comput. Graph. 2009, 15, 1105–1112. [Google Scholar]
- Flöring, S. KnoVA: A Reference Architecture for Knowledge-Based Visual Analytics. Ph.D. Thesis, Universtität Oldenburg, Oldenburg, Germany, 2012. [Google Scholar]
- Heer, J.; Agrawala, M. Software design patterns for information visualization. IEEE Trans. Visual. Comput. Graph. 2006, 12, 853–860. [Google Scholar]
- Limbourg, Q. Multi-Path Development of User Interfaces. Ph.D. Thesis, Université Catholique de Louvain, Louvain-la-Neuve, Belgium, 2004. [Google Scholar]
- Armbruster, M.P. Towards A Reference-Model For Interaction Oriented Systems. Ph.D. Thesis, Technischen Universität Berlin, Berlin, Germany, 2011. [Google Scholar]
- Phillips, W.G. Architectures for Synchronous Groupware; Technical Report; Queen’s University: Kingston, ON, Canada, 1999. [Google Scholar]
- The Open Group, SOA Reference Architecture; The Open Group: Reading, UK, 2011; p. 192.
- Hensle, B.; Booth, C.; Chappelle, D.; McDaniels, J.; Wilkins, M.; Bennett, S. Oracle Reference Architecture, User Interaction, Release 3.0, E16349-03; Oracle: Redwood City, CA, USA, 2011. [Google Scholar]
- The Open Group, Service-Oriented Architecture Ontology; The Open Group: Reading, UK, 2010; p. 90.
- Rose, L.C., Ed.; Geospatial Portal Reference Architecture—A Community Guide to Implementing Standards-Based Geospatial Portals, Version 0.2; Open Geospatial Consortium: Wayland, MA, USA, 2004.
- Tillman, S., Garnett, J., Eds.; OWS Integrated Client—Architecture, Design, and Experience, Version 0.0.3; Open Geospatial Consortium: Wayland, MA, USA, 2006.
- Evans, J.D. A Geospatial Interoperability Reference Model; FGDC: Reston, VA, USA. Available online: http://www.fgdc.gov/standards/organization/GIRM accessed on 13 October 2014.
- GeoConnections, The Canadian Geospatial Data Infrastructure Architecture Description v2; Natural Resources Canada: Ottawa, ON, Canada, 2005.
- INSPIRE Network Services Drafting Team, INSPIRE Network Services Architecture (Version 3.0); Technical Report; European Commission: Brussels, Belgium, 2008.
- Hjelmager, J.; Moellering, H.; Cooper, A.; Delgado, T.; Rajabifard, A.; Rapant, P.; Danko, D.; Huet, M.; Laurent, D.; Aalders, H.; et al. An Initial Formal Model for Spatial Data Infrastructures. Int. J. Geogr. Inf. Sci. 2008, 22, 1295–1309. [Google Scholar]
- Béjar, R. Contributions to the Modelling of Spatial Data Infrastructures and Their Portrayal Services. Ph.D. Thesis, University of Zaragoza, Zaragoza, Spain, 2009. [Google Scholar]
- Cooper, A.K.; Moellering, H.; Hjelmager, J.; Rapant, P.; Delgado, T.; Laurent, D.; Coetzee, S.; Danko, D.M.; Dueren, U.; Iwaniak, A.; et al. A spatial data infrastructure model from the computational viewpoint. Int. J. Geogr. Inf. Sci. 2012, 27, 1133–1151. [Google Scholar]
- Zhang, C.; Chen, T. A survey on image-based rendering—Representation, sampling and compression. Signal Process.: Image Commun 2004, 19, 1–28. [Google Scholar]
- Frank, U. Evaluation of Reference Models. In Reference Modeling for Business Systems Analysis; Fettke, P., Loos, P., Eds.; IGI Global: Hershey, PA, USA, 2007; pp. 118–140. [Google Scholar]
- Shalf, J.; Bethel, E.W. The grid and future visualization system architectures. IEEE Comput. Graph. Appl. 2003, 23, 6–9. [Google Scholar]
- Dambruch, J.; Krämer, M. Leveraging Public Participation in Urban Planning with 3D Web Technology, Proceedings of the Web3D, Vancouver, Canada, 8–10 August 2014; ACM: New York, NY, USA, 2014; pp. 117–124.
- Wang, H.; Brodlie, K.W.; Handley, J.W.; Wood, J.D. Service-oriented approach to collaborative visualization. Concurr. Comput.: Pract. Exp. 2008, 20, 1289–1301. [Google Scholar]
- Schilling, A. 3D Spatial Data Infrastructures for Web-Based Visualization. Ph.D. Thesis, Universität Heidelberg, Heidelberg, Germany, 2014. [Google Scholar]
- Vretanos, P., Ed.; OpenGIS Filter Encoding 2.0 Encoding Standard v2.0.0; Open Geospatial Consortium: Wayland, MA, USA, 2010.
- Maass, S. Techniken zur Automatisierten Annotation Interaktiver Geovirtueller 3D-Umgebungen. Ph.D. Thesis, Universität Potsdam, Potsdam, Germany, 2009. [Google Scholar]
- Glander, T. Multi-Scale Representations of Virtual 3D City Models. Ph.D. Thesis, Universität Potsdam, Potsdam, Germany, 2013. [Google Scholar]
- Gross, M., Pfister, H., Eds.; Point-Based Graphics; Morgan Kaufmann Publishers Inc.: San Francisco, CA, USA, 2007.
- International Organization for Standardization (ISO), Ed.; ISO 19119, Geographic Information— Services; International Organization for Standardization: Geneva, Switzerland, 2005.
- Gröger, G., Kolbe, T.H., Nagel, C., Häfele, K., Eds.; OGC City Geography Markup Language (CityGML) Encoding Standard, Version 2.0.0; Open Geospatial Consortium: Wayland, MA, USA, 2012.
- Müller, M., Ed.; Symbology Encoding Implementation Specification, v1.1.0; Open Geospatial Consortium: Wayland, MA, USA, 2006.
- International Organization for Standardization (ISO), Ed.; ISO 19115, Geographic Information— Metadata; International Organization for Standardization: Geneva, Switzerland, 2003.
- Portele, C., Ed.; OpenGIS Geography Markup Language (GML) Encoding Standard, Version 3.2.1; Open Geospatial Consortium: Wayland, MA, USA, 2007.
- International Organization for Standardization (ISO), Ed.; ISO/IEC 13249-3:2011 Information Technology—Database Languages—SQL Multimedia and Application Packages—Part 3: Spatial; International Organization for Standardization: Geneva, Switzerland, 2011.
- International Organization for Standardization (ISO), Ed.; ISO 16739:2013 Industry Foundation Classes (IFC) for Data Sharing in the Construction and Facility Management Industries; International Organization for Standardization: Geneva, Switzerland, 2013.
- Baumann, P., Ed.; Web Coverage Processing Service (WCPS) Language Interface Standard, v1.0.0; Open Geospatial Consortium: Wayland, MA, USA, 2009.
- International Organization for Standardization (ISO), Ed.; ISO 19123:2005, Geographic Information—Schema for Coverage Geometry and Functions; International Organization for Standardization: Geneva, Switzerland, 2005.
- International Organization for Standardization (ISO), Ed.; ISO/PAS 17506:2012, Industrial Automation Systems and Integration—COLLADA Digital Asset Schema Specification for 3D Visualization of Industrial Data; International Organization for Standardization: Geneva, Switzerland, 2012.
- Wilson, T., Ed.; OGC KML, Version 2.2.0; Open Geospatial Consortium: Wayland, MA, USA, 2008.
- Microsoft Corporation. DirectDraw Surface (DDS) File Format, 2014. Available online: http://msdn.microsoft.com/en-us/library/windows/desktop/bb943990 accessed on 13 October 2014.
- Kainz, F.; Bogart, R.; Hess, D. The OpenEXR File Format. In GPU Gems; Fernando, R., Ed.; Addison-Wesley: Upper Saddle River, NJ, USA, 2004. [Google Scholar]
- The Open Group, Ed.; SOA Governance Framework; The Open Group: Reading, UK, 2009; p. 90.
- The Open Group, Ed.; The Open Group Service Integration Maturity Model v2; The Open Group: Reading, UK, 2011; p. 81.
- Nebert, D., Whiteside, A., Vretanos, P.P., Eds.; OpenGIS Catalogue Services Specification, Version 2.0.2; Open Geospatial Consortium: Wayland, MA, USA, 2007.
- Maso, J., Pomakis, K., Julia, N., Eds.; OpenGIS Web Map Tile Service Implementation Standard, Version 1.0.0; Open Geospatial Consortium: Wayland, MA, USA, 2010.
- Callow, M., Kolling, G., Strom, J., Eds.; KTX File Format Specification; The Khronos Group Inc.: Beaverton, Oregon, USA, 2013.
- Fenney, S. Texture Compression Using Low-frequency Signal Modulation, Proceedings of the ACM SIGGRAPH Conference on Graphics Hardware, San Diego, CA, USA, 26–27 July 2003; Eurographics Association: Aire-la-Ville, Switzerland, 2003; pp. 84–91.
- Kyle, M., Burggraf, D., Forde, S., Lake, R., Eds.; GML in JPEG 2000 for Geographic Imagery (GMLJP2) Encoding Specification, Version 1.0.0; Open Geospatial Consortium: Wayland, MA, USA, 2006.
- The Federal Geographic Data Committee (FGDC), 2014. Available online: http://www.fgdc.gov/ accessed on 13 October 2014.
- Schilling, A., Kolbe, T.H., Eds.; Draft for Candidate OpenGIS Web 3D Service Interface Standard, Version 0.4.0; Open Geospatial Consortium: Wayland, MA, USA, 2010.
- Schut, P., Ed.; OpenGIS Web Processing Service, Version 1.0.0; Open Geospatial Consortium: Wayland, MA, USA, 2007.
- Vretanos, P.A., Ed.; OpenGIS Web Feature Service 2.0 Interface Standard; Open Geospatial Consortium: Wayland, MA, USA, 2010.
- Baumann, P. OGC WCS 2.0 Interface Standard—Core; Open Geospatial Consortium: Wayland, MA, USA, 2010. [Google Scholar]
- De la Beaujardiere, J., Ed.; OpenGIS Web Map Server Implementation Specification, Version 1.3.0; Open Geospatial Consortium: Wayland, MA, USA, 2006.
- Mittring, M. Advanced Virtual Texture Topics. Advances in Real-Time Rendering in 3D Graphics and Games Course, Proceedings of the SIGGRAPH 2008, Los Angeles, CA, USA, 11–15 August 2008; Tatarchuk, N., Ed.; ACM: New York, NY, USA, 2008; pp. 23–51.
- Open Geospatial Consortium. OGC Standard Implementations, All Registered Products, 2014. Available online: http://www.opengeospatial.org/resource/products accessed on 13 October 2014.
- Autodesk Inc. Autodesk LandXplorer Server 2011, 2010. Available online: http://download.autodesk.com/us/landxplorer/docs/LDX11_Server/ accessed on 13 October 2014.
- Beh, B.; Fredericque, B.; Loubier, N. Leveraging Panorama Image-based 3D Portrayal Technology for Web-based 3D GIS Implementation, Proceedings of South East Asian Survey Congress, Kuala Lumpur, Malaysia, 22–24 June 2011; Royal Institution of Surveyors Malaysia: Petaling Jaya, Malaysia, 2011.
- Hildebrandt, D.; Holschke, O.; Offermann, P.; Steffens, U. Entwurf serviceorientierter Architekturen. In Handbuch der Software-Architektur, 2nd ed.; Reussner, R., Hasselbring, W., Eds.; dpunkt Verlag: Heidelberg, Germany, 2008; pp. 123–149. [Google Scholar]


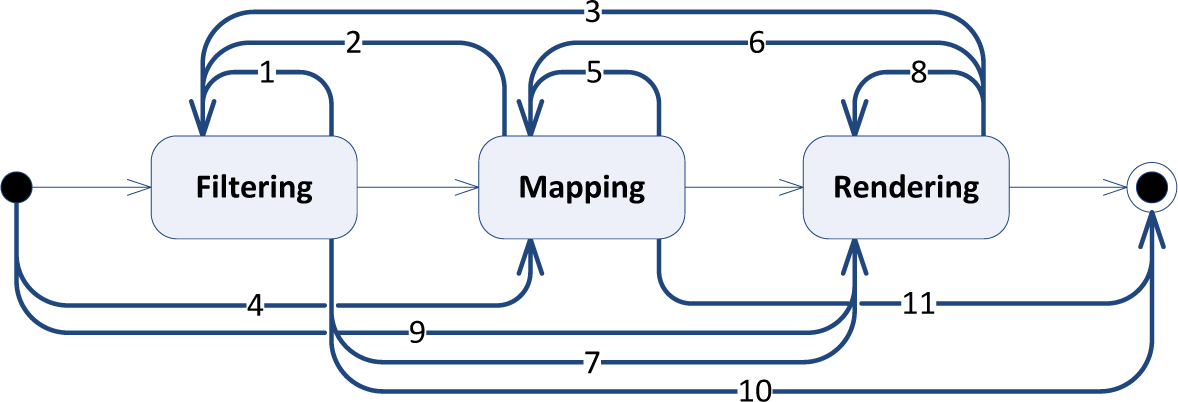
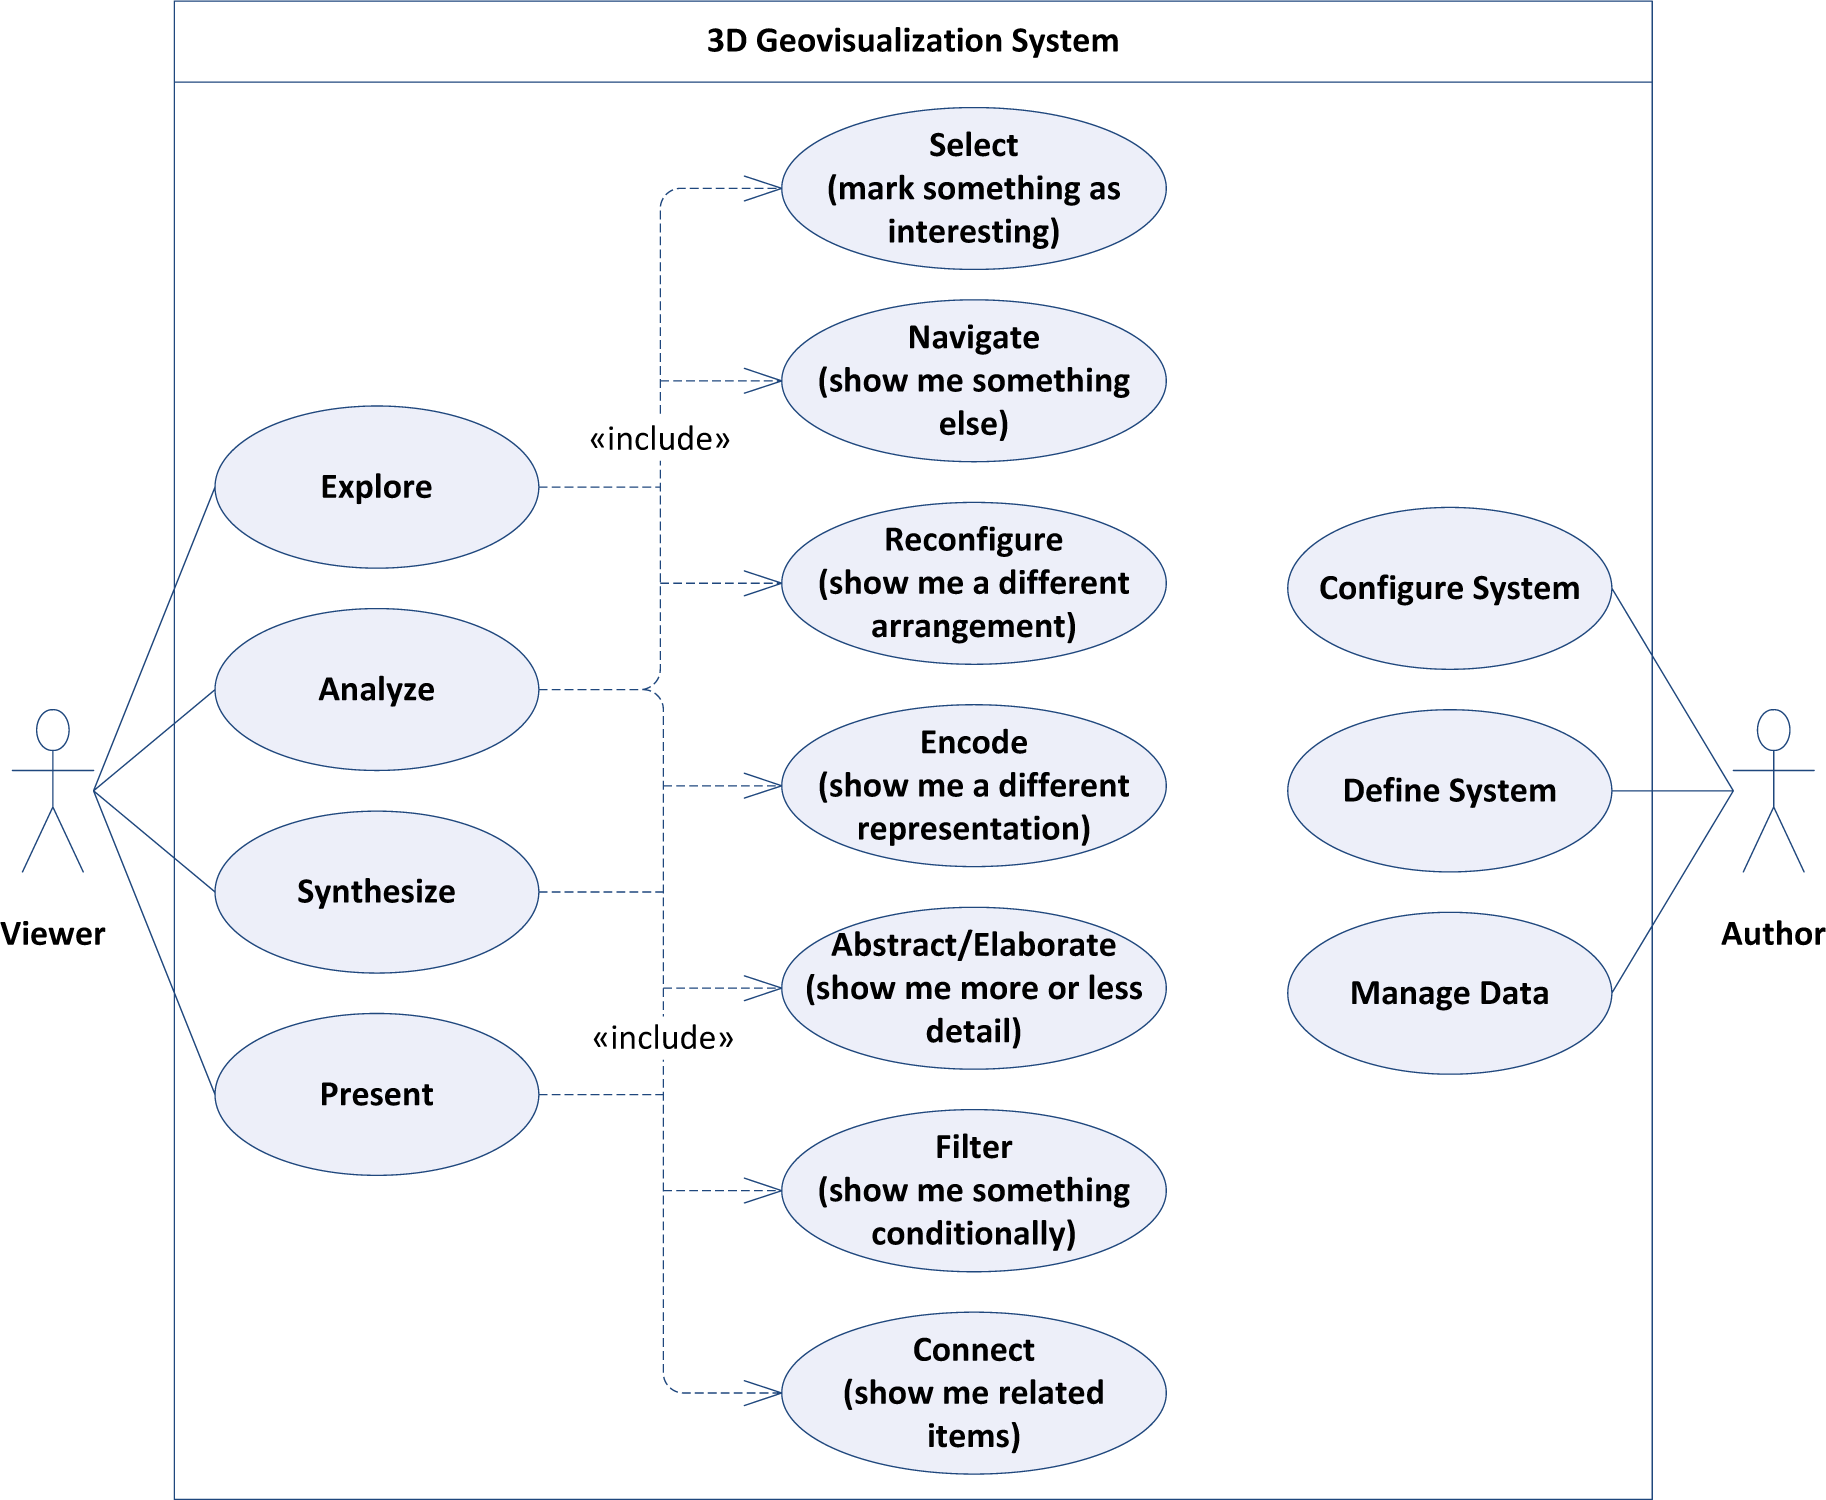
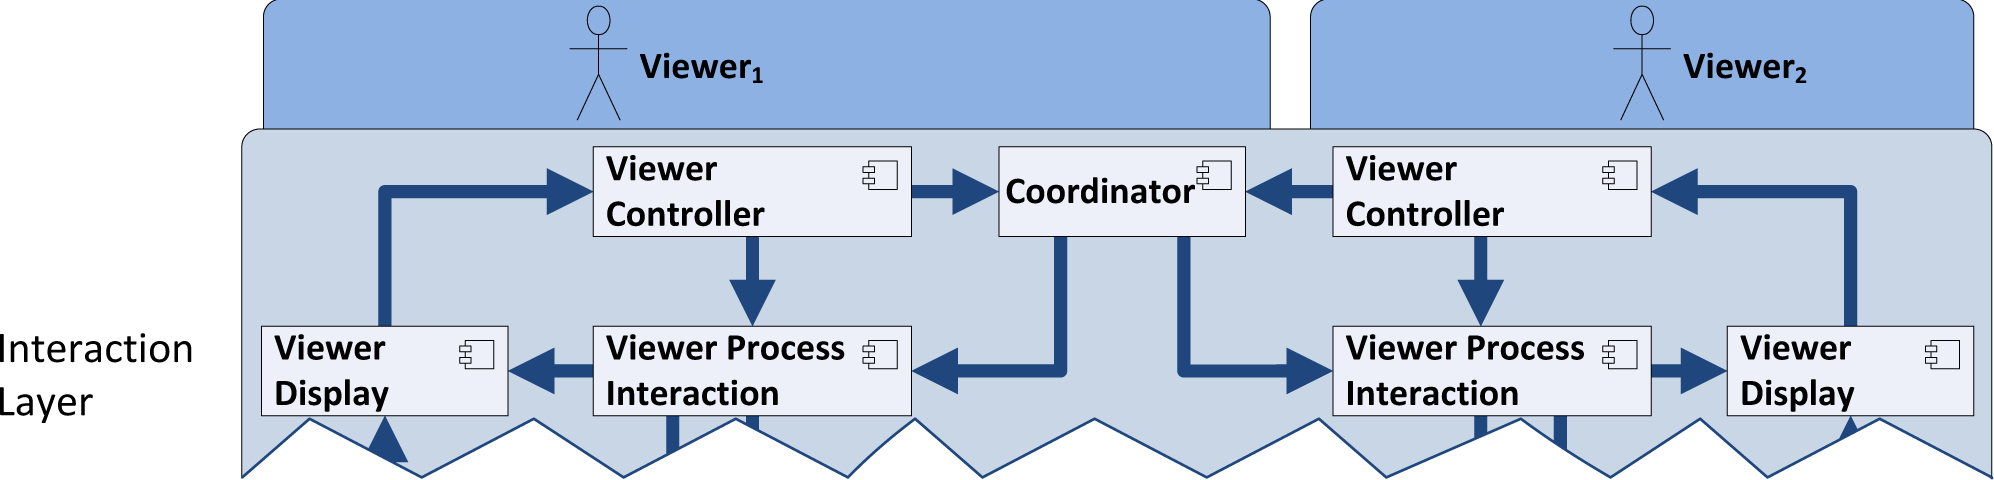
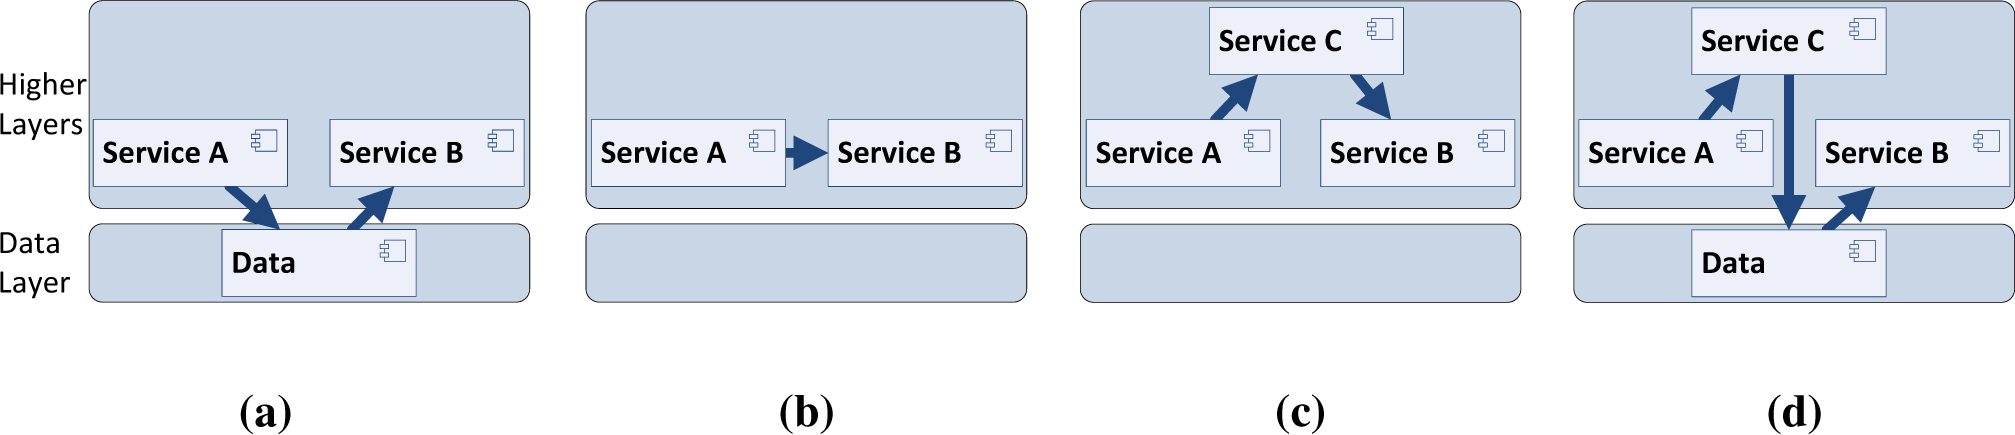
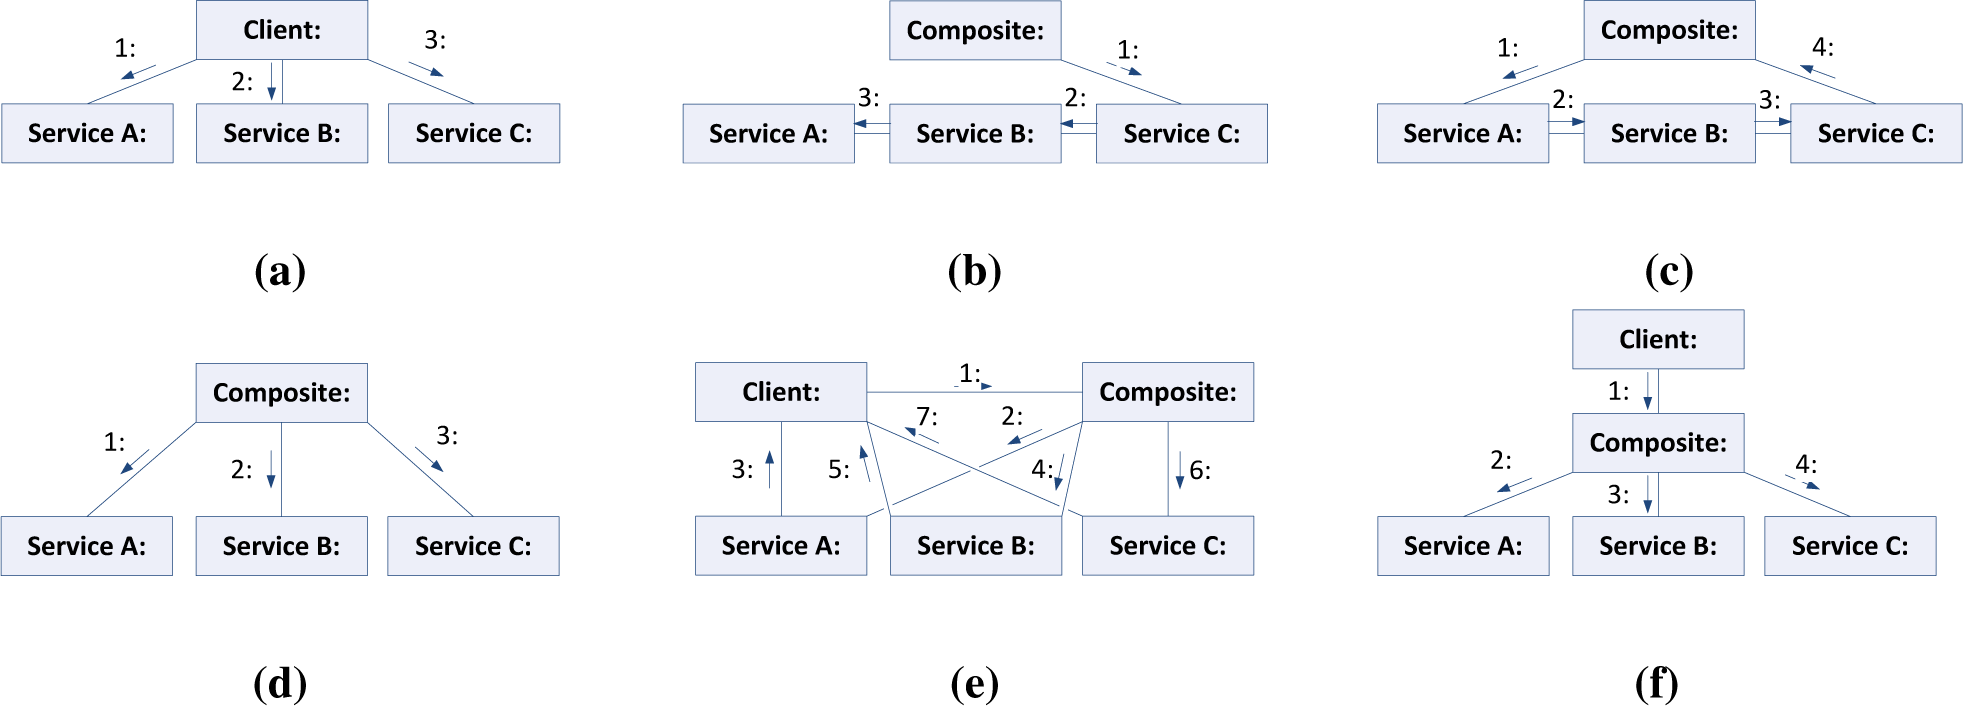
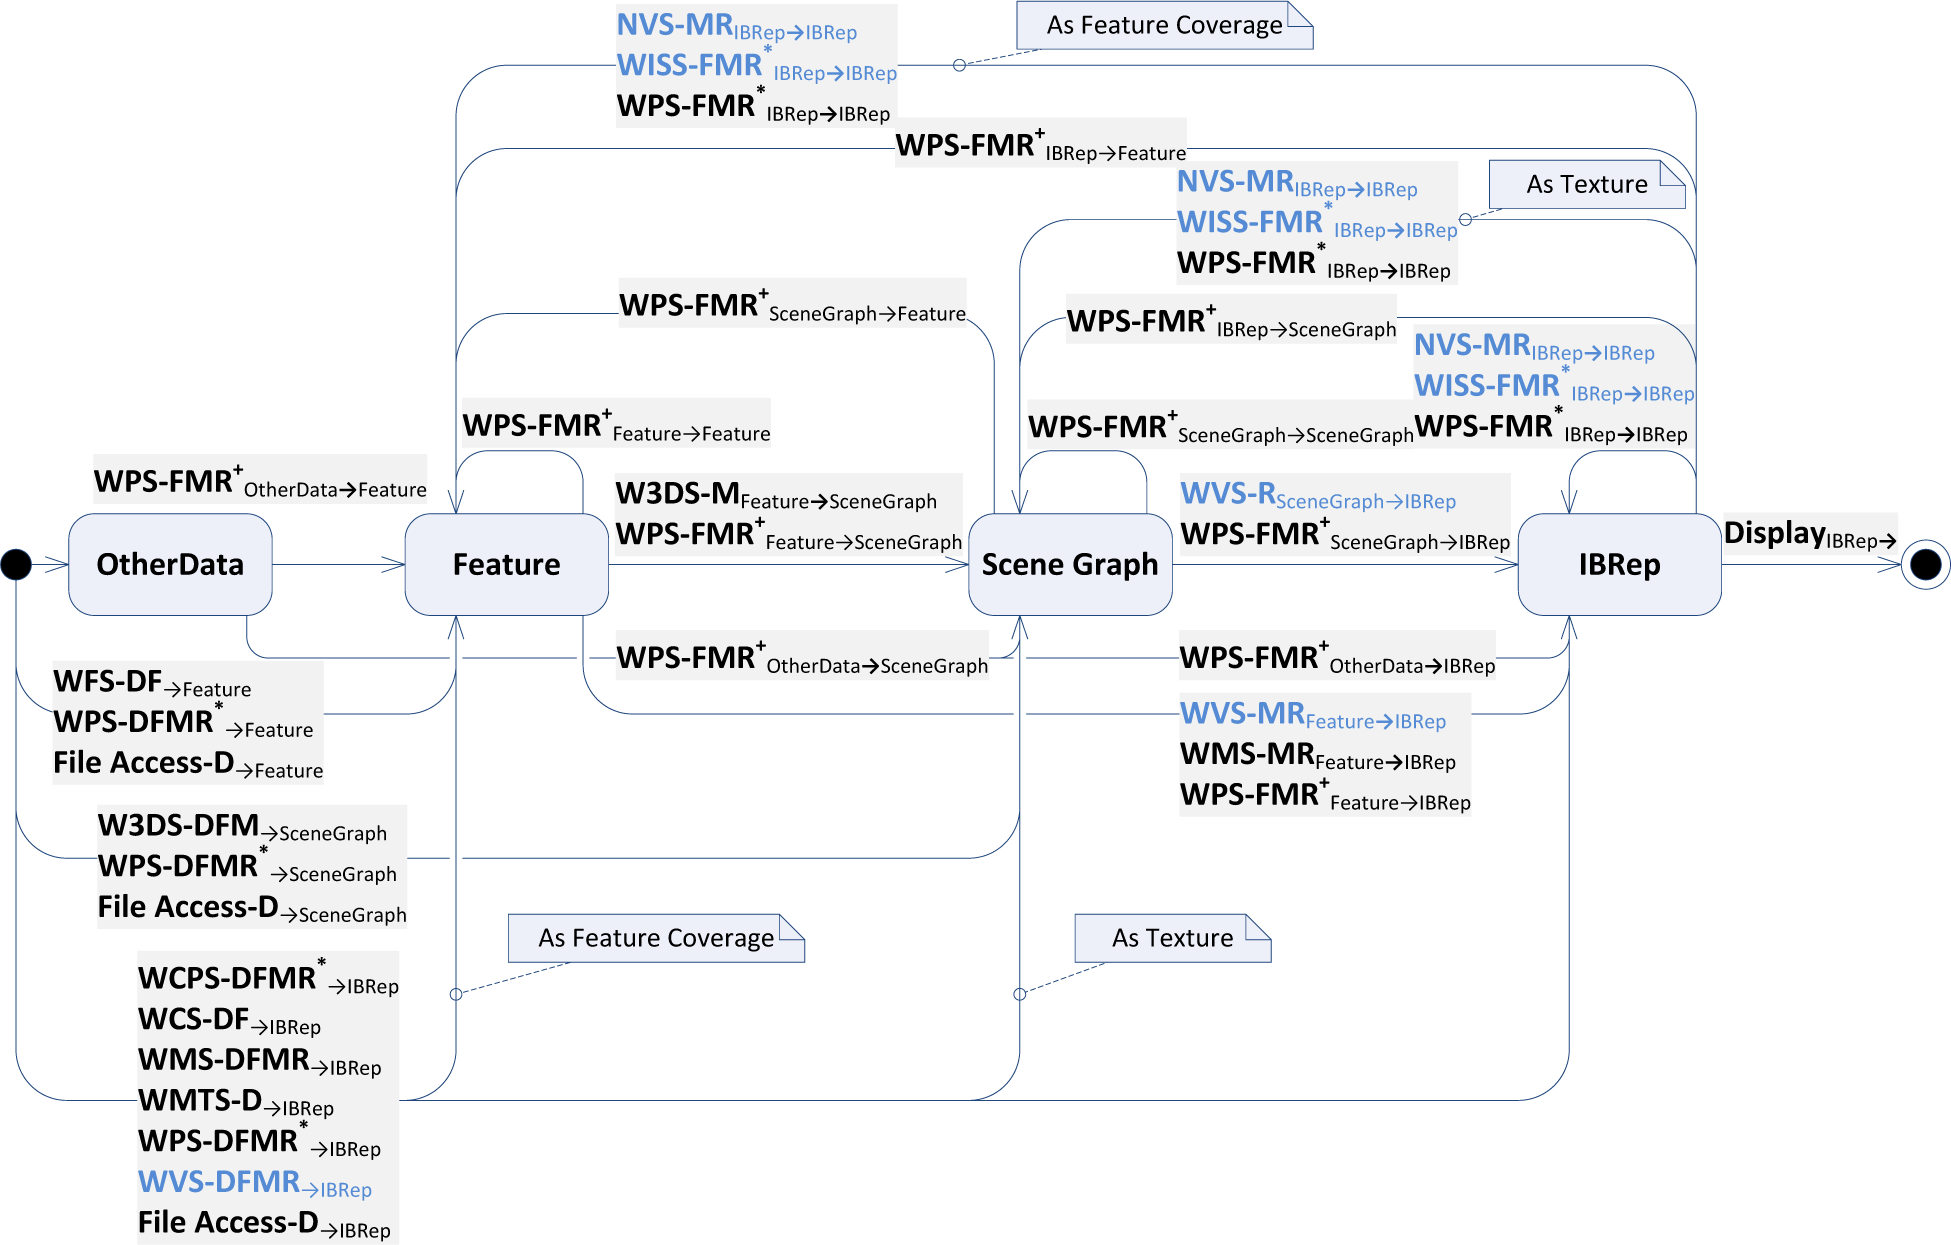
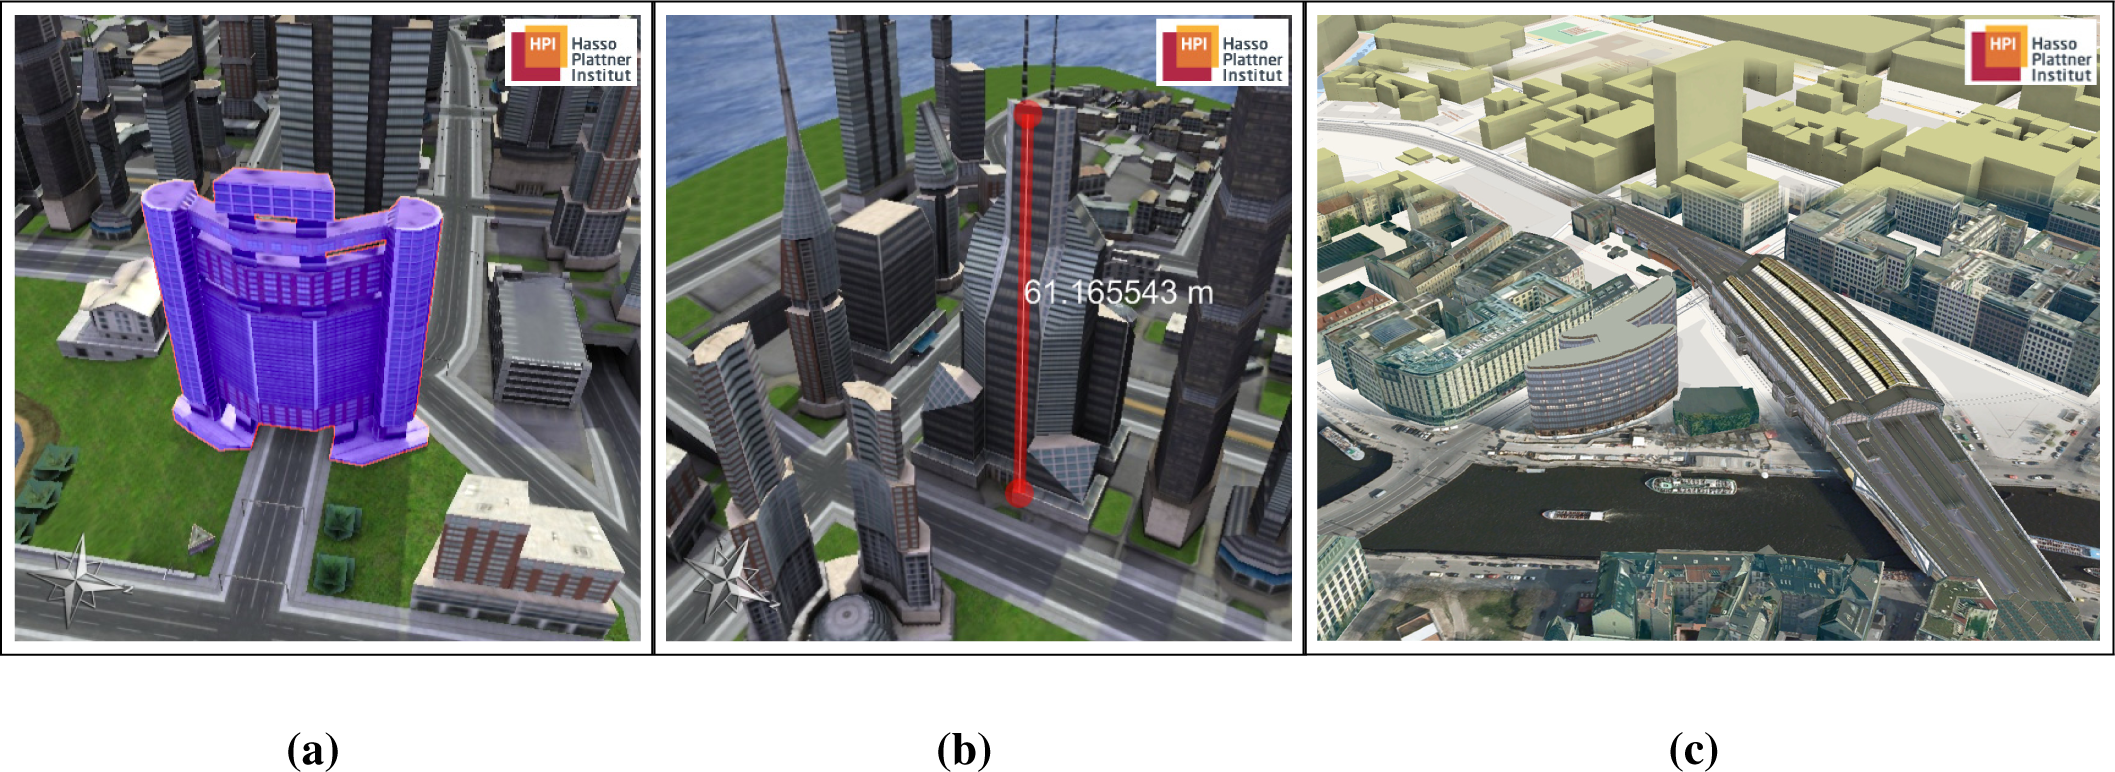
| # | Stage Sequence | Characterization of Second Stage | Application Example | |
|---|---|---|---|---|
| 1 | Filtering | Filtering | Filter enhanced data to enhanced data | Compose complex filtering from modular operators [89] |
| 2 | Mapping | Filtering | Filter geometries and visual attributes to enhanced data | Remove features (e.g., for contribution culling) [5] |
| 3 | Rendering | Filtering | Filter images to enhanced data | Image subsetting, feature extraction, histogram, etc. [6] |
| 4 | Data source | Mapping | Map source data to geometries and visual attributes | Map input text to textual annotations [90] |
| 5 | Mapping | Mapping | Map geometries and visual attributes to geometries and visual attributes | Compute level of details (LODs) or level of abstractions (LOAs) [5,91] |
| 6 | Rendering | Mapping | Map images to geometries and visual attributes | Image post-processing [5] |
| 7 | Filtering | Rendering | Generate images from enhanced data | Render color-attributed point cloud (e.g., from 3D scanners) [92] |
| 8 | Rendering | Rendering | Generate images from images | Image-based rendering [83] |
| 9 | Data source | Rendering | Generate images from source data | Directly render small color-attributed point cloud [92] |
| 10 | Filtering | Data sink | Output enhanced data represented as image | Output image filtered by image processing (e.g., subsetting) [6] |
| 11 | Mapping | Data sink | Output geometries and visual attributes represented as image | Output image mapped by image processing (e.g., magnification) [6] |
| Category | Standard |
|---|---|
| Concept and Architecture | OASIS SOA-RA[18], OASIS SOA-RM[17], OpenGroup SOA-RA [72], OpenGroup SOA Ontology [74], OpenGroup SOA Governance [106 ], OpenGroup SOA Maturity [107], OGC ORM [4,19] |
| ISO 19101:2002 Geographic information—Reference Model | |
| ISO/TS 19103:2005 Geographic information—Conceptual Schema Language | |
| ISO/TS 19104:2008 Geographic information—Terminology | |
| ISO 19105:2000 Geographic information—Conformance and testing | |
| ISO 19106:2004 Geographic information—Profiles | |
| Service | (see Table 4) |
| Data | (see Table 3) |
| DCP and Middleware | HTTP, Web Services (WS-*), REST, SOAP, JEE, .NET, COM, CORBA, SQL |
| Network | TCP/IP, HTTP, TLS, FTP, MIME, IIOP |
| Category | Standard |
|---|---|
| 3D Model Representation | |
| Feature | GML [97], CityGML [94], WKT/WKB [98], IFC [99], Coverage (see IRep) |
| Scene Graph | X3D [59], COLLADA [102], KML [103] |
| IRep General Image | JPEG, PNG, JPEG2000, JPEG XR, TIFF |
| GPU Image | S3TC/DDS [104], ETC/KTX [64,110], PVRTC [111], OpenEXR [105], X3D [59] |
| Geo-Image | GeoTIFF, GML for JPEG2000 [112] |
| Geo-View | Image-based view (IView) [7] |
| Stage Specification | |
| Filter Encoding | Filter Encoding [89] |
| Feature-based Styling | SLD/SE [58,95], SLD3D/SE3D [23,60,62] |
| Rendering | (parameters reused from various standards) |
| Image-based Styling | ISLD/ISE/ISA [7], WCPS Language [100] |
| Metadata | |
| Data | ISO 19115:2003 Geographic information—Metadata |
| ISO/TS 19115-2:2008 Geographic information—Metadata—Part 2: Imagery | |
| ISO/TS 19139:2007 Geographic information—Metadata—XML schema impl. | |
| ISO 19110:2005 Geographic information—Methodology for feature cataloging | |
| ISO 15836:2003 Dublin core | |
| FGDC content standards [113] | |
| Services | ISO 19119:2005 Geographic information—Services, WSDL |
| Category | Standard |
|---|---|
| Architecture Layer | |
| Interaction Layer | WPS [115], WISS [7], NVS [8] |
| Process Layer | WPS [115] |
| Functionality Layer | WISS [7], WPS [115], WFS [116], WCS [117], WCPS [100], WMS [118], W3DS [114], WVS [47,48] |
| Data Layer | CSW [108], WMTS [109], HTTP/FTP File access, WPS [115], WFS [116], WCS [117], WCPS [100], WMS [118], W3DS [114 ], WVS [47,48] |
| Service Instance Type | Stage
| Input
| Output
| |||||
|---|---|---|---|---|---|---|---|---|
| D | F | M | R | +/* | 3D Model | Stage Specification | 3D Model | |
| DisplayIRep→ | IRep | unspecified | – | |||||
| File Access-D→IRep | ✓ | — | — | IRep | ||||
| File Access-D→SceneGraph | ✓ | — | — | Scene Graph | ||||
| File Access-D→Feature | ✓ | — | — | Feature | ||||
| NVS-MRIRep→IRep | ✓ | ✓ | IRep | Render Spec. | IRep | |||
| W3DS-DFM→SceneGraph | ✓ | ✓ | ✓ | — | SLD3D/SE3D | Scene Graph | ||
| W3DS-MFeature→SceneGraph | ✓ | Feature | SLD3D/SE3D | Scene Graph | ||||
| WCPS-DFMR*→IRep | ✓ | (✓) | (✓) | (✓) | * | — | WCPS Language | IRep |
| WCS-DF→IRep | ✓ | — | — | IRep | ||||
| WFS-DF→Feature | ✓ | ✓ | — | Filter Encoding | Feature | |||
| WISS-FMR*IRep→IRep | (✓) | (✓) | (✓) | * | IRep | ISLD/ISE/ISA | IRep | |
| WMS-DFMR→IRep | ✓ | ✓ | ✓ | ✓ | — | SLD/SE | IRep | |
| WMS-MRFeature→IRep | ✓ | ✓ | Feature | SLD/SE | IRep | |||
| WMTS-D→IRep | ✓ | — | — | IRep | ||||
| WPS-DFMR*→IRep | ✓ | (✓) | (✓) | (✓) | * | — | unspecified | IRep |
| WPS-DFMR*→SceneGraph | ✓ | (✓) | (✓) | (✓) | * | — | unspecified | Scene Graph |
| WPS-DFMR*→Feature | ✓ | (✓) | (✓) | (✓) | * | — | unspecified | Feature |
| WPS-FMR+ | (✓) | (✓) | (✓) | + | OtherData | unspecified | Feature | |
| OtherData|Feature|SceneGraph|IRep | |Feature | |SceneGraph | ||||||
| →Feature|SceneGraph|IRep | |SceneGraph|IRep | |IRep | ||||||
| WVS-DFMR→IRep | ✓ | ✓ | ✓ | ✓ | — | SLD3D/SE3D, Render Spec. | IRep | |
| WVS-MRFeature→IRep | ✓ | ✓ | Feature | SLD3D/SE3D, Render Spec. | IRep | |||
| WVS-RSceneGraph→IRep | ✓ | Scene Graph | Render Spec. | IRep | ||||
| Aspect | Rating | Comment |
|---|---|---|
| Economic Perspective | ||
| Cost | ||
| Introduction | ||
| Acquisition | + | Inexpensive SRA acquisition is possible through acquiring this publication without additional licensing costs. Small estimated user base limits economy of scale effects. |
| Training | + | The SRA is moderately complex and uses standard, common and state-of-the-art modeling techniques and domain concepts. |
| Adaption | o | The SRA is generic and partial (Section 1) and, thus, requires extensions, refinements and adaptions. Use of standards eases adaptions. |
| Redesign | o | Depending on status quo, separating and distributing functionality and data according to the SRA can require substantial strategic and organizational adaptions. |
| Integration | + | Use of standards, common and state-of-the-art modeling techniques and domain concepts and SOA eases integration. |
| Transformation & Analysis | ||
| Suitability | o | Modeling concepts support domain-level analysis and semi-automatic transformation into implementation level artifacts. The SRA requires specifying implementation details beyond designing visualization pipelines, though. |
| Tools | o | Tools exist for specific transformation and analysis tasks. |
| Maintenance | ||
| Conceptual Support | + | Use of standard modeling techniques, standard concepts and SOA ease model maintenance. |
| Tools | + | Tools exist for model maintenance. |
| Benefits | ||
| Efficiency | ||
| Software Development & Maintenance | + | The SRA can improve software process effectiveness and efficiency by offering an integrated combination and bundling of proven, high-level, standard concepts with appropriate separation of concerns. |
| Business Management | o | SOA and the high level of abstraction can improve process design and analysis efficiency although models expose implementation details beyond visualization pipeline design. SOA and distribution can limit process execution efficiency [10]. |
| Flexibility | ||
| IT Vendor Dependence | + | The SRA does not depend on specific vendors, however, enjoys in part considerable industry and standardization commitment (Sections 4.5 and 5). |
| Openness | + | The SRA applies, combines and is compatible with a range of relevant standards (Section 4.5). |
| Expressive Power | + | The SRA can express generalized visualization pipelines that exceed the expressiveness of traditional visualization pipelines (Section 3). |
| Communication | ||
| Coordination & Knowledge Mgmt. | + | Use and bundling of standard, common and state-of-the-art modeling techniques and domain concepts and SOA can improve communication, coordination and knowledge management. |
| Protection of Investment | ||
| Spreading & Commitment | o | Currently, the SRA and some of its core concepts are used or supported by only a limited number of organizations, vendors and service providers and are not yet standardized (e.g., WVS, WISS) (Sections 4.5 and 5). |
| Technological Change | + | The SRA is largely technology independent and allows using a wide range of technologies in particular for DCP, infrastructure and implementing services (Section 4.5). |
| Understandability | + | The SRA is understandable due to appropriate documentation, including examples and scenarios using a view-based structure and proven, standard modeling techniques and concepts. |
| Appropriateness | + | The SRA serves its purpose to enable designing, describing and analyzing 3DGeoVSs based on SSI. However, it requires specifying implementation details beyond visualization pipeline design. |
| Engineering Perspective | ||
| Definition | + | Intended application domains and purposes of the SRA are stated (Section 4.1). |
| Explanation | + | Addressed requirements, solutions and design decisions are stated. |
| Language Features | + | The SRA is described using multiple views based on standard modeling languages and approaches, e.g., using UML and RM-ODP. |
| Epistemological Perspective | ||
| Evaluation of Theories | + | The SRA is applied effectively to real systems (correspondence between theory and truth, Section 5), builds on and does not contradict related work (coherence, Section 2) and is acknowledged by experts through peer-reviewed publications (consensus, this publication and [7–10,48]). |
| General Principles | + | The SRA is an abstract solution to a class of problems, demonstrates originality by providing the first known solution for its stated problems as confirmed by peer-reviewed publications (this publication and [7–10,48]) and justifies its hypothesis and design decisions. |
| Scientific Progress | + | The SRA contributes to the body of knowledge (Section 2 this publication and [7–10,48]). |
© 2014 by the authors; licensee MDPI, Basel, Switzerland This article is an open access article distributed under the terms and conditions of the Creative Commons Attribution license (http://creativecommons.org/licenses/by/4.0/).
Share and Cite
Hildebrandt, D. A Software Reference Architecture for Service-Oriented 3D Geovisualization Systems. ISPRS Int. J. Geo-Inf. 2014, 3, 1445-1490. https://0-doi-org.brum.beds.ac.uk/10.3390/ijgi3041445
Hildebrandt D. A Software Reference Architecture for Service-Oriented 3D Geovisualization Systems. ISPRS International Journal of Geo-Information. 2014; 3(4):1445-1490. https://0-doi-org.brum.beds.ac.uk/10.3390/ijgi3041445
Chicago/Turabian StyleHildebrandt, Dieter. 2014. "A Software Reference Architecture for Service-Oriented 3D Geovisualization Systems" ISPRS International Journal of Geo-Information 3, no. 4: 1445-1490. https://0-doi-org.brum.beds.ac.uk/10.3390/ijgi3041445