Review

Volunteered Geographic Information in Natural Hazard Analysis: A Systematic Literature Review of Current Approaches with a Focus on Preparedness and Mitigation

by
Carolin Klonner
1,2,*,
Sabrina Marx
1,2,
Tomás Usón
1,2,
João Porto de Albuquerque
1,3 and
Bernhard Höfle
1
1
Department of Geography, Heidelberg University, 69120 Heidelberg, Germany
2
Heidelberg Academy of Sciences and Humanities, 69120 Heidelberg, Germany
3
Centre for Interdisciplinary Methodologies, University of Warwick, Coventry CV4 7AL, UK
*
Author to whom correspondence should be addressed.
ISPRS Int. J. Geo-Inf. 2016, 5(7), 103; https://0-doi-org.brum.beds.ac.uk/10.3390/ijgi5070103
Submission received: 2 April 2016 / Revised: 2 June 2016 / Accepted: 15 June 2016 / Published: 25 June 2016
(This article belongs to the Special Issue Volunteered Geographic Information)

Abstract

:
With the rise of new technologies, citizens can contribute to scientific research via Web 2.0 applications for collecting and distributing geospatial data. Integrating local knowledge, personal experience and up-to-date geoinformation indicates a promising approach for the theoretical framework and the methods of natural hazard analysis. Our systematic literature review aims at identifying current research and directions for future research in terms of Volunteered Geographic Information (VGI) within natural hazard analysis. Focusing on both the preparedness and mitigation phase results in eleven articles from two literature databases. A qualitative analysis for in-depth information extraction reveals auspicious approaches regarding community engagement and data fusion, but also important research gaps. Mainly based in Europe and North America, the analysed studies deal primarily with floods and forest fires, applying geodata collected by trained citizens who are improving their knowledge and making their own interpretations. Yet, there is still a lack of common scientific terms and concepts. Future research can use these findings for the adaptation of scientific models of natural hazard analysis in order to enable the fusion of data from technical sensors and VGI. The development of such general methods shall contribute to establishing the user integration into various contexts, such as natural hazard analysis.

1. Introduction

Natural phenomena, like volcanic eruptions, earthquakes, hurricanes or floods, can be considered a common part of nature. However, as soon as people and their belongings are affected, these events are declared natural hazards [1]. Natural hazards threaten people and infrastructure all over the world. The number of incidents related to natural hazards has been increasing tremendously in the past few decades, which has resulted in more and more affected people and settlements [2]. This development is partly caused by changing climate conditions, by the impact of human beings in nature, as well as by a higher number of people living in risk areas due to a rapidly-growing world population [3].
Hazards are clearly identifiable and distinctive phenomena, which affect people and the environment to a high degree and lead to massive damage. However, not every dramatic natural event, which might influence the ecosystem, leads to economic, or infrastructural damage, or harms people. Without these effects, there is no catastrophe from the anthropocentric point of view. Hence, extreme natural events turn into hazard events due to their impact on society [4]. Moreover, hazards can be regarded as a threat to society, or the environment [5], or as the probability of the occurrence of a potentially damaging event [6].
The notion of hazard is highly related to the concept of risk, which is comprised of hazard and vulnerability, i.e., the risk depends on the hazard intensity and on the level of vulnerability [6,7]. Hazards may have different impacts on individuals, groups of society or certain areas, e.g., urban regions. The vulnerability determines the intensity level of the impact. Ebert et al. [6] further divide vulnerability into exposure and coping capacity. Exposure refers to the elements at risk in areas where hazard events may occur, such as humans, buildings or infrastructure [6,7]. Furthermore, these elements are able to cope in different ways with the impact of a hazard, and thus, the vulnerability is influenced [6,8]. The consequence of a hazard event, such as damage or injury, is defined as a disaster [5].
In order to cope with the negative effects and to prevent a catastrophe, reactive measures can be applied. Thus, disaster management can be regarded as a process with different phases for which up-to-date and accurate geospatial data are required. The cycle of disaster management can be divided into four phases: mitigation, preparedness, response and recovery [9]. Geographic Information Systems (GIS) play a crucial role in hazard analysis because the elements at risk (for example buildings, infrastructure or population) can be viewed as spatial information layers. Furthermore, the combination of different layers via spatial modelling results in predictions about risk, vulnerability and hazard [5], which can be efficiently displayed in maps.
With respect to the use of geodata in crisis management, the mitigation phase summarizes the identification of risks in a certain area, which allows the development and implementation of adequate risk reduction measures. Furthermore, the collection of data about vulnerabilities and hazards is included in this phase. The risk prediction is also relevant for the preparedness phase and is represented by the development of maps focusing on, for example, hazard areas, warning network coverage and special parts of infrastructure, such as schools, hospitals or police stations. Different operational plans are designed for various scales (e.g., local or global) and for different hazards [10]. In order to achieve a compromise between, e.g., city development in hazard-prone areas and the protection of citizens, maps are required, which are used as a base for negotiations between different actors [10].
The analysis of natural hazards is vital for developing new strategies to cope with future incidents. The applicability of the results depends strongly on the geographic input data, e.g., their availability and their quality, as well as their temporal and spatial scale of acquisition. Recent developments of Web 2.0 and mobile computing devices with a Global Navigation Satellite System (GNSS), such as smartphones or tablets, have led to a new kind of geographic dataset: Volunteered Geographic Information (VGI) [11]. The collaborative map project OpenStreetMap (OSM) [12] or social media analysis (e.g., the analysis of geotagged messages from Twitter, Facebook or Flickr), as well as smartphone apps for the collection of geodata are examples of VGI. Very often, web platforms are used as bases for geodata exchange and visualization [10]. These datasets have already proven to be valuable for further analysis, as they provide a variety of geometries, attributes and semantic information [13,14]. De Longueville et al. [15], for example, use spatiotemporal clusters of messages (tweets) for wildfire detection. Such information is essential for disaster management and a combination with geodata from other sources leads even to an increased value [16]. De Albuquerque et al. combine georeferenced social media data and authoritative data, i.e., georeferenced features [17]. They use a statistical analysis to reveal spatial patterns of flood-related tweets during the River Elbe Flood in Germany in 2013 and conclude that messages closer to highly affected areas are more likely to be related to floods [17]. Such results emphasize the potential of VGI data and social media analysis for disaster management.
Compared to traditional data acquisition by authorities or companies, VGI can also be captured by laypeople. In this way, additional local knowledge and qualitative properties about the area can be collected for further use in natural hazard analyses [18].
VGI can be divided into different types of sources. New technologies, for instance devices with GNSS, enable the general public to capture geospatial data (e.g., coordinates) directly. Furthermore, aerial images, such as Bing maps, can be used under the Bing license for remote mapping purposes, like digitising features (e.g., buildings or streets), which can be uploaded and compiled into composite digital maps [19,20]. Thus, the imagery can only be used for digitising in OSM without a commercial aim [20]. Accordingly, volunteers can add, edit, share and apply geographic information through these platforms. Craglia et al. [21] present a VGI typology in order to have a common base for discussions and analyses (Table 1). They divide VGI into explicit and implicit geographic content. As in natural hazard analysis, the geographic location is essential, only the “explicit geographic” category of the VGI typology is used for the analysis section of the literature review at hand. This category is further divided into explicitly- or implicitly-volunteered information.
Haklay [22] uses a typology for citizen science, which is a closely-related concept, in which he distinguishes the explicit geographic VGI at four levels according to the involvement of volunteers in the scientific work (Figure 1). At the first level (crowdsourcing), citizens act as sensors and provide resources, while they have only a minimal cognitive engagement. In contrast, the distributed intelligence at the second level relies on the cognitive ability of the participants. After some training, the participants collect data or engage in minor interpretation activities. At this level, quality evaluation by the scientists is very important. The third level represents participatory science where users take part actively in the problem definition and the data collection. On the last level, extreme citizen science, non-professionals collaborate with professionals, and together, they decide on the scientific problem they want to focus on and the methods for data collection. This allows for both the consideration of scientific protocols, as well as the interests and motivation of the volunteers. On this level, scientists are not only experts, but also have the role of facilitators [22].
The qualitative analysis of this study will use the typology of Haklay [22] in order to determine the level of involvement of the citizens. Crowdsourcing (Level 1) represents in most cases implicitly-volunteered information, while the other three levels of Haklay’s classification are based on explicitly-volunteered information.
There are different ways of classifying natural hazards, such as into climatological, meteorological, hydrological, geophysical and biological hazards [2]. The focus of the following paper is on meteorological, hydrological, as well as geophysical natural hazards based on the WorldRiskReport [23], which grounds itself in the International Disaster Database [2].
So far, most literature reviews have focused on the use of social media within or after a disaster, i.e., the response and relief phase [24]. Papers and research about applications for preparedness and mitigation were of minor interest. In contrast, Horita et al. conducted a Systematic Literature Review (SLR) with a general approach, taking the whole crisis cycle into consideration [25], though they were giving a general overview of the statistics rather than an in-depth analysis of the selected papers. Moreover, GeoWeb technologies and their use in disaster management were reviewed by Roche et al. in order to focus on the new developments, which make geodata exchange and collaborative projects possible [10]. However, due to the focus on web platforms, only a few specific studies are mentioned, and the integration of the collected geodata via these methods into disaster management is not analysed in detail. Additionally, the portrayed platforms are mainly used for the response phase.
In order to contribute additional value to these reviews, this study is based on an SLR, which aims at identifying the usage of VGI in the field of natural hazard analysis focusing explicitly on the preparedness and mitigation phases and on a qualitative in-depth analysis of the identified articles with particular focus on the natural hazard type, the kind of VGI, the level of required engagement of the users, the type of integration of VGI into hazard analysis and the study area of the analysis. Furthermore, the in-depth analysis of the selected papers results in the evaluation of opportunities, which are given by the integration of VGI into hazard analysis. These opportunities are discussed on a conception, as well as a realization level, and challenges are pointed out. Therefore, in addition to other reviews within this research field, general concepts can be discussed apart from the technological aspect and use case applications.
In the following, an overview of current research is given, the potentials and limitations of VGI are revealed and new possible connections between the investigated studies are discussed in order to derive future research directions.

2. Methods

The method of systematic literature review was first developed in the field of medicine. The medical research guidelines have been adapted in order to conduct SLRs in research fields, such as GIS-related research [26,27] or computer science [28]. Here, an SLR is performed to identify current research on VGI within the scope of natural hazard analysis and to qualitatively analyse these studies with regards to the hazard type, data source, level of user contribution, type of integration of VGI and the study area. Therefore, the two basic concepts of hazard analysis and VGI are connected in this SLR. The overall method is composed of a literature search and data screening, as well as information extraction and synthesis, which are further described as follows.

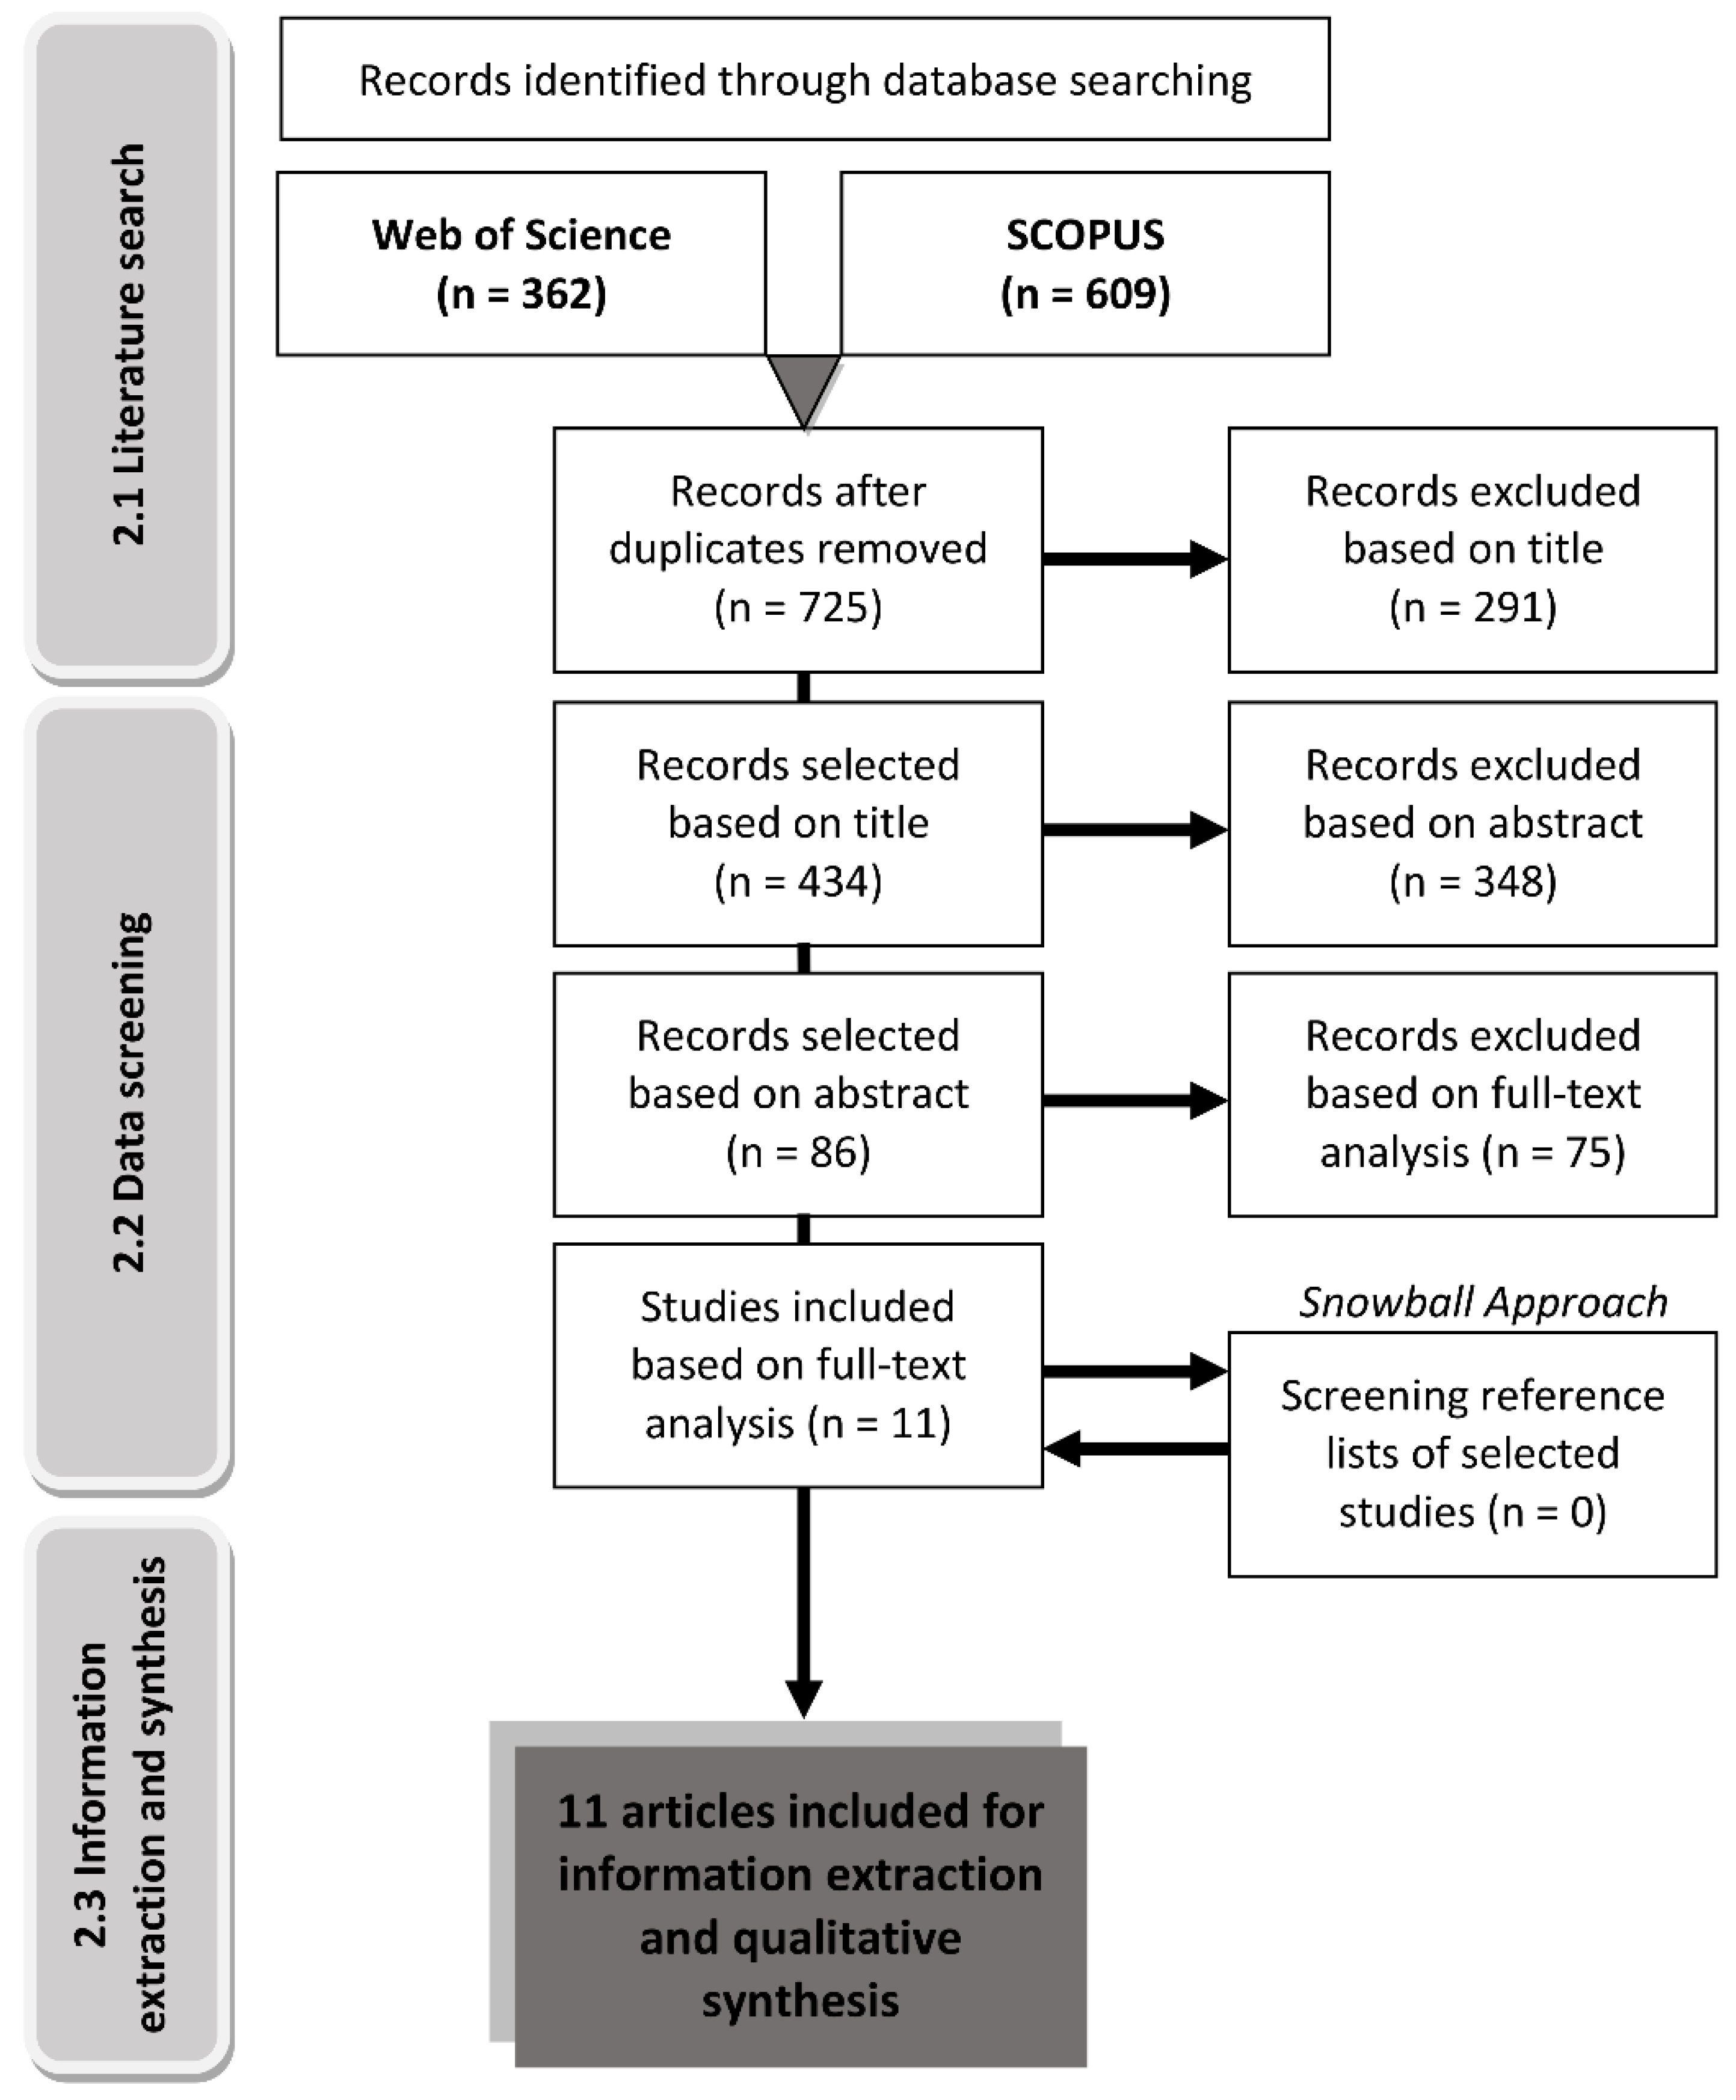
2.1. Literature Search

2.1.1. Databases

The selection of databases is important for further uses [29]. In order to have a large data pool, two different multidisciplinary databases are used: Web of Science [30] and Scopus [31].
The following search criteria are chosen: First of all, the literature search ends with December 2014, and therefore, the search date for references only includes articles published in 2014 or before. Secondly, only peer-reviewed journals are used. Thirdly, the language of the articles has to be English, Spanish or German due to practical reasons.

2.1.2. Query Terms

In order to apply the SLR, query terms (i.e., keywords) have to be selected for both basic concepts: hazard analysis and VGI. A logical AND operator is applied in order to join the two concepts. Furthermore, it is important to include synonyms and different spelling forms of the keywords using a logical OR operator, such as “volunteered geographic information” OR “VGI”. The hazard types are selected according to the analysis provided by the WorldRiskReport [23], which is based on the International Disaster Database [2]. The selection of the query terms for the concept of VGI refers to different studies concerning VGI (e.g., [11]). The asterisk is used to include different grammatical variations of the word, such as “crowdsourc*” for “crowdsourcing” and “crowdsourced”. Table 2 shows the query terms for the search in Web of Science and Scopus.

2.2. Data Screening

After the keyword search within the databases, duplicates from Scopus and the Web of Science were removed. The following data screening was carried out independently by two reviewers in order to keep objectivity. In each step of the data screening process, the included papers are used for the next step. The returned papers need to be evaluated according to specific inclusion and exclusion criteria [32]. While screening the titles, the reviewers excluded all papers where the title indicates that they are neither dealing with natural hazards nor VGI. The papers selected by both reviewers are taken for the abstract screening. During the abstract screening, it is possible to apply finer restrictions, namely that the study within the article has to focus on the preparedness or mitigation phase of the disaster management cycle and that one of the following hazards has to be dealt with: flood, earthquake, volcanic eruption, storm, drought, tsunami, mass movement or fire [33]. The researchers agreed that the response phase is defined as the response to a natural event that does not end in a disaster. Hence, the detection of small earthquakes and floods via VGI is counted as part of the response phase, and the paper is excluded. If several phases are addressed, the paper is included as long as the preparedness or mitigation phase is one of them.
The full-text screening of the remaining included papers permits the extraction of the information needed for applying the aforementioned restrictions [33]. During the abstract screening, as well as the full-paper reading, the decision about including papers on which the reviewers’ opinions differ was reached by mutual agreement.
Moreover, a backward “snowball” [33] method is used after this third step. The references of the final selection of papers from the database search are screened in the same way as described in the section before, and if there are references that also correspond to the inclusion criteria, they are added to the list and used for further analysis.

2.3. Information Extraction and Synthesis

After data screening by the two researchers, the information of the resulting papers is extracted according to different dimensions, which are specified in more detail via categories to apply a synthesis (Table 3) and described in detail in the next sections.

2.3.1. Study Objective

Studies referring to VGI within the preparedness and mitigation phase aim at either providing a platform where information can be exchanged or edited, but also at developing methods for the integration of VGI, e.g., for simulations. Furthermore, the application of VGI within the disaster management process, such as for situation awareness and decision support, is evaluated. Finally, the quality assessment plays a crucial role regarding the use of VGI in the natural hazard context.

2.3.2. Study Area

In order to get an overview of the geographic distribution of research regarding this topic, the country where the study was conducted is extracted from the articles. The term global stands for papers without a specific study area.

2.3.3. Hazard Type

As previously stated, the analysis at hand focuses on eight different types, namely flood, earthquake, volcanic eruption, fire, storm, drought, tsunami and mass movement, in order to keep the number of results for the search manageable and adequate to grasp the main issues. At the same time, this selection addresses the most relevant hazards with respect to frequency, outreach and negative consequences [2,23,34]. Furthermore, the hazard type can be explicitly mentioned or the article addresses several of the mentioned natural hazards.
Additionally, the time factor plays a crucial role for the risk analysis. This timing can be divided into two different aspects. On the one hand, there is the frequency of the event. The risk awareness of people is different if they know that there are floods in their region every year [35] in contrast to the vague schedule of a volcanic eruption or an earthquake, which could take place at any time, but only episodically. On the other hand, there is the temporal issue of the event itself, namely the duration. To name the two extremes at the very ends of the scale from slow-onset to rapid-onset hazards: a drought may develop very slowly and be present over several years [18]; in contrast, an earthquake may have no warning and take only a few seconds. The other six hazards can be placed in between these extremes with a different extent of duration, e.g., mass movements, tsunamis, floods, volcanic eruptions, fires and storms may take some minutes or hours; the last four mentioned hazards may even last up to several days. It is obvious that there are many different sub-categories of these chosen hazards, which cannot be dealt with within the scope of this paper, though, detailed information about the mentioned natural hazards can be found in Ismail-Zadeh [36] and Felgentreff and Glade [1], for example.

2.3.4. Data Source

VGI can be provided and shared via different applications and platforms. New developments such as smartphone apps enable the participation of a broad community, though it has to be kept in mind that the technical equipment or Internet availability can influence the amount of VGI [15]. The data source is closely related to the level of engagement as, for example, adding local information in OpenStreetMap (distributed intelligence) requires less involvement than conducting a specific scientific task via a smartphone app or on a web platform (participatory science) [22]. Therefore, the categories social media (Twitter, Flickr), additional information from the web, collaborative project (OSM), web platform and smartphone application are used.

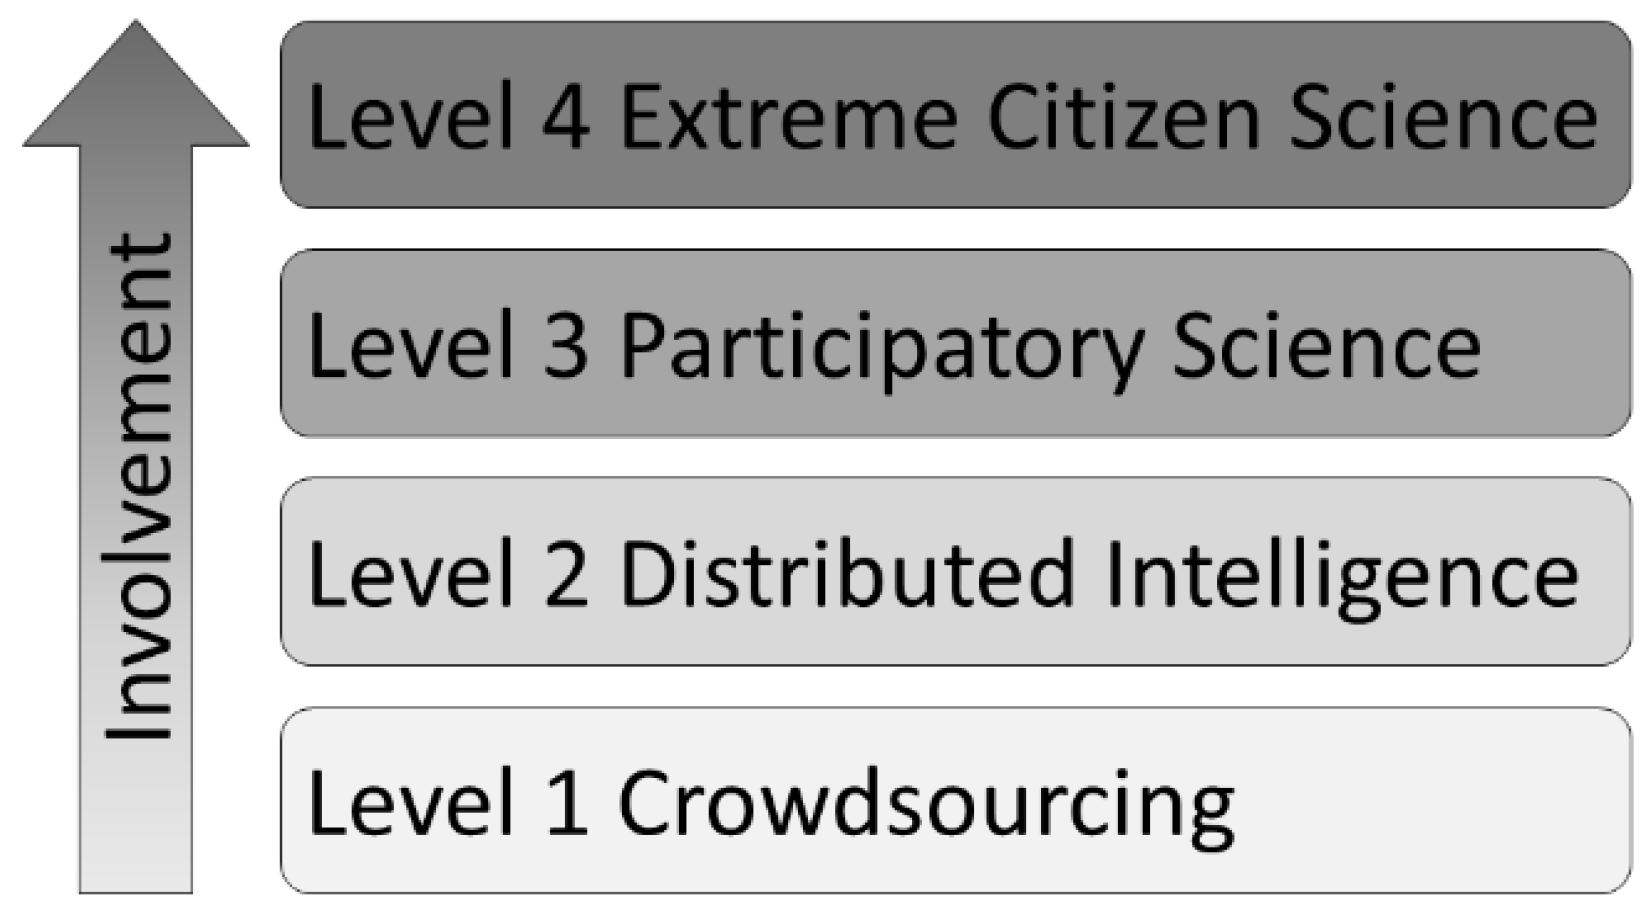
2.3.5. Level of Engagement of Citizens

In order to use VGI data appropriately, it is important to apply a classification. Mostly, the engagement and participation of the producer of the data in the specific project and in further analysis is chosen. For example, the term citizen science is now used very often in research to address the collection of scientific data by laypeople. In order to have a prompt reference to natural hazards, we use the classification of different levels of involvement proposed by Haklay [22], which was already reviewed in Section 1.

2.3.6. Type of Integration of VGI

First of all, it has to be noted that there is not a single hazard risk analysis method that can be developed and applied for future mitigation and preparedness in disaster management. There is rather a variety of different possibilities, which strongly depend on the hazard type [37]. In many cases of disaster management, there are already very good data available, e.g., from remote sensing or official datasets. Hence, VGI may be an alternative to such existing datasets in order to provide up-to-date and low-cost input data, e.g., for process modelling [38]. Furthermore, the advantage of VGI can be seen in the complementing of existing datasets in order to get up-to-date datasets, which might also include local knowledge [11].

3. Results

The search of the two literature databases led to 725 articles after removing the duplicates (Figure 2). Via the title screening, those papers are identified that are not directly related to VGI and to natural hazards, which results in the inclusion of 434 articles for the abstract screening. In the next step, it is possible to apply finer restrictions, as illustrated in Section 2.2. In total, 291 papers do not correspond to these requirements. In cases where it is not possible to get sufficient information to draw conclusions from the abstract, the papers are also included for the next step. After this, 86 papers remain for the full-paper analysis. This close look at the studies reveals the final eleven papers that deal with VGI methods, which are used for the mitigation or preparedness phase of the natural hazard analysis (Table 4). The other phases of the disaster management cycle can additionally be addressed in these studies. The hand-searching of the references, i.e., backward snowballing, results in no additional papers, because relevant references are duplicates or do not fulfil the inclusion criteria. Therefore, the final number remains the same.
There is no general trend visible regarding the journals in which the final selection of papers is published. Only the journal “Natural Hazards and Earth System Sciences” appears twice [35,39]. The journals represent several research areas (e.g., International Journal of Disaster Resilience in the Built Environment [40], Forests [41], Remote Sensing [38]), and thus, a broad variety of audiences are addressed by the articles.
In order to analyse the final papers, the dimensions and the specific categories for information extraction are used as a structure for an in-depth discussion. The following sections will deal with these categories in more detail and will give a synthesis and qualitative analysis of the final resulting papers of the review. A qualitative analysis was applied in the information extraction section because there is not enough foundation for quantitative statements. This qualitative procedure was already successfully applied in another systematic literature review with studies referring to VGI [27].

3.1. Study Area

Overall, the majority of studies are located in North America [39,40,41,43,45] and in Europe [15,35,38,44]. Only one research study is based in Africa [18]. The other parts of the world, such as Asia or Latin America, are not represented by the results of the SLR.
Furthermore, seven papers use data that are gathered in a specific country [15,35,38,39,40,41,43], while in two cases several countries are addressed [18,44]. The remaining studies apply platforms that collect and provide their data on a global level [42,45].

3.2. Hazard Type

When it comes to the use of VGI for the analysis of natural hazards, there are two major options (Table 5). First is a general analysis of natural hazards, which leads to the development of methods, strategies or platforms in order to address different hazard types [40,42,44]. Second, there is the possibility to present specific use cases and scenarios where certain hazard types are addressed: apart from volcanic eruptions, earthquakes, storms and mass movements, all other natural hazards that were applied as keywords for the SLR are represented. Schnebele and Cervone [39], Silvestro et al. [35], Wan et al. [45] and Dorn, Vetter and Höfle [38] form the largest group and present methods to cope with floods, while Enenkel et al. [18] focus on agricultural droughts. De Longueville et al. [15], Ferster and Coops [43] and Ferster et al. [41] deal with forest fires, whereas tsunamis are covered by Middleton et al. [44], who deal with several hazard types.
Moreover, the characteristics of the hazards are relevant for the methods and the VGI that can be used. A drought is temporally slow, which suggests monitoring processes [18], while in a flood that extends over a certain area, pictures can be used as a base for modelling or as ground data, e.g., modelling the flood extent in order to find elements at risk [35,39,45]. Finally, an earthquake, tsunami, fire, storm or volcanic eruption can occur suddenly, and therefore, it is necessary to have up-to-date data about hazard-prone or previously-affected areas to be adequately prepared and to conduct mitigation activities [15,41,43,44]. These examples show the diverse options that exist for the selection of tools and data types, as well as the tasks that the crowd is asked to perform. Therefore, a previous evaluation is indispensable for effective mitigation and preparedness measures [37]. The following section will give further insights into these possibilities.

3.3. Data Source

The data source varies according to the type of VGI and the appropriate involvement of the citizens (Table 4). De Longueville et al., for example, use social media as a source for their crowdsourcing [15], while Dorn, Vetter and Höfle focus on distributed intelligence via the collaborative project OSM [38]. Participatory science is based on mobile phone applications [18,41,43] and web platforms [45]. Within the selected studies, there are also combinations of data sources, e.g., for crowdsourcing, social media and additional information from the web are used [39,44]. Further, web platforms are combined with social media [40,42] or mobile phone applications with additional information from the web [35]. The following sections deal with the characteristics of the data sources and their specific application by the users, as well as the consequences for the integration into hazard analysis.

3.4. Level of Engagement of Citizens

The classification of Haklay [22] according to the involvement of the citizens in the process of hazard analysis is used in the following section to get an overview of the applicability of various VGI sources (Table 6). However, the fourth level (extreme citizen science), where citizens take part in the whole process, is excluded because it is not directly represented by the selected papers as it is rather an ideal type, which might be part of future developments.

3.4.1. Crowdsourcing

The identified articles often present analyses of Twitter messages or Flickr photographs (e.g., [15,44]). Hence, conversations (discourse) about a specific hazard and images of hazard events can be used as input data for monitoring and as in situ data for the evaluation of hazard models. Mostly, these models are based on remotely-sensed data, which might not be up-to-date, unavailable for the study area or might be too coarse for in-depth analysis [39]. In these cases, crowdsourced geodata are used for complementing the input data or for evaluating the results of models as in situ data [15,39,44].

3.4.2. Distributed Intelligence

The SLR further led to one study referring to distributed intelligence [38]. In contrast to the previous data source, where citizens are mostly not aware of the usage of their data, on this level, citizens deliberately collect or use geospatial data for specific purposes. Some of them are even aware of the possible application for hazard analysis. For example, OSM data are used in research, as OSM is a very up-to-date dataset and provides an alternative to, or mostly complements, other data sources [46,47]. If the OSM data have a high spatial coverage, they can represent an adequate alternative or addition to official data, e.g., for input data for flood modelling in the study of Dorn, Vetter and Höfle [38], who used OSM data to derive roughness parameters and compared the results to official CORINE data.

3.4.3. Participatory Science

The participatory science form of engagement is the most present one [18,35,40,41,42,43,45]. Mobile phone networks are rapidly expanding, and this trend allows the use of such methods even in remote areas. Hence, even in regions without Internet access, data can be gathered and stored locally until a data network is available, and then, they can be uploaded [18]. Furthermore, mobile applications for smartphones can be used to collect specific data, which can be used for risk mitigation of different natural hazard types. In contrast to distributed intelligence, the participant knows about the specific hazard addressed, the application for hazard analysis and also gains knowledge himself/herself while performing data collection [18,41,43]. Ferster et al. compare the results of such participatory science data to data collected by experts in these fields (wildfire professionals) in order to evaluate the quality [41]. Their results show that the more trained the volunteers are, the better the results they achieve. Moreover, the understanding of the hazard analysis is increased, and the participants may take part in interpretations and the formulation of new research questions. For example, a forest fire hazard mitigation is described, which uses participatory sensing for the evaluation of forest fuel loading [41]. Due to people settling in wildland-urban interface areas, e.g., in Canada, knowledge about forest fuel is important in order to mitigate fire hazards. By taking part in participatory science, local participants also increase their knowledge, and thus, information is spread for promoting and supporting preparation measurements of homeowners [43]. These actively collected data are essential, because in this way, new overviews of forest fuel loading can be assessed for large areas. This is especially important because the fuel load can change rapidly, e.g., fallen branches after a wind or storm event. Hence, frequent re-measurements are essential for effective monitoring and reliable mitigation [41]. Furthermore, the involvement of the citizens has a major role because official agencies cannot check all of the private properties. Therefore, homeowners need to know how they can contribute to the mitigation of a wildfire hazard with actions at their own place of residence. Through participation in the project they can gain valuable knowledge, which allows them also to express new research questions that might be addressed with the collected data [22].
In addition, monitoring by local citizens via photos and videos is useful for complementing technical monitoring, such as gauges or radar data for the evaluation of simulation models [35]. This local monitoring makes it possible to gather huge amounts of information worldwide and can be used to raise risk awareness, e.g., in web platform visualizations [45]. Moreover, such methods can be used in order to educate and train people, as well as to spread knowledge [42]. Additionally, the community members are actively involved by providing their own local information and conducting measurements for planning and capacity building. Therefore, it is not only about including individuals into the hazard analysis process by having them collect data via their smartphones and by relying on them, but it is also a whole system synthesizing different sources [40]. This holistic view on the integration of the community paves the way for extreme citizen science, i.e., collaborative science. At the moment, though, there is still a lack of communication between the different stakeholders and the citizens. Furthermore, methods for data collection, as well as platforms for such synthesizing have to be improved.
Amaratunga [40], Enenkel et al. [18], Ferster and Coops [43] and Ferster et al. [41] could be seen as taking the first steps towards this collaborative science. Participants gain scientific knowledge about drought indicators, new kinds of plants and fertilizers [18] or about actions they can take to reduce forest fire risks, such as via forest fuel evaluation at their homes [41,43]. Thus, in the long term, the whole process, including problem identification, data collection, interpretation and analysis, may be done by the participants themselves in order to fulfil a specific task [22].
Overall, this classification should not be seen as a collection of separate categories, because there are overlaps and transitions in between. Participants may identify themselves more and more with a project, receive intensified training and achieve deeper scientific knowledge, which leads to an increased level of engagement and participation [22].

3.5. Type of Integration of VGI

VGI is mostly used as additional information, and a fusion of different data sources can lead to up-to-date base data for hazard analysis (e.g., [35,39,44]).
Smartphone applications, for example, are used for the collection of data, which are then sent to a server for data storage and further processing [41,43]. Additionally, web platforms can be used for data collection, as well as for information sharing [40,42]. Wan et al. [45] use a cloud-based global flood disaster community cyber infrastructure based on Google services, such as Google Fusion Table. In contrast to a server-client-based structure, their approach based on a cloud computing framework allows data sharing, updates, queries, visualization and collaboration in a faster way [45].
Furthermore, service architectures are developed, mostly based on Open Geospatial Consortium (OGC) standards, to combine data from different sensors [15,44].
Depending on the desired application or level of detail, crowdsourced data can be used as a possible alternative or in addition to official data if up-to-date datasets are required for an effective application for hazard analysis, such as by the use of OSM data for roughness derivation for flood modelling [38]. The modelling of possible inundation areas allows decision makers to either decide against building new houses in flood-prone areas or to build protection measures for infrastructure and buildings in already populated areas that are facing flood risk. Furthermore, the results of such flood modelling can be checked and improved via images of inundated areas, such as from Flickr [39]. VGI is mainly used to complement other data sources in the hazard analysis process. Mostly, remote sensing data, gauge data, weather data and information by experts is combined with information from the crowd [15,18,35,39,41,43,44,45]. Enenkel et al., for example, apply VGI for agricultural droughts in addition to remote sensing and weather data for decision support [18]. Moreover, the VGI enables the evaluation of hazard models, e.g., the improvement of flood or tsunami assessment [35,39,44], via the input of up-to-date and local ground truth data. Furthermore, specific data can be obtained, which is difficult or simply not possible to gather via technical sensors, such as the validation of satellite-derived indicators, the integration of local knowledge about recurring events or the fast collection of a large amount of forest fuel data at different and wide areas [18,41,43].
In order to prepare appropriately with respect to a natural hazard, it is important to monitor ongoing processes. This is exemplified by De Longueville et al. [15] with their “nervous system” of a digital Earth, namely a real-time sensor web enablement of VGI, whereby burnt forest areas of former forest fires can give hints to areas at risk. Furthermore, their system evaluates the quality of the used volunteered information, which complements remote sensing data. The second main issue of the research is based on active forest fire detection, but this can be seen as part of the response phase [15]. Similarly, such a monitoring process can be applied for other natural hazards, such as for gaining information about droughts via a data source combination of satellite imagery, long-term weather forecasts and participatory sensing via mobile phones [18]. In the analysis of droughts, for example, satellite imagery is used for the derivation of soil moisture, and very often long-term weather forecasts, such as the prediction of El Niño conditions, are combined with them. Enenkel et al. [18] present an approach that includes information from local people via smartphones as a third data source, e.g., for the validation of drought indicators derived from satellite data via GPS-tagged pictures of crops. Additionally, people can gather geodata, which cannot be obtained from space, such as information about recurring events, malnutrition and access to drinking water, as well as the citizens’ socio-economic and living conditions in general, amongst others [27]. However, it is not only the producer side of the local community that can be addressed via a smartphone app, for example, but also the consumer side, such as getting information about drought-resistant seeds or the availability of fertilizers [18]. This approach of monitoring can also be applied to flood and fire hazards [35,43,45].
As risk mitigation is also enabled by an increase in resilience planning, empowering the community plays a crucial role. There are different options available, which can also be used in combination. By a Web 2.0-based “virtual community of practice”, online applications, tools, training materials, as well as information resources and knowledge can be spread among people. In this way, it is possible to anticipate threats and risks, as well as to improve local coping capacities via a bottom-up community-driven planning approach [40]. Likewise, information for decision makers with respect to hazard analysis can be provided via such web platforms or via interactive web platforms, where geodata are shared for visualization [42]. Further, the concept of the Evidence-Aid project [42] shows an example of how to use up-to-date information being disseminated via different social media channels, such as Twitter.

4. Discussion

Overall, this review shows that there still exists a need for research regarding the use of VGI for the specific phases of preparedness and mitigation in the hazard analysis area. Only eleven papers out of 748 references of the results of the systematic search within two scientific databases are dealing with such topics. This difference might be due to the broad selection of the query terms because most results mainly refer to the response phase, which was also the case in the SLR of Horita et al. [25].
The results show that the response phase has much larger presence for both researchers and volunteers. An explanation can be seen in the fact that this phase is the most visible and prominent one, especially in media [25]. However, the method of the SLR itself has limitations as it has to be considered that there is also a restriction due to language, as only journals written in English, Spanish and German were selected. The limitation of geographic regions of the selected studies might be seen as a consequence.
The overview of the data source and the level of engagement reveals the double role that is usually present in VGI in the information collection and distribution via Web 2.0 platforms and citizen science projects (e.g., in [40,42,45]). Hence, the citizens can be described as “produsers”, who contribute data and use available data again themselves [48]. This shows the importance of disaster communication and the knowledge about the users of social media, for example, in order to provide and receive necessary, reliable and appropriate information in a timely manner and via different communication channels [49].
Moreover, this importance of communication is also viewed in the fact that research often focuses on creating knowledge, which frequently leads to insufficient applicability of information in a hazard analysis context since the way and means of communicating this knowledge are not considered. This is grounded in the large gap between, on the one hand, the user requirements of, e.g., governmental or humanitarian institutions, and on the other hand, the scientific findings. It is not enough to gather data, but they also have to be provided in a way that local people and aid organizations can take advantage of it [18]. In addition, by including the community and local citizens, the awareness of risk can be raised and everyone can engage in mitigation activities and protection planning. Further, there is an enhancement of the sense of shared responsibility for the natural hazard [50]. With respect to this preparedness, Amaratunga [40] supports the use of VGI for the preparedness and mitigation phase of hazards with a famous quote of Pasteur: “Chance favours the prepared mind”. Thus, the more minds that are aware of risks and take action in order to prepare for (or even mitigate) the risks of natural hazards, the more social disasters can be diminished or avoided. Yet, concerning these new forms of data sources, it is relevant to bear in mind that only a part of society has access to the Internet or tools that are related to VGI. Therefore, mostly the information gained (e.g., from social media) can only be regarded as a partial and skewed picture [51].
Besides these types of data sources and the level of engagement, the particular way of using such data for the hazard analysis procedure also plays a meaningful role. The studies show that with respect to different hazard types, a combination of multiple complementing data sources is necessary. Data collected by citizens can be a valuable addition in order to evaluate models or to provide timely ground data and local knowledge. The collaborative online OpenStreetMap can in some cases not only add essential information, but can be considered as a possible alternative to proprietary data sources [52].

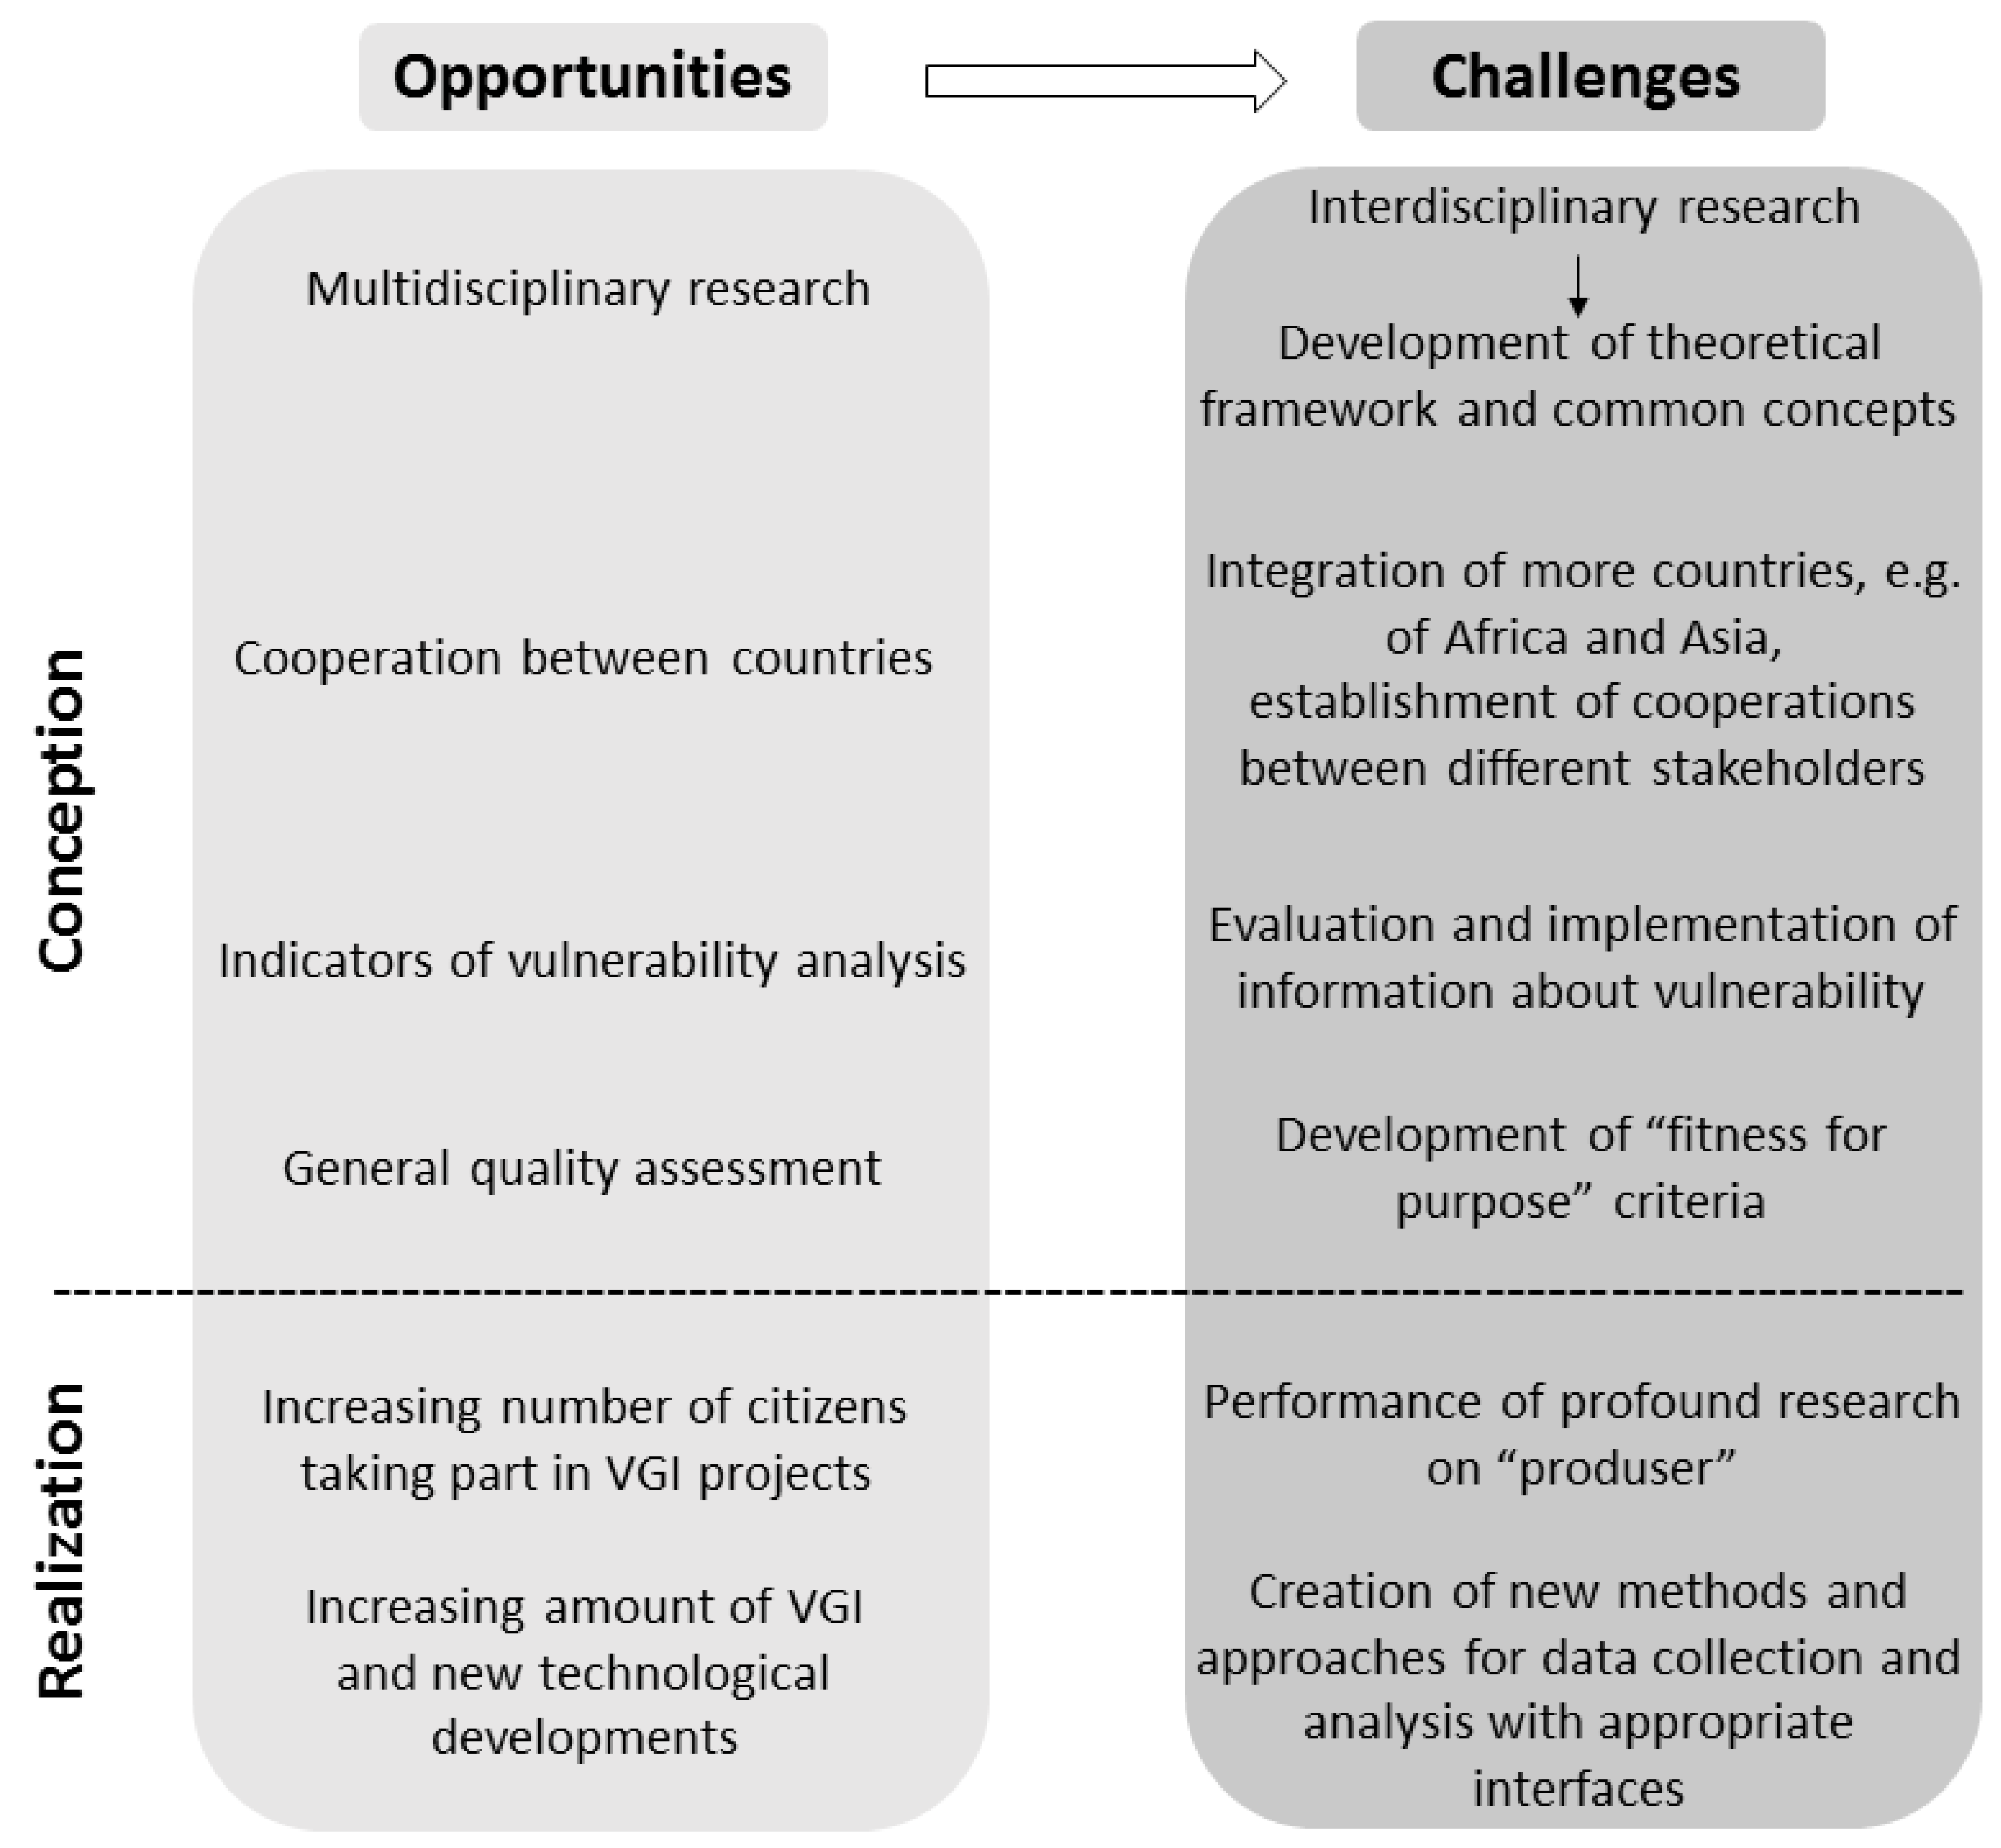
5. Opportunities and Challenges for the Use of VGI in the Mitigation and Preparedness Phase of Hazard Analysis

The use of VGI in hazard analysis brings many opportunities for research, but there are also several challenges that have to be faced in future research. In Figure 3, these issues are divided into a theoretical part of analysis (conception) and a realization part.

5.1. Conception Level

There is still a long way to go for integrated research because most analyses are discipline- and multidiscipline-centric while there is still a lack of interdisciplinary approaches [53]. Furthermore, mainly North-American and European scholars are involved as revealed by the literature review. Accordingly, the studies are based in these areas, apart from the study concerning droughts in Africa by Enenkel et al. [18]. Yet, similarly, this study is conducted by a European institution without cooperation with local universities, for example. This leads to a limitation of knowledge co-production and implementation gaps [53]. Georgiadou, Lungo and Richter [54] overcome these frontiers of thinking and place their research in middle and low-income countries of East Africa in order to analyse the role of citizen sensors, non-governmental organizations, professional users of the web and government officials with respect to the transparency of the state.
Moreover, vulnerability plays an important part in natural hazard analysis. As stated in the previous sections, there are different methods that can be implemented in order to gain insight into vulnerable areas and people (e.g., the access to drinking water [18]). However, there are only a few studies in which VGI is applied to vulnerability analysis, which is revealed in the small number of studies included in the systematic literature review. As discussed above, these studies tend to mainly step into the field of process modelling and monitoring (e.g., forest fuel, flood monitoring). Moreover, when vulnerability is measured, generally the focus is on physical and not social vulnerability [55,56]. In future, VGI could be used especially for such applications. There are already some studies that deduce information, such as population density or building outlines from VGI that could be used for natural hazard analysis, but at the moment, this information is not yet applied [13,14]. However, this is a controversial type of analysis because such studies lack background with respect to accuracy and representativeness, amongst others.
Further, data quality from collaborative maps, such as OSM, is very heterogeneous, e.g., of rural and urban areas [57], and therefore, quality analysis is very important; several studies have faced this challenge and revealed positive results for areas with sufficient available data in OSM (e.g., [46,47,57,58,59]). Thus, when working with these data, heterogeneous quality has to be kept in mind. OSM data from a specific area can be evaluated regarding their fitness for use due to data quality analysis. Klonner et al. [59], for example, used OSM data for a fusion with airborne laser scanning data to generate updated elevation models. These new datasets can be further used in hazard analysis, such as for flood modelling, due to the ability to have the number of buildings and the elevation of the area. Yet, there is still a need for studies to derive “fitness for purpose” criteria that VGI has to fulfil for the specific purposes of hazard analysis.
With respect to the theory behind VGI within the scope of natural hazard analysis, the results of the SLR reveal a lack of a theoretical framework for such a combination of methods. Yet, there is a need to evaluate the social components of VGI data (e.g., information about the contributor or the context of the contribution) in order to apply them appropriately to models that are based on technical sensor data. Furthermore, there is a large variety of terms related to risk assessment and risk awareness in the area of natural hazard management [4,23,60]. As risk plays a crucial role in the mitigation and preparedness phases, future research also needs to discuss differences between definitions and find ways and concepts allowing for uniform terms and, thus, easier communication among researchers, official institutions and citizens. Additionally, the same applies for the hazard and disaster concepts, as there are different definitions that lead to misunderstandings and wrong interpretations. A closer look at the common scholarly discussion of disaster can be regarded as such an example because natural disasters are regarded as time-delimited events, which are caused by an external force and are restricted to a certain place.
Furthermore, disasters are mostly defined via their consequences and impacts while neglecting the initial sources of risk, both social and natural, hindering a long-term view for understanding the overall process of risk production [51]. Therefore, future research on VGI for hazard analysis needs to focus on the users themselves and their background (e.g., education, social status, motivation), on monitoring (e.g., of natural environment) and on the spatial and temporal distribution of VGI, among others [61]. Moreover, Amaratunga [40] and Ferster et al. [41], for example, indicate in what way their findings change the risk perception of people in the community. Future studies may even more explicitly analyse and reflect on the influence of the VGI methods on local residents and decision makers, as well as researchers within the field of natural hazards. This user aspect plays not only an important role at the conception level, but also at the realization level, which will be discussed in more detail in the following section.

5.2. Realization Level

Factors with respect to participatory sensing, such as liability and personal privacy, are only mentioned by Ferster and Coops [43] and Ferster et al. [41]. As these new approaches of citizen integration are evolving and portray promising approaches not only in natural hazard analysis, focus should be placed on more research on the user himself/herself, e.g., regarding personal privacy issues. With an appropriate framework for the integration of VGI, the user who contributes local knowledge, personal experiences and local observations can be protected.
In addition, a closer look at the population is also necessary with respect to risk perception. Aspects such as experiences with previous natural hazards, trust in information sources or property in a risk area play a crucial role for the willingness to take preparedness and mitigation actions [62,63]. The literature review of Wachinger et al. [63] revealed the high influence of personal experience on the decision to take action. Further, existing research suggests that people seem to be more aware of floods and eager to prepare themselves if they can take part in participatory processes, e.g., together with public authorities [62,63]. This illustrates the importance of projects based on participatory methods, such as those of Amaratunga [40], Enenkel et al. [18], Ferster and Coops [43] and Ferster et al. [41].
Furthermore, the implementation of VGI methods has to be considered in more detail [18,41]. As data provided by citizens increase continuously, automated image processing and machine learning are vital for such new methods (e.g., [64]). Results can support the development of new GIScience methods and approaches to tackle the hazard analysis regarding risk awareness and VGI.

6. Conclusions

This literature review, which focused on journal papers, showed that there is only a little work in VGI and disaster preparedness and mitigation. In a next step, conference contributions can also be taken into consideration for a literature review in order to get a complete overview of research within this field. Although there is only a small number available for analysis, the selected papers are important studies about the use of VGI in natural hazard analysis, including both applied methods and the theoretical framework, which are highly relevant for future investigations.
Based on these examples, research needs to focus even more on the interaction of human and environment in order to understand natural hazards. A promising method of such analysis can be seen in the combination of different data sources and the inclusion of the community via bottom-up approaches that include VGI. Gradually, this trend will lead to a shift from emergency response to disaster preparedness and mitigation [18]. However, quality issues with respect to VGI have to be kept in mind and addressed in the analysis and future methods. Additionally, it is clear that research has not only been conducted to integrate such data and to use it for analysis, but also to bring forward the chances of more and more engagement by communities. This applies not only for active data collection, but also for the integration of the community in order to be able to use the results for themselves. Finally, the reviewed studies allow researchers or institutions that are dealing with the development or implementation of new methods for natural hazard analysis to get an idea of the most significant factors and also about current projects and methods already in practice. It is essential to develop general methods that are applicable at different locations and not bound to specific use cases.

Acknowledgments

This work was supported by the Heidelberg Academy of Sciences and Humanities (HAW). We acknowledge financial support by Deutsche Forschungsgemeinschaft and Ruprecht-Karls-Universität Heidelberg within the funding programme Open Access Publishing.

Author Contributions

All authors contributed to the idea and concept of this systematic literature review. Carolin Klonner and Sabrina Marx conducted the SLR. Carolin Klonner performed the in-depth analysis and drafted the manuscript. Sabrina Marx, Tomás Usón, João Porto de Albuquerque and Bernhard Höfle contributed to the analysis and to the compilation of this paper.

Conflicts of Interest

The authors declare no conflict of interest. The founding sponsors had no role in the design of the study; in the collection, analyses or interpretation of data; in the writing of the manuscript; nor in the decision to publish the results.

Abbreviations

The following abbreviations are used in this manuscript:
GISGeographic Information System
GNSSGlobal Navigation Satellite System
OSMOpenStreetMap
SLRSystematic Literature Review
VGIVolunteered Geographic Information

References

  1. Felgentreff, C.; Glade, T. Naturrisiken und Sozialkatastrophen; Spektrum Akademischer Verlag: Berlin, Germany, 2008. [Google Scholar]
  2. EM-DAT. The OFDA/CRED International Disaster Database. Available online: http://www.emdat.be/disaster_trends/index.html (accessed on 21 May 2016).
  3. Ebert, A.; Banzhaf, E.; McPhee, J. The influence of urban expansion on the flood hazard in santiago de chile. In Proceedings of the 2009 Joint Urban Remote Sensing Event, Shanghai, China, 20–22 May 2009; pp. 1–7.
  4. Dikau, R.; Pohl, J. Hazards: Naturgefahren und Naturrisiken. In Geographie: Physische Geographie und Humangeographie; Gebhardt, H., Glaser, R., Radtke, U., Reuber, P., Eds.; Spektrum Akademischer Verlag: Heidelberg, Germany, 2011; pp. 1115–1168. [Google Scholar]
  5. Cova, T.J. GIS in emergency management. In Geographical Information Systems: Management Issues and Applications, 2nd ed.; Longley, P.A., Goodchild, M.F., Maguire, D.J., Rhind, D.W., Eds.; Wiley: New York, NY, USA, 1999; pp. 845–858. [Google Scholar]
  6. Ebert, A.; Welz, J.; Heinrichs, D.; Krellenberg, K.; Hansjürgens, B. Socio-environmental change and flood risks: The case of Santiago de Chile. Erdkunde 2010, 64, 303–313. [Google Scholar] [CrossRef]
  7. Cardona, O.D.; van Aalst, M.K.; Birkmann, J.; Fordham, M.; McGregor, G.; Perez, R.; Pulwarty, R.S.; Schipper, E.L.F.; Sinh, B.T. Determinants of risk: Exposure and vulnerability. In Managing the Risks of Extreme Events and Disasters to Advance Climate Change Adaptation; Field, C.B., Barros, V., Stocker, T.F., Qin, D., Dokken, D.J., Ebi, K.L., Mastrandrea, M.D., Mach, K.J., Plattner, G.-K., Allen, S.K., et al., Eds.; Cambridge University Press: Cambridge, UK; New York, NY, USA, 2012; pp. 65–108. [Google Scholar]
  8. Wisner, B. At Risk: Natural Hazards, People's Vulnerability and Disasters, 2nd ed.; Routledge: London, UK; New York, NY, USA, 2008. [Google Scholar]
  9. Poser, K.; Dransch, D. Volunteered geographic information for disaster management with application to rapid flood damage estimation. Geomatica 2010, 64, 89–98. [Google Scholar]
  10. Roche, S.; Propeck-Zimmermann, E.; Mericskay, B. Geoweb and crisis management: Issues and perspectives of volunteered geographic information. GeoJournal 2013, 78, 21–40. [Google Scholar] [CrossRef]
  11. Goodchild, M.F. Citizens as sensors: The world of volunteered geography. GeoJournal 2007, 69, 211–221. [Google Scholar] [CrossRef]
  12. OpenStreetMap. Openstreetmap. Available online: http://www.openstreetmap.org (accessed on 17 March 2015).
  13. Fan, H.; Zipf, A.; Fu, Q.; Neis, P. Quality assessment for building footprints data on openstreetmap. Int. J. Geogr. Inf. Sci. 2014, 28, 700–719. [Google Scholar] [CrossRef]
  14. Jokar Arsanjani, J.; Bakillah, M. Understanding the potential relationship between the socio-economic variables and contributions to openstreetmap. Int. J. Digit. Earth 2015. [Google Scholar] [CrossRef]
  15. De Longueville, B.; Annoni, A.; Schade, S.; Ostlaender, N.; Whitmore, C. Digital earth’s nervous system for crisis events: Real-time sensor web enablement of volunteered geographic information. Int. J. Digit. Earth 2010, 3, 242–259. [Google Scholar] [CrossRef]
  16. Spinsanti, L.; Ostermann, F. Automated geographic context analysis for volunteered information. Appl. Geogr. 2013, 43, 36–44. [Google Scholar] [CrossRef]
  17. De Albuquerque, J.P.; Herfort, B.; Brenning, A.; Zipf, A. A geographic approach for combining social media and authoritative data towards identifying useful information for disaster management. Int. J. Geogr. Inf. Sci. 2015, 29, 667–689. [Google Scholar] [CrossRef]
  18. Enenkel, M.; See, L.; Bonifacio, R.; Boken, V.; Chaney, N.; Vinck, P.; You, L.; Dutra, E.; Anderson, M. Drought and food security—Improving decision-support via new technologies and innovative collaboration. Glob. Food Secur. 2015, 4, 51–55. [Google Scholar] [CrossRef]
  19. OpenStreetMap. Bing License. Available online: http://wiki.openstreetmap.org/w/images/d/d8/Bing_license.pdf (accessed on 31 May 2015).
  20. OpenStreetMap. Openstreetmap Bing. Available online: http://wiki.openstreetmap.org/wiki/Bing (accessed on 31 May 2015).
  21. Craglia, M.; Ostermann, F.; Spinsanti, L. Digital earth from vision to practice: Making sense of citizen-generated content. Int. J. Digit. Earth 2012, 5, 398–416. [Google Scholar] [CrossRef]
  22. Haklay, M. Citizen science and volunteered geographic information: Overview and typology of participation. In Crowdsourcing Geographic Knowledge; Sui, D., Elwood, S., Goodchild, M., Eds.; Springer: Dordrecht, The Netherlands, 2013; pp. 105–122. [Google Scholar]
  23. Birkmann, J.; Welle, T.; Krause, D.; Wolfertz, J.; Suarez, D.C.; Setiadi, N. WorldRiskIndex: Concept and results. In WorldRiskReport 2011; Jeschonnek, L., Ed.; Bündnis Entwicklung Hilft: Berlin, Deutschland, 2011; pp. 13–41. [Google Scholar]
  24. Landwehr, P.M.; Carley, K.M. Social media in disaster relief. In Data Mining and Knowledge Discovery for Big Data: Methodologies, Challenge and Opportunities; Chu, W.W., Ed.; Springer: Berlin, Germany, 2014; pp. 225–257. [Google Scholar]
  25. Horita, F.E.A.; Degrossi, L.C.; Assis, L.F.F.G.; Zipf, A.; Porto de Albuquerque, J. The use of volunteered geographic information and crowdsourcing in disaster management: A systematic literature review. In Proceedings of the Americas Conference on Information Systems AMCIS 2013, Chicago, IL, USA, 15–17 August 2013.
  26. Aimone, A.M.; Perumal, N.; Cole, D. A systematic review of the application and utility of geographical information systems for exploring disease-disease relationships in paediatric global health research: The case of anaemia and malaria. Int. J. Health Geogr. 2013, 12. [Google Scholar] [CrossRef] [PubMed]
  27. Marx, S.; Phalkey, R.; Aranda-Jan, C.; Profe, J.; Sauerborn, R.; Höfle, B. Geographic information analysis and web-based geoportals to explore malnutrition in sub-saharan africa: A systematic review of approaches. BMC Public Health 2014, 14. [Google Scholar] [CrossRef] [PubMed]
  28. Kitchenham, B.; Pearl Brereton, O.; Budgen, D.; Turner, M.; Bailey, J.; Linkman, S. Systematic literature reviews in software engineering—A systematic literature review. Inf. Softw. Technol. 2009, 51, 7–15. [Google Scholar] [CrossRef]
  29. Falagas, M.E.; Pitsouni, E.I.; Malietzis, G.A.; Pappas, G. Comparison of pubmed, scopus, web of science, and google scholar: Strengths and weaknesses. FASEB J. 2008, 22, 338–342. [Google Scholar] [CrossRef] [PubMed]
  30. Web of Science. Web of Knowledge. Available online: http://www.webofknowledge.com (accessed on 31 May 2015).
  31. Scopus. Available online: http://www.scopus.com (accessed on 31 May 2015).
  32. Khan, K.S.; Kunz, R.; Kleijnen, J.; Antes, G. Five steps to conducting a systematic review. J. R. Soc. Med. 2003, 96, 118–121. [Google Scholar] [CrossRef] [PubMed]
  33. Greenhalgh, T.; Peacock, R. Effectiveness and efficiency of search methods in systematic reviews of complex evidence: Audit of primary sources. BMJ 2005, 331, 1064–1065. [Google Scholar] [CrossRef] [PubMed]
  34. Peduzzi, P.; Dao, H.; Herold, C.; Mouton, F. Assessing global exposure and vulnerability towards natural hazards: The disaster risk index. Nat. Hazards Earth Syst. Sci. 2009, 9, 1149–1159. [Google Scholar] [CrossRef]
  35. Silvestro, F.; Gabellani, S.; Giannoni, F.; Parodi, A.; Rebora, N.; Rudari, R.; Siccardi, F. A hydrological analysis of the 4 november 2011 event in genoa. Nat. Hazards Earth Syst. Sci. 2012, 12, 2743–2752. [Google Scholar] [CrossRef]
  36. Ismail-Zadeh, A. Extreme Natural Hazards, Disaster Risks and Societal Implications; Cambridge University Press: Cambridge, UK, 2014. [Google Scholar]
  37. Liu, S.B. Crisis crowdsourcing framework: Designing strategic configurations of crowdsourcing for the emergency management domain. Comput. Support. Coop. Work 2014, 23, 389–443. [Google Scholar] [CrossRef]
  38. Dorn, H.; Vetter, M.; Höfle, B. GIS-based roughness derivation for flood simulations: A comparison of orthophotos, lidar and crowdsourced geodata. Remote Sens. 2014, 6, 1739–1759. [Google Scholar] [CrossRef]
  39. Schnebele, E.; Cervone, G. Improving remote sensing flood assessment using volunteered geographical data. Nat. Hazards Earth Syst. Sci. 2013, 13, 669–677. [Google Scholar] [CrossRef]
  40. Amaratunga, C.A. Building community disaster resilience through a virtual community of practice (VCOP). Int. J. Disaster Resil. Built Environ. 2014, 5, 66–78. [Google Scholar] [CrossRef]
  41. Ferster, C.J.; Coops, N.C.; Harshaw, H.W.; Kozak, R.A.; Meitner, M.J. An exploratory assessment of a smartphone application for public participation in forest fuels measurement in the wildland-urban interface. Forests 2013, 4, 1199–1219. [Google Scholar] [CrossRef]
  42. Allen, C. A resource for those preparing for and responding to natural disasters, humanitarian crises, and major healthcare emergencies. J. Evid. Based Med. 2014, 7, 234–237. [Google Scholar] [CrossRef] [PubMed]
  43. Ferster, C.J.; Coops, N.C. Assessing the quality of forest fuel loading data collected using public participation methods and smartphones. Int. J. Wildland Fire 2014, 23, 585–590. [Google Scholar] [CrossRef]
  44. Middleton, S.E.; Sabeur, Z.A.; Löwe, P.; Hammitzsch, M.; Tavakoli, S.; Poslad, S. Multi-disciplinary approaches to intelligently sharing large-volumes of real-time sensor data during natural disasters. Data Sci. J. 2013, 12, WDS109–WDS113. [Google Scholar] [CrossRef]
  45. Wan, Z.M.; Hong, Y.; Khan, S.; Gourley, J.; Flamig, Z.; Kirschbaum, D.; Tang, G.Q. A cloud-based global flood disaster community cyber-infrastructure: Development and demonstration. Environ. Model. Softw. 2014, 58, 86–94. [Google Scholar] [CrossRef]
  46. Barron, C.; Neis, P.; Zipf, A. A comprehensive framework for intrinsic openstreetmap quality analysis. Trans. GIS 2014, 18, 877–895. [Google Scholar] [CrossRef]
  47. Haklay, M. How good is volunteered geographical information? A comparative study of openstreetmap and ordnance survey datasets. Environ. Plan. B Plan. Des. 2010, 37, 682–703. [Google Scholar] [CrossRef]
  48. Bruns, A. Produsage. In Proceedings of the 6th ACM SIGCHI Conference on Creativity & Cognition, Washington, DC, USA, 13–15 June 2007; ACM: New York, NY, USA, 2007; pp. 99–106. [Google Scholar]
  49. Houston, J.B.; Hawthorne, J.; Perreault, M.F.; Park, E.H.; Goldstein Hode, M.; Halliwell, M.R.; Turner McGowen, S.E.; Davis, R.; Vaid, S.; McElderry, J.A.; et al. Social media and disasters: A functional framework for social media use in disaster planning, response, and research. Disasters 2014, 39, 1–22. [Google Scholar] [CrossRef] [PubMed]
  50. Monroe, M.C.; Pennisi, L.; McCaffrey, S.; Mileti, D. Social Science to Improve Fuels Management: A Synthesis of Research Relevant to Communicating with Homeowners about Fuels Management; General Technical Report NC-267; US Department of Agriculture Forest Service, North Central Research Station: St. Paul, MA, USA, 2006. [Google Scholar]
  51. Crawford, K.; Finn, M. The limits of crisis data: Analytical and ethical challenges of using social and mobile data to understand disasters. GeoJournal 2015, 80, 491–502. [Google Scholar] [CrossRef]
  52. Goodchild, M.F.; Li, L. Assuring the quality of volunteered geographic information. Spat. Stat. 2012, 1, 110–120. [Google Scholar] [CrossRef]
  53. Gall, M.; Nguyen, K.H.; Cutter, S.L. Integrated research on disaster risk: Is it really integrated? Int. J. Disaster Risk Reduct. 2015, 12, 255–267. [Google Scholar] [CrossRef]
  54. Georgiadou, Y.; Lungo, J.H.; Richter, C. Citizen sensors or extreme publics? Transparency and accountability interventions on the mobile geoweb. Int. J. Digit. Earth 2013, 7, 516–533. [Google Scholar] [CrossRef]
  55. Koks, E.E.; Jongman, B.; Husby, T.G.; Botzen, W.J.W. Combining hazard, exposure and social vulnerability to provide lessons for flood risk management. Environ. Sci. Policy 2015, 47, 42–52. [Google Scholar] [CrossRef]
  56. Mechler, R.; Bouwer, L.M. Understanding trends and projections of disaster losses and climate change: Is vulnerability the missing link? Clim. Chang. 2015, 133, 23–25. [Google Scholar] [CrossRef]
  57. Neis, P.; Zielstra, D.; Zipf, A. The street network evolution of crowdsourced maps: Openstreetmap in Germany 2007–2011. Future Internet 2012, 4, 1–21. [Google Scholar] [CrossRef]
  58. Zielstra, D.; Zipf, A. A comparative study of proprietary geodata and volunteered geographic information for Germany. In Proceedings of the 13th AGILE International Conference on Geographic Information Science, Guimarães, Portugal, 10–14 May 2010.
  59. Klonner, C.; Barron, C.; Neis, P.; Höfle, B. Updating digital elevation models via change detection and fusion of human and remote sensor data in urban environments. Int. J. Digit. Earth 2015, 8, 153–171. [Google Scholar] [CrossRef]
  60. Felgentreff, C.; Dombrowsky, W.R. Hazard-, Risiko- und Katastrophenforschung. In Naturrisiken und Sozialkatastrophen; Felgentreff, C., Glade, T., Eds.; Springer: Berlin/Heidelberg, Germany, 2008; pp. 13–29. [Google Scholar]
  61. Li, L.; Goodchild, M.F.; Xu, B. Spatial, temporal, and socioeconomic patterns in the use of twitter and flickr. Cartogr. Geogr. Inf. Sci. 2013, 40, 61–77. [Google Scholar] [CrossRef]
  62. Burningham, K.; Fielding, J.; Thrush, D. “It’ll never happen to me”: Understanding public awareness of local flood risk. Disasters 2008, 32, 216–238. [Google Scholar] [CrossRef] [PubMed]
  63. Wachinger, G.; Renn, O.; Begg, C.; Kuhlicke, C. The risk perception paradox—Implications for governance and communication of natural hazards. Risk Anal. 2013, 33, 1049–1065. [Google Scholar] [CrossRef] [PubMed]
  64. Narayanan, R.; Lekshmy, V.M.; Rao, S.; Sasidhar, K. A novel approach to urban flood monitoring using computer vision. In Proceedings of the 5th International Conference on Computing, Communications and Networking Technologies, Hefei, China, 11–13 July 2014.
Figure 1. Levels of involvement of volunteers in scientific work (modified from [22]).
Ijgi 05 00103 g001
Figure 2. Flow diagram of the literature search and selection of articles for in-depth analysis (Section 2.1, Section 2.2 and Section 2.3).
Ijgi 05 00103 g002
Figure 3. Overview of the opportunities and challenges for the use of VGI in the mitigation and preparedness phase of hazard analysis at the conception and realization level.
Ijgi 05 00103 g003
Table 1. Typology of VGI (modified from [21], p. 405).
Geographic Content
ExplicitImplicit
Explicitly-volunteered
Active sensing
“True” VGI, e.g., OpenStreetMapVolunteered (geo)spatial information, such as Wikipedia articles about non-geographic topics containing place names
Implicitly-volunteered
Passive sensing
Citizen-Generated Geographic Content (CGGC), e.g., Tweets referring to the properties of an identifiable placeUser-Generated (geo)Spatial Content (UGSC), like Tweets only mentioning a place in the context of another (non-geographic) topic
Table 2. Query terms for the two concepts of the literature search in the Web of Science and Scopus.
Hazard AnalysisVGI
disaster*Web 2.0
crisisNeogeograph*
crisesvolunteered geograph*
flood*vgi
earthquake*crowdsourc*
fire*crowd-sourc*
volcan* eruption*crowd sourc*
storm*user-generated content*
drought*ugc
tsunami*social media
mass movement*citizen science
collective sens*
Table 3. Dimensions and specific categories for information extraction of the qualitative analysis of the selected papers’ query terms for the two concepts of the literature search in the Web of Science and Scopus.
DimensionsCategories
Study objectivePlatform for information exchange, integration of VGI, e.g., for simulations, situation awareness and decision support within disaster management process, quality evaluation
Study areaCountry
Hazard typeSpecific type or several types
Data sourceSocial media (Twitter, Flickr), additional information from the web, collaborative project (OSM), web platform, smartphone application
Level of engagement and participationCrowdsourcing, distributed intelligence, participatory science and extreme citizen science [22]
Type of integration of VGIComplementation or alternative to other datasets
Table 4. Selected peer-reviewed articles of the SLR.
ArticleStudy ObjectiveStudy AreaHazard TypeData SourceLevel of Engagement of CitizensType of Integration of VGI
[42]Resource platform for crisis management actors for fast information accessGlobalSeveralWeb platform, social mediaParticipatory ScienceIntegration of crisis management resources; for information sharing and distribution
[40]Use Web 2.0 methods for establishing virtual communities of practices; increase community engagement in the mitigation phaseCanadaSeveralWeb platform, social mediaParticipatory ScienceIntegration of crisis mitigation activities; web as knowledge management system
[15]Develop active and dynamic multidimensional framework: monitor changes, react to crisis and improve citizens’ ability to contribute to situation awareness and decision makingUnited KingdomForest fireSocial mediaCrowdsourcingVGI as a complementary source to remote sensing information
[38]Use of different datasets for analysis of the applicability of roughness map derivation for flood simulationsAustriaFloodCollaborative project (OSM)Distributed IntelligenceUp-to-date alternative to official and remote sensing data
[18]Decision-support for agricultural droughts that threaten the livelihoods of people living in vulnerable regionsSeveral countries in AfricaAgricultural droughtMobile phone applicationParticipatory ScienceIntegration of remote sensing and weather data
[41]Get more extensive datasets of fuel loading dataCanadaForest fireMobile phone applicationParticipatory ScienceIntegration of data collected by experts
[43]Evaluation of the quality of forest fuels data collected by volunteers using smartphone application designed by a research teamCanadaForest fireMobile phone applicationParticipatory ScienceIntegration of data collected by experts
[44]Share and process large-volumes of real-time sensor data via a multi-disciplinary approach; build knowledge-based service architecture for multi-risk environmental decision-supportCountries within the North-Eastern Atlantic and Mediterranean regionTsunamiSocial media (Twitter), additional info from web (YouTube, RSS feeds)CrowdsourcingIntegration of other sensor data (tide gauges, buoys, seismic sensors, satellites, earthquake alerts)
[39]Integration of VGI data into flood assessment via remote sensing dataUSAFloodSocial media (Flickr), additional info from web (videos, photos, Wikipedia, abc24.com)CrowdsourcingIntegration of remote sensing data via fusion to improve flood assessment; VGI as ground data
[35]Multi-catchment approach to simulate flooding: evaluation of the inclusion of the information of citizens for monitoringItalyFloodMobile phone application, additional info from the web (YouTube, videos, photos)Participatory ScienceIntegration of technical monitoring (gauges, radar data) in order to verify simulation model results
[43]Cyberflood: cloud computing service, i.e., a unified, global flood cyber-infrastructure:
-
integration of crowdsourced data collection
-
fast analysis in real time
Global; Example in USAFloodWeb platformParticipatory ScienceIntegration of official data for real-time analysis, hydrologic model evaluation, flood risk management and awareness
Table 5. Hazard type.
Hazard TypeNumber of Studies
Several3
Floods4
Agricultural droughts1
Forest fires3
Tsunamis1
Table 6. Level of engagement of the citizens.
Level of EngagementNumber of Studies
Crowdsourcing3
Distributed Intelligence1
Participatory Science7

