1. Introduction
The number of city models and their importance are increasing. In addition to the traditional commercial or institutional authorities’ models, crowd-sourced models are also now available [
1]. Three-dimensional (3D) city models as multi-purpose models of spatial environments are used in a growing number of different application domains [
2]. For example, 3D navigation maps have become ubiquitous, both in automotive and pedestrian navigation systems, which include 3D city models—in particular, terrain models and 3D building models—in order to enhance visual depiction and simplify recognition of locations. In urban planning, 3D city models provide a means for project communication and better acceptance of development projects through visualization, and therefore avoid monetary loss through project delays. For emergency, risk and disaster management systems, 3D city models provide a conceptual framework. In particular, they are useful for simulating fire, floods, energy applications [
3], noise analysis [
4,
5], fine dust distribution modeling [
6,
7], and explosions [
8]. In Geodesign, virtual 3D models of the environment (e.g., landscape models or urban models) facilitate exploration and presentation, as well as analysis and simulation. 3D city models can be helpful in architecture engineering and construction, where modeling the full 3D space, including outdoor and indoor environments, is needed to provide an efficient total solution [
9,
10,
11].
The amount of data in city models is often very large. This implies that there is a need for efficient methods to store, manipulate, distribute and visualize these models. The focus of this study is finding an efficient method for 3D building objects which, in most cases, is the most prominent feature type of most city models. Distributing detailed 3D building objects to mobile devices, such as smart phones, is still limited by bandwidth. To circumvent this problem, we should only send a detailed description of the buildings that are close to the user; for other buildings, generalized versions are sufficient. However, as the user moves through the environment, new representations of the buildings are visualized on the screen, i.e., the user will notice an abrupt change in the scene. A method to avoid these abrupt changes is to use the progressive transfer of data from the server to the mobile device. In the progressive transfer of data, only generalized versions of the buildings are first sent to the mobile device. For objects that then need a more detailed representation, only the additional features of the objects have to be transferred. This also ensures that progressive transfer is efficient in terms the amount of data that has to be transferred.
CityGML is an international standard for city models, proposed by the Open Geospatial Consortium [
12]. A main focus of CityGML is to represent the semantic aspects of the features in a city. To support this, CityGML contains a comprehensive information model, divided into several sub-models of buildings, tunnels and bridges, city furniture (e.g., lamp poles), vegetation, etc. Furthermore, CityGML supports multiresolution modeling. The coarsest level, Level of Detail 0 (LOD0), is merely a digital surface model, while the most detailed level, LOD4, contains detailed representations of both outdoor and indoor features [
13]. Its multi-resolution modeling capabilities enable CityGML to be used for multiple representation databases where representations of the same features in varying levels of detail are stored. However, CityGML is not designed for efficient visualization, while Collada or X3D can be employed for visualization. For 3D buildings which are inputted in different formats, they are firstly processed with their own parsers, respectively. Then the extracted geometry and, if applicable, semantic data about the building is converted into their counterparts in CityGML. In this study, CityGML is used as an intermediate format to integrate 3D city models into different formats, such as Collada, 3DS and X3D.
The aim of this paper is to investigate methods for the efficient handling of 3D building objects in mobile devices. To fulfil this aim, there are several issues that have to be addressed: (i) the usage of an efficient multiple representation data structure that supports progressive transfer; (ii) the development of generalization methods to populate this data structure with geodata; (iii) the storage techniques of the geodata that support the fast retrieval of data; and (iv) the implementation of a visualization framework that supports progressive transfer. In this paper, we address all of these issues.
This paper is organized as follows. The related work is introduced in
Section 2.
Section 3 describes the methodology where we explain each of the four issues mentioned above.
Section 4 presents the experimental results for both visual quality and the performance aspects. Finally,
Section 5 and
Section 6 contain a discussion and the conclusions of the proposed methodology, respectively.
2. Related Work
2.1. Geometric Representations of 3D Objects
Considering the complexity of 3D city models, it is essential to have efficient geometric representations. In this paper, we convert the boundary representation (B-rep) of 3D buildings into constructive solid geometry (CSG) representation [
14,
15]. In the CSG representation, the geometries are created by combining elementary geometric features (
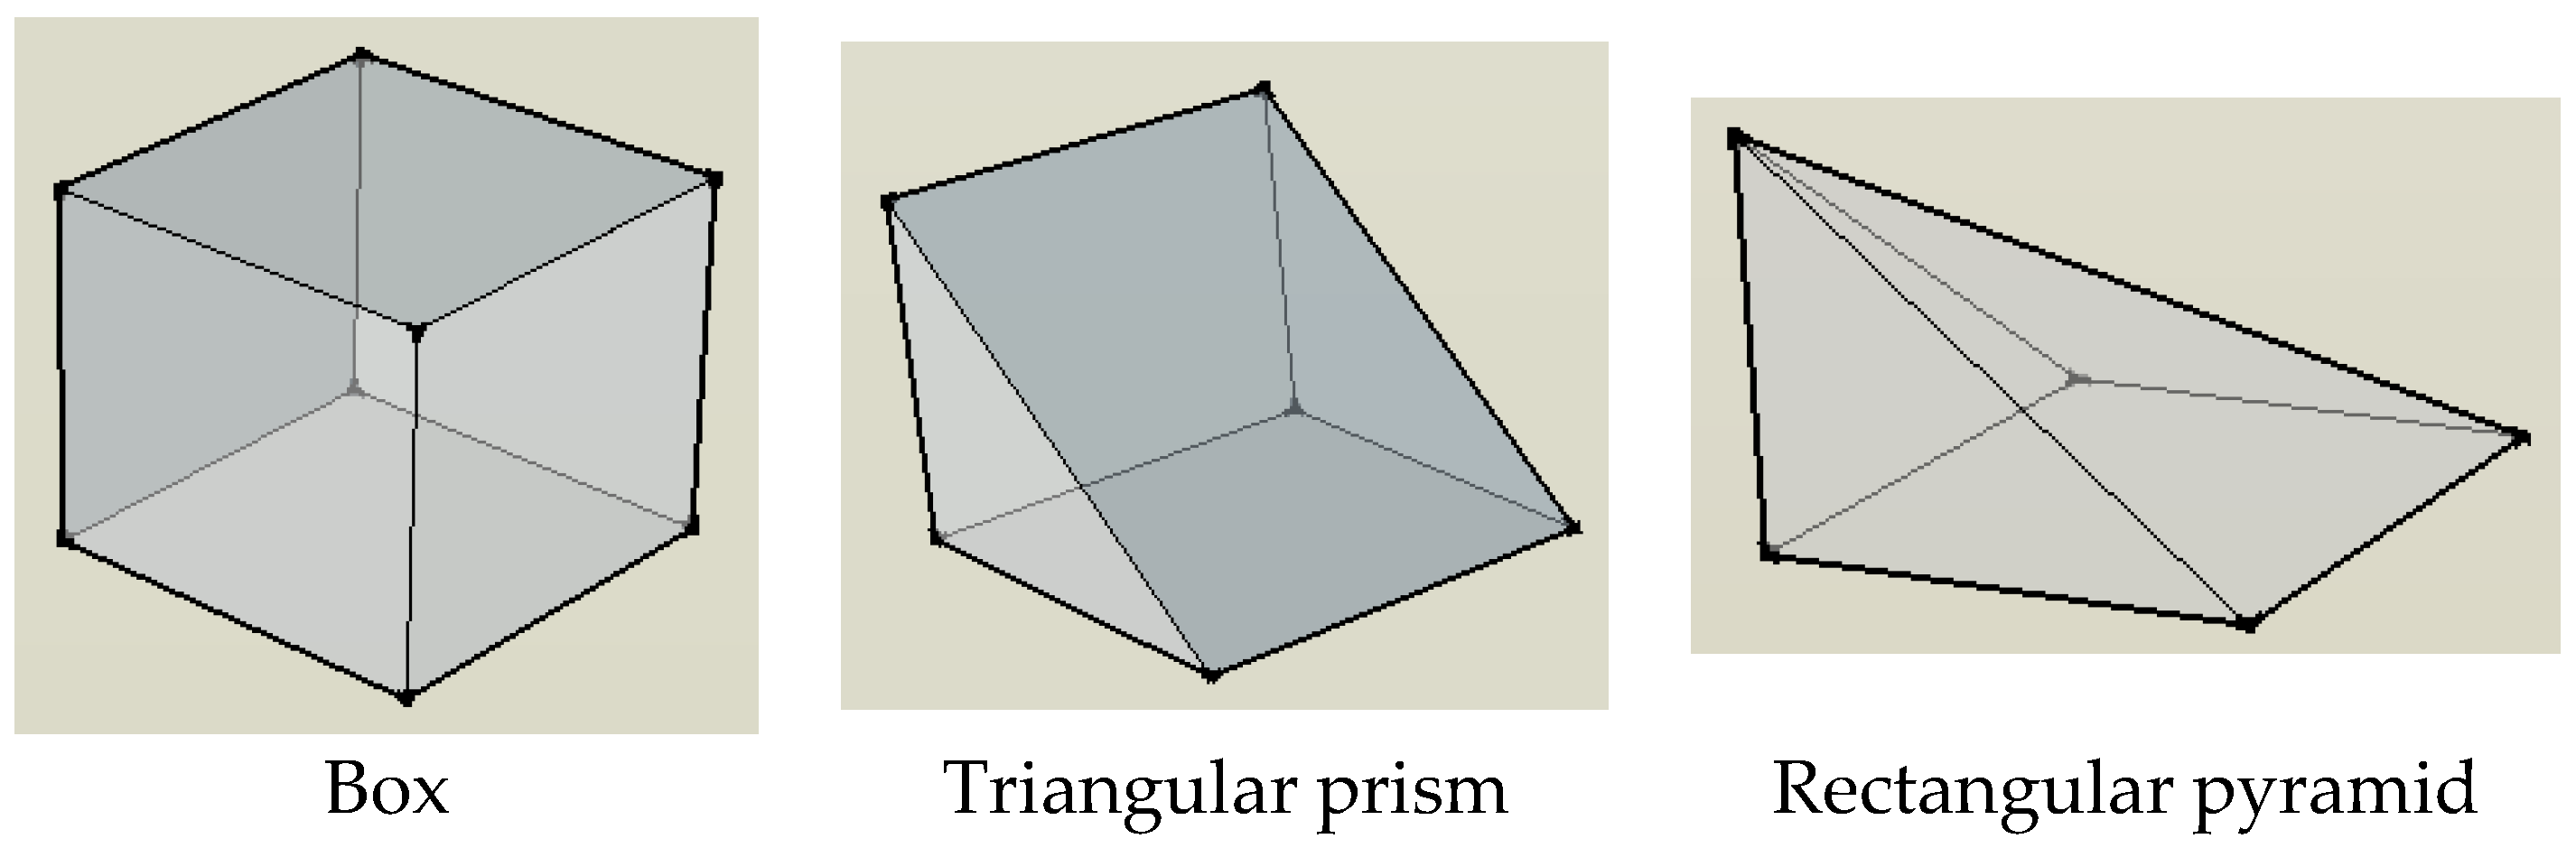
Figure 1). By using transformation parameters (rotation, scaling, etc.) as well as combining them (adding and subtracting), the geometries can model irregular shapes.
CSG representation is widely used in building design (CAD/CAM) and provides the efficient storage of data for buildings that have a rectangular shape or share common parts, such as flat and gabled roofs. As [
16] points out, CSG representation has the following advantages: (i) modeling using primitives and Boolean operations is much more intuitive than specifying boundary representation surfaces directly; (ii) the primitives can be parameterized, thus enabling reuse and collection in libraries, and reducing the file size; (iii) it can be associated with other, additional information; and (iv) the CSG modeling tree contains implicit information that can be used for many purposes. Another benefit of CSG is that it can easily ensure that objects are “solid” or water-tight if all of the primitive shapes are water-tight. By comparison, when creating geometry based on boundary representations, additional topological data is required, or consistency checks must be performed to ensure that the given boundary description specifies a valid solid object.
If many buildings share similar features, it is possible to represent buildings with pre-defined prototypes. Thiemann [
17] introduces the CSG representation of 3D buildings and the CSG tree to form the building with Boolean operations such as intersection, difference and union. Brenner [
16] compares the differences between B-rep and CSG representations, and proposes a method called weak CSG modeling which is a combination of the two representation forms. The main idea of weak CSG modeling is to package, or hide, the regularity constraints of objects inside the black boxes which appear to the user as traditional CSG primitives. Meanwhile, not all buildings can be represented as CSG. There are many buildings in real cities that cannot be described by CSGs. For these buildings, B-rep should be used. In this paper we use CSG to represent simple regular buildings composed by predefined structures (box, hip roof, gabled roof, tower and so on).
2.2. Multiple Representation and Progressive Transfer
Multiple representations are important in many 3D applications, such as infrastructure construction application [
18] and geology [
19] and they play a prominent role in city models. To deal with multi-scale models, it is common to develop multiple representation data structures. The models are not the same as LODs in CityGML [
20]. We mainly extend the LOD2 in CityGML to a richer level (CSG-LOD or CLOD) to better fill the gap between LOD3 and LOD1 [
21]. The progressive CSG is used as the new LOD which is generated based on the balance between visualization performance and computation costs.
Multiple representation data structures have been used for the progressive transfer of 2D data [
22]. For 3D city models, Coors [
23] developed a data model that supports hierarchical LOD. This data model was then implemented in a P-Tree (progressive tree) which stores a coarse representation in the root and a more detailed representation in the leaves. Depending on the distance from the viewer to the building, a different level of the P-tree is traversed. To ensure landmark buildings are represented satisfactorily, they are always stored on a high level of the tree. Döllner and Buchholz [
24] proposed a building model with a continuous level of detail (denoted CLOQ buildings). The basic idea is that each part of the building (including facades) is stored as a separate object and that a user can select at which level of detail a building should be visualized. Zhang et al. [
25] developed a method of the progressive transfer of terrain surfaces and 3D objects based on wavelets.
Progressive data transfer can also be facilitated by sending a process description of how the geospatial objects should be changed. Sester and Brenner [
26] developed and demonstrated this strategy for 2D geospatial data. One advantage of this approach is that it (partly) enables continuous zooming [
27].
2.3. Generalization of City Models
There has also been extensive research on generalization methods, such as for populating multiple representation databases with geodata. Much of this work has concentrated on the generalization of single buildings [
28]. Theimann and Sester [
29] segmented a building in boundary representation into several parts where the parts are stored in a CSG representation. In later work, Theimann and Sester [
30] developed a method to optimize the size of the parts by adapting templates using the least squares method. Mayer [
31] and Forberg [
32] created a scale-space technique partly based on the morphological operators opening and closing to simplify the 3D building model. A half space model is used by Kada [
33] to detect the main outline of a building. The half-space-based segmentation method is then extended in Kada [
34] to include the roof structures, utilizing pre-defined roof types. Lu et al. [
35] suggested using a transition polygon to represent 3D buildings, but this method can only support flat roof structures. Fan and Meng [
36] generated 3D building exterior representation by combining the roof and ground plan. Their method is based on: (i) the ground plan being generated from the 3D building object and simplified; (ii) the roof polygons being merged and typified depending on their spatial relationships; and (iii) the building exterior shell being constructed by increasing the ground plan in height and intersecting with the roof structure. This approach is efficient for many simple structured buildings but will fail if there is one non-vertical wall structure. There have also been studies, for example by Baig and Abdul-Rahman [
37], on creating generalization routines to convert buildings from the different levels of detail in CityGML.
For building groups, Glander and Döllner [
38] developed a method to generalize all buildings within a city block, or other structures created by a hierarchical network, to a common building object. Their method pays particular attention to landmark buildings to improve the orientation capability of the model. Mao et al. [
39] developed a methodology of typification of building groups, based on minimum spanning tree structures, and Guercke et al. [
40] designed an aggregation method for buildings, based on optimization using mixed integer programming.
A specific case of building generalization is the conversion of building construction models [
41]. This conversion includes both semantic and geometric conversions which have to be treated simultaneously. Isikdag and Zlatanova [
42] provided a framework of how IFC objects (
IfcWall,
IfcWindow, etc.) can be used to generate CityGML objects in different LODs. For the semantic conversion, El-Mekawy et al. [
43] proposed the use of a unified building model which encapsulates both the CityGML and IFC models.
The evaluation of the quality of 3D geodata generalization has not received the same attention as 2D [
44]. One study by Mao et al. [
39] which is based on methods in pattern recognition develops a methodology to compare the original and generalized 3D data, based on Attributed Relational Graphs.
2.4. Storage Method of 3D City Models
Today, 3D city models are generally stored in object-relational databases, such as Oracle and PostGIS and, in most cases, these databases are extended with dedicated city model tools, such as 3DCityDB [
45] and DB4Geo [
46]. Strauss and Carey [
47] introduced object-oriented databases for 3D model management; these databases have also been used for 3D building applications [
48]. Kunde [
49] implemented the CityGML schema in an object-relational database. Zhang et al. [
11] proposed a 3D geospatial database engine based on Oracle 11 and a file system. Koch and Lowner [
50] recently used BaseX an XML database for CityGML. However, the CityGML schema is complex and leads to hundreds of tables in the database although most of these tables may not be used in most applications.
Cloud computing and NoSQL technology have been developed to provide high performance, big data storage, high scalability and high availability. These properties make the technology suitable for 3D model management. Luan et al. [
51] proposed a 3D model management strategy based on the Hadoop distributed file system to tackle the big data problem which 3D model management is facing. Sugumaran et al. [
52] developed and implemented a web-based 3D data processing system using Amazon’s EC2 cloud computing environment. Their tests demonstrated the advantages of cloud computing over traditional approaches in terms of time, cost and performance. Dobos et al. [
53] employed a NoSQL database (MongoDB) to store 3D models to assist public consultation. Han and Stroulia [
54] built their 3D data management system based on another NoSQL database called Hbase. Cloud computation methods, such as Map-Reduce, can be deployed on a NoSQL database to increase the analysis speed. It is suitable for big data applications, such as 3D city model generalization and visualization.
In this paper, we use the NoSQL database MongoDB to store multiresolution 3D building objects. MongoDB is document-oriented and schema-less, which is suitable for the integration of different XML-based 3D city model standards, such as KML and CityGML. MongoDB has previously been used in various applications such as building information modeling (BIM) applications. Dobos et al. [
53] developed a unified and integrated framework, called 3D Repo, which supports collaborative editing and the distribution of 3D assets, the results showing that MongoDB is suitable for 3D city model management. An advantage of NoSQL databases, in comparison with object-relational databases, is that they have a better capability for automatic data distribution and load balance. Furthermore, they are easier to extend and parallelize.
2.5. Visualization Frameworks for City Models
The fast visualization of 3D building models is essential for several applications, especially for online situations. The use of mobile devices, such as smart phones, to view city models also creates an extra demand for efficient methods of visualization. Due to the diversity of mobile devices, browser-based 3D visualization is widely required. X3DOM [
55] can integrate X3D with HTML5 and create interactive 3D scenes for the Web, similar to the way SVG currently works in 2D. Jung et al. [
56] indicate that X3DOM provides a single declarative developer interface, based on current web standards, and supports various back ends through a powerful fallback model for runtime and rendering modules. However, according to Mao and Ban [
57], the system performance of X3DOM reduces significantly when the number of complicated 3D buildings increases in online visualization. Therefore, it is important to find methods to generate lower LODs from higher LODs automatically by generalizing city objects. In addition, unnecessary details need to be hidden to avoid visual cluttering.
3. Methodology
In this study, we have developed a multiple representation structure BuildingTree (
Section 3.1), generalization methods to generate a BuildingTree (
Section 3.2), and storage and visualization methods for the BuildingTree (
Section 3.3 and
Section 3.4).
3.1. Multiple Representation Structure—BuildingTree
The multiple representation data structure BuildingTree in this study is a partial hierarchy; it is an improved and extended version of the independent level data structure in Mao et al. [
21]. The previous CityTree model is mainly generated for building groups or blocks in LOD1 or LOD2 by the aggregation operation while the current version of the BuildingTree is designed for building objects, where the data are stored in LOD3 and LOD4 models (as shown in
Figure 2):
LOD3 Exterior Shell (LOD3ES) is a detailed building shell models with boundary representation. This is an LOD3 model which has the basic content of an LOD3 model but only consists of the exterior shell. This model is stored as a boundary representation. Compared with LOD3, LOD3ES can provide high visualization similarity while greatly reducing the data volume. Meanwhile, the LOD3ES can be processed faster for CSG detection than LOD3 since the number of polygons are reduced.
CLOD—a total hierarchical multiple representation model stored in CSG representation. The model stores features in LOD1 to LOD3.
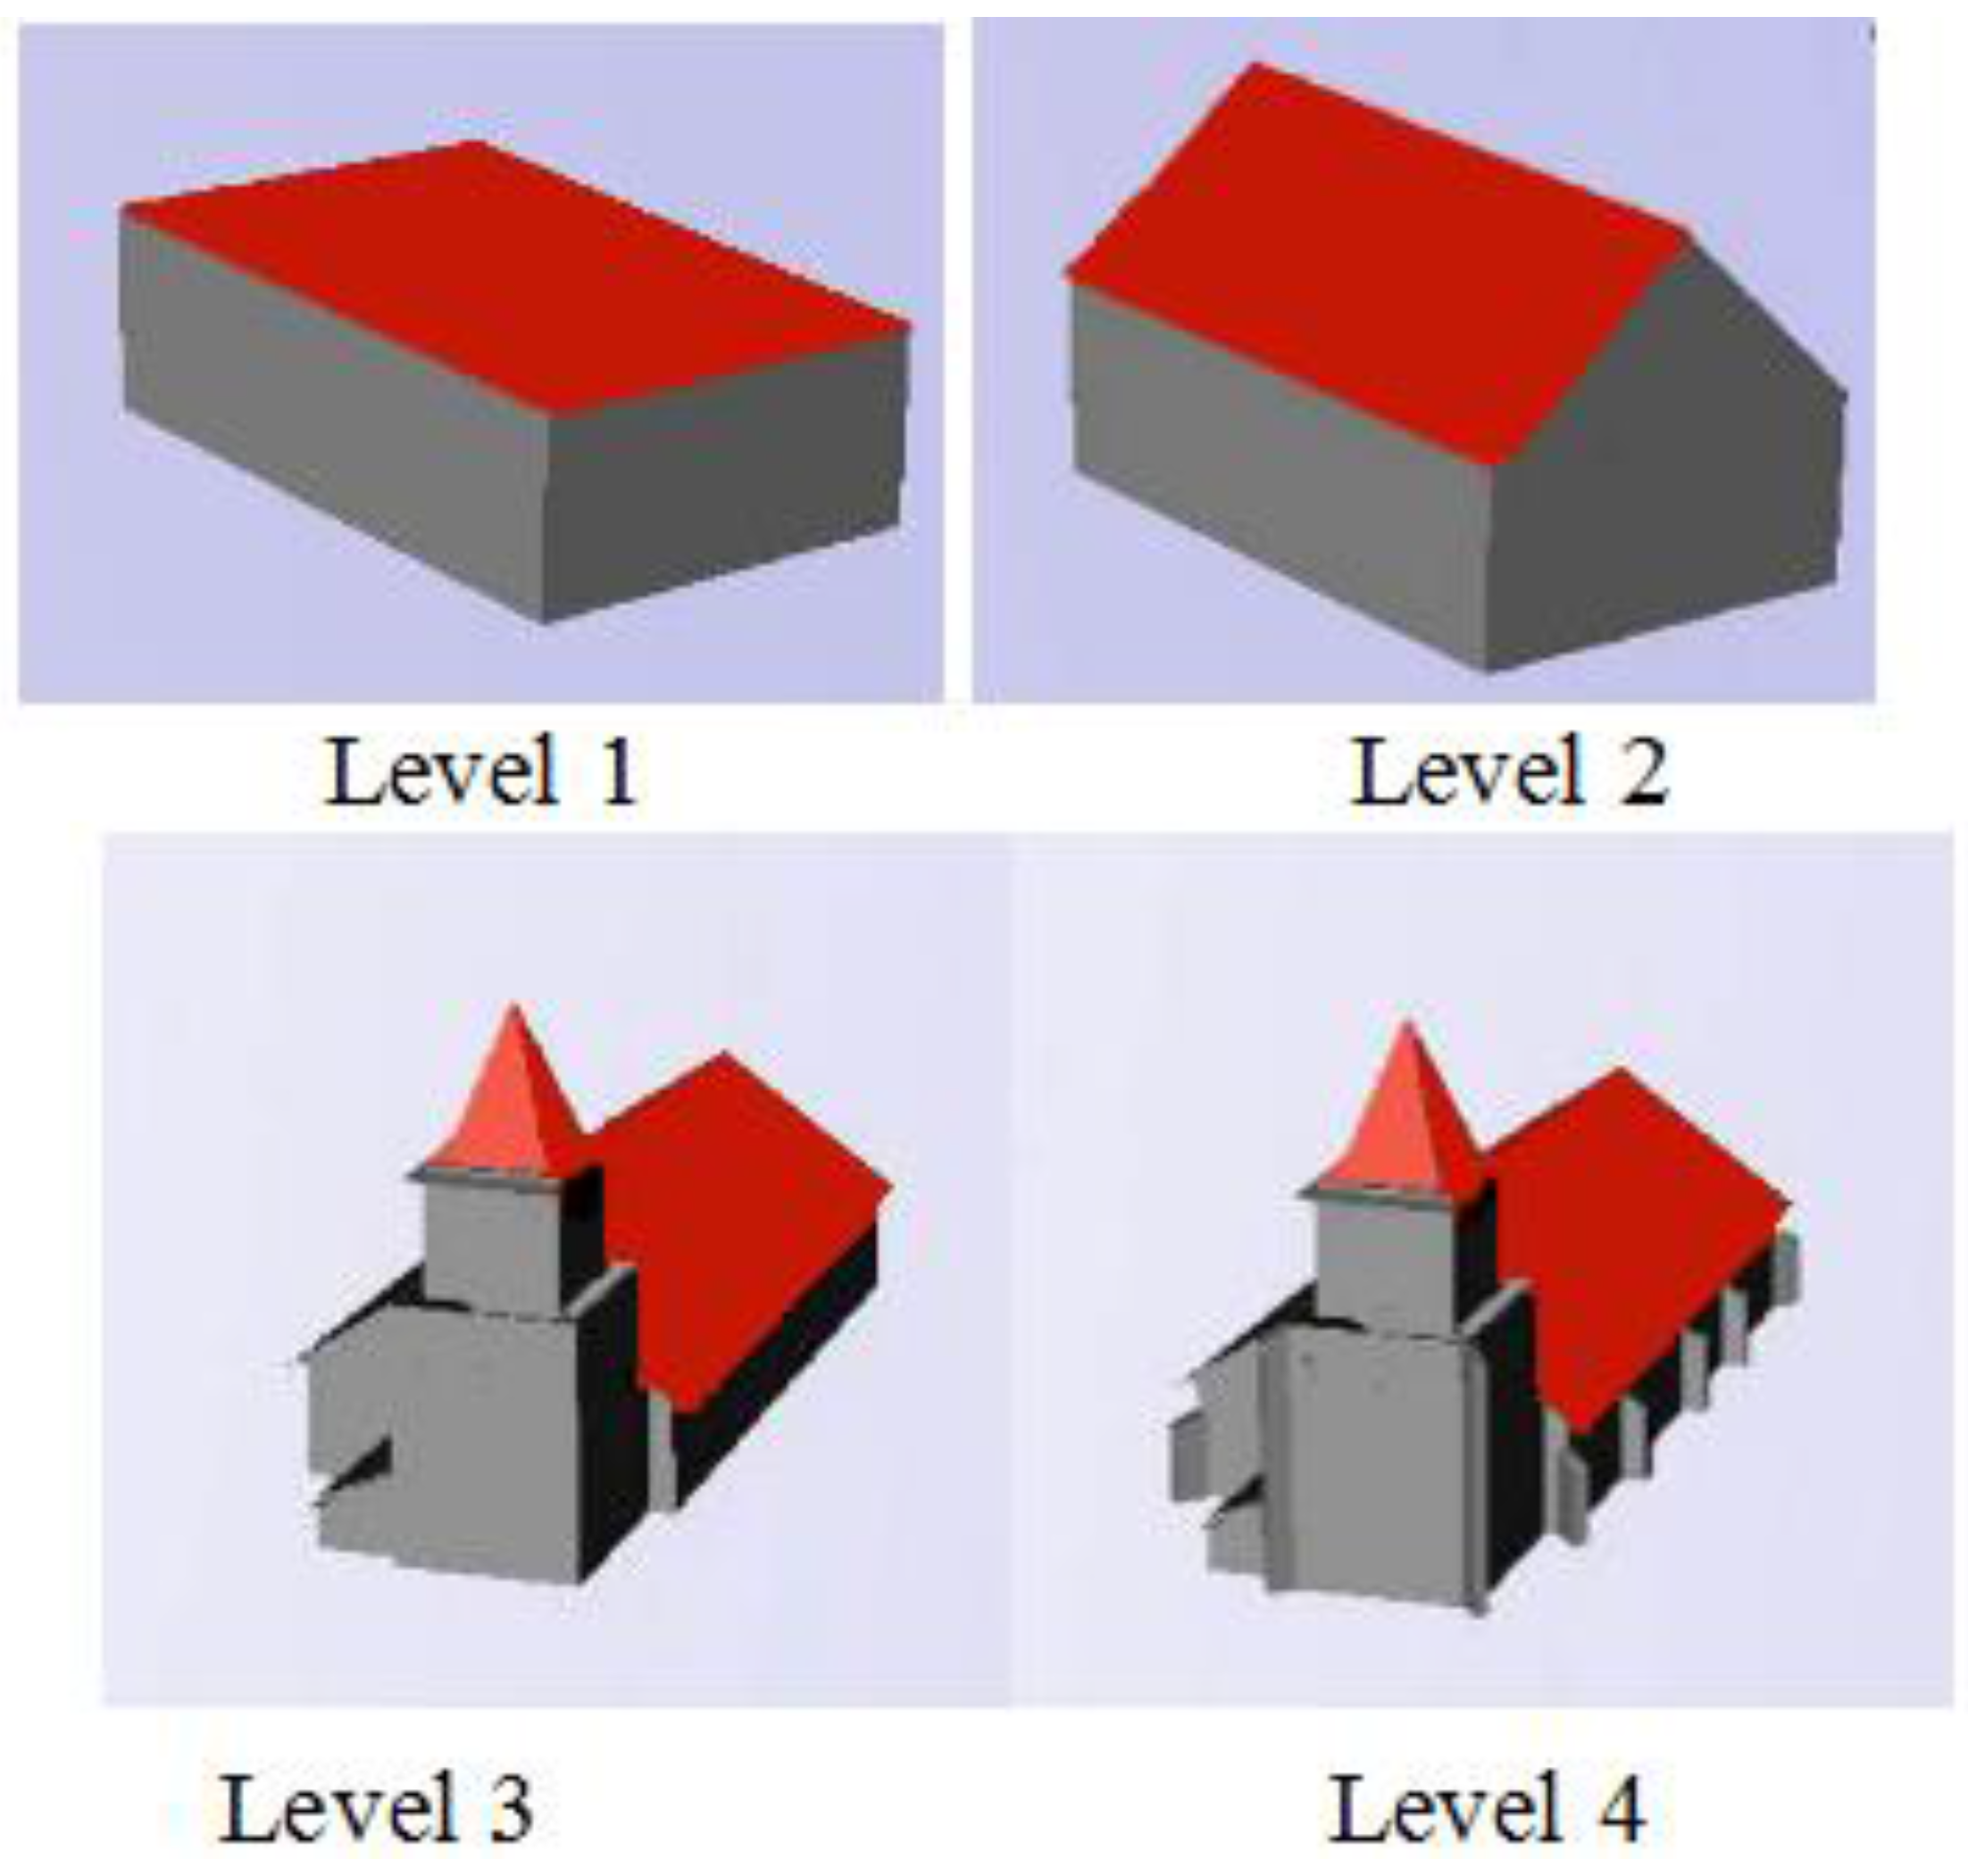
The CLOD sub-tree is built by the following four levels (
Figure 3). Leve1 1: box models of buildings (LOD1); Level 2: building roof structure (LOD2); Level 3: building parts (extensions of the ground plan, windows, doors, roof details etc.) that are larger than a threshold (large CSGs); Level 4: building parts that are smaller than a threshold (small CSGs). This implies that a building in CLOD is built by all four levels. A higher level can only be shown if all the lower levels are shown. However, there is no ordering of the elements within each level. The elements that will be transferred and visualized on a level is dependent on the user’s position. The distance between the user’s position and the model is calculated to determine the visualization levels of the model. In this study, only landmark buildings have all four levels. For ordinary buildings, levels 3 and 4 can be merged.
It should be noted that the BuildingTree only stores limited semantic information (e.g., private or public). The reason that not more semantic information is stored is that the BuildingTree is only used for visualization, and the rich semantic data that are available in e.g., CityGML models are not necessary. However, a BuildingTree contains the reference to the original LOD3 or LOD4 model which means that semantic information could be added to the model. The preservation of the semantic data could benefit further interactive visualization and analysis.
The P-Tree structure presented in [
23] is mainly focused on the multiple buildings or building groups while our method deals with single buildings. In [
24], the CLOQ (Continuous Level of Quality) is composed by floor, wall and roof structure, while in this paper, the CLOD is composed of CSGs which represent a part of building including floor, wall and roof structures.
3.2. Generalization Methods to Generate a BuildingTree
The BuildingTree is automatically generated from detailed models in LOD3 (which are stored in boundary representation). This generation is done stepwise. First, LOD3ES is generated from the LOD3 model. Then, the total hierarchical structure CLOD is generated from LOD3ES.
3.2.1. Generating the LOD3ES Model from LOD3
LOD3ES is automatically generated from LOD3. The method used is based on the tree step process described in Fan and Meng [
36] (see
Section 2.3).
3.2.2. Generating the CLOD Model from LOD3ES
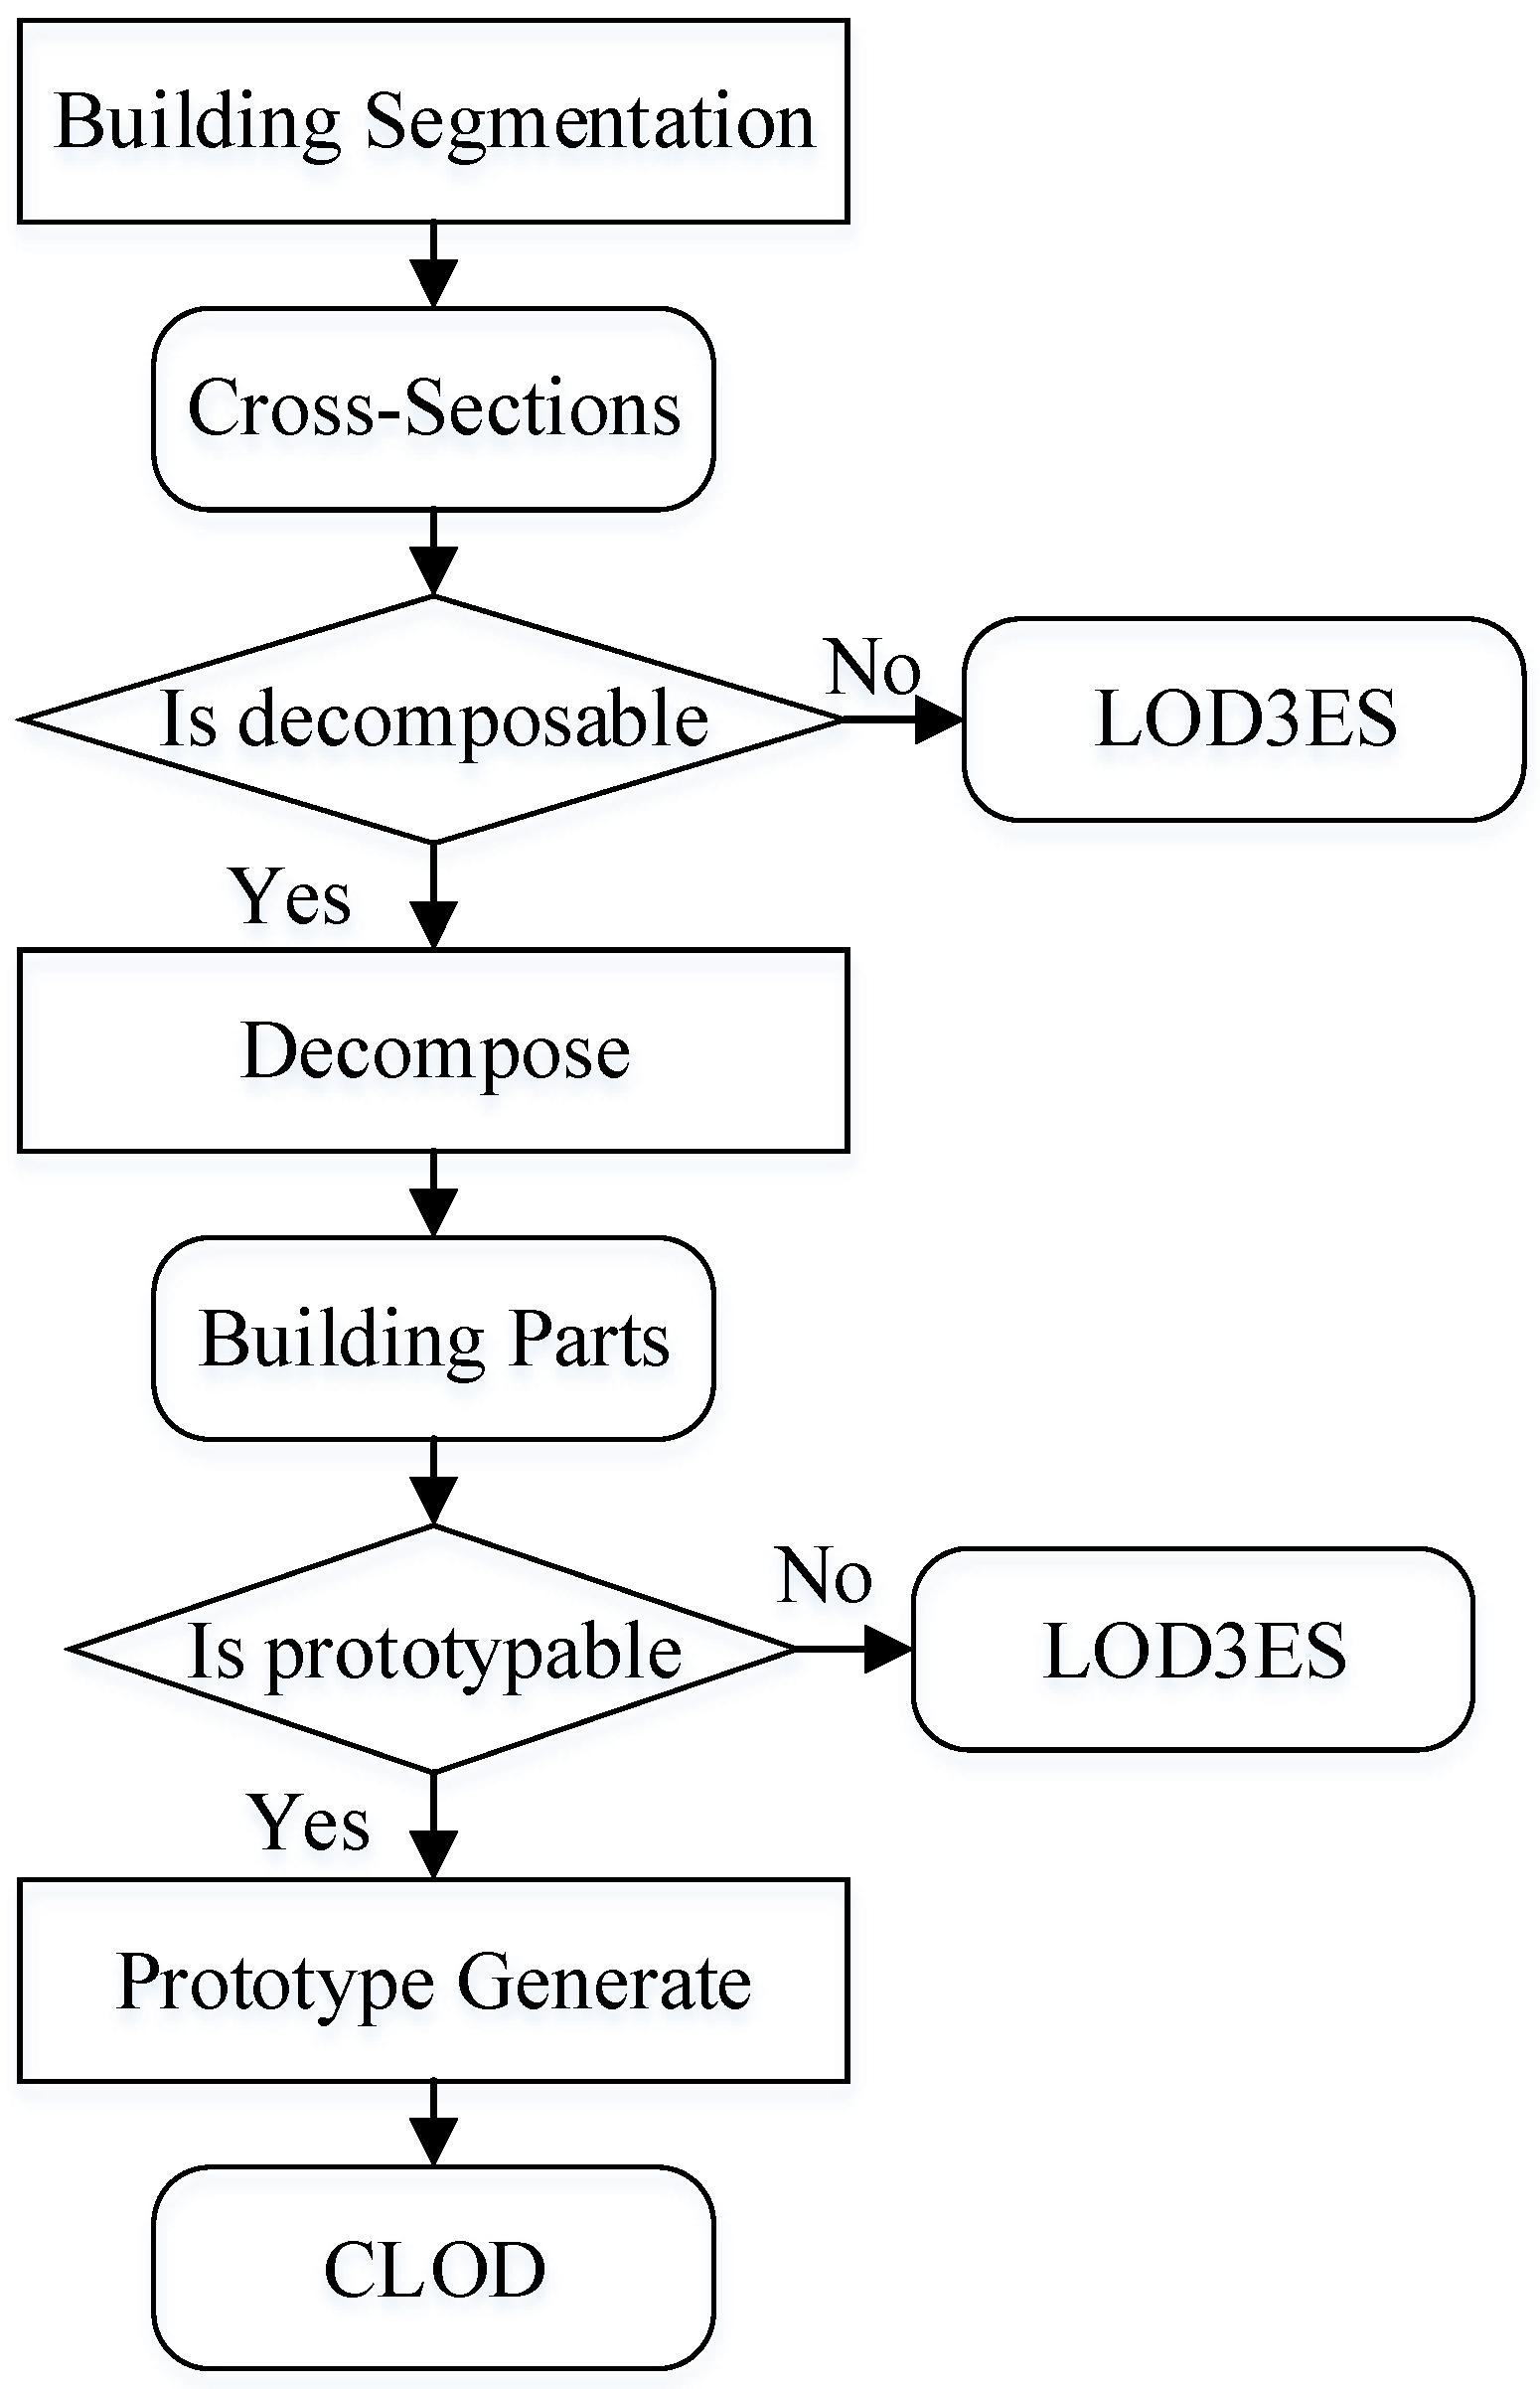
The generation of the CLOD model from LOD3ES is only done for 3D building objects that are sufficiently regular to be decomposed (as shown in
Figure 4); building objects that are not decomposable (those that have a round shape or other non-rectangle structures) are preserved as LOD3ES. For regular building objects, the basic approach in this step is to identify the building parts in the LOD3ES model and store them in a total hierarchical data structure. The generation of the CSG representation CLOD is done in three steps:
building segmentation,
decompose cross-sections and
prototype extraction and classification.
Building Segmentation
The segmentation process starts by identifying cross-sections using Algorithm 1, i.e., all points in the building geometry are grouped if they are the same height (or a height within a threshold distance). Currently, the cross-sections method can only deal with the horizontal structure, and the vertical or non-horizontal method will be further studied in future work. The input of the algorithm is Point Set (
CS) and the output is a list of cross-sections that are composed of its 3D points. In
Figure 5, the original building is modelled with three horizontal cross-sections (AA′, BEE′B′, and CDD′C′). Then, each cross-section is classified into one of three classes: polygon (if the nodes are in a horizontal polygon of the building, for example BEE′B′ in
Figure 5a), line (if the nodes are connected, for example AA′ in
Figure 5a) and point (e.g., a top of a pyramid tower). The generated point set is ordered and saved according to the polygon, therefore, the plane can be recreated from the point set.
| Algorithm 1: Building Segmentation. CLOD generation workflow |
- 1.
procedure Segmentation(CS) - 2.
Cross_Sections = [ ] - 3.
for all c in CS do - 4.
isInserted = False - 5.
for all cross_section in Cross_Sections do - 6.
if isSameHeight(c, cross_section) then - 7.
insert(cross_section, c) - 8.
isInserted = True - 9.
end if - 10.
end for - 11.
if not isInserted then - 12.
new_cross_section = [ c ] - 13.
insert(Cross_Sections, new_cross_section) - 14.
end if - 15.
end for - 16.
return Cross_Sections - 17.
end procedure
|
Decompose Cross-Sections
The next phase is to decompose each cross-section into parts using Algorithm 2. The input is detected cross-sections and the output is decomposed parts. Firstly, the cross-sections are simplified by rules such as:
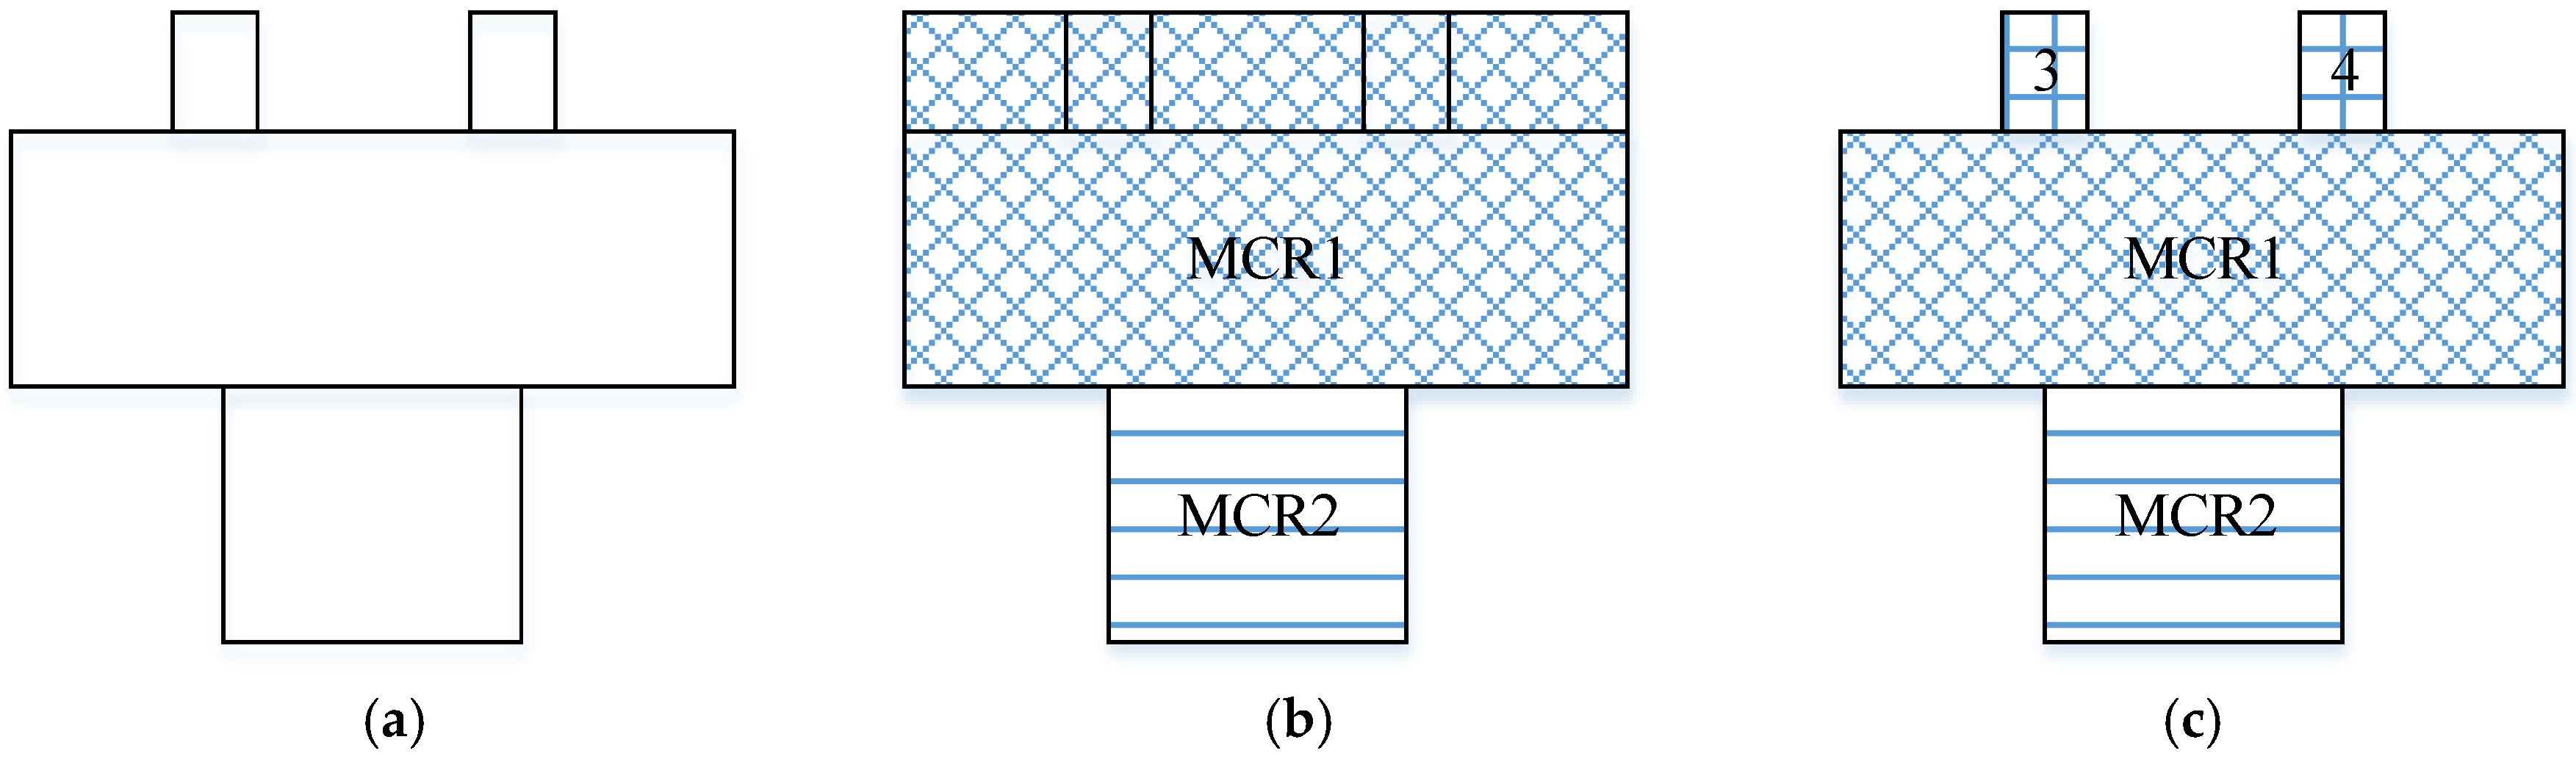
The next step is to approximate the cross-sections with a set of rectangles using a method based on Minimum Containing Rectangular (MCR). The MCR is defined as the minimum area rectangle (where the sides in the rectangle are parallel with the axis of the coordinate system) that covers the polygon (in this case the cross-section). To deal with the situation when the polygon is not aligned to the main axes, we rotate the polygon according to each edge so it is aligned to the main axes. After the calculation, it will be rotated back. The original cross-section is represented by a set of MCR. If the area difference between the cross-section and the generated MCR set is larger than the threshold (20% of total area; denoted
min_Area in Algorithm 2), the cross-section will be marked as not decomposable and the CLOD will not be generated for the building. To generate the MCR set of a cross-section, we continuously segment the cross-section with edges and select the maximum reduced area; an example is given in
Figure 6.
| Algorithm 2: Cross Section Decompose. The procedure Generalize is defined as in [36] |
- 1.
procedure Decompose (Cross_Sections) - 2.
results = [ ] - 3.
for all cross_section in Cross_Sections do - 4.
if bbox(cross_section) < min_Area then - 5.
remove(Cross_Sections, cross_section) - 6.
else - 7.
gcs = Generalize(cross_section) - 8.
parts = getMCR(gcs) - 9.
insert(result, parts) - 10.
end if - 11.
end for - 12.
return result - 13.
end procedure
|
The pseudocode of MCR is given in Algorithm 3 in which getMCRArea is the function to calculate the Minimum Containing Area of a point set. To calculate the MCR area, the rotating calipers method is employed [
59]. The input of the getMCR is generalized cross-section (
gcs) and the output is decomposed minimum containing rectangles to present the
gcs.
| Algorithm 3: Minimum Containing Rectangular |
- 1.
procedure getMCR (gcs) - 2.
d_area_max = 0 - 3.
results = [ ] - 4.
area_gcs = getMCRArea(gcs) - 5.
if area_gcs < d_min then - 6.
insert(result, gcs) - 7.
return results - 8.
end if - 9.
for all ls in gcs.edges do - 10.
c1, c2 = segment(gcs, ls) - 11.
area1 = getMCRArea(c1) - 12.
area2 = getMCRArea(c2) - 13.
d_area = area_gcs - area1 - area2 - 14.
if d_area < d _area_ max then - 15.
c1_max = c1 - 16.
c2_max = c2 - 17.
d _area_ max = d_area - 18.
end if - 19.
end for - 20.
if d_area_max < d_th then - 21.
c1r = getMCR(c1_max) - 22.
c2r = getMCR(c2_max) - 23.
insert(result, c1r) - 24.
insert(result, c2r) - 25.
return result - 26.
end if - 27.
end procedure
|
In Algorithm 3,
d_Min is the threshold area that the polygon will be further segmented into. If the MCR area of the input polygon is smaller than
d_min, it will not be further segmented and directly inserted into the result list. getMCRArea is a procedure that calculates the minimum containing rectangle area of the input polygon.
d_area_max is used to select the segmentation that can reduce the area most.
d_th is a predefined threshold that is used to determine if the segmentation is in effect. For example, after the segmentation, if the reduced area (
d_area_max) is bigger than
d_th, it means that the segmentation is worth as shown in following
Figure 6b. Otherwise, in
Figure 6c the reduced area (
d_area_ max) is too small (<
d_th) meaning that the segmentation is not necessary. This function computes a set of rectangles that together constitute a simplified cross-section.
The computational complexity of the rotating calipers method is O(
n) where
n is the number of points [
59]. The segmentation number is the number of edges in the cross-section, which is also less than
n. Then the complexity for each around is O(
n2). After the segmentation, the number of points and edges is not increased. Therefore, in worst cases, the overall complexity is less than O(
n3). In further analysis, according to the definition, the time complexity of cross-section decomposition algorithm is mainly composed by generalization and getMCR functions. Suppose a cross-section contains
n points. The generalization algorithm according to [
36] is O(
n2). In the getMCR function, the complexity of getMCRArea is O(
n2) according to the [
59], so the complexity of segmentation edge selection part in getMCR is n*O(n
2) = O(n
3). Meanwhile, the function getMCR is recursive; it segments the polygon into two parts and computes the getMCR respectively. Because in each segmentation the area reduction is more than
d_th, the number of segment rounds is smaller than a constant (polygon_area/
d_th). Therefore, the overall complexity of getMCR is O(
n3).
Prototype Extraction and Classification
The CSG representation is generated from the cross-sections using a symbolization method. One example is provided in
Figure 5 where the building is replaced by a combination of a box and a triangular prism (
Figure 5c). The symbolization method works as shown in Algorithm 4 in which the input is decomposed rectangular parts and the output is the detected set of prototypes.
| Algorithm 4: Prototype Extraction |
- 1.
procedure Prototype (CS_parts) - 2.
results = [ ] - 3.
part_org = CS_parts - 4.
while notEmpty(part_org) do - 5.
p = delete(parts_org) - 6.
proto_parts = selectTop(p, CS_parts) - 7.
proto = generateProto(proto_parts) - 8.
insert(result, proto) - 9.
end while - 10.
return result - 11.
end procedure
|
First, mark all cross-section parts (CS_parts) as non-processed (Parts_org). Select p from the non-processed list Parts_org and remove p from it.
Then, select the proto parts from the cross-section parts (CS_parts) that have the closest higher z value and can be vertically projected into p (selectTop function). For example, in
Figure 5, the proto parts results of the cross-section part CDD′C′ is BEE′B′ and the selected results of BEE′B′ is AA′.
Finally, for different proto parts, generate the representation respectively. Currently, we implement box (two identical rectangles of different heights), gabled roof (one line and one rectangle of the same length), hip roof (rectangle with a shorter line), and tower (one point and one rectangle). The prototype can be extended in further applications to support more CSG geometries.
If the rectangular parts are not the same for the two cross-sections, the situation becomes more complicated; typical examples are the roofs. To represent as many roofs as possible with a limited number of geometric prototypes, the roofs can be separated into more primary parts using the standard geometries in
Figure 1. By combining and transforming these geometries, we can construct a large proportion of the common roof structures. However, in many cases, it requires several geometries. If, for example, the basic geometric prototypes in
Figure 1 are used, a gabled roof can be typified using one triangular prism and four rectangular pyramids. To avoid this large number of geometries in our study, we define a prototype for a gabled roof structure which enables us to model such a roof with only one prototype. The disadvantage of this is that a prototype definition has to be created and also several transformation parameters have to be handled. But in these cases where a geometry is very common, such as gabled roofs, this is often more efficient. Currently, the prototype is defined by hand, based on the experiences of the 3D city model maker. If the geometry cannot be typified, this part will be represented by a polygon.
When the prototypes are created, they are classified into levels (see Section 3.1). The box created by the largest MCR (denoted main MCR) of the first cross-section is classified as level 1 (LOD0). The roof prototypes (defined by hand) are classified as level 2. Finally, the remaining prototypes are classified as either level 3 or 4 depending on their sizes (and possibly also building type).
3.3. Storage Methods of the BuildingTree
Figure 7 shows the storage system architecture. Since city models can be generated from different sources, the storage system should support multiple formats for data input. In this study, CityGML is selected as the standard for 3D city dataset integration. Meanwhile, a 3D visualization format such as Collada and X3D are also supported. 3D city/visualization data in different formats are first read into the system with specific parsers; for example, we use citygml4j for CityGML files, xj3d for X3D files and j3d for KML and Collada files. Then, the geometry content and semantic features (if any) of the input 3D models are extracted and stored in the NoSQL database in JSON format which can support different schemas for different models (for more details, refer to
Section 4). In this paper, we employ the polygon set to present the geometry data which is consistent with CityGML. For example, all buildings have common features such as ID, type, centroid, height and so on, but one building may have the feature “owner” while the others do not. The data on all these buildings can be stored in a collection of NoSQL, which is not supported in a table of relational databases since its columns have to be predefined. Furthermore, to simplify the 3D data storage, we export the 3D polygons as raw text which can be easily imported into programming languages (Python or Java) as polygon list objects.
3.3.1. NoSQL Databases—MongoDB
To store the 3D city models, a database is required. Compared with relational databases such as Oracle, MySQL or PostgreSQL, it is better to store the dataset in the cloud environment, considering extensibility. MongoDB is a cross-platform, document-oriented database built for the cloud environment. Classified as a NoSQL database, MongoDB eschews the traditional table-based relational database structure in favor of JSON-like documents with dynamic schemas (MongoDB calls the format BSON), making the integration of data in certain types of applications easier and faster. Here, we build a MongoDB framework for city models using four computers as a cluster. This structure can be easily extended by adding more data nodes to support larger and more cities.
Then, the web server side can employ the MapReduce programming method to communicate with the database. MapReduce is suitable for parallel computing and can take advantage of the server cluster. The MapReduce framework is widely applied for big data processes. It can divide the work loads of an operation, such as searching or analysis, onto multiple computers and run the process simultaneously. The MapReduce framework can increase the analysis speed by adding more computers to the system, which is usually achieved by replacing the existing system with better machines. MongoDB supports the MapReduce framework which will improve the process performance for big city models.
3.3.2. Generation of the CLOD BuildingTree Model
The BuildingTree structure combines the generated LOD3ES and CLOD models. In the BuildingTree, the metadata is used to determine which of the LOD3ES or CLOD models should be visualized based on the stored height, area (defined as projected area on the ground) and location (building centroid) and the metadata are used in dynamic visualization to determine how many parts from one building (in CLOD model) should be loaded into the client browser from the server. This will reduce the loading time and reduce network traffic which is important in a mobile situation. Furthermore, the metadata store pointers to the LOD3ES and CLOD models.
The leaves of the BuildingTree are defined below. The attribute values are stored in normal text and the pointers to other leaves in Roman style, e.g.,
lod3es and
clod are references to the LOD3ES and CLOD.
BuildingTree root = {id, lod3es, clod, Metadata}
lod3es = {building_id, polygon set of building exterior shell}
clod = {building_id, CSG1, CSG2…CSGn}
Metadata = {location, area, height, type, lod3es_info, clod_info}
lod3es_info = {size, number_of_polygons}
clod_info = {number_of_CSGs}
CSGi = {area, height, type, scale, centroid, rotation}
The metadata containing the root of the BuildingTree is actually an index that can be used to determine how many details should be loaded in the visualization. The CSG are stored in the CLOD as a tree structure. In our implementation, a building usually has less than 5 CSG parts which are ordered by their volume (area*height). The size of the BuildingTree root is small compared to the models, therefore, we could load all the roots in a nearby area, based on which of the 3D data of LOD3ES or CLOD can be dynamically loaded.
3.3.3. Storage of BuildingTree in MongoDB
The multiple representation data are stored in three collections in the NoSQL database (similar to tables in the relational database):
BuildingTree: The BuildingTree collection contains information on the multiple representation data.
CLOD(CSG): This collection stores the CSG attribute data of the building parts, such as type, centroid, orientation, etc.
LOD3ES: This collection stores the 3D exterior shell representation of a building or a generalized building group.
The reason for separating the two latter collections in this study is performance. The querying of the data is mainly implemented on the Geo collection which supports a 2D geospatial index. It should be noted that the NoSQL database does not support joint operations between collections. It is therefore vital that the CLOD(CSG) table contains all the relevant information used in the data search. In other words, semantic information on the building is stored in the Geo table; 3D geometry data is stored in the 3D table (a structure used to store the 3D geometry data) and its dynamic visualization structure is stored in the BuildingTree.
Querying on 3D information is implemented by a map-reduce method. Since the map-reduce method makes full use of parallel computing, it is suitable for the large volume of 3D data.
3.4. Visualization Frameworks for the BuildingTree
For the flying through application, the computation for visualization is heavy as the city scene changes rapidly. To support this, a preloaded BuildingTree is necessary, while for ground users such as road navigation, the proposed BuildingTree structure can be loaded online which may save quite a bit of storage on local devices. The main challenge with the visualization framework is to provide the user with a proper view of the buildings (without abrupt changes in the geometric representations) with a minimum of data transfer.
Figure 8 is an Unified Modeling Language (UML) sequence diagram to illustrate the interaction between user client and 3D model server. The blank box represents a delay or the processing time on the client side. The visualization rule should be defined according to the specific application requirements. The basic rules proposed in this paper are summarized from the visualization aspect in which visual similarity is the main consideration. In this framework, the client first requests a 3D city model, then a BuildingTree without 3D geometry data related to the selected city area will be supplied. Based on this BuildingTree, the client can calculate which buildings are necessary for the visualization. In this framework, users have more flexibility to adjust the 3D visualization strategy. In other words, 3D rendering is determined more by the user side than the server side. The BuildingTree allows the user to decide which buildings and which levels should be transformed from the server, according to the bandwidth, memory size or current CPU status.
The following are the basic rules for the user by which to select the 3D models that should be transferred.
The Level 1 and Level 2 prototypes which should be displayed are only determined by a distance threshold from the user’s position.
For the Level 3 (and 4) prototypes, only the features that are potentially seen from the user’s position are shown. These features are ordered by importance (as defined by the size of the features) and the most important feature is transferred first.
4. Case Study
4.1. Implementation
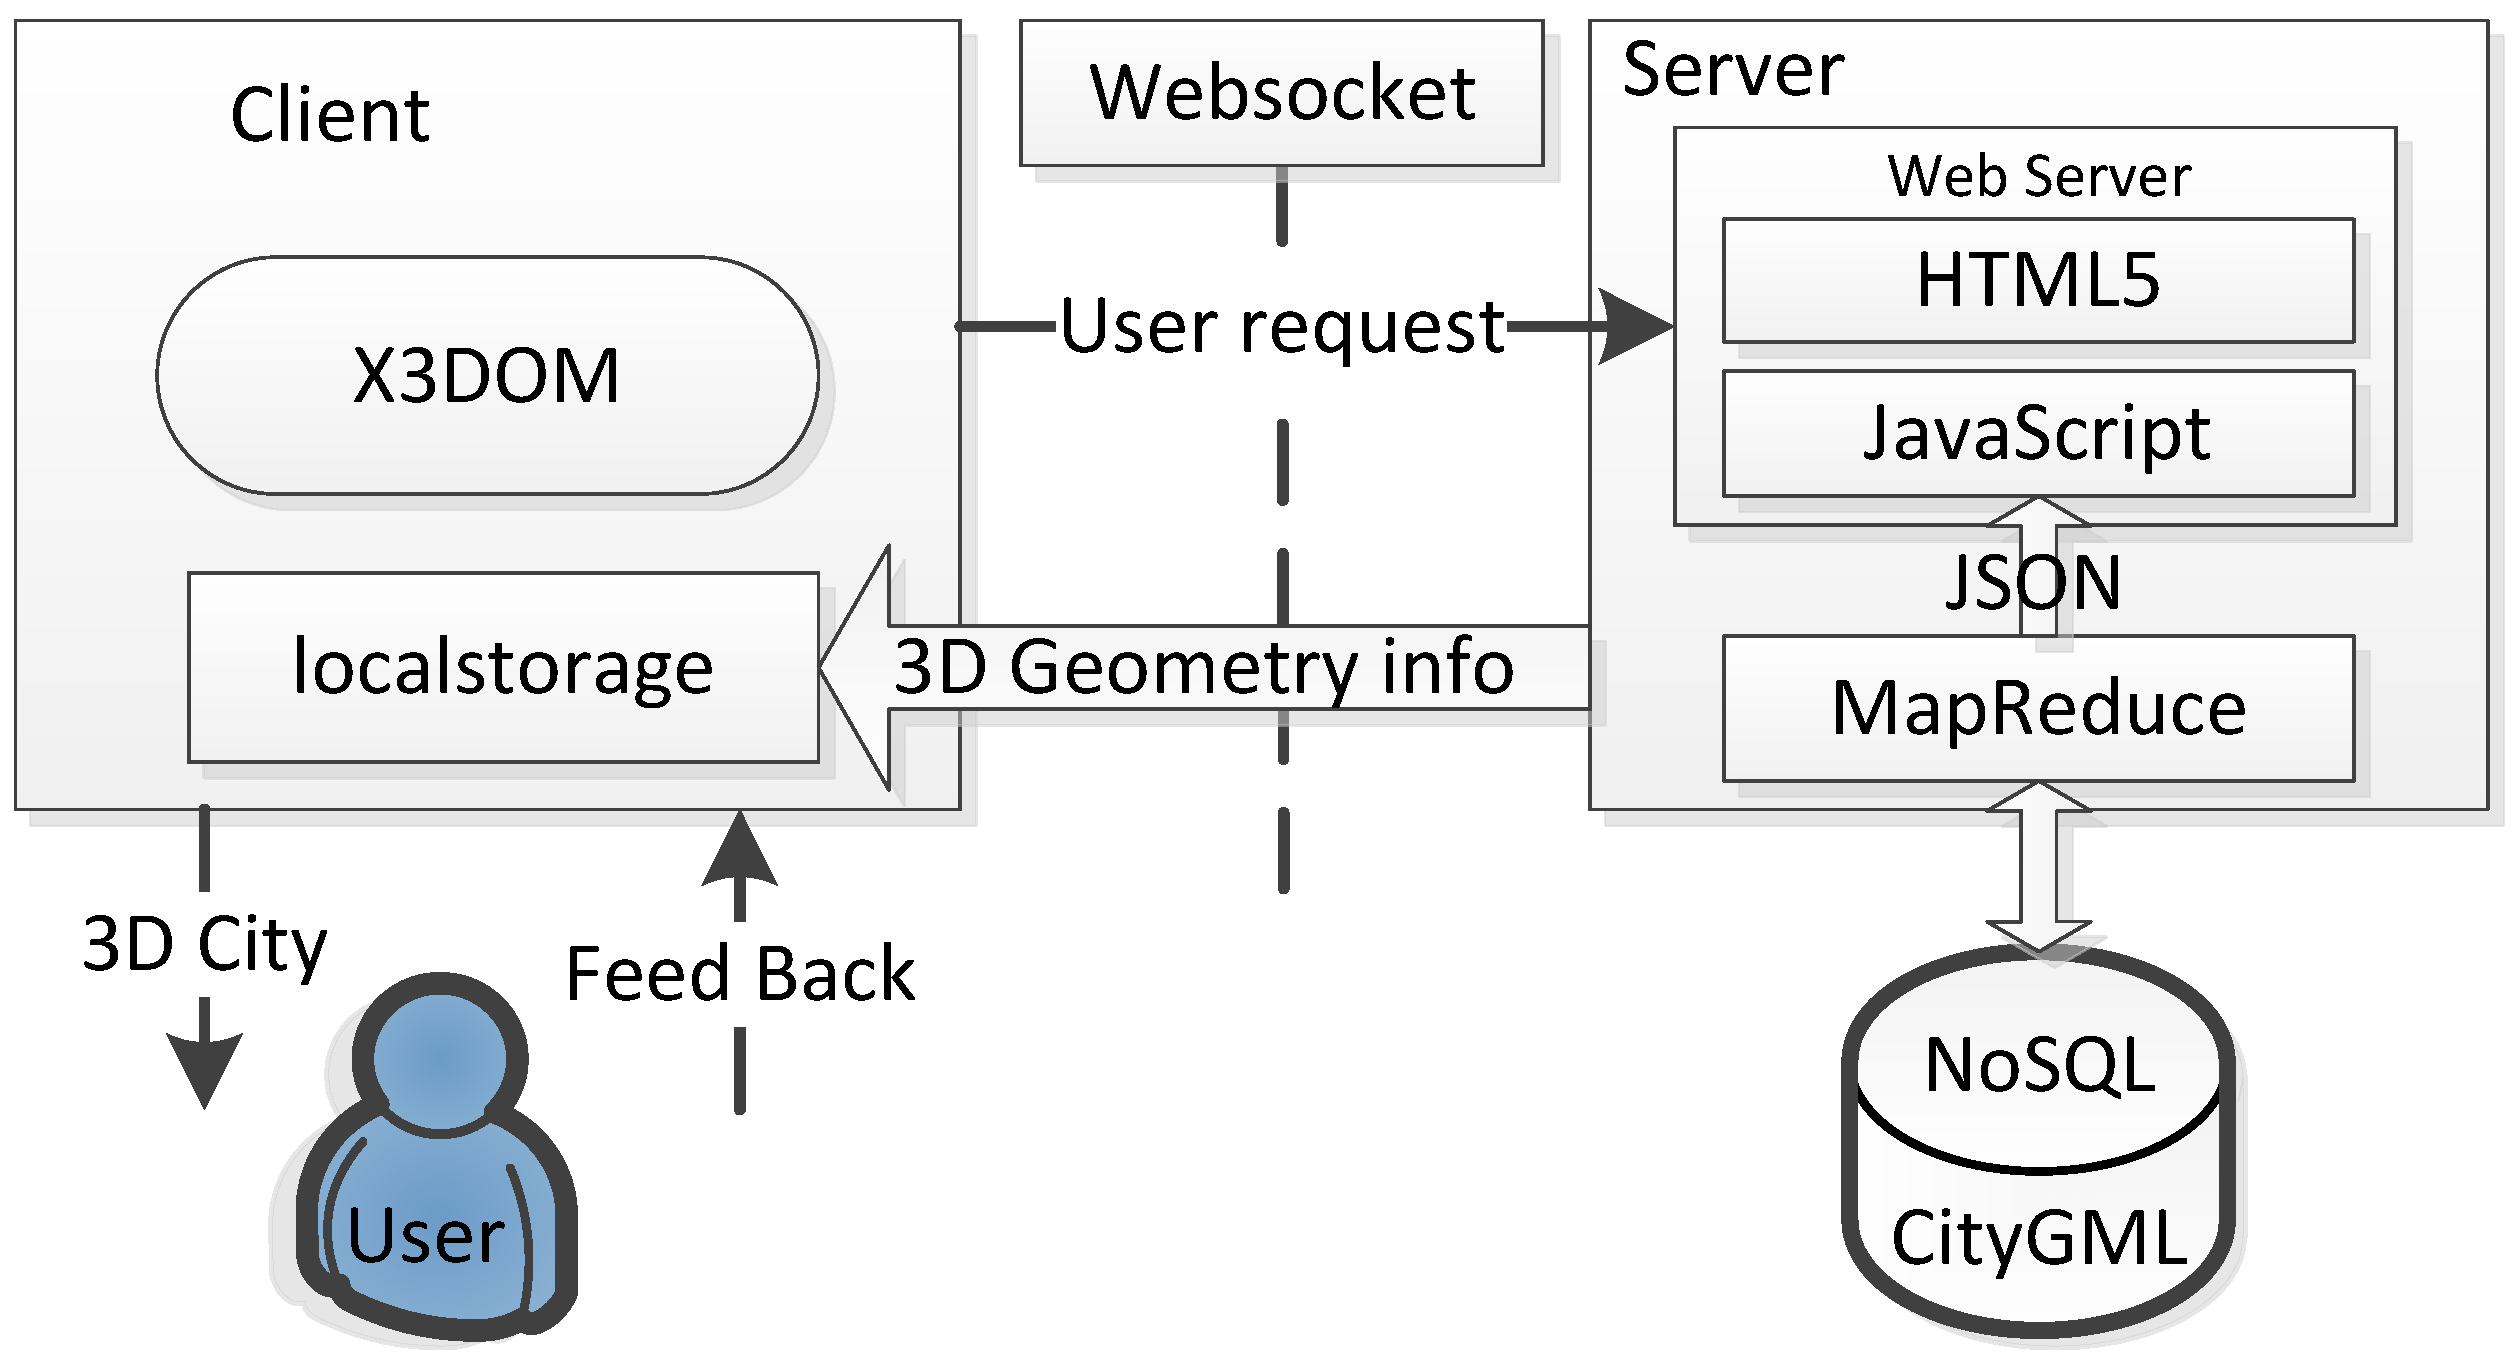
To evaluate the efficiency of the proposed BuildingTree, we implement an online framework (
Figure 9). The implementation is based on open standards and tools. The feedback from the user is mainly the operation or interaction between the user and the 3D models such as zoom in/out, move, turning and etc.
Details of the implementation. The generalization routines are developed in Java utilizing, for example, the geometry library JTS [
60] and citygml4j [
61]; the development environment is Eclipse 3.4.1. The server is a PC with Inter 2.4 GHz Core2 Duo CPU, 2.39 GHz 3.25 GB RAM, and Microsoft Window XP SP3. The client is a smart phone MX2 from Meizu with an Android 4.1 operation system, Samsung 1.4 GHz CPU, and 2 GB memory. The 3D models are visualized with X3DOM through the Firefox 21.0 browser for Android.
The web server is Nodejs, a JavaScript-written web server using event-driven, asynchronous I/O to minimize overhead and maximize scalability.
Nodejs supports Websocket and other HTML5 features through extension modules. It also can integrate MongoDB queries and MapReduce operations within the existing modules. These modules in Nodejs can be easily installed by Nodejs Package Management (npm) functions, which makes the development much faster and easier.
4.2. Test Data
We use a dataset in LOD3 of a 3D city model of Ettenheim in Germany from CityGML.org (
Figure 10). This dataset is in CityGML 1.0, which can be converted into CityGML 2.0 with Application Programming Interfaces (APIs) such as citygml4j. In this paper, we directly read the CityGML file and extract its semantic and geometric information with the Python XML library lxml.
4.3. Generation of the BuildingTree and Visualization Result
The aim of this section is to provide details of all levels in the generation of the BuildingTree. Of special interest is the visualization result, i.e., the visual properties of the buildings in each level. Another important aspect is the data storage in all the levels.
4.3.1. LOD3 to LOD3ES
From LOD3 to LOD3ES, all exterior polygons are preserved, therefore the generalized model looks similar to the original model.
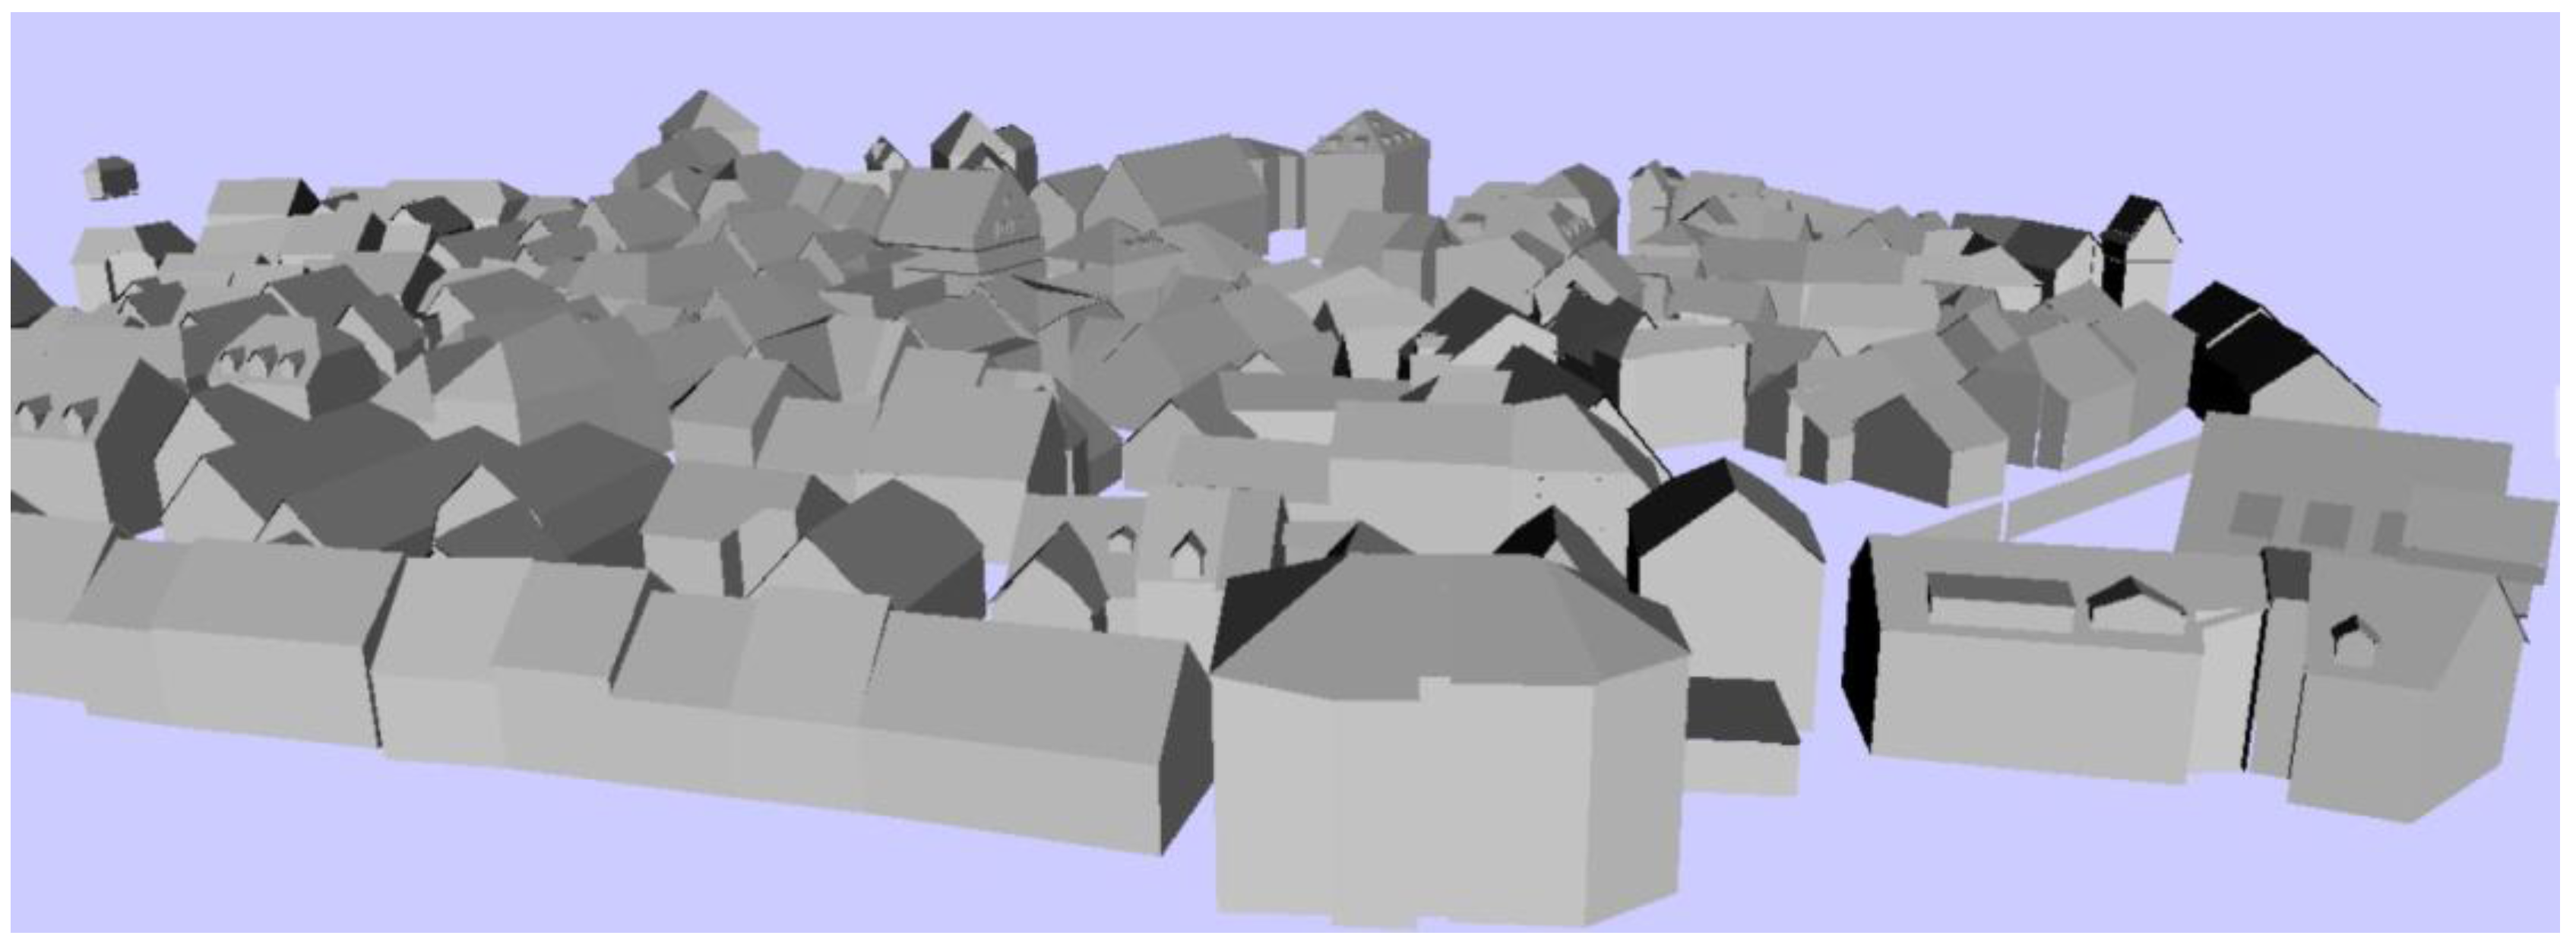
Figure 11 shows the generalized 3D city models which contain 192 buildings. The size of the model in X3D is 1.6 MB (34,856 points and 7583 polygons), while the original model is 15.1 MB (327,198 points and 73,840 polygons).
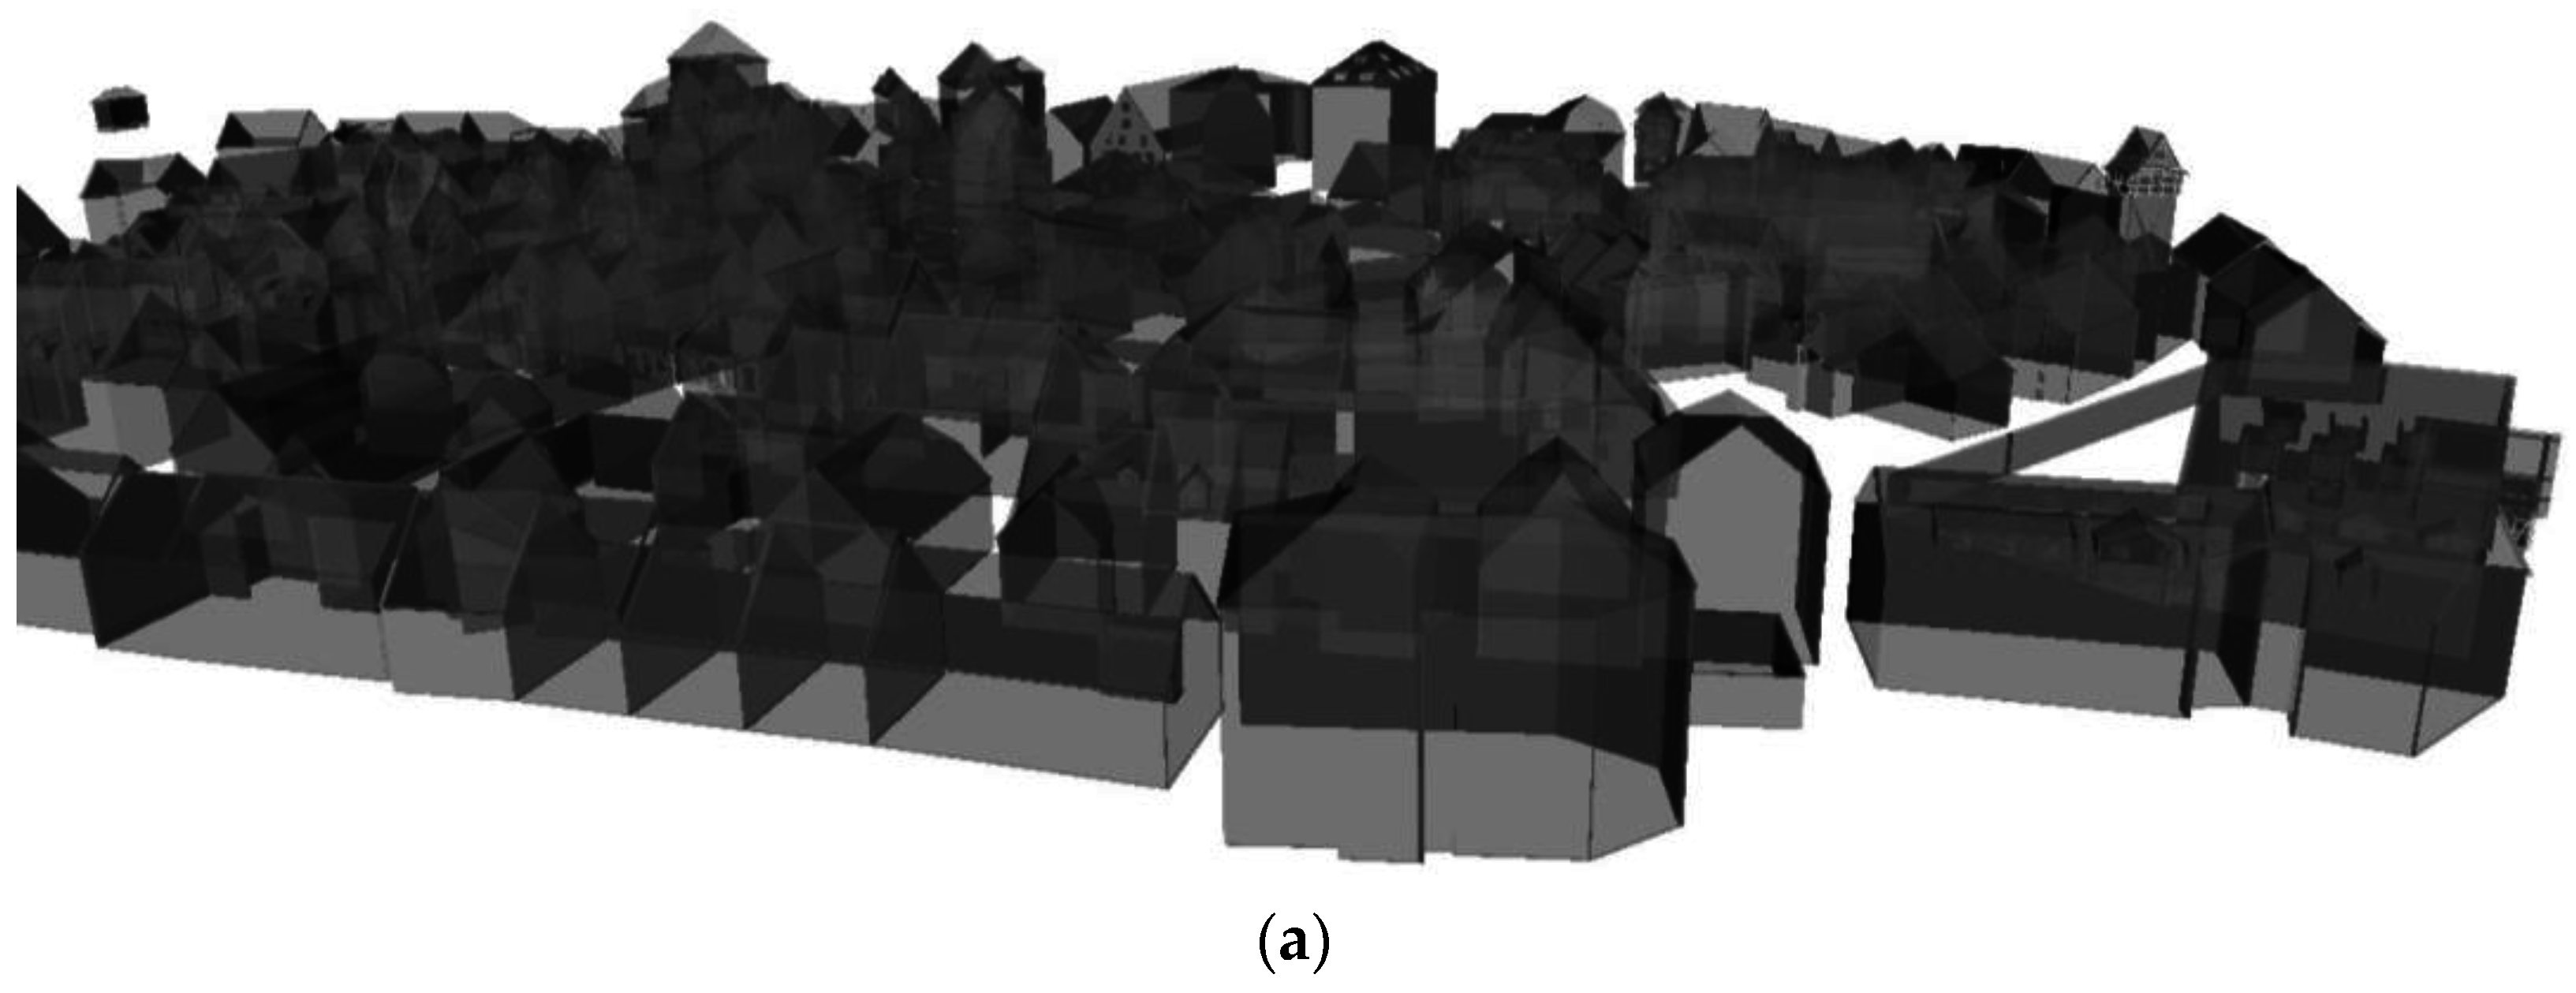
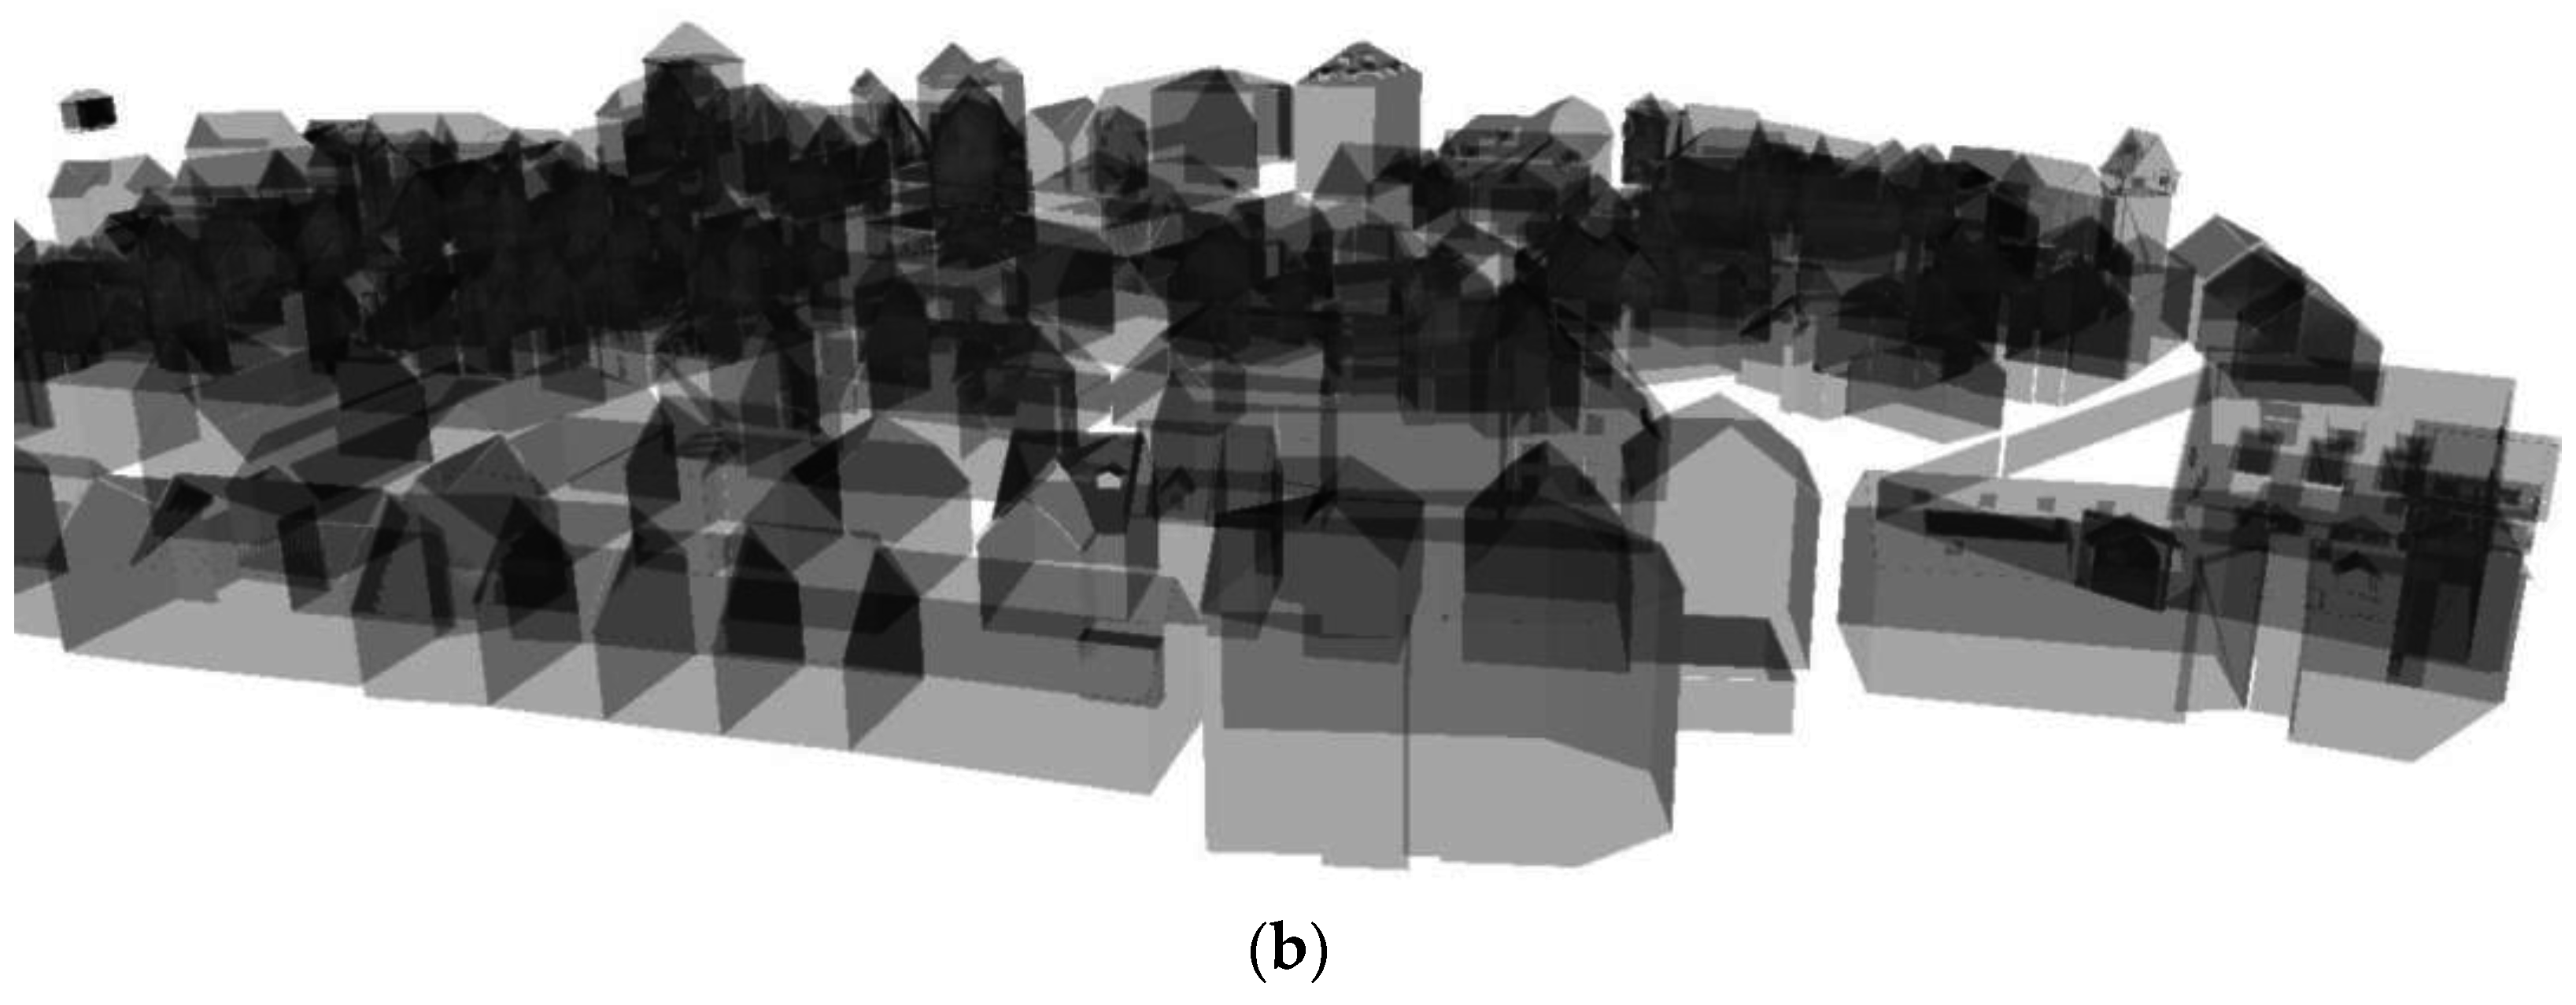
Figure 12 compares the LOD3 and LOD3ES model in transparency visualization, clearly showing that in the same transparency level (0.5 in this paper), the LOD3 model contains many more polygons than LOD3ES.
4.3.2. LOD3ES to LOD2
To generalize the 3D buildings, we generate the prototyped represented buildings (CSG representation or LOD2) from the LOD3ES models. The generated CSG models are discussed in this section. In
Figure 13, all buildings are converted into a CSG representation in LOD2. Again, there are 180 buildings, which is the same as in
Figure 11, but the size of the CSG representation in the X3D file is only 77 KB. The data volume is reduced dramatically while the visual features are preserved, according to the visualization results. As the prototype can be reused by many models in the same scene, the compression rate for the symbolized model is over 97% in this case.
4.3.3. LOD2 to LOD1
From LOD2 to LOD1, the roof structures of the 3D city models are removed. The model is represented as a block.
Figure 14 gives the block representation of the test dataset. The size of the model in LOD1 is 22 KB, less than 30% of the size in LOD2.
4.3.4. BuildingTree Visualization
BuildingTree combines the generalized model from different levels into a tree structure and can preserve the visualization similarity while reducing the unnecessary details of distant buildings.
Figure 15a gives an example of a BuildingTree-based visualization. We can see that the buildings near the user’s viewpoint are in LOD3ES, and the buildings in the middle area and background are in LOD2 and LOD1, respectively. In
Figure 15b, a street level visualization is given that indicates the proposed BuildingTree can better preserve the visualization feature in the street level view, in which the building in the distance usually cannot be seen.
4.4. Performance Evaluation
To test the efficiency of the proposed method, we implement the BuildingTree on the huge city model data supplied by citygml.org. This model contains 484 copies of the Ettenheim dataset with a LOD4 building. The compressed model is 3.8 GB and 44 GB uncompressed. Using our BuildingTree model, this huge city can be easily visualized with the X3DOM-based web page. According to our implementation, the dataset can only be loaded in LOD1 and the BuildingTree model. Therefore, we perform a more detailed test on a smaller dataset.
The test is carried out on a local network and the parameters are listed in
Table 1. The original model (LOD3) could not be loaded into the smart phone due to the data volume which resulted in a system crash, so it is not listed in the table. The size of BuildingTree only contains the path to the data rather than the data itself of LOD3ES or LOD3 models
From
Table 1, we can see that the size of the 3D models is reduced quite significantly with CSG representation since BuildingTree only contains the address rather than the data of LOD3ES or LOD3 models. Also, the loading time is improved. However, the complete CSG representation (LOD2) does not greatly improve the visualization speed (frames per second) because the number of nodes is increased. We also can see that compared with the original models, it increases by less than 5% of extra data by introducing these middle level LODS. For 3D rendering, it is indicated that the CSG representation does not increase much from LOD3ES (16.7%). One of the reasons for this is the Frame per Second (FPS) is only determined by the number of primitives being drawn, rather than the file size of a model. Therefore, even though the data volume is reduced significantly, the FPS is not improved.
We also test the proposed NoSQL database in a computer with Win7 x64, 8G RAM, 2.6 GHz CPU and MongoDB v2.2.7. In the test, one million records are generated and inserted into the database and query performance is evaluated. It takes about 53 seconds to insert the one million records. Meanwhile, it takes around 1700 ms to query in the one million records without index and 50 ms with index.
5. Discussion
In this paper, we import 3D building models in CityGML data into a self-designed and MongoDB-driven middleware. The important improvement is the creation of a hierarchical tree design to store different detailed instances of the geometry of buildings. Therefore, we developed algorithms to extract different kinds of representations out of a CityGML building in both B-Rep and CSG.
One of the advantages of CSG is that it can easily ensure that objects are “solid” or water-tight if all of the primitive shapes are water-tight. By comparison, when creating geometry based on boundary representations, additional topological data is required, or consistency checks must be performed to ensure that the given boundary description specifies a valid solid object.
In this paper, the building is selected as the main city object to deal with. For other city objects in CityGML specifications, such as bridges, tunnels or city facilities, the proposed algorithm can also be applied with specific adjustment. Considering the features of the building, cross-section plane-based segmentation can be applied. However, different segment methods should be designed for different types of city objects. In the next study, road and city facilities, such as street lamps, will be studied for progressive CSG representation since these objects are widely distributed across the city. However, landmark city objects such as bridges, towers and some skyscrapers will be preserved in the LOD3 level considering their visual importance.
A main limitation of the proposed building CSG generation method is that it mainly focuses on rectangular structures although a large proportion of total city models contain rectangular parts. But for non-rectangular structures, the CSG representation algorithm is required and the city model prototype set should be able to be extended automatically, according to different datasets.
6. Conclusions
This paper focused on the generalization and progressive visualization of three-dimensional (3D) city models. A multiple representation structure of four levels, denoted as BuildingTree, was specified. This structure is designed for the visualization of a city model at different levels of detail, using boundary representation for the most detailed levels and parameterized prototypes (constructive solid geometry (CSG) models) for the less detailed levels. We also developed a framework to derive a BuildingTree from a city model for the most detailed level using building cross-section detection, segmentation and an automatic prototype generation method. The methodology was implemented based on open standards (CityGML, X3D, etc.) and tools. The experimental results indicate that the proposed framework can be implemented on mainstream web browsers based on online 3D city model visualization without plugins. Furthermore, the experimental results confirm the data compression rate of BuildingTree, as well as progressive data transformation visualization. A reason for the latter was the comparatively small data volume due to the use of parameterized prototypes to represent the buildings. Also, it was observed that the current Frame per Second (FPS) improvement is not as great as the data volume deduction. Therefore, for progressive data transmitted city models, a 3D rendering engine which supports basic prototypes is essential for visualization efficiency. In future studies, we will try to support more prototypes to deal with complex buildings and improve the visualization efficiency by selecting or updating a rendering engine which is optimized for predefined prototypes.
Acknowledgments
This work was supported by National Science Foundation of China (41671457), Natural Science Foundation of Jiangsu (BK20151551), Natural Science Foundation of the Higher Education Institutions of Jiangsu (16KJA170003), Jiangsu Province Postdoctoral Research Funding (1402120C), National Key Technologies R&D Program of China (2015BAD18B02 and 2015BAK36B02), National Center for International Joint Research on E-Business Information Processing (2013B01035), China Special Fund for Grain-Scientific Research in the Public Interest (201513004) and Project of the Priority Academic Program Development of Jiangsu Higher Education Institutions (PAPD), Key Laboratory of Geological Information Technology, Ministry of Land and Resources, Beijing and Lund University.
Author Contributions
Bo Mao and Lars Harrie conceived and designed the experiments; Bo Mao performed the experiments; Bo Mao and Lars Harrie analyzed the data; Bo Mao wrote the paper; Lars Harrie revised the paper.
Conflicts of Interest
The authors declare no conflict of interest. The founding sponsors had no role in the design of the study; in the collection, analyses, or interpretation of data; in the writing of the manuscript, and in the decision to publish the results.
References
- Goetz, M. Towards generating highly detailed 3D CityGML models from OpenStreetMap. Int. J. Geogr. Inf. Sci. 2013, 27, 845–865. [Google Scholar] [CrossRef]
- Biljecki, F.; Stoter, J.; Ledoux, H.; Coltekin, A.; Zlatanova, S. Applications of 3D City Models: State of the Art Review. ISPRS Int. J. Geo-Inf. 2015, 4, 2842–2889. [Google Scholar] [CrossRef]
- Eicker, U.; Strzalka, A.; Schulte, C.; Coors, V. Large scale integration of photovoltaics in cities. Appl. Energy 2012, 93, 413–421. [Google Scholar]
- Czerwinski, A.; Sandmann, S.; Stöcker-Meier, E.; Plümer, L. Sustainable SDI for EU noise mapping in NRW—Best practice for INSPIRE. Int. J. Spat. Data Infrastruct. Res. 2007, 2, 90–111. [Google Scholar]
- Lu, L. 3D Complete Traffic Noise Analysis Based on CityGML. Lect. Notes Geoinf. Cartogr. 2016, in press. [Google Scholar]
- Ghassoun, Y.; Löwner, M.; Weber, S. Exploring the benefits of 3D city models in the field of urban particles distribution modelling—A comparison of model results. In 3D Geoinformation Science; Springer: New York, NY, USA, 2015; pp. 193–205. [Google Scholar]
- Ghassoun, Y.; Ruthsb, M.; Löwner, M.; Weber, S. Intra-urban variation of ultrafine particles as evaluated by process related land use and pollutant driven regression modelling. Sci. Total Environ. 2015, 536, 150–160. [Google Scholar] [CrossRef] [PubMed]
- Chen, L.C.; Wu, C.H.; Shen, T.S.; Chou, C.C. The application of geometric network models and building information models in geospatial environments for fire-fighting simulations. Comput. Environ. Urban Syst. 2014, 45, 1–12. [Google Scholar] [CrossRef]
- Kolbe, T.; Gröger, G. Towards unified 3D city models. In Proceedings of Joint ISPRS Workshop Challenges in Geospatial Analysis, Stuttgart, Germany, 8–9 September 2003; pp. 8–16.
- Tegtmeier, W.; Zlatanova, S.; van Oosterom, P. Information management in civil engineering infrastructural development: With focus on geological geotechnical information. In Proceedings of ISPRS Workshop Vol. XXXVIII-3-4/C3 Comm. III/4, IV/8 and IV/5: Academic Track of GeoWeb 2009 Conference: Cityscapes, Vancouver, BC, Canada, 2009; pp. 68–73.
- Zhang, Y.; Zhu, Q. GeoScope: Full 3D geospatial information system case study. Geo-Spat. Inf. Sci. 2011, 14, 150–156. [Google Scholar] [CrossRef]
- Gröger, G.; Kolbe, T.H.; Nagel, C.; Häfele, K.-H. OGC City Geography Markup Language (CityGML) Encoding Standard; OGC Doc No. 12-019; Open Geospatial Consortium: Bonn, Germany, 2012. [Google Scholar]
- Löwner, M.; Benner, J.; Gröger, G.; Häfele, K. New Concepts for structuring 3D city models—An extended level of detail concept for CityGML buildings. In Proceedings of the International Conference on Computational Science and Its Applications (ICCSA 2013), Ho Chi Minh City, Vietnam, 24 June 2013.
- Foley, J.D.; van Dam, A.; Feiner, S.K.; Hughes, J.F. Computer Graphics: Principles and Practice, 2nd ed.; Addison-Wesley: Boston, MA, USA, 1996. [Google Scholar]
- Abdul-Rahman, A.; Pilouk, M. Spatial Data Modelling for 3D GIS, 2D and 3D Spatial Data Representations; Springer: Berlin, Germany, 2007. [Google Scholar]
- Brenner, C. Modelling 3D Objects Using Weak CSG Primitives. Int. Arch. Photogramm. Remote Sens. Spat. Inf. 2004, 35, 1085–1090. [Google Scholar]
- Thiemann, F. Generalization of 3D Buildings Data. In ISPRS—GeoSpatial Theory, Processing and Applications; ISPRS: Ottawa, ON, Canada, 2002; Volume 34, pp. 286–290. [Google Scholar]
- Borrmann, A.; Kolbe, T.H.; Donaubauer, A.; Steuer, H.; Jubierre, J.R.; Flurl, M. Multi-scale geometric-semantic modeling of shield tunnels for GIS and BIM applications. Comput. Aided Civil Infrastruct. Eng. 2014, 30, 263–281. [Google Scholar] [CrossRef]
- Jones, R. Integration of regional to outcrop digital data: 3D Visualisation of multi-scale geological models. Comput. Geosci. 2009, 35, 4–18. [Google Scholar] [CrossRef]
- Benner, J.; Geiger, A.; Gröger, G.; Löwner, M. Enhanced LoD concepts for virtual 3D city models. In ISPRS Annals of the Photogrammetry, Remote Sensing and Spatial Information Sciences, Proceedings of the ISPRS 8th 3D GeoInfo Conference & WG II/2 Workshop, Istanbul, Turkey, 27–29 November 2013; pp. 51–61.
- Mao, B.; Ban, Y.; Harrie, L. A multiple representation data structure for dynamic visualisation of generalised 3D city models. ISPRS J. Photogramm. Remote Sens. 2011, 66, 198–208. [Google Scholar] [CrossRef]
- Van Oosterom, P. Variable-scale topological data structures suitable for progressive data transfer: The GAP-face tree and GAP-edge forest. Cartogr. Geogr. Inf. Sci. 2005, 32, 331–346. [Google Scholar] [CrossRef]
- Coors, V. 3D-GIS in networking environments. Comput. Environ. Urban Syst. 2003, 27, 345–357. [Google Scholar] [CrossRef]
- Döllner, J.; Buchholz, H. Continuous level-of-detail modelling of buildings in 3D city models. In Proceedings of the 13th Annual ACM International Workshop on Geographic Information Systems, Bremen, Germany, 31 October–5 November 2005; Volume 5, pp. 173–181.
- Zhang, L.; Yangb, C.; Tongc, X.; Ruid, X. Visualization of large spatial data in networking environments. Comput. Geosci. 2007, 33, 1130–1139. [Google Scholar] [CrossRef]
- Sester, M.; Brenner, C. A vocabulary for a multiscale process description for fast transmission and continuous visualization of spatial data. Comput. Geosci. 2009, 35, 2177–2184. [Google Scholar] [CrossRef]
- van Kreveld, M. Smooth generalization for continuous zooming. In Proceedings of the 20th International Cartographic Conference, Beijing, China, 6–10 August 2001; pp. 2178–2185.
- Meng, L.; Forberg, A. 3D Building generalization. In Generalisation of Geographic Information: Cartographic Modelling and Applications; Mackaness, W., Ruas, A., Sarjakoski, L.T., Eds.; Elsevier: Amsterdam, The Netherlands, 2007; pp. 211–232. [Google Scholar]
- Thiemann, F.; Sester, M. Segmentation of buildings for 3D-generalisation. In Proceedings of the ICA Workshop on Generalisation and Multiple Representation, Leicester, UK, 20–21 August 2004.
- Thiemann, F.; Sester, M. 3D-Symbolization Using Adaptive Templates. In Proceedings of ISPRS Technical Commission II Symposium, Vienna, Austria, 12–16 July 2006.
- Mayer, H. Scale-spaces for generalization of 3D buildings. Int. J. Geogr. Inf. Sci. 2005, 19, 975–997. [Google Scholar] [CrossRef]
- Forberg, A. Generalization of 3D building data based on a scale-space approach. ISPRS J. Photogramm. Remote Sens. 2007, 62, 104–111. [Google Scholar] [CrossRef]
- Kada, M. 3D Building Generalization based on Half-Space Modeling. In Proceedings of the ISPRS Workshop on Multiple Representation and Interoperability of Spatial Data, Hannover, Germany, 22–24 February 2006.
- Kada, M. Generalisation of 3D Building Models by Cell Decomposition and Primitive Instancing. In Proceedings of the Joint ISPRS Workshop on Visualization and Exploration of Geospatial Data, Stuttgart, Germany, 29–30 June 2007.
- Lu, Y.; Behar, E.; Donnelly, S.; Lien, J.M.; Camelli, F.; Wong, D. Fast and robust generation of city-scale seamless 3D urban models. Comput. Aided Des. 2011, 43, 1380–1390. [Google Scholar] [CrossRef]
- Fan, H.; Meng, L. A three-step approach of simplifying 3D buildings. Int. J. Geoinf. Sci. 2012, 26, 1091–1107. [Google Scholar] [CrossRef]
- Baig, S.U.; Abdul-Rahman, A. Generalization of buildings within the framework of CityGML. Geo-Spat. Inf. Sci. 2013, 16, 247–255. [Google Scholar] [CrossRef]
- Glander, T.; Döllner, J. Advances in 3D Geoinformation Systems. In Lecture Notes in Geoinformation and Cartography; van Oosterom, P., Zlatanova, S., Penninga, F., Fendel, E.M., Eds.; Springer: Berlin, Germany, 2008; pp. 381–400. [Google Scholar]
- Mao, B.; Harrie, L.; Ban, Y. Detection and typification of linear structures for dynamic visualization of 3D city models. Comput. Environ. Urban Syst. 2012, 36, 233–244. [Google Scholar] [CrossRef]
- Guercke, R.; Götzelmann, T.; Brenner, C.; Sester, M. Aggregation of LoD1 building models as an optimization problem. ISPRS J. Photogramm. Remote Sens. 2011, 66, 209–222. [Google Scholar] [CrossRef]
- BuildingSMART. Available online: http://www.buildingsmart-tech.org/ (accessed on 25 September 2015).
- Isikdag, U.; Zlatanova, S. Towards defining a framework for automatic generation of buildings in CityGML using building information models. In 3D Geo-Information Sciences; Lee, J., Zlatanova, S., Eds.; Springer: Berlin, Germany, 2009; pp. 79–97. [Google Scholar]
- El-Mekawy, M.; Östman, A.; Hijazi, I. A unified building model for 3D urban GIS. ISPRS Int. J. Geo-Inf. 2012, 1, 120–145. [Google Scholar] [CrossRef]
- Stoter, J.; Zhang, X.; Stigmar, H.; Harrie, L. Evaluation and usability of map generalisation outputs. In Abstracting Geographic Information in a Data Rich World; Springer: Berlin, Switzerland, 2014; pp. 259–297. [Google Scholar]
- Stadler, A.; Nagel, C.; König, G.; Kolbe, T. Making interoperability persistent: A 3D geo database based on CityGML. In 3rd International Workshop on 3D Geo-Information; Lee, J., Zlatanova, S., Eds.; Springer: Seoul, Korea, 2008; pp. 175–192. [Google Scholar]
- Breunig, M.; Schilberg, B.; Thomsen, A.; Kuper, P.; Jahn, M.; Butwilowski, E. DB4GeO, a 3D/4D geodatabase and its application for the analysis of landslides. In Lecture Notes in Geoinformation and Cartography; Springer: Berlin/Heidelberg, Germany, 2010; pp. 83–101. [Google Scholar]
- Strauss, P.; Carey, R. An object-oriented 3D graphics toolkit. Comput. Graph. 1992, 26, 341–349. [Google Scholar] [CrossRef]
- Long, N.; Fleming, K.; Brackney, L. An Object-oriented database for managing building modelling components and metadata. In Proceedings of Building Simulation 2011, Sydney, Australia, 14–16 November 2011; pp. 14–16.
- Kunde, F. CityGML in PostGIS: Portability, Usage and Performance Analysis Using the Example of the 3D City Database of Berlin. Master’s Thesis, Department of Geography, University of Potsdam, Potsdam, Germany, 2013. [Google Scholar]
- Koch, S.; Löwner, M.-O. Representation of CityGML instance models in BaseX. Lect. Notes Geoinf. Cartogr. 2016, in press. [Google Scholar]
- Luan, H.; Fan, Y.; Zhou, M.; Wang, X. Towards effective 3D model management on hadoop. Lect. Notes Electr. Eng. 2014, 279, 131–139. [Google Scholar]
- Sugumaran, R.; Burnett, J.; Armstrong, M. Using a cloud computing environment to process large 3D spatial datasets. In Big Data: Techniques and Technologies in Geoinformatics; CRC Press: Boca Raton, FL, USA, 2014; pp. 53–65. [Google Scholar]
- Dobos, J.; Steed, A. 3D Revision Control Framework. In Proceedings of the 17th International Conference on 3D Web Technology, Los Angeles, CA, USA, 4–5 August 2012.
- Han, D.; Stroulia, E. A three-dimensional data model in hbase for large time-series dataset analysis. In Proceedings of the IEEE 6th International Workshop on the Maintenance and Evolution of Service-Oriented and Cloud-Based Systems, Trento, Italy, 24 September 2012; pp. 47–56.
- Behr, J.; Eschler, P.; Jung, Y.; Zöllner, M. X3DOM: A DOM-based HTML5/X3D integration model. In Proceedings of the 14th International Conference on 3D Web Technology, Darmstadt, Germany, 16–17 June 2009.
- Jung, Y.; Behr, J.; Graf, H. X3DOM as carrier of the virtual heritage. In Proceedings of the 4th ISPRS International Workshop 3D-ARCH, Trento, Italy, 2–4 March 2011.
- Mao, B.; Ban, Y. Online visualisation of a 3D city model using CityGML and X3DOM. Cartographica 2011, 46, 109–114. [Google Scholar] [CrossRef]
- Fan, H.; Meng, L.; Jahnke, M. Generalization of 3D buildings modelled by CityGML. In Advances in GIScience. Lecture Notes in Geoinformation and Cartography; Springer: Berlin/Heidelberg, Germany, 2009; pp. 387–405. [Google Scholar]
- Toussaint, G.T. Solving geometric problems with the rotating calipers. In Proceedings of the Mediterranean Electrotechnical Conference 1983, Athens, Greece, 24–26 May 1983.
- JTS. Available online: http://www.vividsolutions.com/jts/jtshome.htm (accessed on 25 September 2015).
- Citygml4j. Available online: https://github.com/citygml4j/citygml4j (accessed on 25 September 2015).
© 2016 by the authors; licensee MDPI, Basel, Switzerland. This article is an open access article distributed under the terms and conditions of the Creative Commons Attribution (CC-BY) license (http://creativecommons.org/licenses/by/4.0/).


