
Recognition of Repetitive Movement Patterns—The Case of Football Analysis


Abstract
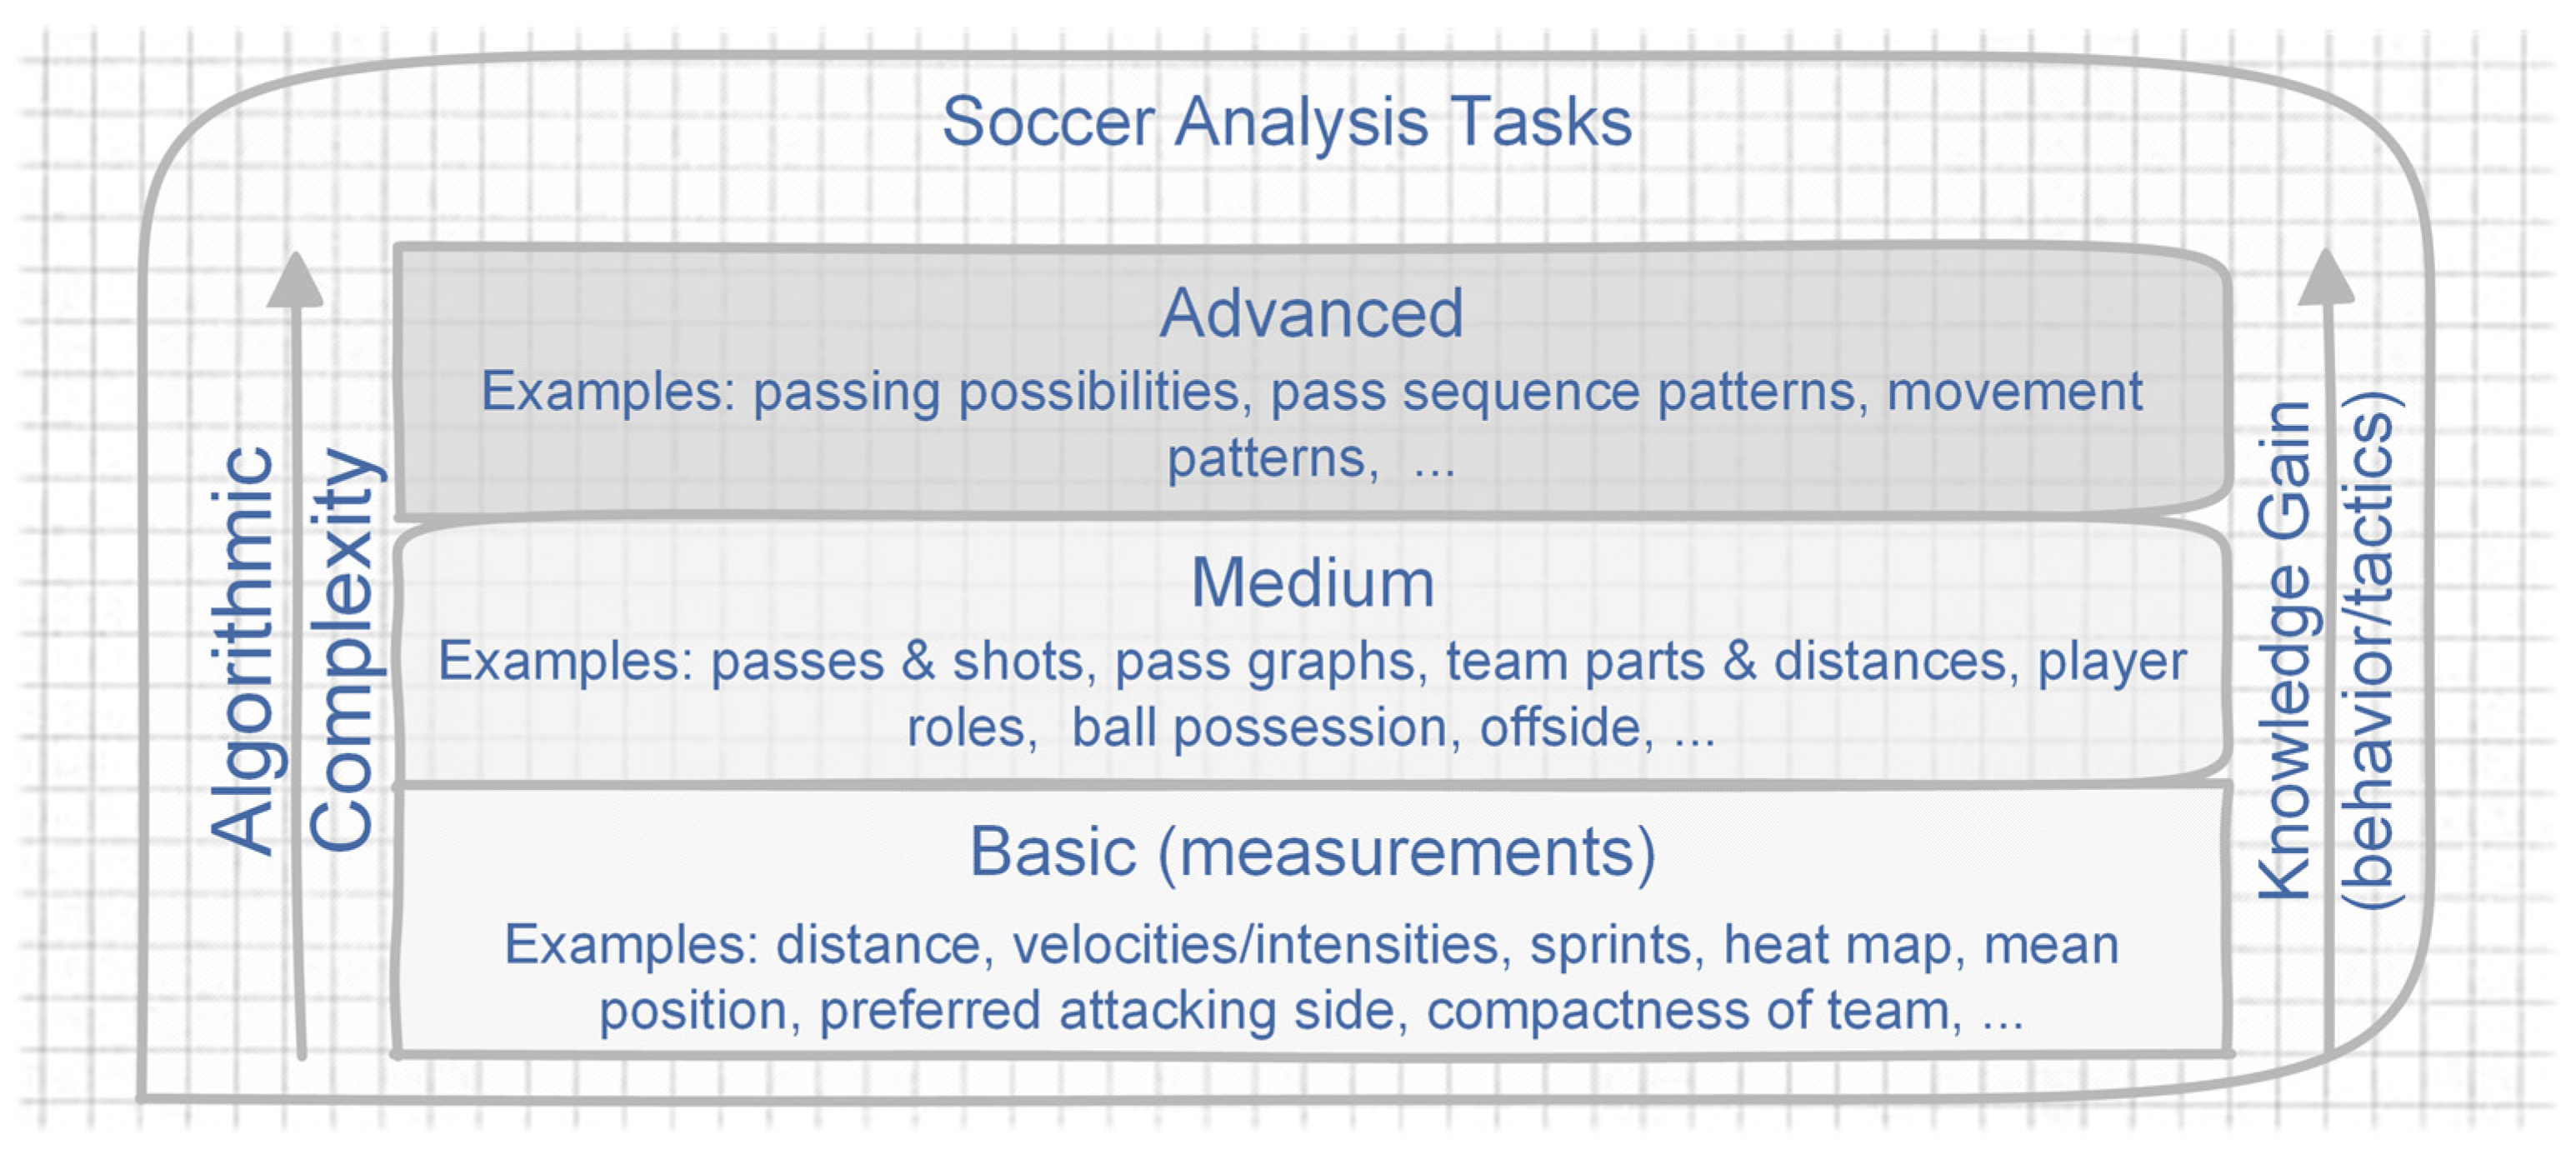
:1. Introduction
2. Related Work
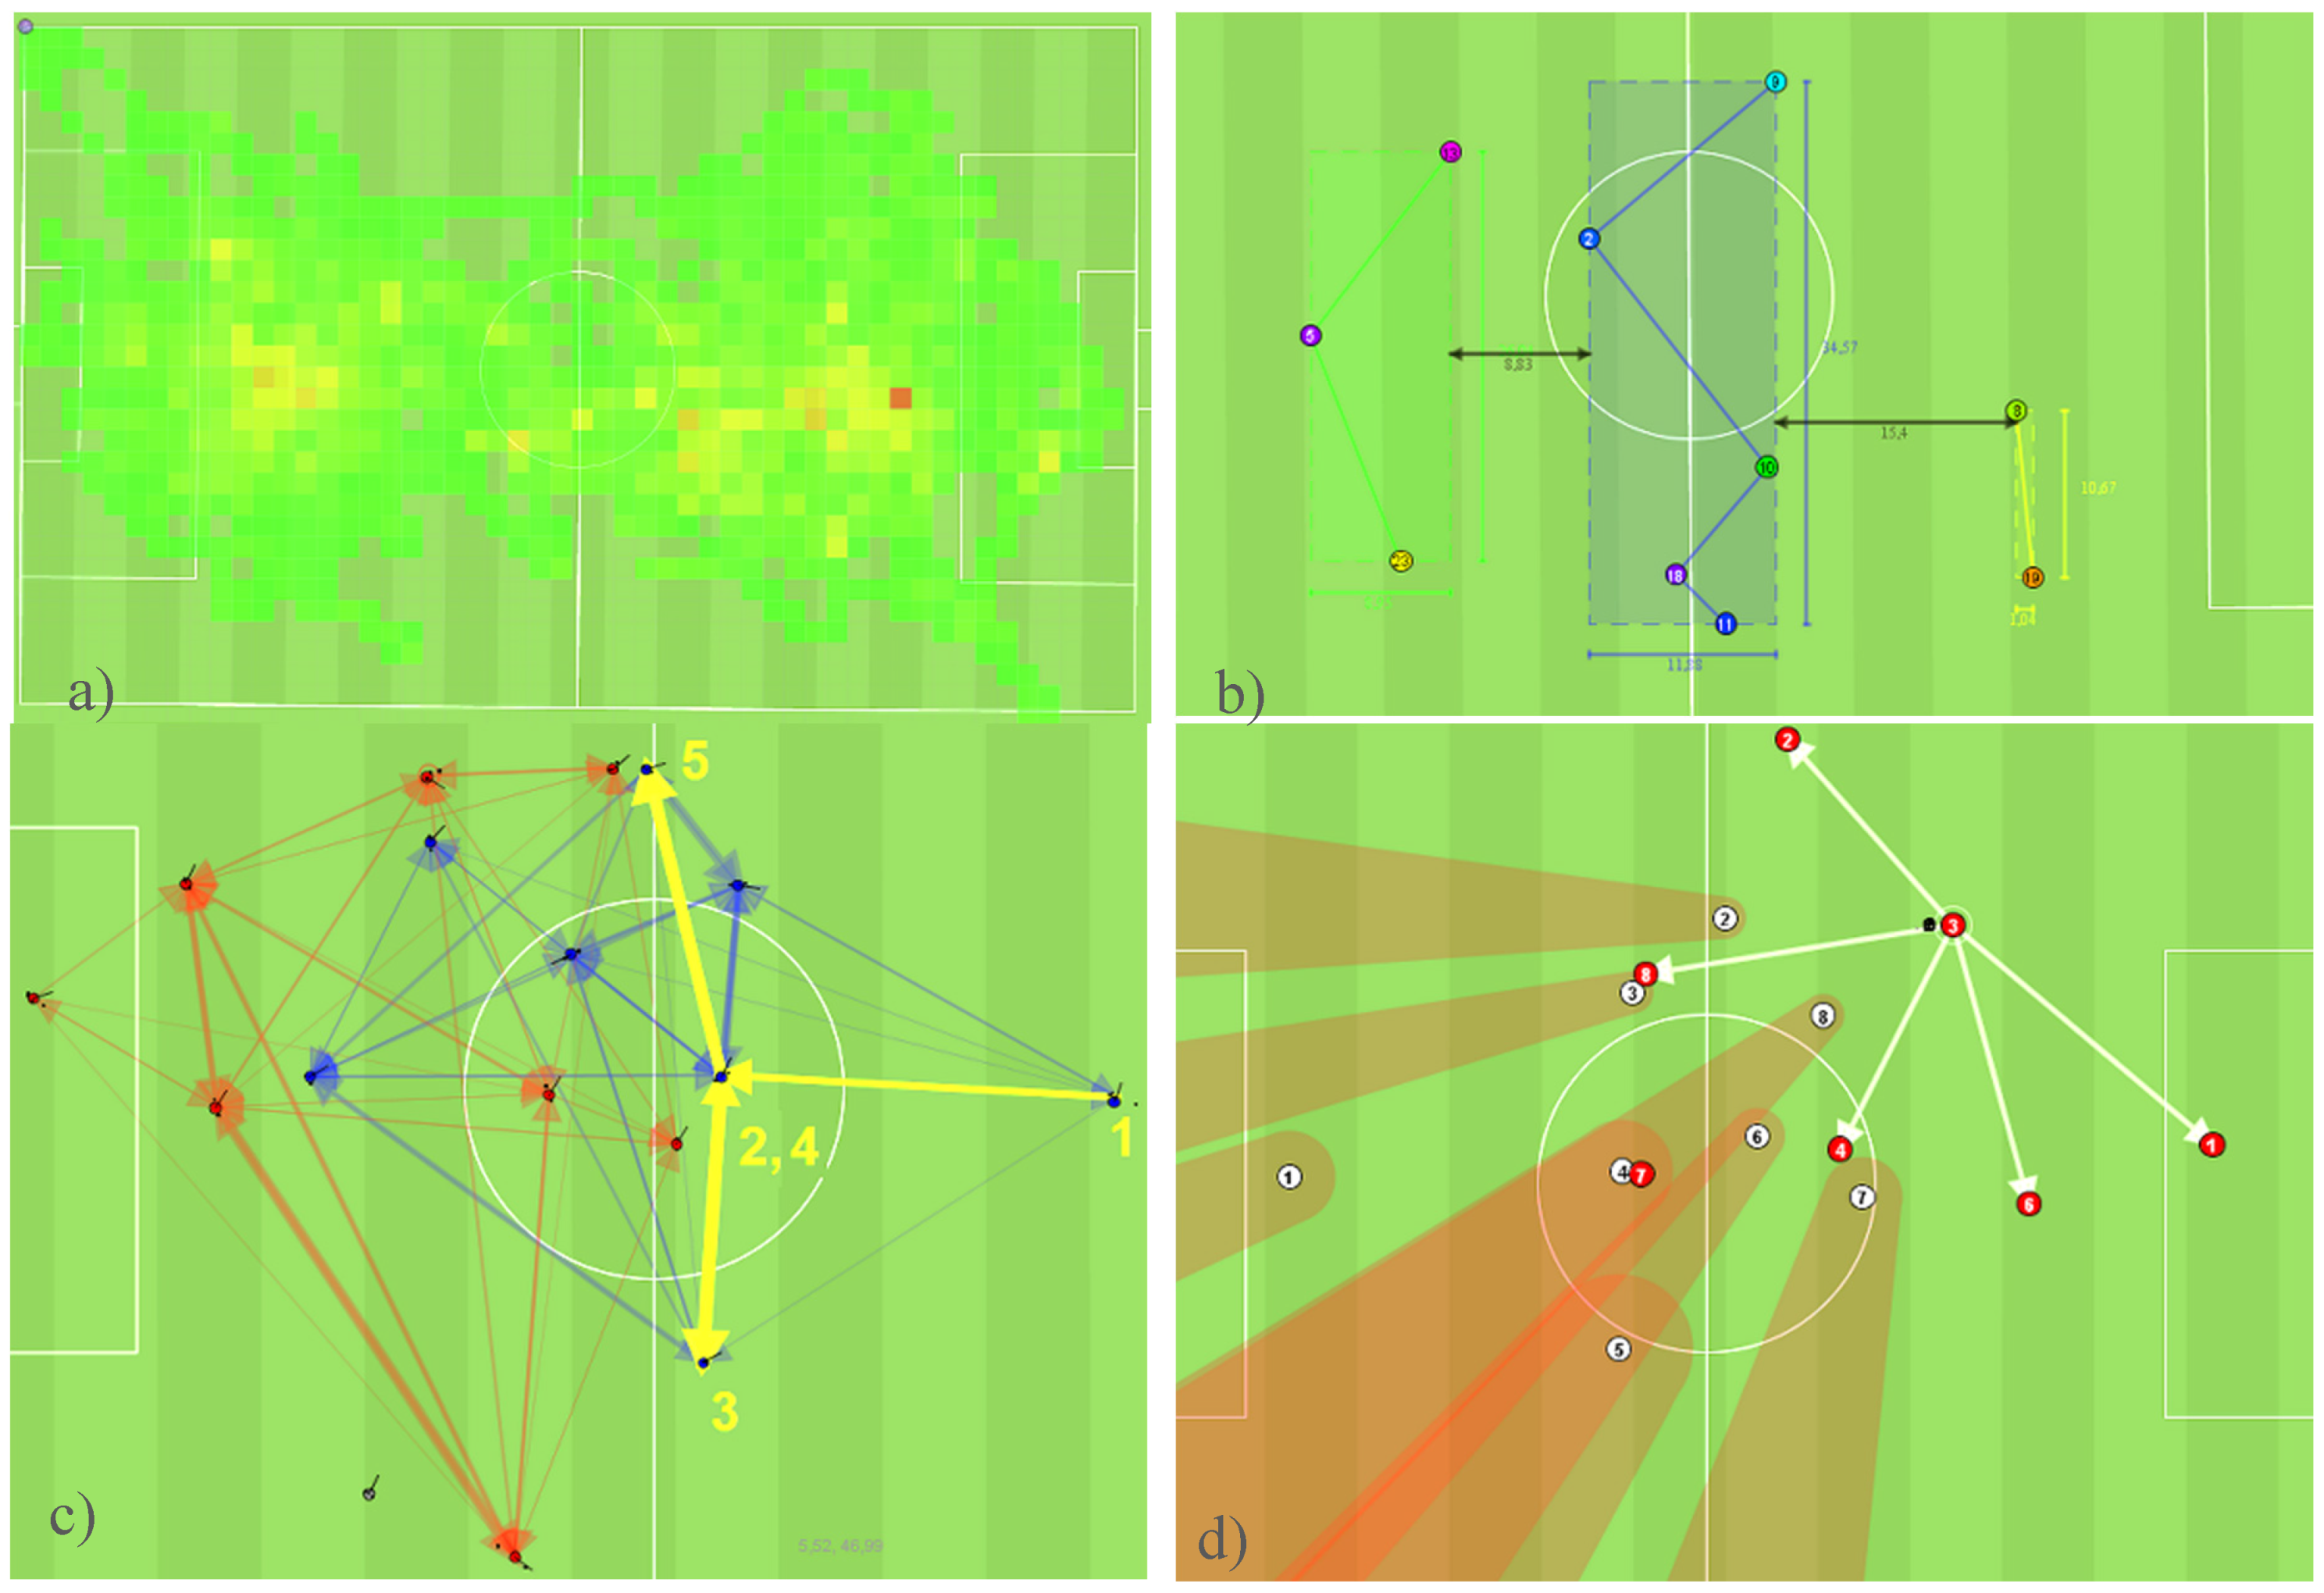
2.1. Commercial Football Analysis Systems
2.2. Movement Pattern Recognition
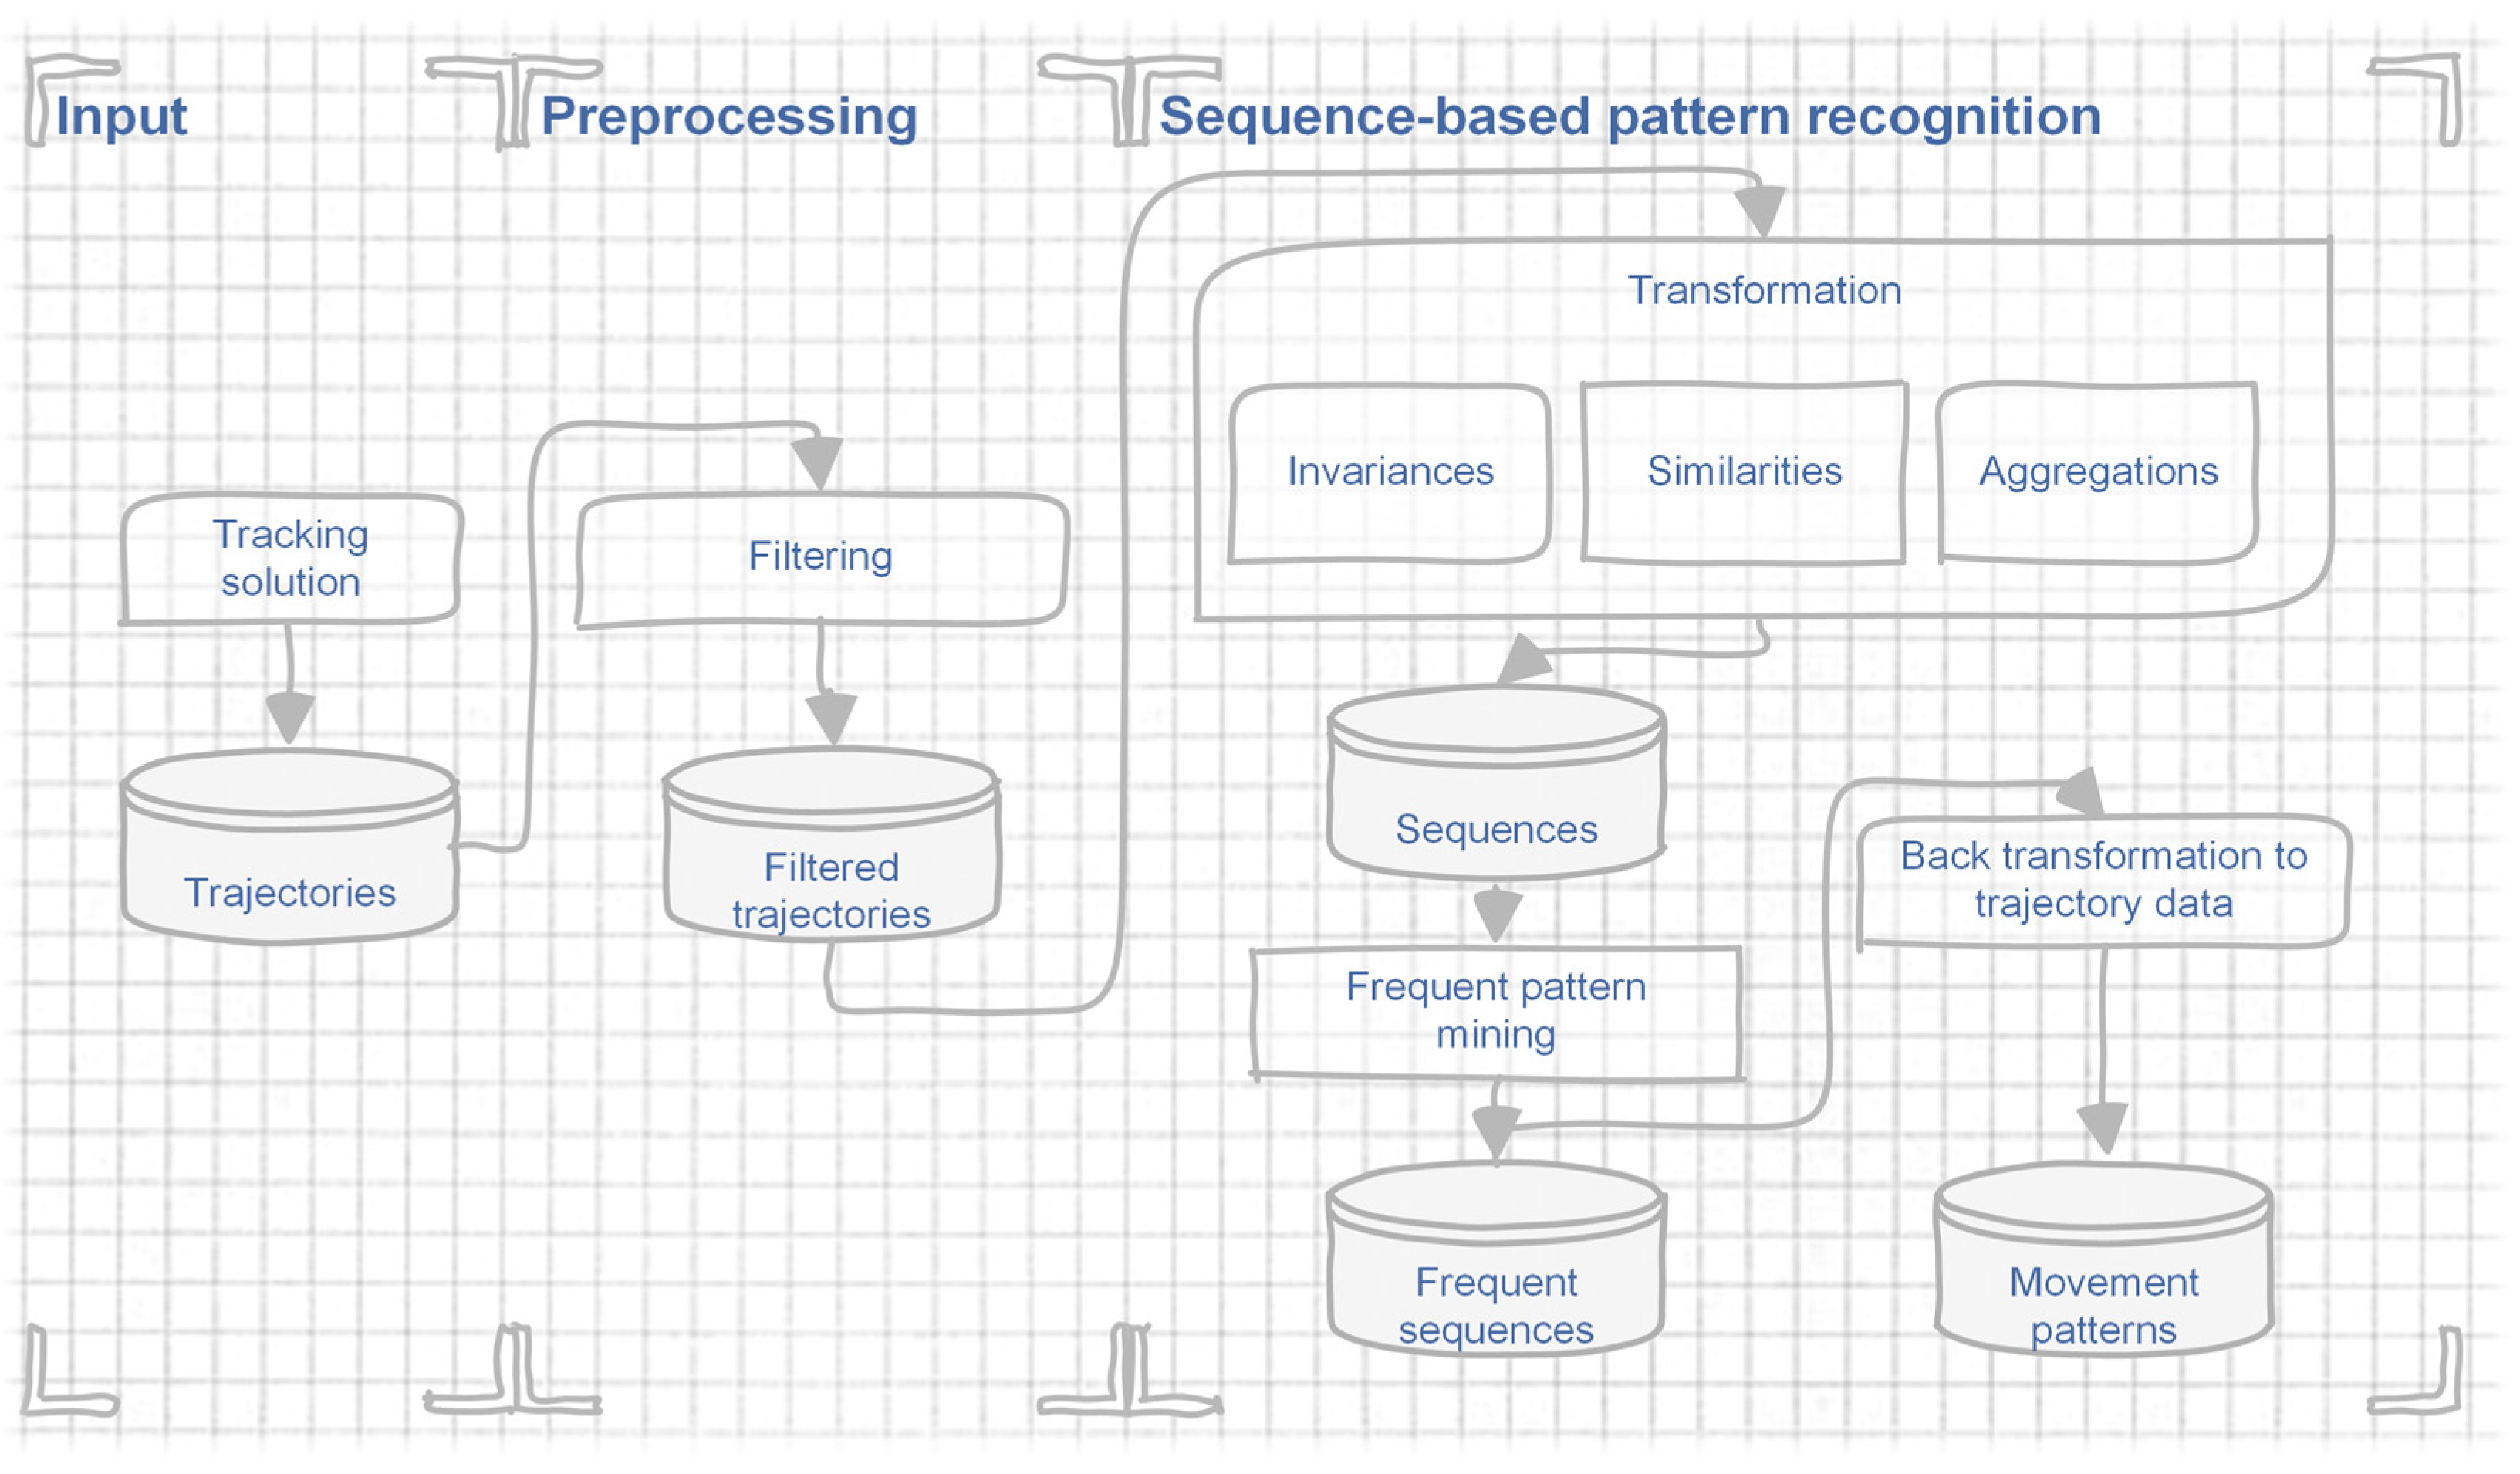
3. The Movement Pattern Recognition Approach
3.1. Input
3.2. Preprocessing
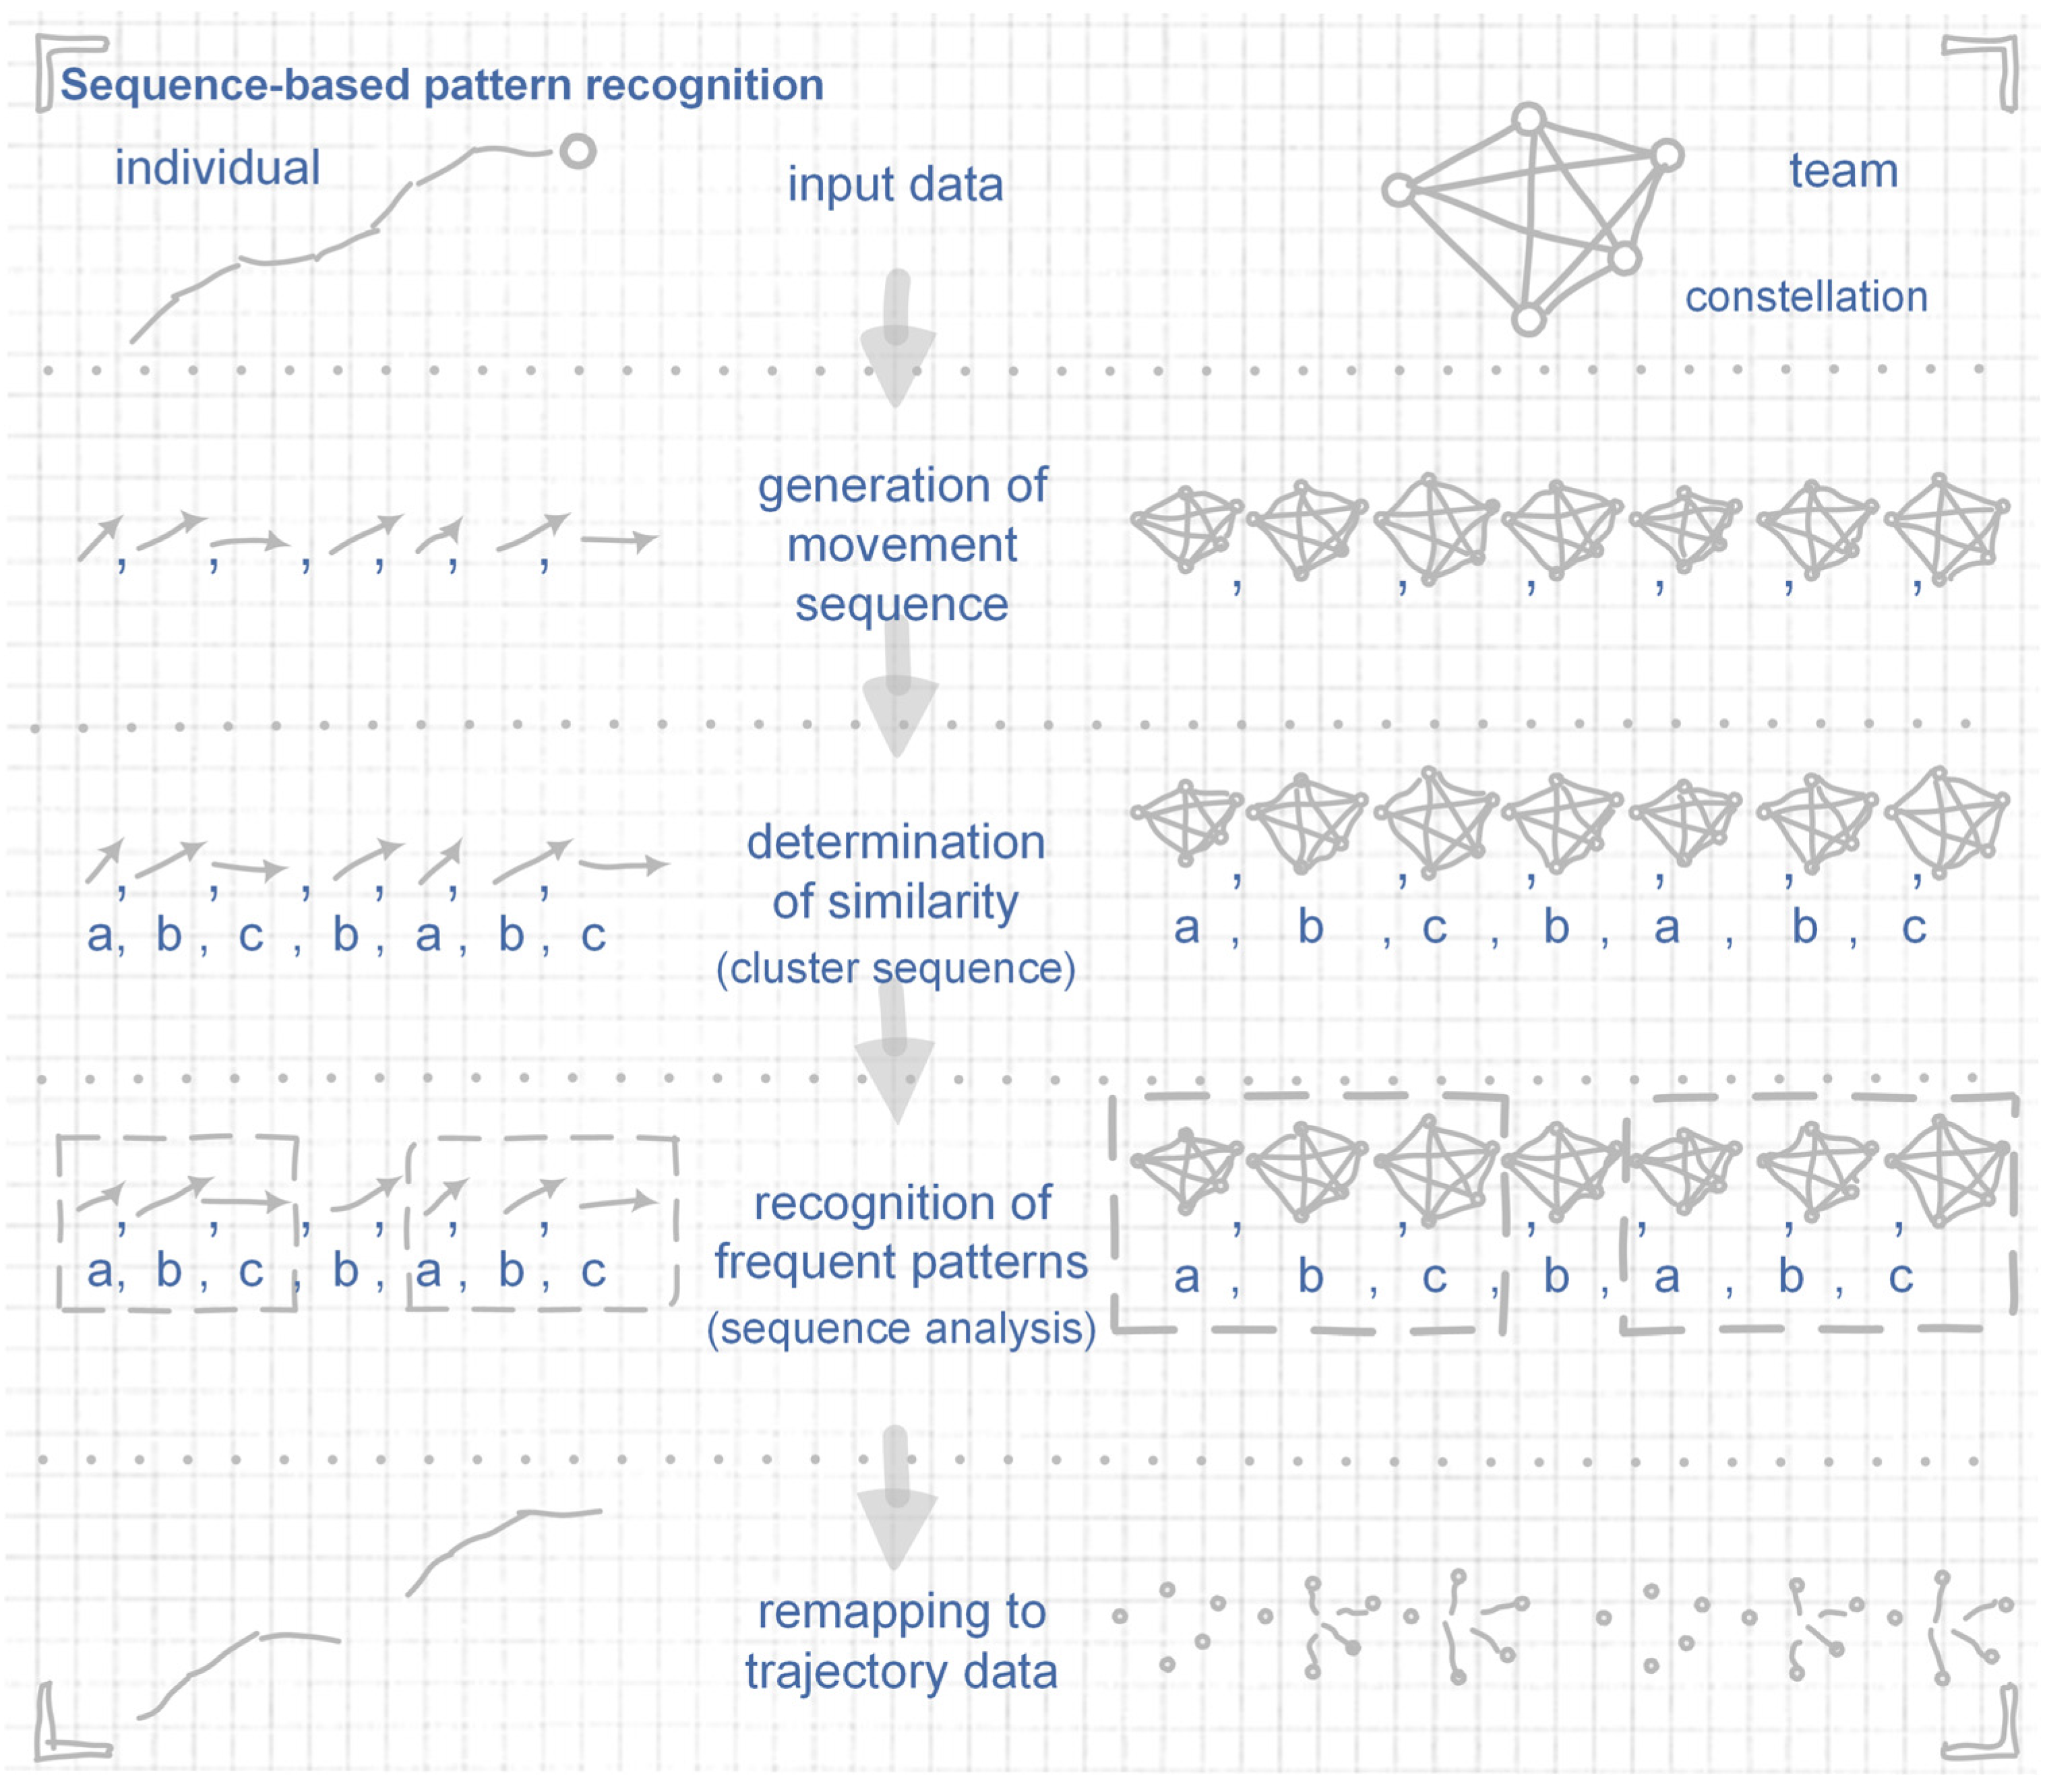
3.3. Sequence-Based Pattern Recognition
3.3.1. Input to the Algorithm
3.3.2. Generation of the Movement Sequence
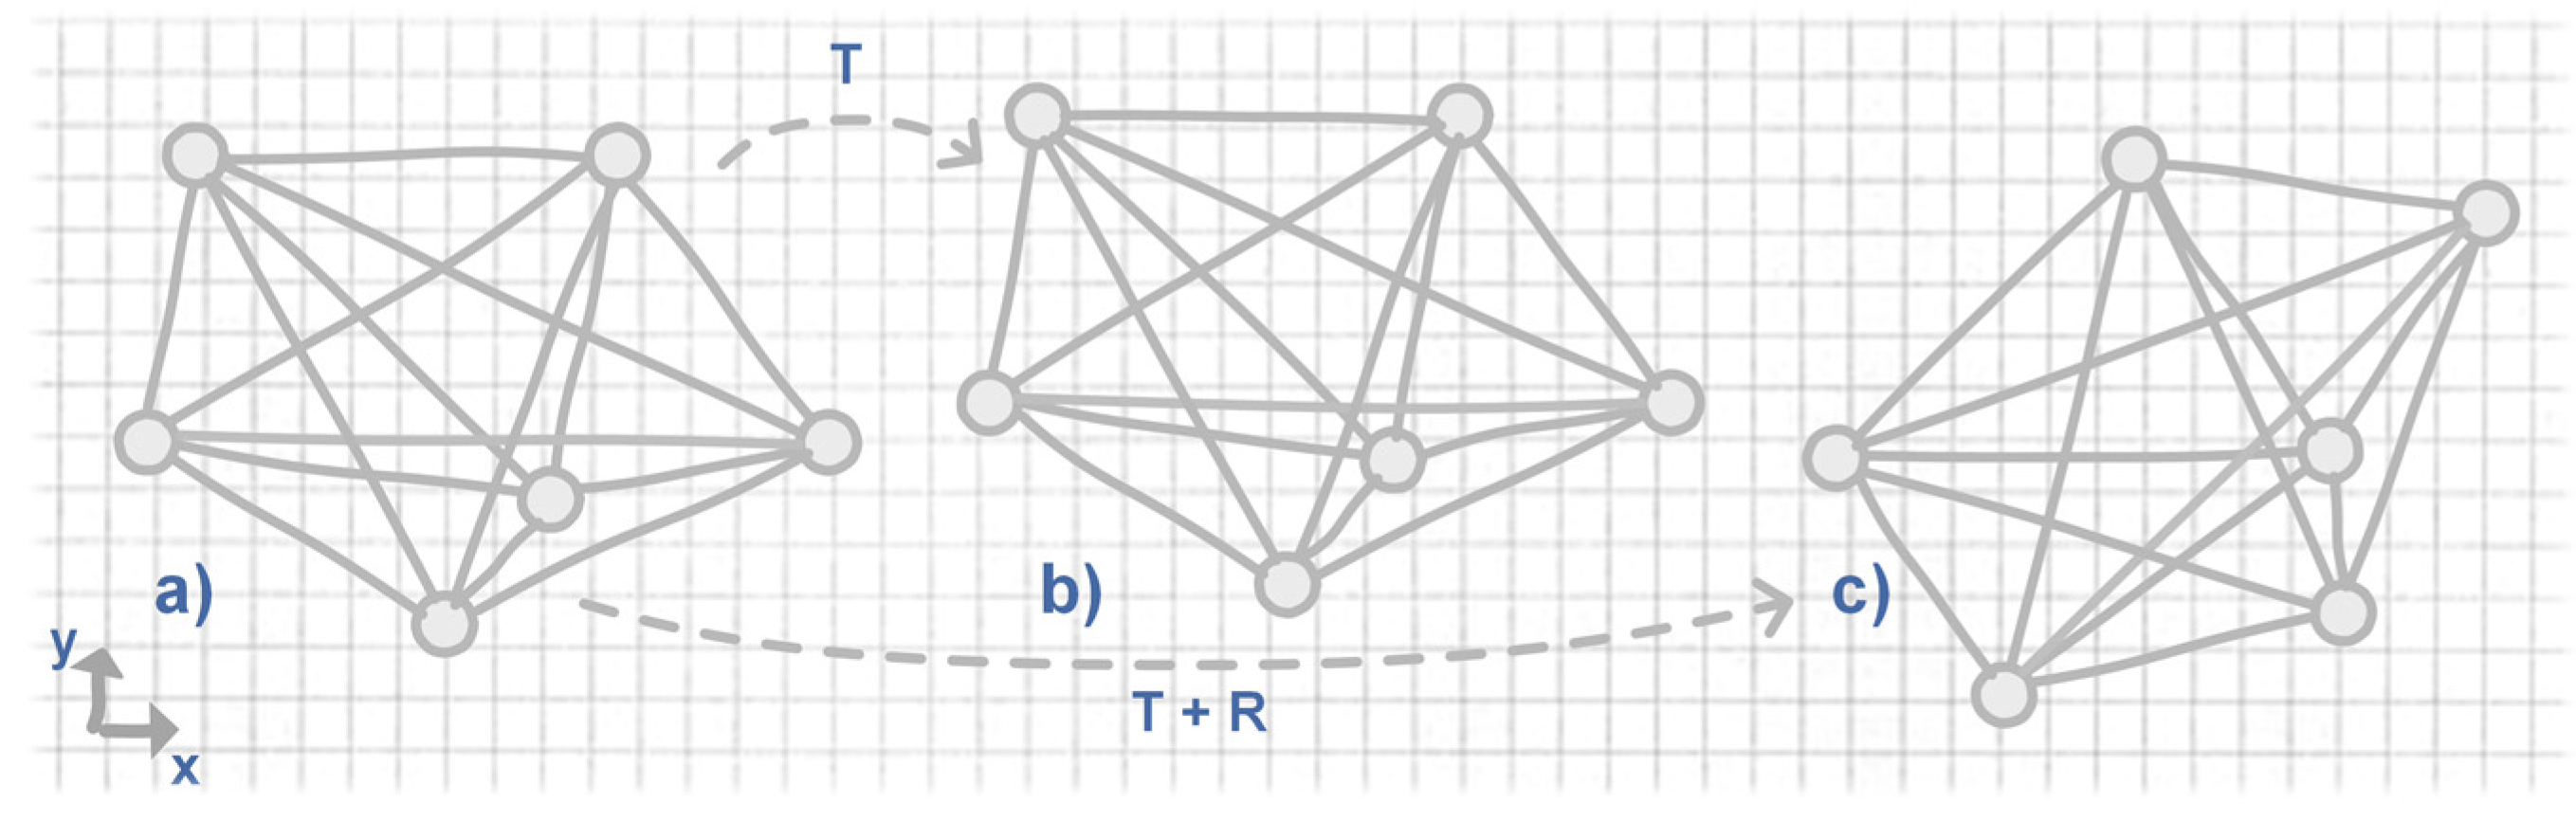
3.3.3. Determination of Similarity
3.3.4. Recognition of Frequent Patterns
3.3.5. Remapping to Trajectory Data
4. Experiment and Discussion
4.1. Datasets
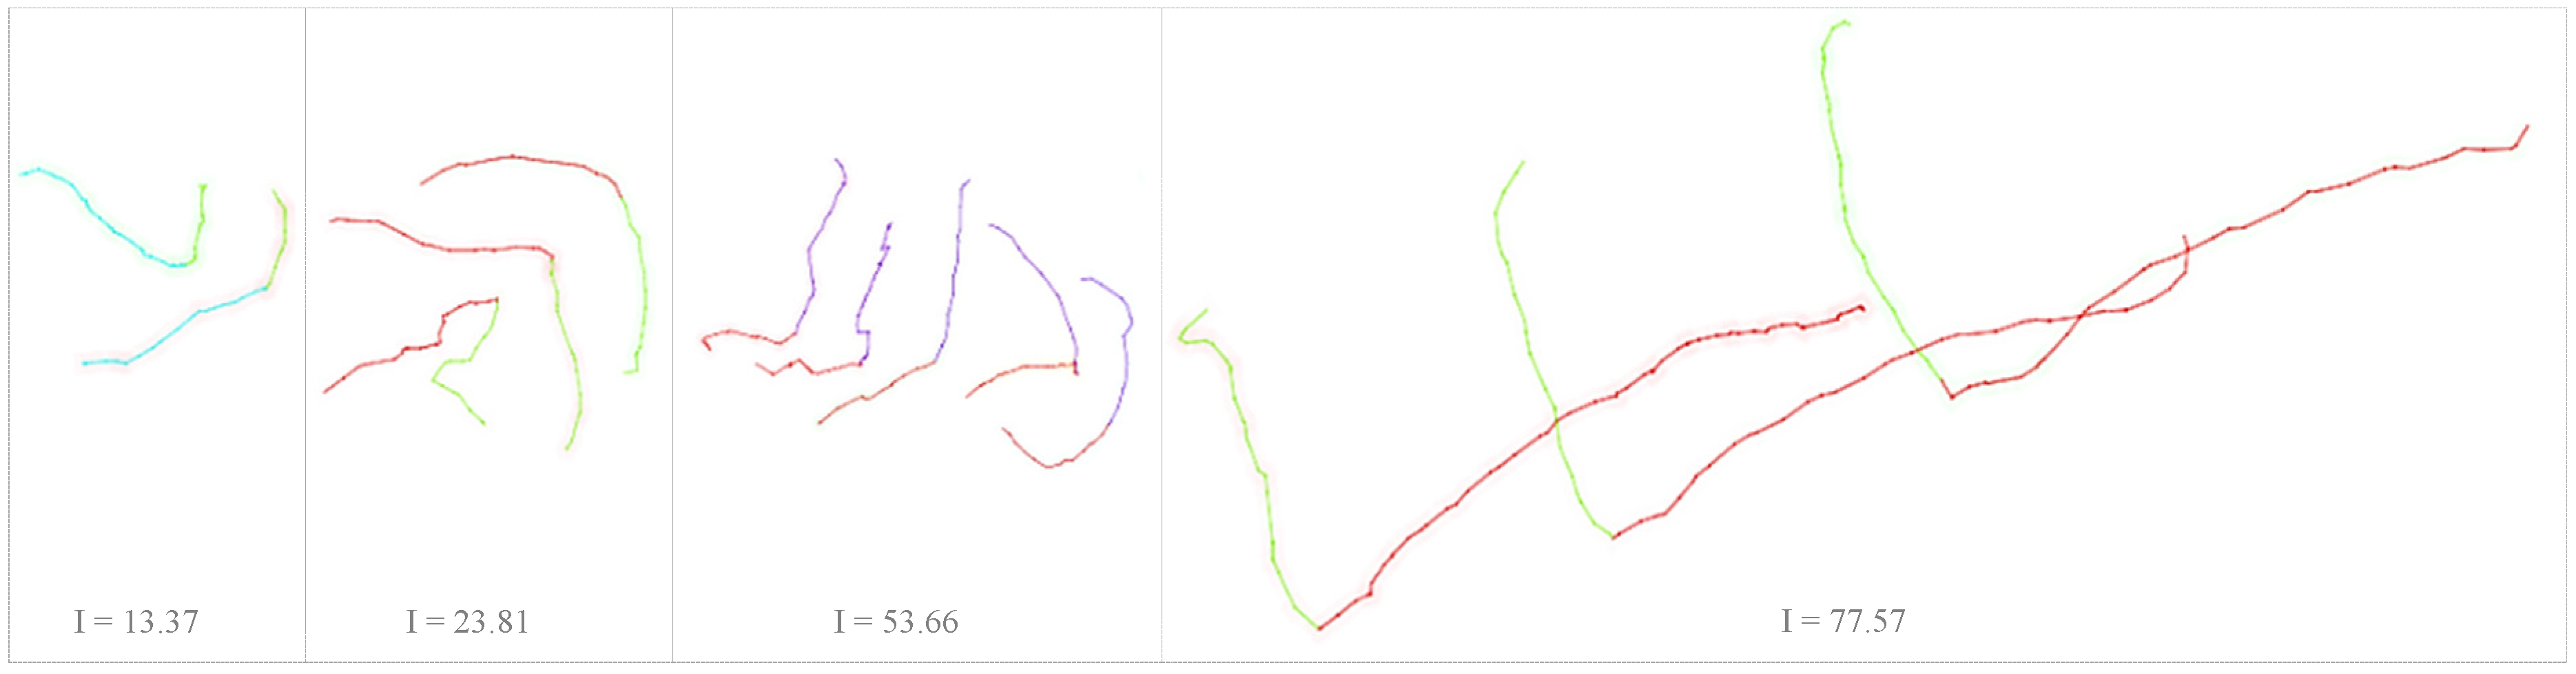
4.2. Result Verification and Pattern Interestingness
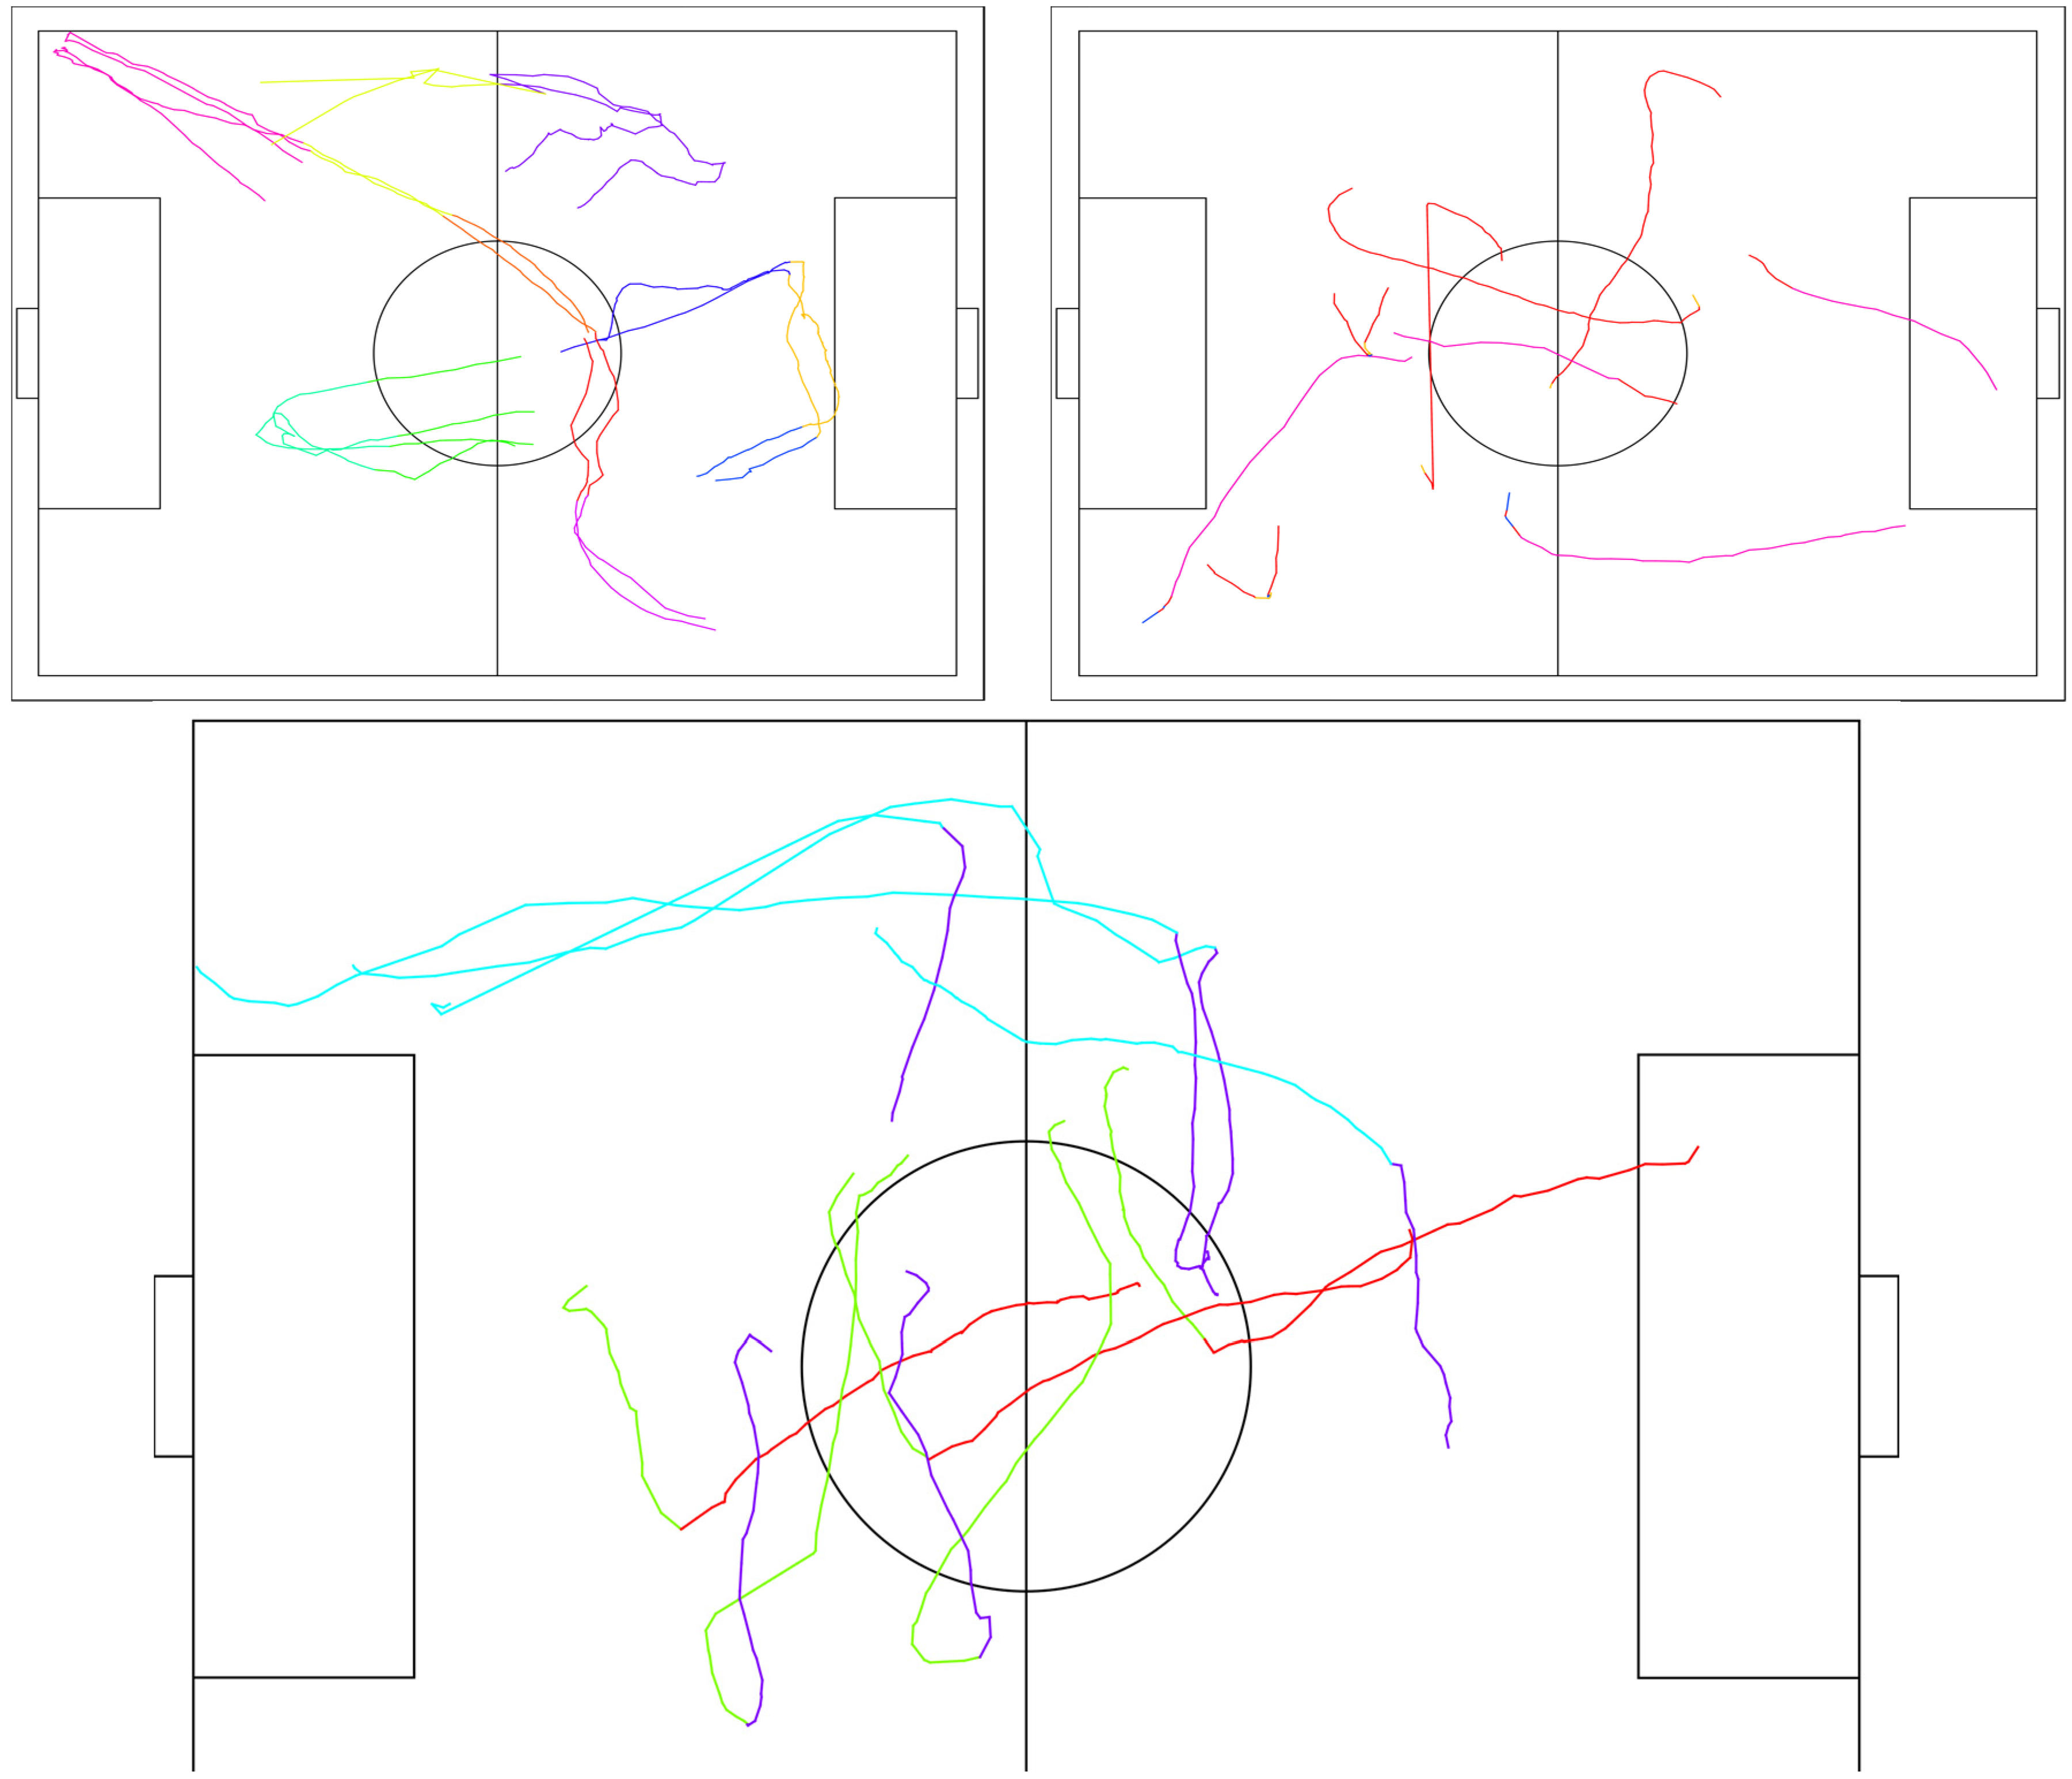
4.3. Movement Pattern Recognition Results
4.3.1. Experiment 1
4.3.2. Experiment 2
4.3.3. Experiment 3
5. Conclusions and Outlook
5.1. Summary
5.1.1. Motivation and Approach
5.1.2. Features of the Approach
5.2. Outlook
5.2.1. Extension of the Approach
5.2.2. Utilization of Movement Patterns
Acknowledgments
Conflicts of Interest
References
- Catapult Australia | Wearable Technology for Elite Sports. Available online: http://www.catapultsports.com/au/ (accessed on 8 September 2016).
- Digitale Medien, TV-Übertragung, Backend-Services für den Sport. Available online: http://www.deltatre.com/de/ (accessed on 8 September 2016).
- Athlete Monitoring Software, Performance Analysis Software. Available online: http://prozonesports.stats.com/ (accessed on 8 September 2016).
- ChyronHego. Available online: http://chyronhego.com/ (accessed on 8 September 2016).
- Fitter, Schneller, Stärker | Wachs über dich hinaus | adidas miCoach. Available online: http://www.adidas.de/micoach (accessed on 8 September 2016).
- NIKE+ Apps & Services. Available online: http://www.nike.com/us/en_us/c/nike-plus (accessed on 8 September 2016).
- Sport | Garmin | Deutschland. Available online: http://www.garmin.com/de-DE/explore/intosports (accessed on 8 September 2016).
- Runtastic: Laufen, Radfahren & Fitness GPS-Tracker. Available online: https://www.runtastic.com/de/ (accessed on 8 September 2016).
- Laube, P.; Duckham, M.; Wolle, T. Decentralized movement pattern detection amongst mobile Geosensor nodes. In Geographic Information Science; Cova, T.J., Miller, H.J., Beard, K., Frank, A.U., Goodchild, M.F., Eds.; Springer: Berlin/Heidelberg, Germany, 2008; pp. 199–216. [Google Scholar]
- Gudmundsson, J.; van Kreveld, M.; Speckmann, B. Efficient detection of patterns in 2D trajectories of moving points. GeoInformatica 2007, 11, 195–215. [Google Scholar] [CrossRef]
- Benkert, M.; Gudmundsson, J.; Hübner, F.; Wolle, T. Reporting flock patterns. Comput. Geom. 2008, 41, 111–125. [Google Scholar] [CrossRef]
- Dodge, S.; Weibel, R.; Lautenschütz, A.K. Towards a taxonomy of movement patterns. Inf. Vis. 2008, 7, 240–252. [Google Scholar] [CrossRef] [Green Version]
- Laube, P.; Kreveld van, M; Imfeld, S. Finding REMO—Detecting relative motion patterns in geospatial lifelines. In Developments in Spatial Data Handling; Springer: Berlin/Heidelberg, Germany, 2005; pp. 201–215. [Google Scholar]
- Gudmundsson, J.; Wolle, T. Football analysis using spatio-temporal tools. Comput. Environ. Urban Syst. 2014, 47, 16–27. [Google Scholar] [CrossRef]
- Buchin, K.; Buchin, M.; Van Kreveld, M.; Luo, J. Finding long and similar parts of trajectories. Comput. Geom. 2011, 44, 465–476. [Google Scholar] [CrossRef]
- Niu, Z.; Gao, X.; Tian, Q. Tactic analysis based on real-world ball trajectory in soccer video. Pattern Recognit. 2012, 45, 1937–1947. [Google Scholar] [CrossRef]
- Zhu, G.; Huang, Q.; Xu, C.; Rui, Y.; Jiang, S.; Gao, W.; Yao, H. Trajectory based event tactics analysis in broadcast sports video. In Proceedings of the 15th ACM International Conference on Multimedia, Bavaria, Germany, 23–28 September 2007.
- Li, R.; Chellappa, R. Group motion segmentation using a spatio-temporal driving force model. In Proceedings of the 2010 IEEE Conference on Computer Vision and Pattern Recognition (CVPR), San Francisco, CA, USA, 13–18 June 2010.
- Kim, H.C.; Kwon, O.; Li, K.J. Spatial and spatiotemporal analysis of soccer. In Proceedings of the 19th ACM SIGSPATIAL International Conference on Advances in Geographic Information Systems, New York, NY, USA, 1–4 November 2011.
- Grunz, A.; Memmert, D.; Perl, J. Tactical pattern recognition in soccer games by means of special self-organizing maps. Hum. Mov. Sci. 2012, 31, 334–343. [Google Scholar] [CrossRef] [PubMed]
- Hirano, S.; Tsumoto, S. Finding interesting pass patterns from soccer game records. In European Conference on Principles of Data Mining and Knowledge Discovery; Springer: Berlin, Germany, 2004; pp. 209–218. [Google Scholar]
- Mutschler, C.; Kókai, G.; Edelhäusser, T. Online data stream mining on interactive trajectories in soccer games. IEEE Trans. Intell. Transp. Syst. 2015. [Google Scholar] [CrossRef]
- Pelekis, N.; Kopanakis, I.; Kotsifakos, E.E.; Frentzos, E.; Theodoridis, Y. Clustering trajectories of moving objects in an uncertain world. In Proceedings of the ICDM’09, Pisa, Italy, 15–19 December 2009.
- Long, J.A.; Nelson, T.A. Measuring dynamic interaction in movement data. Trans. GIS 2013, 17, 62–77. [Google Scholar] [CrossRef]
- Nanni, M.; Pedreschi, D. Time-focused clustering of trajectories of moving objects. J. Intell. Inf. Syst. 2006, 27, 267–289. [Google Scholar] [CrossRef]
- Morris, B.; Trivedi, M. Learning trajectory patterns by clustering: Experimental studies and comparative evaluation. In Proceedings of the CVPR 2009, Miami, FL, USA, 22–24 June 2009.
- Lee, J.G.; Han, J.; Li, X.; Gonzalez, H. TraClass: Trajectory classification using hierarchical region-based and trajectory-based clustering. Proc VLDB Endow. 2008, 1, 1081–1094. [Google Scholar] [CrossRef]
- Dodge, S.; Laube, P.; Weibel, R. Movement similarity assessment using symbolic representation of trajectories. Int. J. Geogr. Inf. Sci. 2012, 26, 1563–1588. [Google Scholar] [CrossRef] [Green Version]
- Tsai, H.P.; Yang, D.N.; Chen, M.S. Mining group movement patterns for tracking moving objects efficiently. IEEE Trans. Knowl. Data Eng. 2011, 23, 266–281. [Google Scholar] [CrossRef]
- Cao, H.; Mamoulis, N.; Cheung, D.W. Mining frequent spatio-temporal sequential patterns. In Proceedings of the Fifth IEEE International Conference on Data Mining, Houston, TX, USA, 27–30 November 2005.
- Giannotti, F.; Nanni, M.; Pinelli, F.; Pedreschi, D. Trajectory pattern mining. In Proceedings of the 13th International Conference on Knowledge Discovery and Data Mining, New York, NY, USA, 12–15 August 2007.
- Mamoulis, N.; Cao, H.; Kollios, G.; Hadjieleftheriou, M.; Tao, Y.; Cheung, D.W. Mining, indexing, and querying historical spatiotemporal data. In Proceedings of the Tenth ACM SIGKDD International Conference on Knowledge Discovery and Data Mining, Seattle, WA, USA, 22–25 August 2004.
- Feuerhake, U.; Brenner, C.; Sester, M. GPS-aided video tracking. ISPRS Int. J. Geo-Inf. 2015, 4, 1317–1335. [Google Scholar] [CrossRef]
- Feuerhake, U.; Sester, M. Mining group movement patterns. In Proceedings of the 21st ACM SIGSPATIAL International Conference on Advances in Geographic Information Systems, Orlando, FL, USA, 5–8 November 2013.
- Gudmundsson, J.; Laube, P.; Wolle, T. Computational movement analysis. In Springer Handbook of Geographic Information; Springer: Berlin, Germany, 2012; pp. 423–438. [Google Scholar]
- Ester, M.; Kriegel, H.P.; Sander, J.; Xu, X. A density-based algorithm for discovering clusters in large spatial databases with noise. In Proceedings of the 2nd International Conference on Knowledge Discovery and Data Mining, Portland, OR, USA, 2–4 August 1996.
- MacQueen, J. Some methods for classification and analysis of multivariate observations. In Proceedings of the Fifth Berkeley Symposium on Mathematical Statistics and Probability, Oakland, CA, USA, 1–24 July 1967.
- Agrawal, R.; Srikant, R. Mining sequential patterns. In Proceedings of the Eleventh International Conference on Data Engineering, Taipei, Taiwan, 6–10 March 1995.
- Han, J.; Pei, J.; Yin, Y. Mining frequent patterns without candidate generation. Knowl. Dis. 2004. [Google Scholar] [CrossRef]
- Baeza-Yates, R.; Gonnet, G.H. A new approach to text searching. Commun. ACM 1992, 35, 74–82. [Google Scholar] [CrossRef]
- DEBS 2013. Available online: http://www.orgs.ttu.edu/debs2013/index.php?goto=cfchallengedetails (accessed on 7 November 2016).
- Map Construction. Available online: http://www.mapconstruction.org (accessed on 8 January 2016).
- Ester, M.; Kriegel, H.P.; Sander, J.; Wimmer, M.; Xu, X. Incremental clustering for mining in a data warehousing environment. VLDB 1998, 98, 323–333. [Google Scholar]
- Lin, J.; Vlachos, M.; Keogh, E.; Gunopulos, D. Iterative incremental clustering of time series. In International Conference on Extending Database Technology; Springer: Berlin, Germany, 2004; pp. 106–122. [Google Scholar]
- Cheng, H.; Yan, X.; Han, J. IncSpan: Incremental mining of sequential patterns in large database. In Proceedings of the Tenth ACM SIGKDD, New York, NY, USA, 22–25 August 2004.
- Han, J.; Kamber, M.; Pei, J. Data Mining: Concepts and Techniques; Elsevier: Amsterdam, The Netherlands, 2011. [Google Scholar]


| Invariances | Content of Sequence Elements | |
|---|---|---|
| Individual | Team of n Players () | |
| None | ||
| Translation | or | |
| Translation + Rotation | ||
| Dataset | Experiment | Characteristics | Used Invariances |
|---|---|---|---|
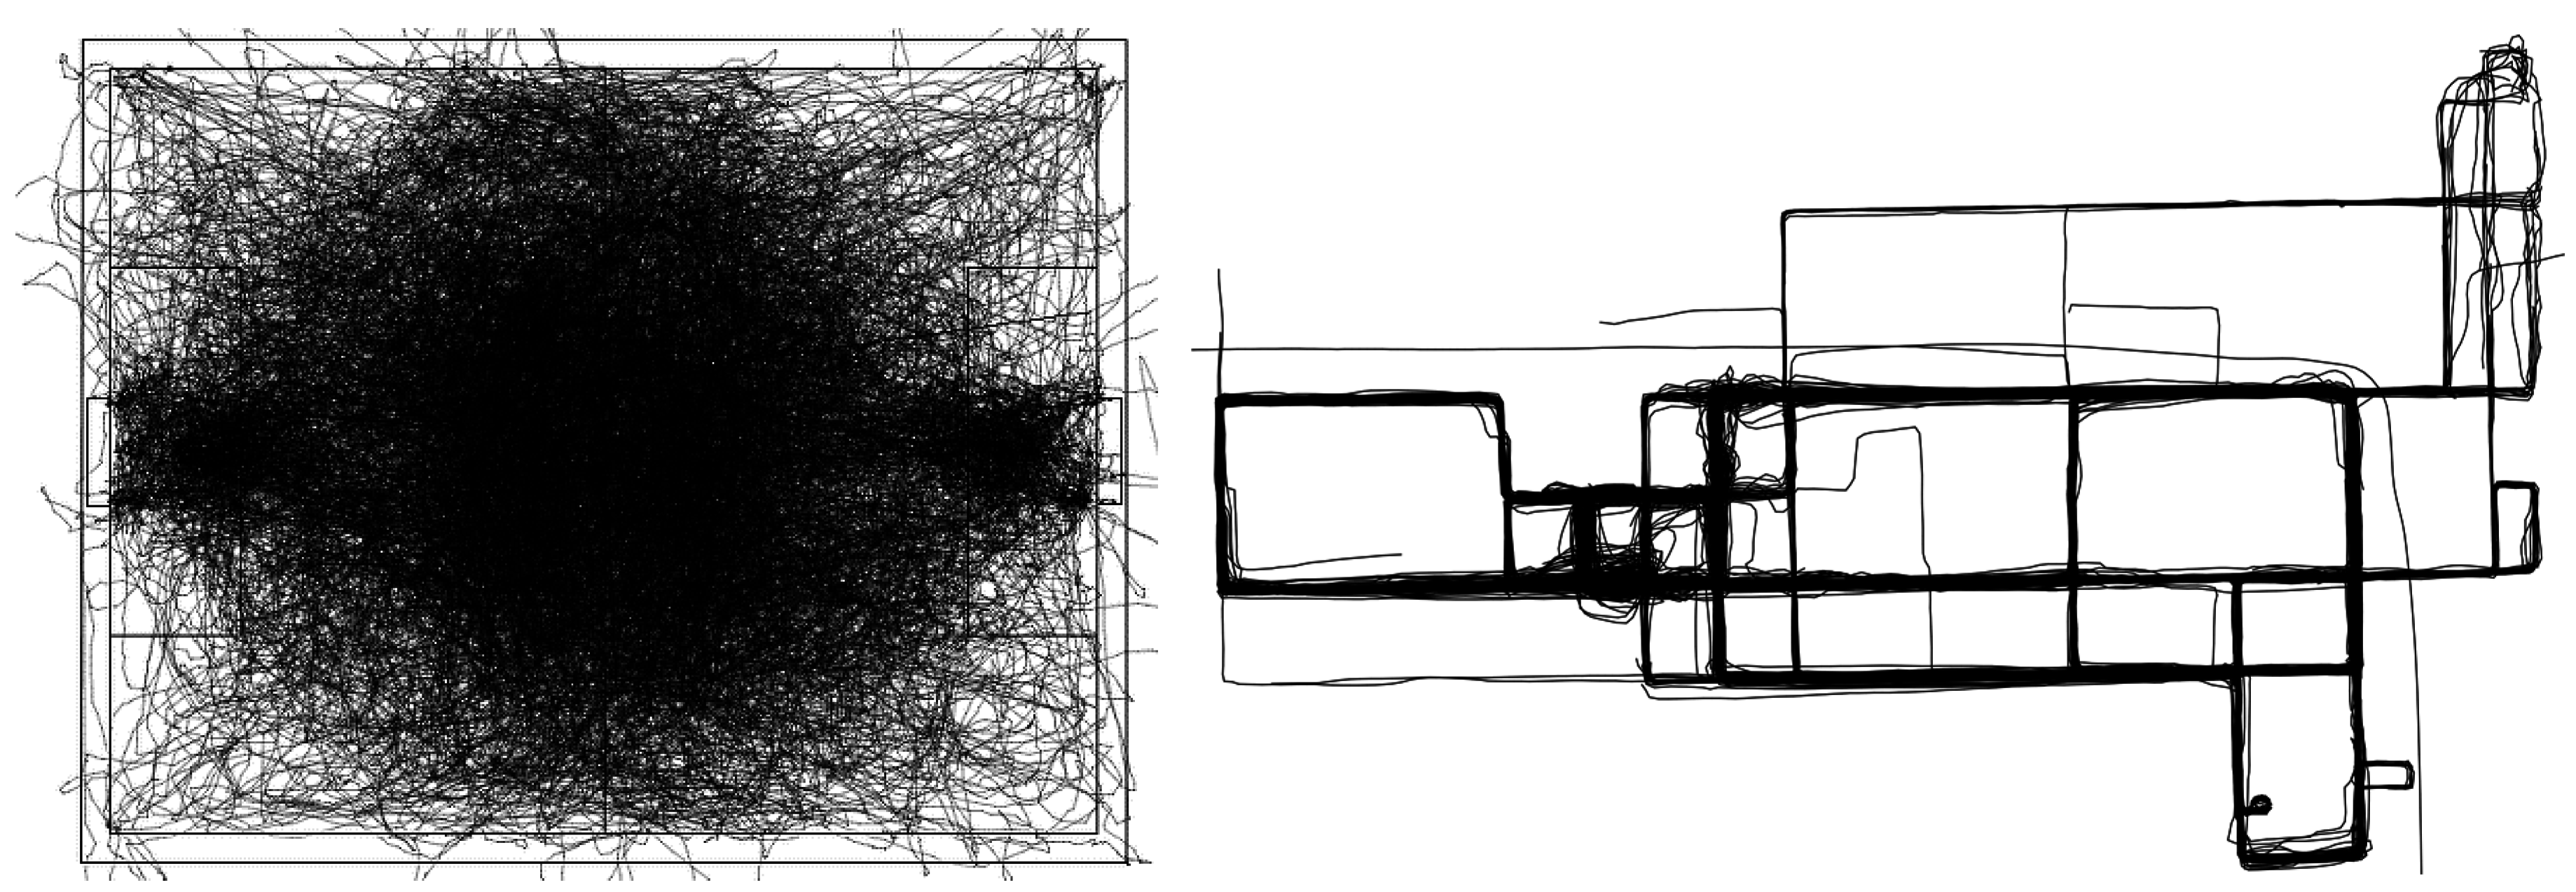
| FRAUNHOFER FOOTBALL | 1 | Spatial res.: high accurate (few cm) Sampling: 200 Hz Euclidean movement space 11.5 m points (1 game) | None, translation, translation & rotation |
| GPS FOOTBALL | 2 | Spatial res.: 5–10 m (GPS) Sampling: 5 Hz Euclidean movement space ~7 m points (>20 games) | Translation |
| MAPCONSTRUCTION(CHICAGO) | 3 | Spatial res.: 5–10 m (GPS) Sampling: ~4 Hz Network movement space 118 k points | None |
| # Clusters | # Patterns (ind. / group) | Ø Suppc [-] | Ø Length ([m]) | Ø Similarity ([1/m]) | ∑ Interestingness [-] |
|---|---|---|---|---|---|
| No invariance | |||||
| 4 | 99/83 | 2.04/2.00 | 44.06/84.20 | 0.07/0.008 | 622.9/111.8 |
| 8 | 180/126 | 2.08/2.05 | 33.87/44.93 | 0.08/0.011 | 1014.5/127.7 |
| 16 | 439/188 | 2.14/2.15 | 25.22/28.23 | 0.10/0.020 | 2369.3/228.2 |
| 32 | 813/209 | 2.21/2.15 | 18.39/21.64 | 0.13/0.020 | 4295.4/194.5 |
| 64 | 983/192 | 2.19/2.15 | 15.22/16.59 | 0.15/0.021 | 4914.8/143.8 |
| 128 | 787/234 | 2.16/2.12 | 13.30/11.69 | 0.19/0.026 | 4295.7/150.8 |
| Translation invariance | |||||
| 4 | 1895/83 | 2.78/2.0 | 19.88/84.20 | 0.20/0.008 | 20946.0/111.8 |
| 8 | 1411/39 | 2.46/2.03 | 15.66/119.08 | 0.31/0.010 | 16850.6/94.3 |
| 16 | 817/96 | 2.27/2.05 | 13.92/48.95 | 0.37/0.011 | 9551.9/106.0 |
| 32 | 391/123 | 2.16/2.04 | 13.03/32.42 | 0.41/0.014 | 4511.9/113.9 |
| 64 | 155/173 | 2.06/2.06 | 12.43/19.44 | 0.42/0.018 | 1667.0/124.7 |
| 128 | 34/207 | 2.0/2.10 | 11.91/13.12 | 0.40/0.023 | 324.0/131.2 |
| Translation + rotation invariance | |||||
| 4 | 5609/88 | 2.26/2.02 | 14.38/53.73 | 0.02/0.018 | 3645.7/171.9 |
| 8 | 2521/154 | 2.66/2.14 | 22.06/33.51 | 0.02/0.017 | 2958.6/187.7 |
| 16 | 2245/197 | 2.79/2.14 | 15.95/23.83 | 0.02/0.018 | 1998.1/180.8 |
| 32 | 1348/209 | 2.80/2.14 | 14.57/19.97 | 0.02/0.016 | 1175.3/142.9 |
| 64 | 587/243 | 2.34/2.23 | 13.48/18.02 | 0.02/0.020 | 370.3/195.3 |
| 128 | 172/200 | 2.06/2.17 | 12.90/11.09 | 0.03/0.023 | 137.1/110.7 |
© 2016 by the author; licensee MDPI, Basel, Switzerland. This article is an open access article distributed under the terms and conditions of the Creative Commons Attribution (CC-BY) license (http://creativecommons.org/licenses/by/4.0/).
Share and Cite
Feuerhake, U. Recognition of Repetitive Movement Patterns—The Case of Football Analysis. ISPRS Int. J. Geo-Inf. 2016, 5, 208. https://0-doi-org.brum.beds.ac.uk/10.3390/ijgi5110208
Feuerhake U. Recognition of Repetitive Movement Patterns—The Case of Football Analysis. ISPRS International Journal of Geo-Information. 2016; 5(11):208. https://0-doi-org.brum.beds.ac.uk/10.3390/ijgi5110208
Chicago/Turabian StyleFeuerhake, Udo. 2016. "Recognition of Repetitive Movement Patterns—The Case of Football Analysis" ISPRS International Journal of Geo-Information 5, no. 11: 208. https://0-doi-org.brum.beds.ac.uk/10.3390/ijgi5110208