Article

Authoritative and Volunteered Geographical Information in a Developing Country: A Comparative Case Study of Road Datasets in Nairobi, Kenya

1
Department of Geography and Geoinformation Science, George Mason University, 4400 University Drive, MS 6C3, Fairfax, VA 22030, USA
2
Department of Computational and Data Sciences, George Mason University, 4400 University Drive, MS 6B2, Fairfax, VA 22030, USA
*
Author to whom correspondence should be addressed.
ISPRS Int. J. Geo-Inf. 2017, 6(1), 24; https://0-doi-org.brum.beds.ac.uk/10.3390/ijgi6010024
Submission received: 7 July 2016 / Revised: 9 January 2017 / Accepted: 16 January 2017 / Published: 20 January 2017
(This article belongs to the Special Issue Volunteered Geographic Information)

Abstract

:
With volunteered geographic information (VGI) platforms such as OpenStreetMap (OSM) becoming increasingly popular, we are faced with the challenge of assessing the quality of their content, in order to better understand its place relative to the authoritative content of more traditional sources. Until now, studies have focused primarily on developed countries, showing that VGI content can match or even surpass the quality of authoritative sources, with very few studies in developing countries. In this paper, we compare the quality of authoritative (data from the Regional Center for Mapping of Resources for Development (RCMRD)) and non-authoritative (data from OSM and Google’s Map Maker) road data in conjunction with population data in and around Nairobi, Kenya. Results show variability in coverage between all of these datasets. RCMRD provided the most complete, albeit less current, coverage when taking into account the entire study area, while OSM and Map Maker showed a degradation of coverage as one moves from central Nairobi towards rural areas. Furthermore, OSM had higher content density in large slums, surpassing the authoritative datasets at these locations, while Map Maker showed better coverage in rural housing areas. These results suggest a greater need for a more inclusive approach using VGI to supplement gaps in authoritative data in developing nations.

1. Introduction

Web 2.0 and the increased availability of relatively low cost location-aware mobile devices over the last decade have led to enormous amounts of user-generated geographical content online. Sources of such user-generated information include wikis, blogs, social media feeds, such as Twitter and Flickr, and open web mapping platforms, such as OpenStreetMap (OSM) [1]. Such information, once harvested, can be of immense benefit for a variety of applications. For example, it can be used to supplement existing geographical layers, such as remote sensing imagery for improving the mapping of floods (e.g., [2]), or to provide a new lens through which to better understand people, communities and their interaction with their surroundings (e.g., [3]). This user-generated content is broadly referred to as volunteered geographic information (VGI, [4]), while additional terms, such as ambient geographical information (AGI, [5]), have also been used to make the distinction between explicitly and implicitly crowd-contributed geographic content.
Crowdsourcing activities such as these are the product of digital and civic engagement [6,7]. As such, they reflect convoluted social and psychological processes, and the mechanisms that drive participation in various crowdsourcing projects have only recently begun to be studied (e.g., [7,8,9,10,11]). When it comes to VGI in particular, advancing our understanding of user motivations to participate in such activities will improve our ability to take full advantage of the value of such crowd-contributed information. Research by Neis and Zielstra [12] suggests that people contribute for intrinsic (e.g., altruism, fun/recreation, learning/personal enrichment, unique ethos and self-expression/image) or extrinsic (e.g., social reward/relations, career, personal reputation, community/project goal and system trust) reasons. Each community is expected to be unique in the combinations of factors that drive the contribution of VGI because of differences, for example, in mapping interest, culture and socio-economic standing. Such differences make the process used to generate VGI different from one group to the next. For instance, while some developed countries may be motivated by personal reputation or VGI as a fun or recreational event (e.g., [13]), most of the literature on VGI in supporting developing countries (e.g., [14,15,16]) has suggested its use for mainly addressing the often lack of available and updated geographic datasets at these locations.
When it comes to developing countries, VGI contributions tend to be made in spurts, for example in response to a country entering the global spotlight, as may be the case in the aftermath of a natural disaster (e.g., [17,18,19]), rather than as a regular, continuous process. Most large-scale instances of VGI for developing countries, at least those often reported in the literature, occur during time of disasters (e.g., the 2010 Haiti earthquake) or for other humanitarian purposes (e.g., Map Kibera [20]). Within recent years, there has also been various map drives (i.e., mapping events/mapathons) by organizations, such as the Humanitarian OpenStreetMap Team and MapGive (an initiative of the U.S. Department of State’s Humanitarian Information Unit) to increase the penetration of VGI mapping activities in developing countries. However, the sustainability and utility of these types of activities is still yet to be proven. This is in addition to the various factors reported in the literature that influence the overall low contribution of VGI in developing countries (which will be discussed in more detail in Section 2). For example, a recent national mapping event in the small tropical and Caribbean island of Saint Lucia [21] suggests that some governments in developing countries do recognize the value of VGI, in the sense that it can be used to monitor the public’s perception [22], along with providing new ways to interact with and capture information on cities [23,24] and strengthening civil society [25].
Developing countries are currently facing challenges with rapid and unsustainable population growth [26], rapid urbanization and massive infrastructure development, which often lead to issues, such as the proliferation and expansion of slums. To adequately address such issues, there is a critical need for up-to-date and reliable spatial information [27]. However, for many developing countries, the cost of creating and maintaining an updated national geographical database is very high. Some developing countries are unable to make the financial commitments necessary to support these types of large-scale projects [28]. This makes the availability and potential use of VGI an attractive alternative due to its low cost compared to more traditional spatial data collection methods. However, little is known about the quality of VGI data sources and their suitability for such application domains given the spatial data needs in the developing world.
This paper presents one of the first studies to assess the quality of VGI data in developing countries. Our aim is to contribute to the assessment of the coverage of authoritative and non-authoritative sources of road data in a developing country in Africa, Kenya in this case, in order to advance our understanding of the value of VGI for the developing world. Towards this goal, we build upon earlier work (see Section 2) to highlight how such methods can be utilized in order to gain insights into the potential of VGI as a complementary data source for addressing the spatial data needs of such countries.
Our case study focuses on Nairobi, Kenya, and we compare and contrast VGI data, as captured by OSM and Google Map Maker, to what was at that time the most current authoritative national-level data. This introduces an additional challenge that is endemic to such developing countries, namely the lack of the concurrency of such data. These authoritative data, while being the most current at that time, were three years old (last updated in 2011), whereas our study focused on data available in 2014. To properly address this challenge, we have to consider three research questions that comprise the contribution of this paper. First, how does VGI road data compare to authoritative road data in terms of coverage for the same time period? Second, how does more recent VGI road data compare to the only source of older authoritative road data in terms of coverage? In addressing these questions, we have to explore two key characteristics of VGI: its coverage (with respect to roads) and its relationship with population density. Consequently, the third research question addressed herein is to explore the relationship between population density and road coverage in our study area.
This study therefore contributes in advancing our understanding of the utility of VGI contributions for supplementing, or even extending, authoritative data sources in developing countries. Through such analysis, developing countries could better leverage VGI for meeting their growing spatial data needs.
The remainder of this paper is organized as follows. In Section 2, we review previous research on the contribution patterns, completeness and coverage of VGI data. Section 3 briefly introduces our study area and data used in our analysis before outlining our methodology in Section 4 and the results and analysis of our case study in Section 5. Finally, Section 6 concludes this paper with recommendations for future work.

2. Background

Over the past decade, there has been immense growth and interest in the use of VGI as an alternative and supplementary source of spatial data, compared to traditional sources, such as national mapping agencies. A prototypical example of VGI is the OSM project. This project was started at the University College of London in July 2004, and by May 2008, it had already enlisted more than 35,000 registered users [29]. Today, the number of registered OSM users has risen to almost three million globally [30], signaling the continued interest in the creation and use of OSM data. OSM data have been used to support a plethora of studies in many different disciplines (see [31] for a comprehensive review). For example, OSM has been used to assess the reliability of wheelchair routes (e.g., [32]), to create 3D models of cities, for real-time navigation (e.g., [33,34]) and for supporting disaster relief. Examples include the Ebola outbreak in West Africa in 2014 [35] and the Haitian [17] and Nepal [36] earthquakes in 2010 and 2015, respectively. In addition, OSM has been used for supporting community-based mapping of marginalized communities, such as slums (e.g., [37]). Given the growing number of OSM users and the use of these data, it is expected that the number of applications using OSM will continue to grow in the foreseeable future.
Motivated by the various benefits of VGI, several studies have compared the quality between VGI extracted from open data platforms and authoritative data. While some level of quality assurance can usually be obtained from more authoritative commercial data providers [38], such measures are often non-existent or very limited in the case of VGI [39,40,41,42]. This has prompted concerns to be raised about the quality of VGI and its appropriateness for use, especially when these data are used to support critical applications (e.g., humanitarian assistance and vehicle navigation). As a result, several studies have examined the quality of VGI data by comparing it to commercial or authoritative sources of data. Haklay [43], for example, compared the positional accuracy and completeness of OSM with Ordinance Survey (OS) road data, a trusted authoritative source of data in the U.K. In that study, positional error was calculated using a set of buffered distances, which radiated outwards from OS roads. The percentage of OSM roads that overlapped with those buffers was then calculated. The completeness of roads was determined by comparing the total length of roads per 1 km × 1 km grid cell for both OSM and OS. That study reported the average positional accuracy for OSM to be about 6 m when compared with the OS data, including an almost 80% overlap between motorways in both datasets for London. Further, comparing the completeness of OSM roads for the entire U.K., Haklay [43] found that at the time, OSM roads accounted for 69% of OS data with as much as 25% better coverage using OSM data in some areas. A similar high correspondence (97% in urban areas) was reported by Ludwig et al. [44], comparing the completeness of road features (e.g., primary, secondary and cycle paths) in OSM with Navteq data in several German cities. With respect to the latter study in Germany, however, care must be taken when extrapolating the results of such studies to other cities, since, as Neis et al. [45] suggests, Germany contains the most active OSM communities. It is therefore not surprising to have reported cases of OSM coverage matching or even exceeding the quality of commercial or authoritative data at those locations. This statement is further exemplified by the work of the Map Kibera project in Nairobi, Kenya, a community-based mapping initiative to map slums in Kenya, making them visible to the world [20]. It is expected that OSM coverage in active project areas will be much higher when compared to other areas where there has been little or no similar types of projects.
However, besides the work of Haklay [46] in Haiti and Camboim et al. [16] in Brazil, to the authors’ knowledge, no other studies currently exist for comparing such data for developing countries. In Haklay [46], this preliminary study used the same method as in Haklay [43] to calculate road completeness, comparing the road coverage between OSM and Map Maker data obtained after the 2010 Haitian earthquake. The author showed that within days immediately following the event, OSM had more comprehensive coverage at the earthquake’s epicenter in the capital city Port-au-Prince and immediate surrounding areas. Map Maker, on the other hand, showed greater coverage in some of the more rural areas near the northern and southwestern parts of the country. The same measure of completeness was used by Camboim et al. [16], along with three additional completeness measures (road length, number of buildings and attribute completeness) and two temporal measures (number of editors per region and days past last change) to assess the quality of VGI for urban and rural areas in Curitiba, Brazil. That study showed higher completeness and temporal values in areas with larger population densities. In addition to this, further correlation testing with derived completeness and temporal measures with demographic information collected from census data showed that VGI alone is insufficient for providing adequate demographic information in poorer and isolated parts of the study area. Similar results showing differences in coverage in road networks and associated land use and land cover were also shown by Arsanjani et al. [26], comparing OSM to land use and land cover data in several German cities. Research has also explored the potential association between VGI contribution patterns and variances in socio-demographic and socio-economic characteristics of the population (e.g., [43,47,48,49]). Such studies have generally shown that such characteristics can impact OSM contributions.
More qualitative approaches have also been used to assess the quality of VGI road data. For example, Ciepłuch et al. [50] compared the accuracy of Google Maps, Bing Maps and OSM data for Ireland. In that study, a web application was developed to have all three datasets superimposed on each other. A 4 km × 4 km regular grid of cells was then used to visually compare differences in coverage between road networks. Ciepłuch et al. [50] suggested that because of spatial variation in road coverage reported by all three data layers, that is some areas were better served by one data source compared to the others, no single data source could be said to have overall better coverage. More recently, Hochmair et al. [51] compared the completeness of cycling features in OSM and Google Maps in several U.S. cities with data collected from local planning agencies. Greater OSM coverage was reported for trails compared with bicycle lanes in inner city locations where Google coverage was better. Ultimately, as was suggested in that study and others, both OSM and Google Maps data can be used to complement each other, with further improvement in the coverage of cycling features gained from the use of local planning data where available. Such studies highlight the increasing interest in the use of OSM.
However, while the amount of VGI data continues to grow, the spatial distribution of these data has not been equal. Studies in the Western world suggest that urban areas tend to receive much higher coverage of VGI compared to rural areas (e.g., [43,52,53]) and cities with a higher socio-economic standing (e.g., [45]). As suggested by Johnson and Hecht [54], this is due to systematic differences in population densities, that is urban areas have a larger number of users per area to map features compared to rural areas. As a result, places with higher population densities often have greater completeness and positional accuracy in VGI data when compared to other areas with low population densities, for example rural areas [55].
In this paper, we extend this body of work by addressing the potential correlation between population density and VGI contributions in Kenya, in order to gain insights on this interrelationship in the developing world.

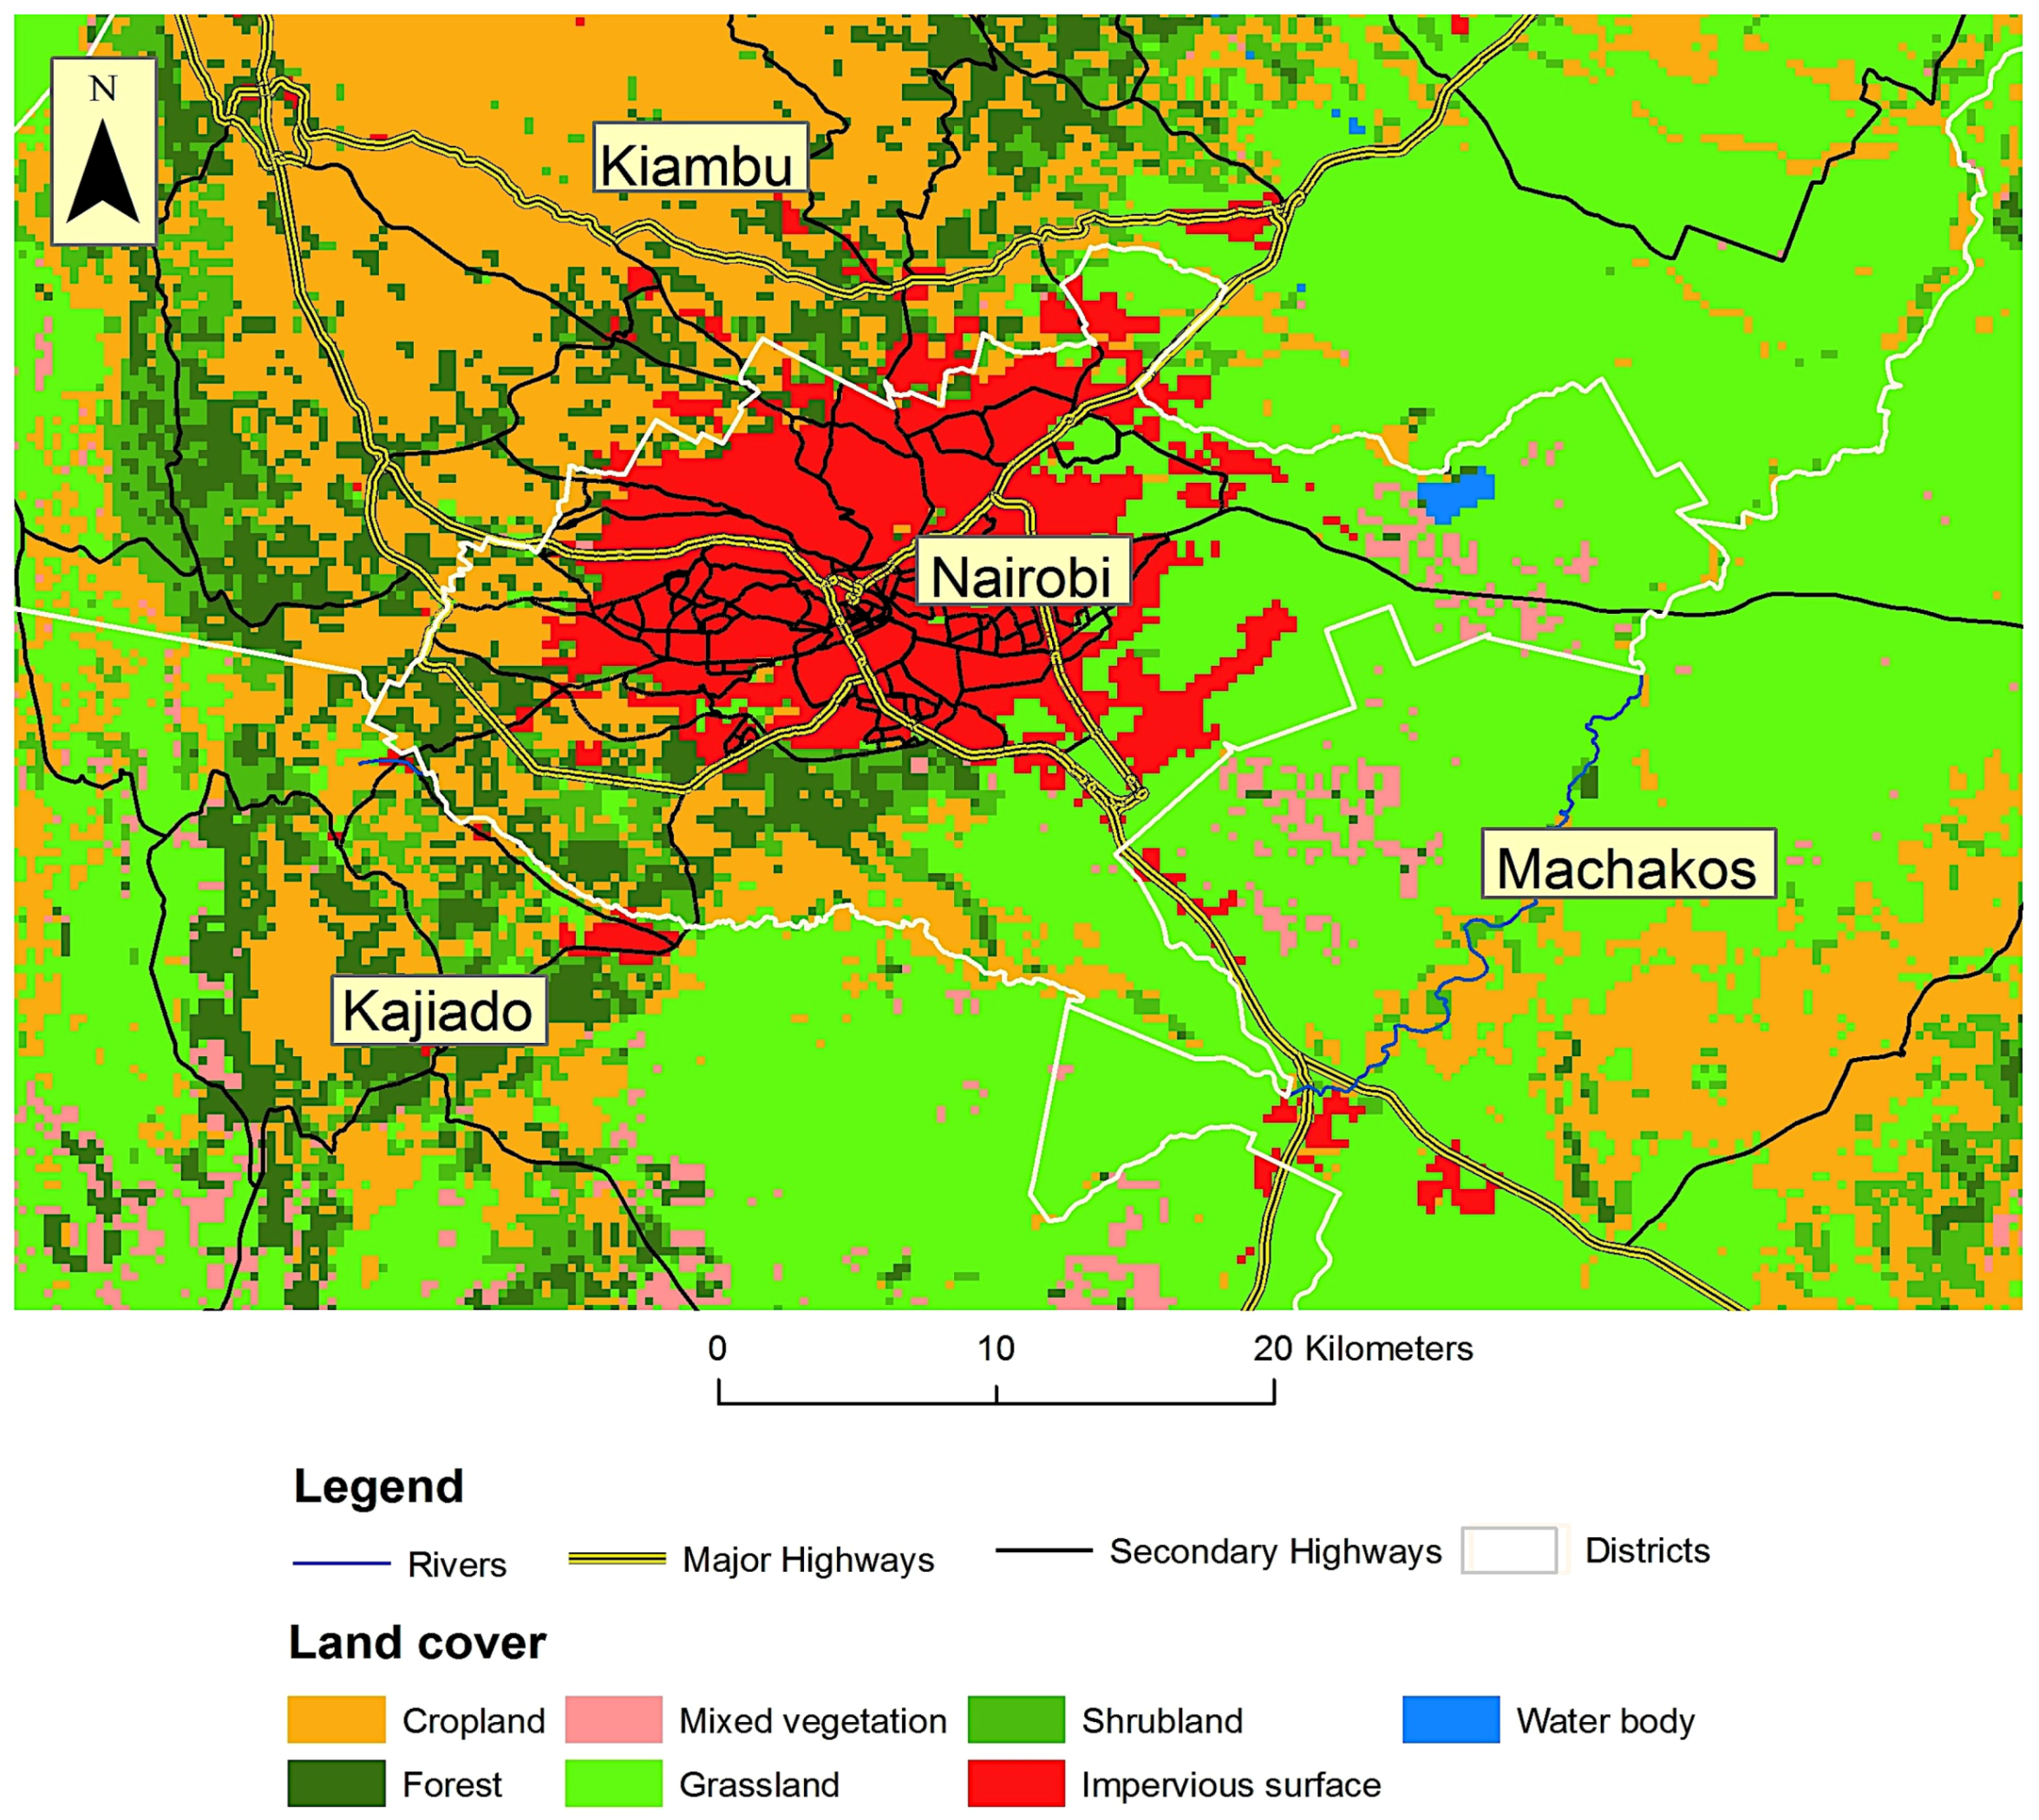
3. Study Area and Data

Nairobi is the capital city of Kenya in eastern Africa. The city is situated between longitudes 36°04′ and 37°01′ E and latitudes 1°09′ and 1°28′ S, with an area covering 689 km2 [56]. Nairobi is among the largest commercial, industrial, financial, education and communications hubs in Africa [57]. In July 2011, Kenya became the first Sub-Saharan African country, second only to Morocco for developing countries, to launch an open data geoportal called OpenKenya. As of May 2015, almost 500 datasets had been uploaded to OpenKenya [58]. Supporting Kenya’s open data initiative has been substantial investments in information communication technology (ICT), funded by both the Kenyan government and external sources, such as the World Bank. For many, open data platforms such OSM, an Internet connection is necessary to upload new map edits [4]. In 2013, Kenya’s Internet penetration rate was exceeding 20%, well above average compared to many other low income countries, and rose to 39% as of 2015 [59]. Unlike some developing countries, for example, Bangladesh, where OSM penetration has been relatively low [60], there has been a hub of activity in Nairobi. This is in part due to the impact of the Map Kibera project.
Being the largest city in Kenya, Nairobi attracts many people from other urban and rural areas in search of better economic and livelihood opportunities. This has led to rapid and uncontrolled urban growth, leading to the proliferation of slums, a problem with which the Kenyan government continues to struggle. According to the African Population and Health Research Center (APHRC) [61], about 60%–70% of Nairobi’s population (about three million according to the last census [62]) currently live in slums. Not surprising, many international organizations, such as the United Nations and the World Bank, continue to fund projects geared towards improving the quality of life in slum communities in and around Nairobi. This has also given rise to many studies that use Nairobi as a test bed to study poverty and for politicizing the need for improving conditions of poor populations in general (e.g., [63,64,65]).
Given the impact of ICT in and around Nairobi and current issues with increasing urbanization and poverty, there is need for up-to-date and reliable geographical data on critical infrastructure, such as roads, for this area. This makes Nairobi a suitable and, at the same time, a very interesting area for examining the coverage of road infrastructure from different authoritative and non-authoritative sources. Figure 1 shows the study area, Nairobi, and its immediate surroundings, an area covering an extent of 48 km × 72 km. As shown in Figure 1, Nairobi is immediately surrounded by three other counties: Kiambu, Kajiado and Machakos. Nairobi is highly urbanized, whereas its surrounding counties contain a mix of agrarian and rural land covers. The land cover information used in Figure 1 is a generalized version of the GlobCover global land cover product [66]. This product has a spatial resolution of 300 m × 300 m, which because of its coarse resolution, hides the presence of transportation types of land uses, such as roads. This image is therefore used in this paper for describing the general physical qualities of the study area.
In Table 1, we summarize the available data sources for our study. We list the data source, mode of acquisition and the most recent update of each database (as of the time of this study). Road data were acquired from three leading sources of geospatial information for Kenya, representing their most current data as of 2014:
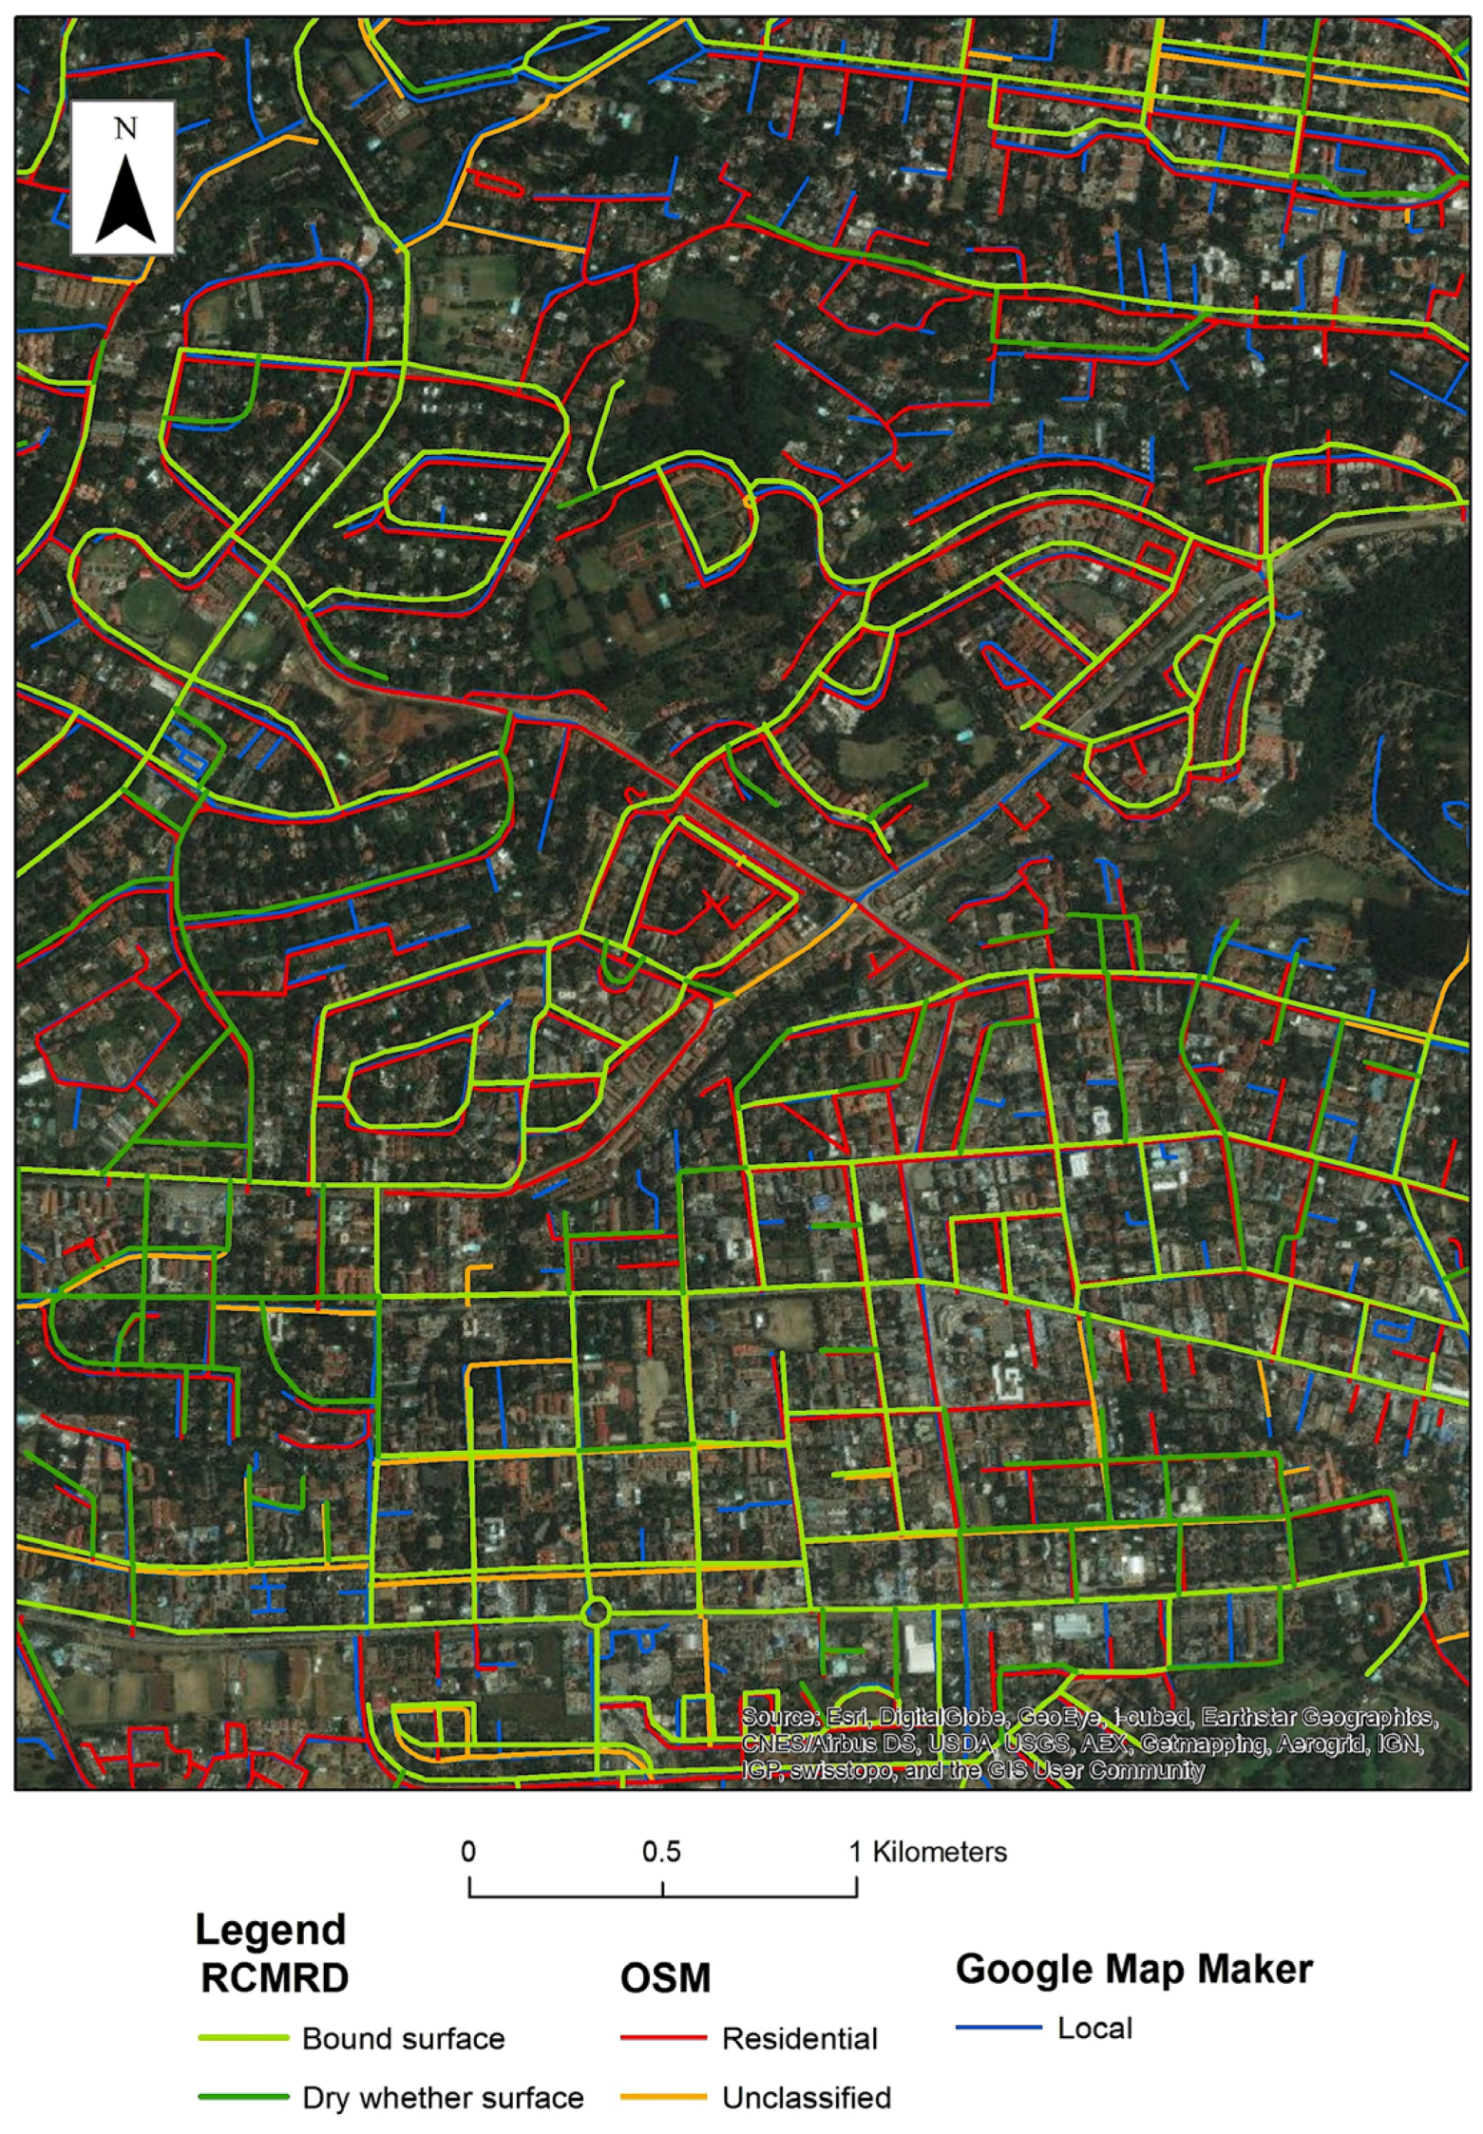
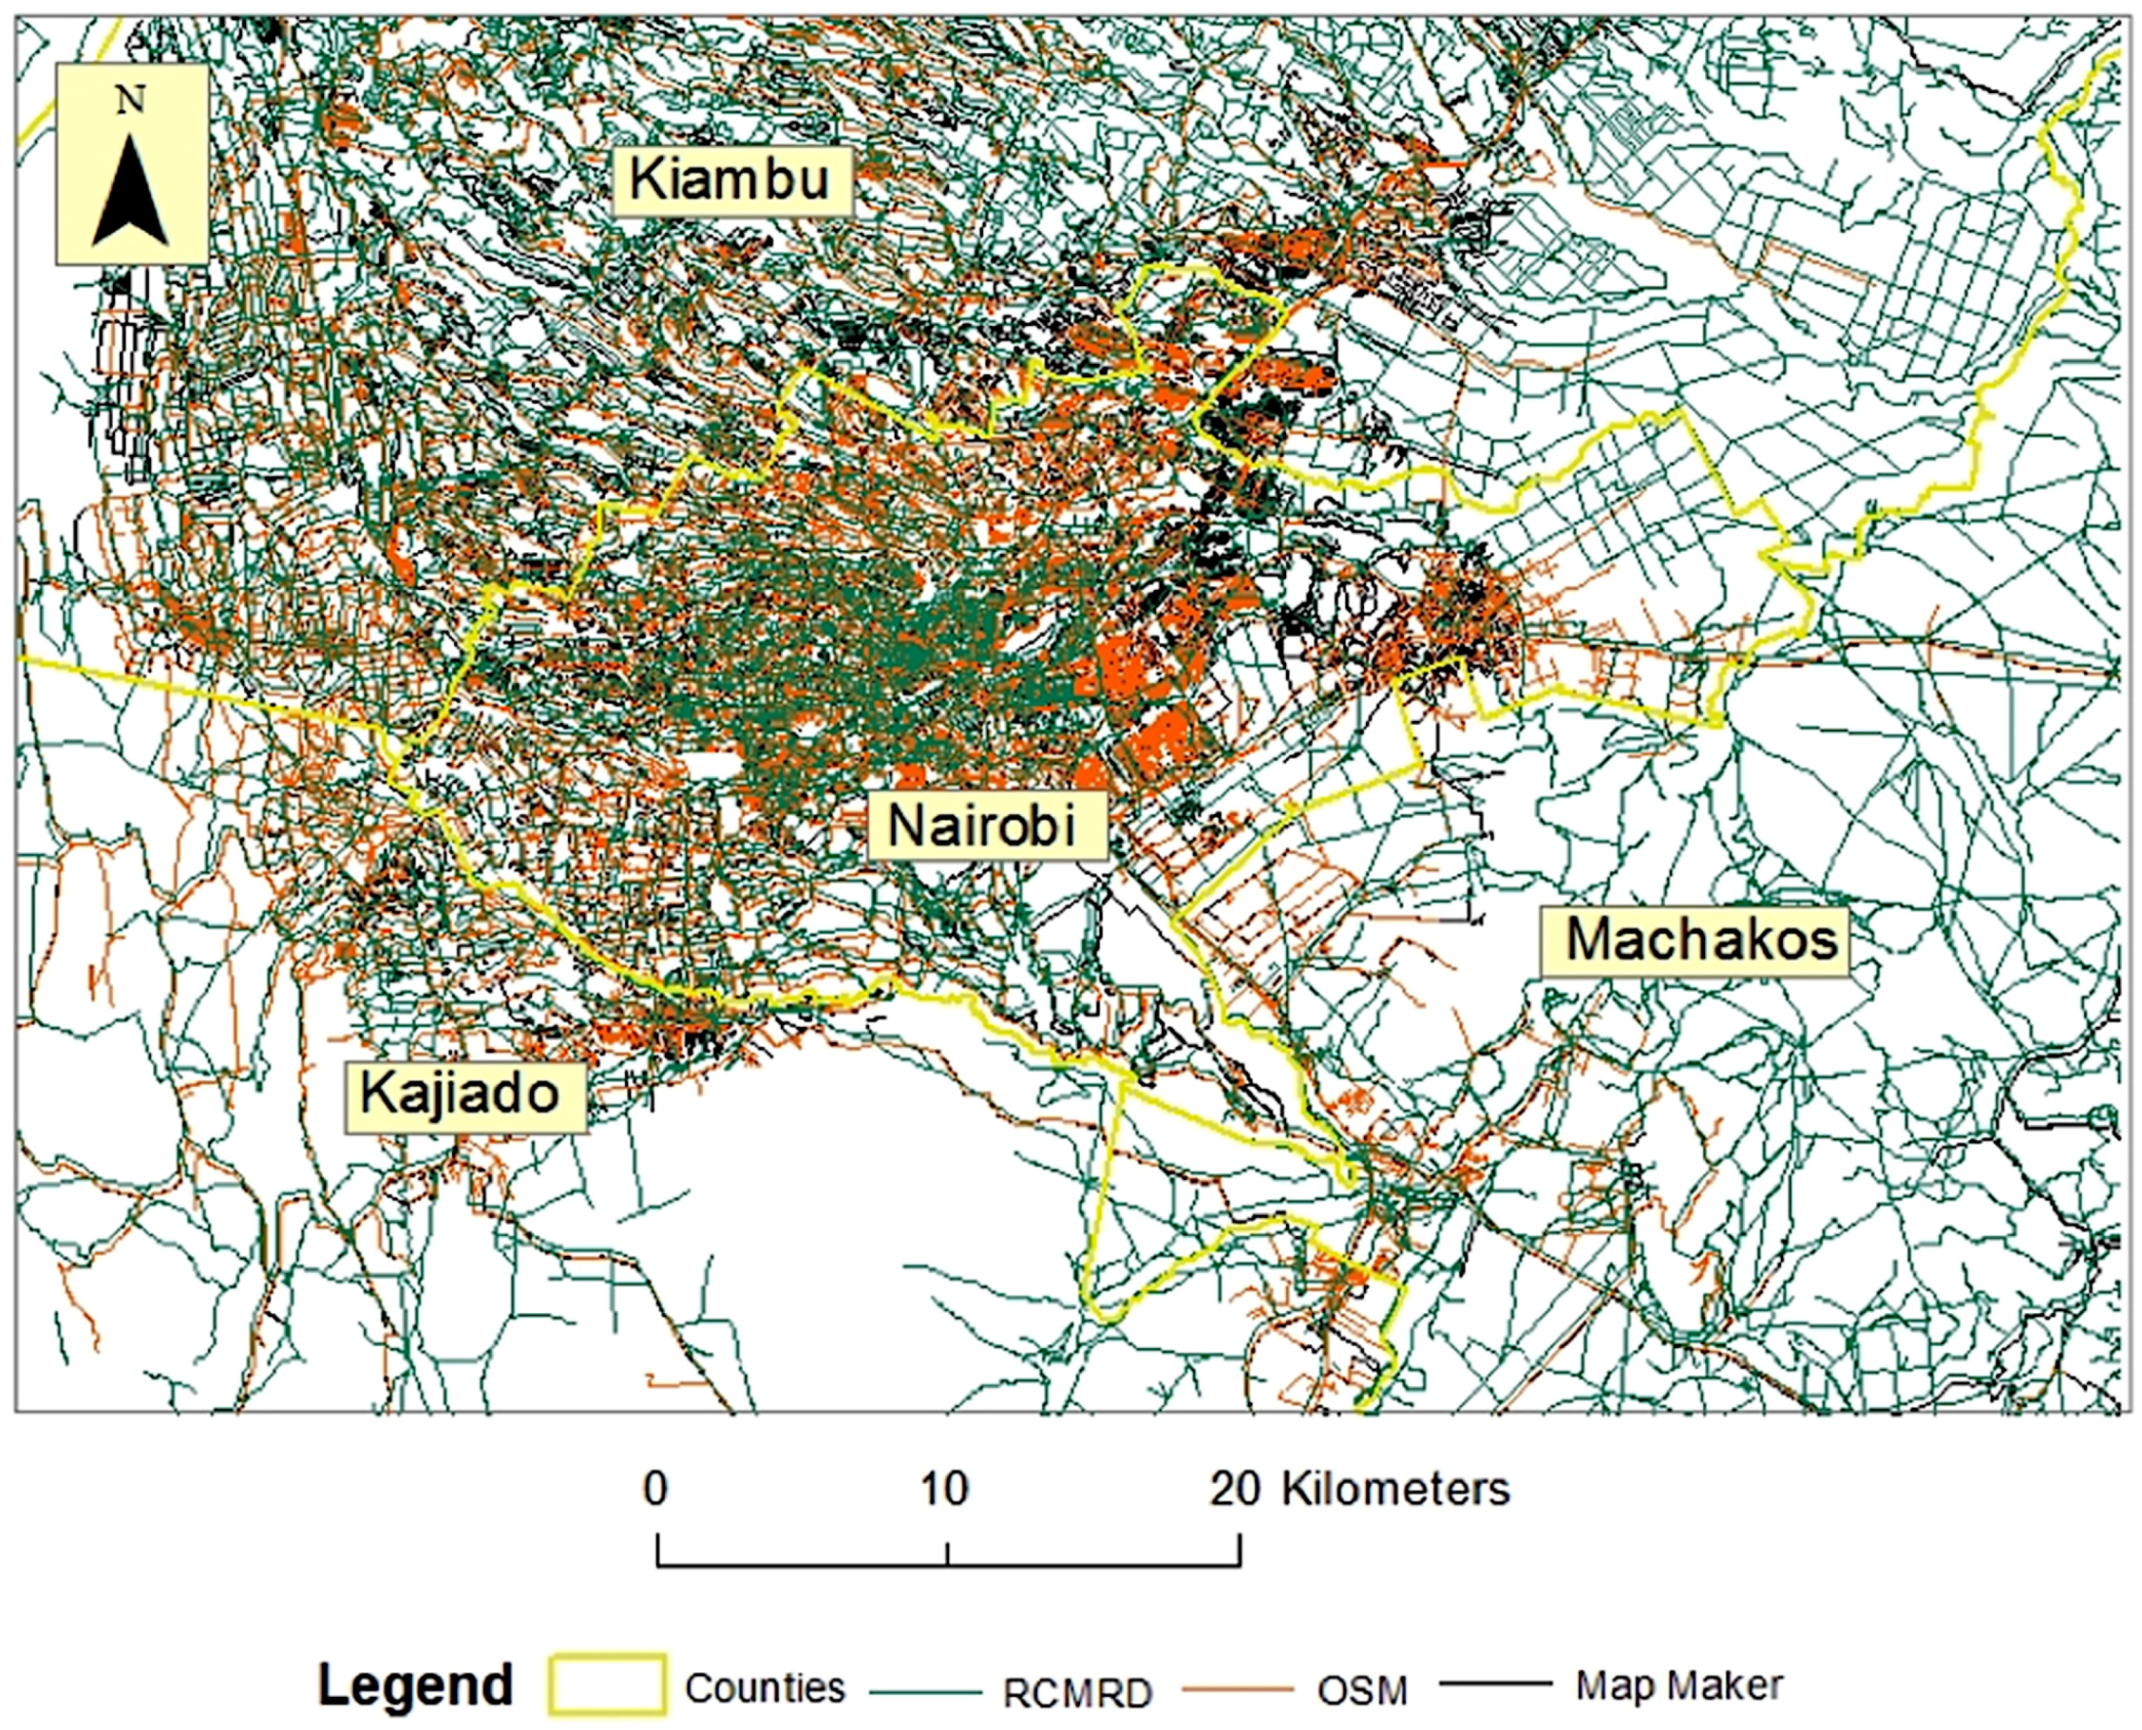
  • RCMRD (Regional Center for Mapping Resources for Development)
  • OSM
  • Google’s Map Maker.
RCMRD serves as the authoritative data baseline for our study. OSM and Map Maker are both non-authoritative and well-known sources of VGI data, and these are the two datasets that will be contrasted with RCMRD in this study. In order to address the above-stated challenge of the non-concurrency of these datasets, we also considered the relevant OSM datasets as of 2011. By considering both 2014 and 2011 OSM datasets, we are not only able to compare the authoritative and VGI datasets available as of 2014, but also to highlight potential progress made within OSM in mapping Nairobi during the three-year period of 2011–2014. Unfortunately, such a comparison cannot be made with the Map Maker dataset, as 2011 data were not available for this study.
Our rationale for including Map Maker was two-fold. First is to compare and contrast differences between VGI products for the same time period (e.g., 2014). Studies have compared data from both OSM and Map Maker (e.g., [43]), identifying differences in their spatial coverage; however, such differences have not been widely studied. Secondly, this comparison provides us with another VGI product to contrast against authoritative data. Together, such analysis could be used to help better understand the variations in VGI coverage from different platforms. This can potentially suggest areas where one dataset may provide more comprehensive coverage compared to another, as well as where such datasets can be complementary to each other.
The Regional Center for Mapping Resources for Development is an intergovernmental organization set up by the United Nations Economic Commission for Africa in 1975. The goal of RCMRD is to promote sustainable development through the generation, use and dissemination of geographical information, supporting information and communication technologies, products and services [72]. RCMRD is considered to be one of the foremost sources of authoritative geographical data for several African countries, including Kenya. The RCMRD data obtained for this study were obtained through the Virtual Kenya geoportal. As shown in Table 1, while the data were harvested in 2014, the latest update time for that dataset was 2011. This lack of current data is common in developing countries and is reflective of the data poverty associated with such nations, with African nations being particularly disadvantaged in that regard [73]. Considering spatial data availability in Kenya, in particular, studies have captured the poor state of the Kenyan spatial data infrastructure and spatial data availability overall [74,75]. Therefore, it is not uncommon for the ‘most current data’ available in countries, such as Kenya, to be slightly outdated. This is in sharp contrast to the rapid growth of these nations, which further emphasizes the nature of the problem and the need to address it, which is exactly the main focus of this publication.
In order to support our analysis, we also needed auxiliary datasets in the form of population data and country boundaries, and the sources of these datasets are also included in Table 1. Population data were acquired from Oak Ridge National Laboratory’s (ORNL) global LandScan database [69]. LandScan represents one of the most complete sources of population data and is the only source of global population data available annually. As discussed by Bhaduri et al. [76], LandScan incorporates a mix of open, commercial and non-disclosed sources of information in the generation of its product. Counties for Kenya were obtained from the Kenya Open Data geoportal [58], while land cover information was collected from the European Space Agency geoportal [66].

4. Methodology

To capture the extent of road coverage, we followed an approach comparable to the one introduced by Haklay [43]. The test area was tessellated into 1 km × 1 km grid cells coinciding with LandScan data, and within each cell, we computed the corresponding total road length. In doing so, we considered all road types, not just motorways, as was the case in [43], to better accommodate for the lack of road classification standardization across data sources of our case study area, which is quite prevalent in developing countries (see, e.g., Okuku et al. [77] for an assessment of the situation in Kenya).
In order to demonstrate this issue with standardization, consider a residential area located immediately to the west of downtown Nairobi, as depicted in Figure 2. Overlaying the three data sources (RCMRD, OSM for 2014 and Google Map Maker) reveals substantial overlap between “residential” roads in OSM and “local” roads (Google’s classification for residential roads) in Map Maker. The RCMRD road layer obtained for use in this study contained roads classified according to different surface types, with “bound” and “dry weather” surface type roads covering the extent in Figure 2 and also overlapping with roads from OSM and Map Maker. Figure 2 also show several roads as “unclassified” in the OSM data and overlapping with roads from Map Maker and RCMRD. It should be noted to the reader that according to its OSM classification, “unclassified” roads are minor non-residential roads that are meant for local traffic and for connecting small towns [78]. However, many roads within the study area, as Figure 2 shows, have been labeled by contributors as “unclassified” in the OSM data. These include major roads in and around downtown Nairobi. Such instances of mislabeling are common to OSM as users are not required to accept the OSM suggested tags for labelling their mapped features [79]. Therefore, in this study, we use all roads labelled as “unclassified” in the same manner as any other type of classified road in the OSM database. In the 2014 OSM database, “unclassified” roads accounted for 23% of all OSM roads for the study area. The non-standardization of road types from all three data sources, along with the large amount of “unclassified” roads in the OSM in the study area make the conflation of roads a challenging task. Moreover, for some communities in Kenya, for example, the Kibera slum, a large number of roads in this slum is classified as “tracks”, “footpaths” and “dirt roads” in OSM data, as compared with much more limited coverage in RCMRD and Map Maker. Some of these informal roads were also labeled as “local roads” in Map Maker. Similarly, in the Karura forest reserve, just north of downtown Nairobi, several trails are labelled in OSM as “tracks” and “footpaths”.
It is important to note that these differences between road classifications are not only semantic. Failure to capture all roads can have a significant impact on the analysis in that focusing on specific types of roads may fall short of capturing the intricate nature of the transportation networks within and around slums. Residents in slums such as Kibera depend on these informal roads for accessing places both within and outside of their slum [65]. Consequently, failure to capture these types of roads in the analysis could potentially lead to a bias in road coverage favoring more authoritative sources of road data. In this study, we therefore make no distinction between different types of roads. A similar comparison of total road length of all road types between OSM roads and road lengths contained in the World Fact Book [81] is provided at the national level of aggregation by MapBox [82].
Both first order statistics, such as mean and standard deviation, and the geographic distribution of each source of road data were examined. Following this, the pairwise difference in coverage between road networks was extracted by subtracting the values of overlapping grid cells. Next, local instances of spatial autocorrelation (LISA, [83]) were used to examine significant spatial patterns of clustering between the pairwise differences in road coverage. Specifically, LISA was used to identify patterns in the spatial differences between roads, population density and road coverage in relation to population density. LISA, a local adaptation of the global Moran’s I test statistic, is given as: lack of road classification standardization across data sources of our case study area:
I i = x i X ¯ S i 2   j = 1 , j i n w i , j ( x i   X ¯ )
where x i , is an attribute (i.e., road coverage, population density and road coverage in relation to population density) belonging to feature i (a 1 km by 1 km grid cell), X ¯ is the mean attribute value of feature x i ,   w i , j is the spatial weight between features i and j and:
S i 2 =   j = 1 ,   j i   n ( x i   X ¯ ) n 1
with n representing the number of features. Implemented in the ArcGIS 10.3.1 geospatial software suite, a Pearson’s significance value of 0.05 is used to indicate areas of high and low spatial clusters of values. Two different types of outliers are also identified: areas of high values surrounded by areas of low values (high-low) and areas of low values surrounded by other areas with high values (low-high).
To study the impact of population density on road coverage, extending the work of Haklay [43], the procedure outlined above was repeated with the road data first being normalized using the LandScan data before moving forward. This gave the total length of roads per 1 km × 1 km population density grid cell.

5. Results and Analysis

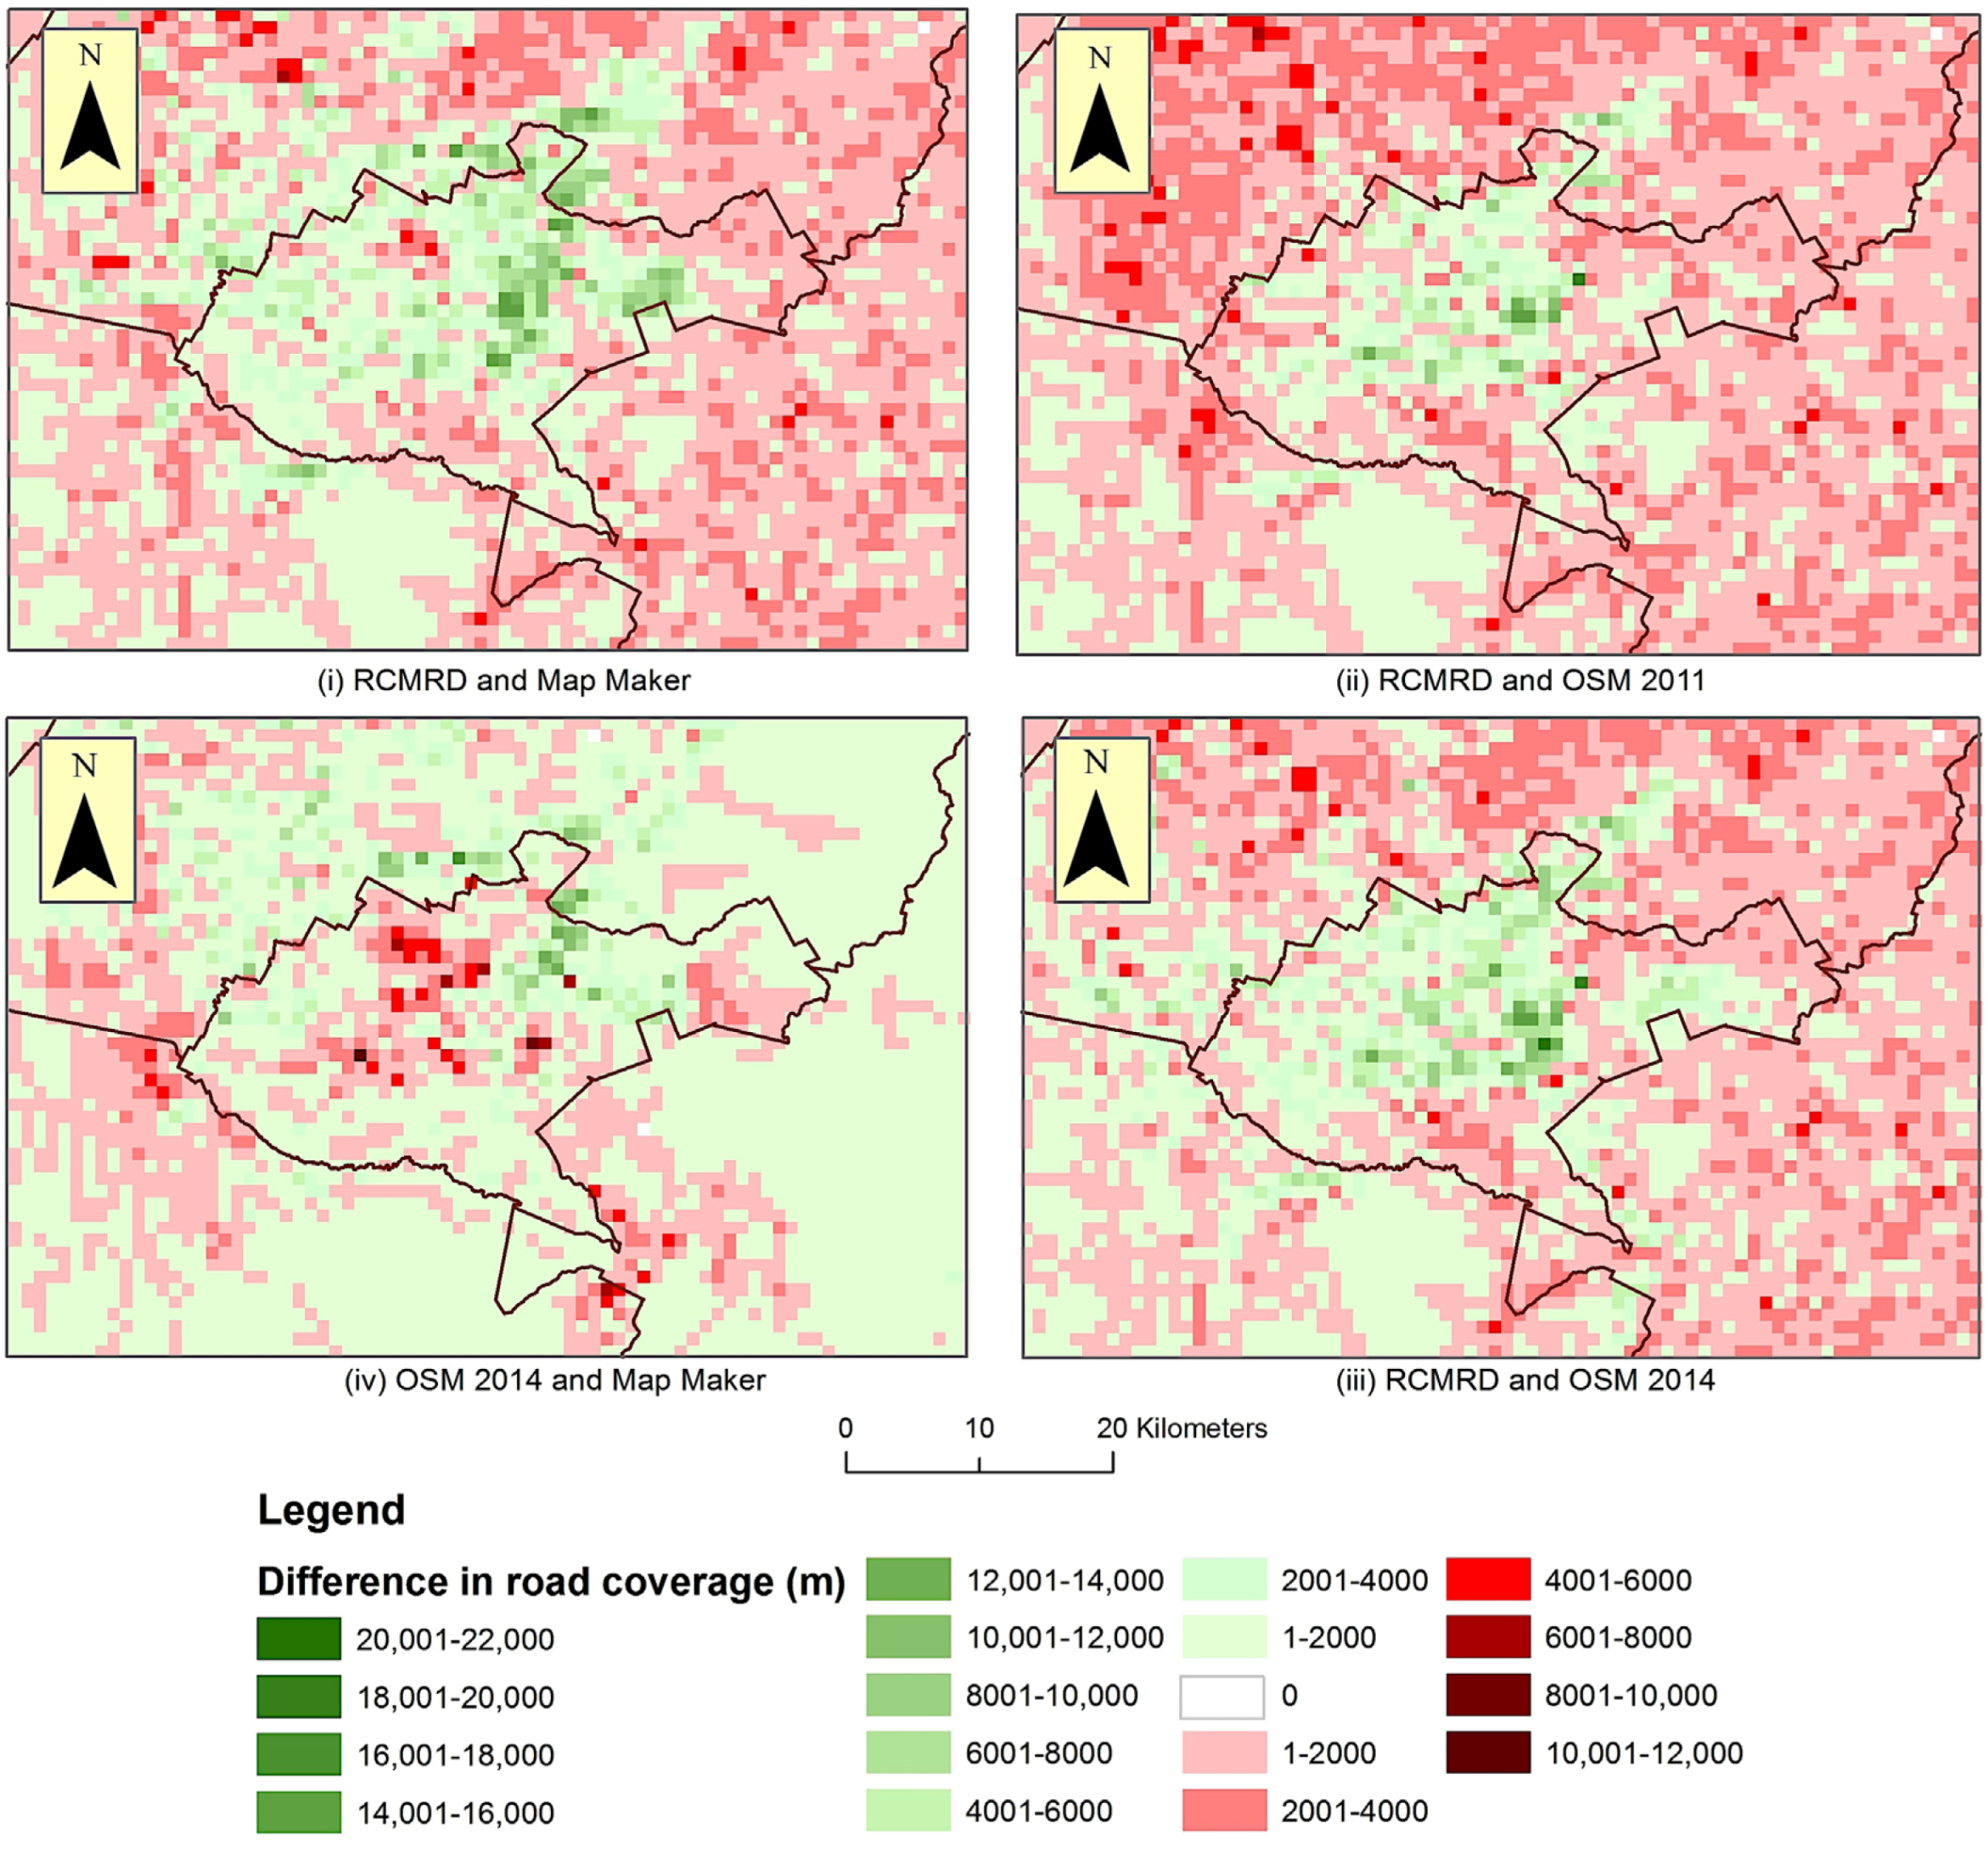
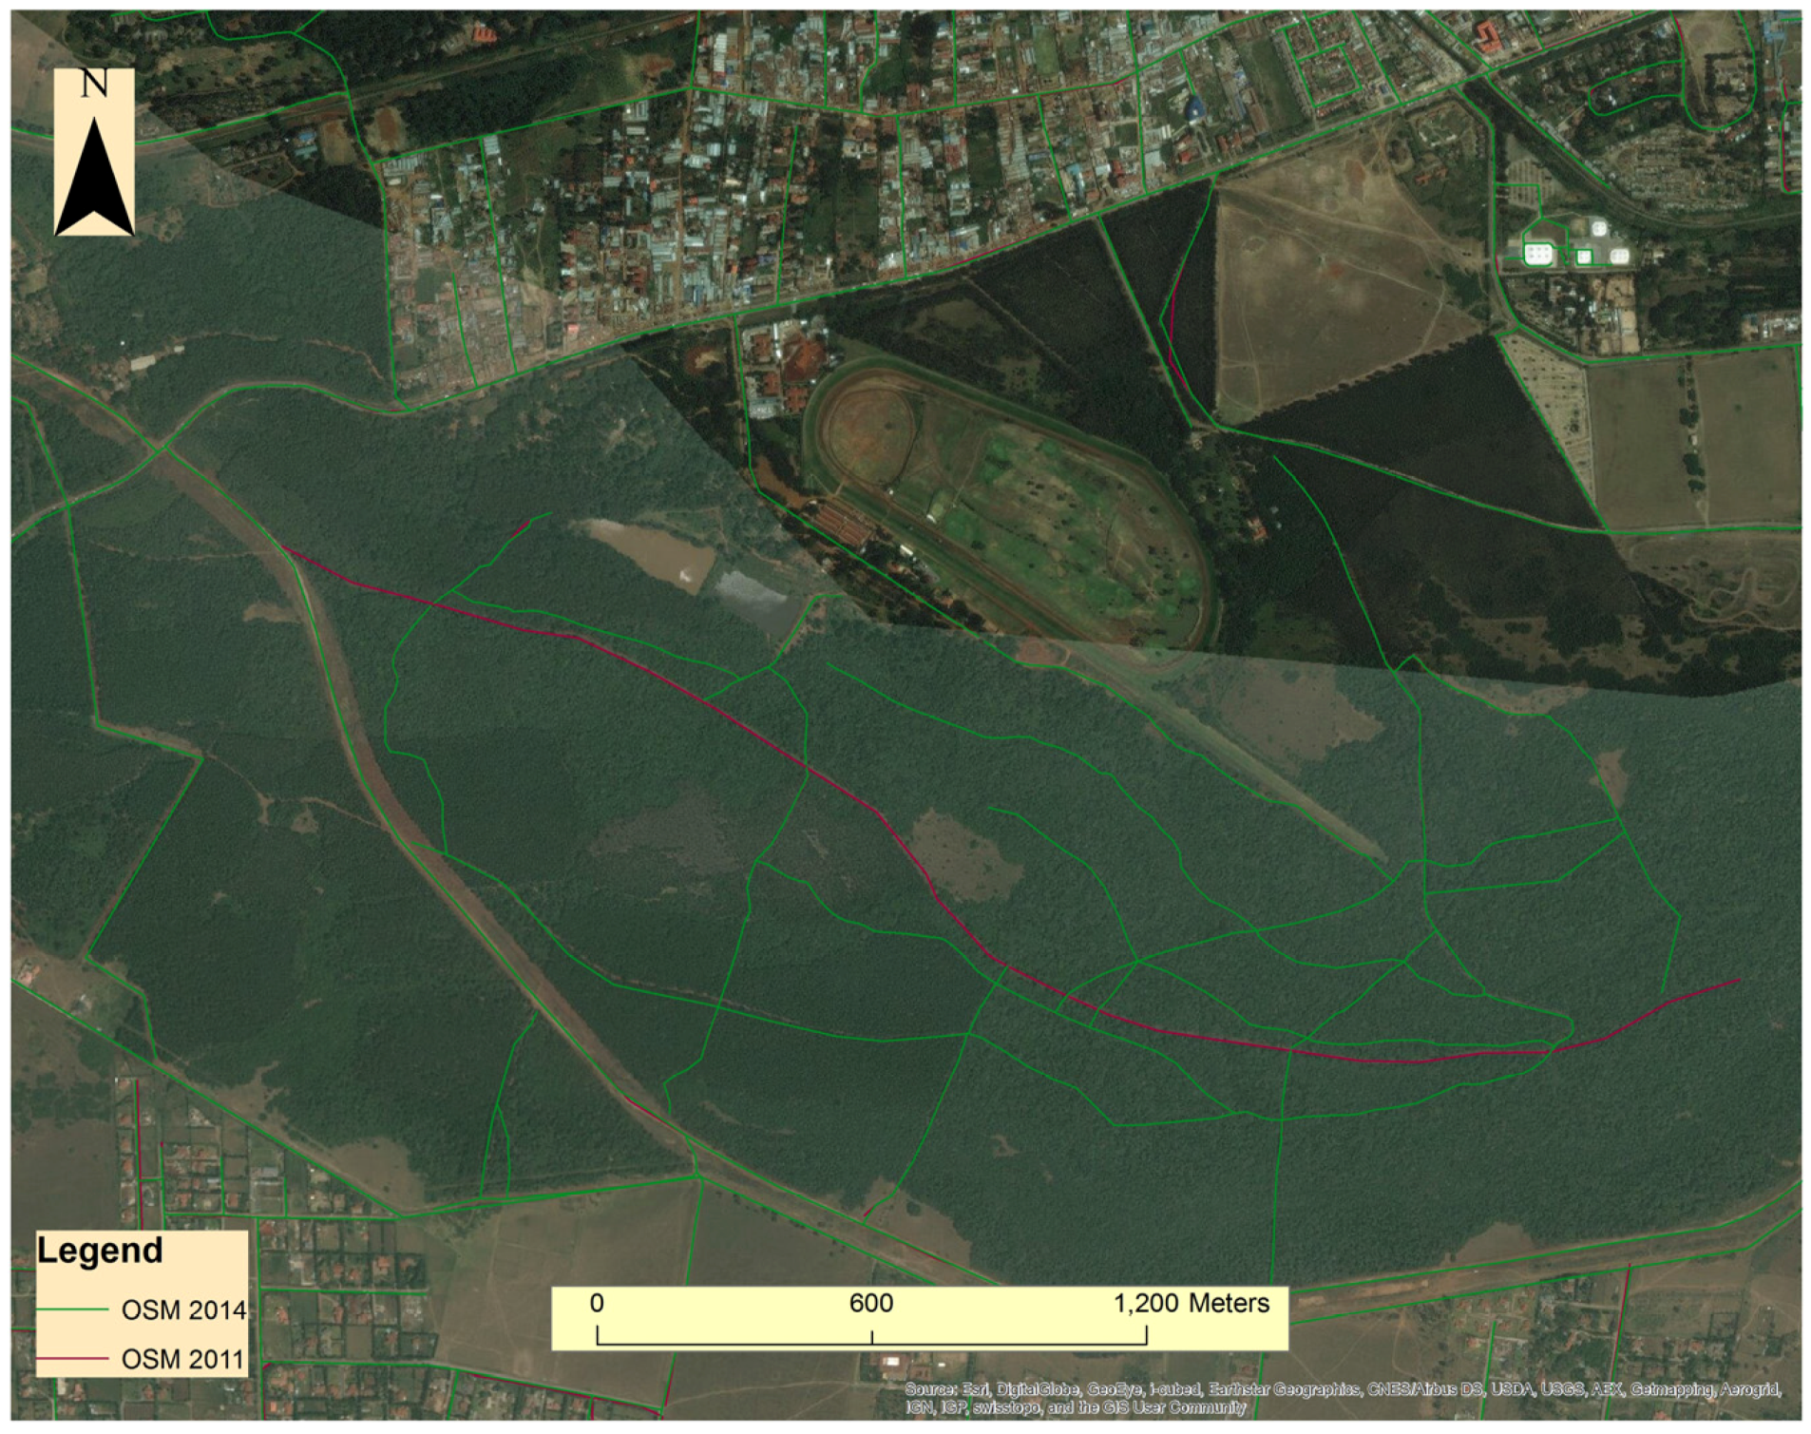
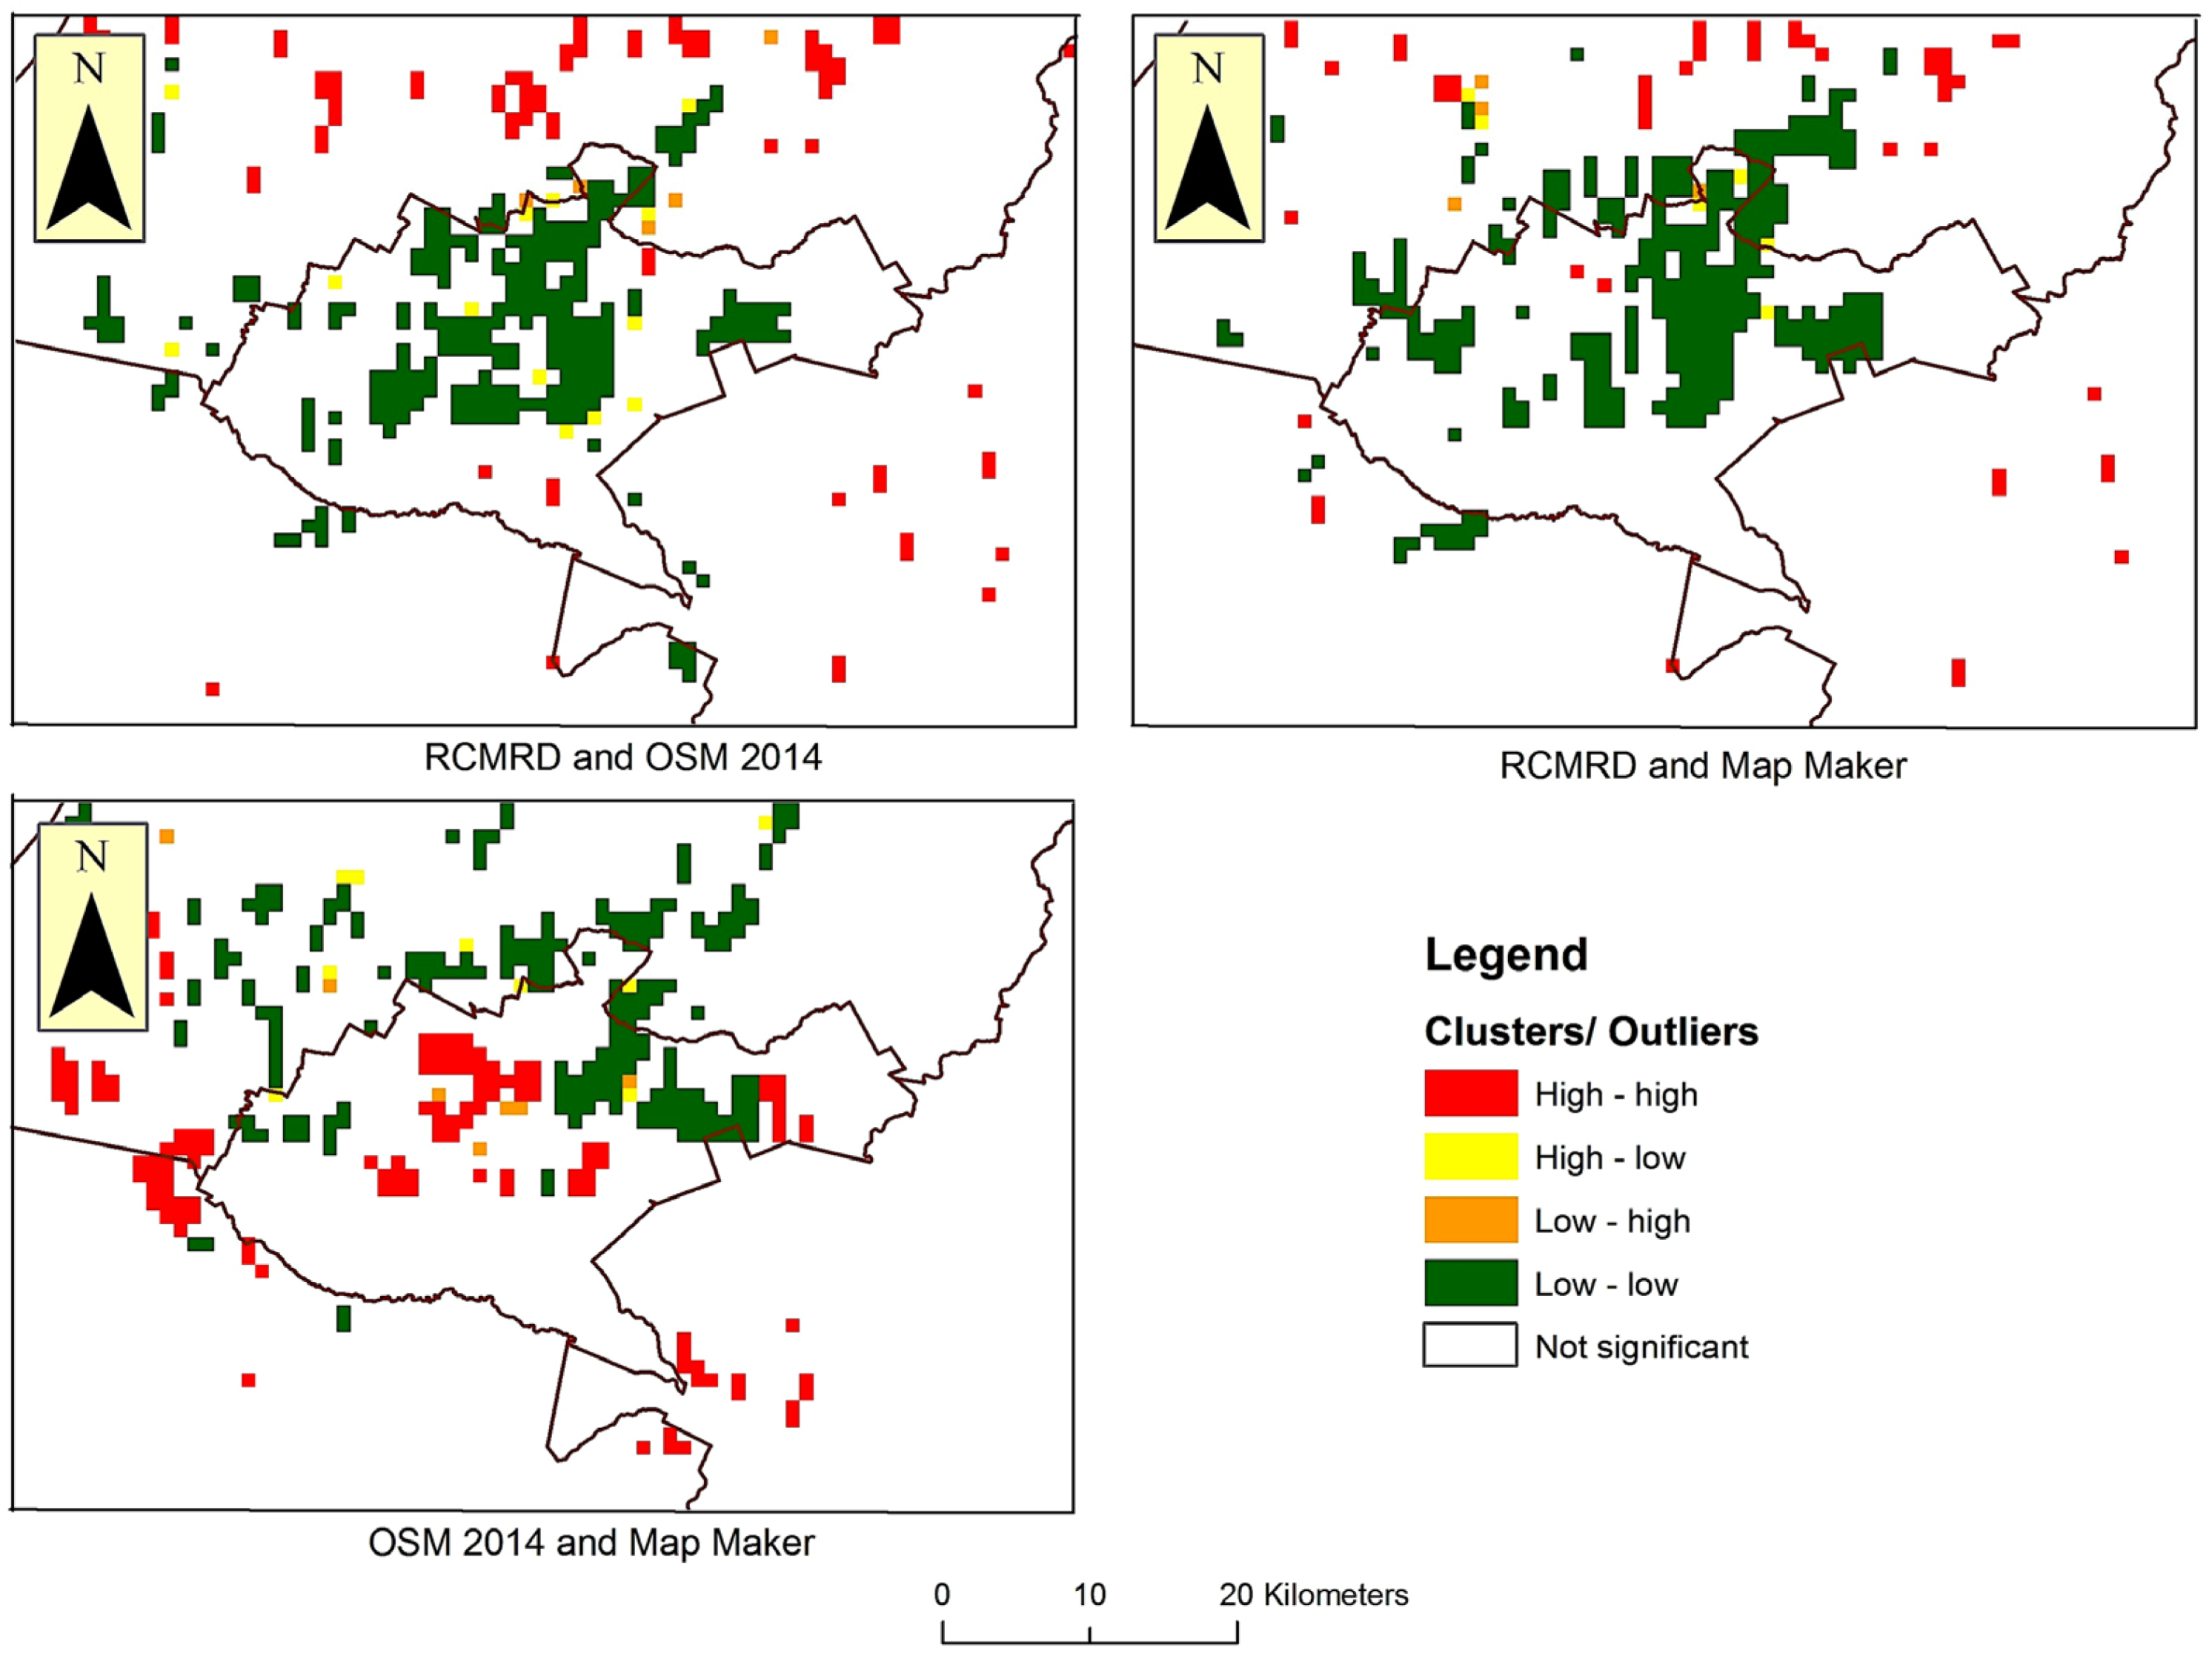
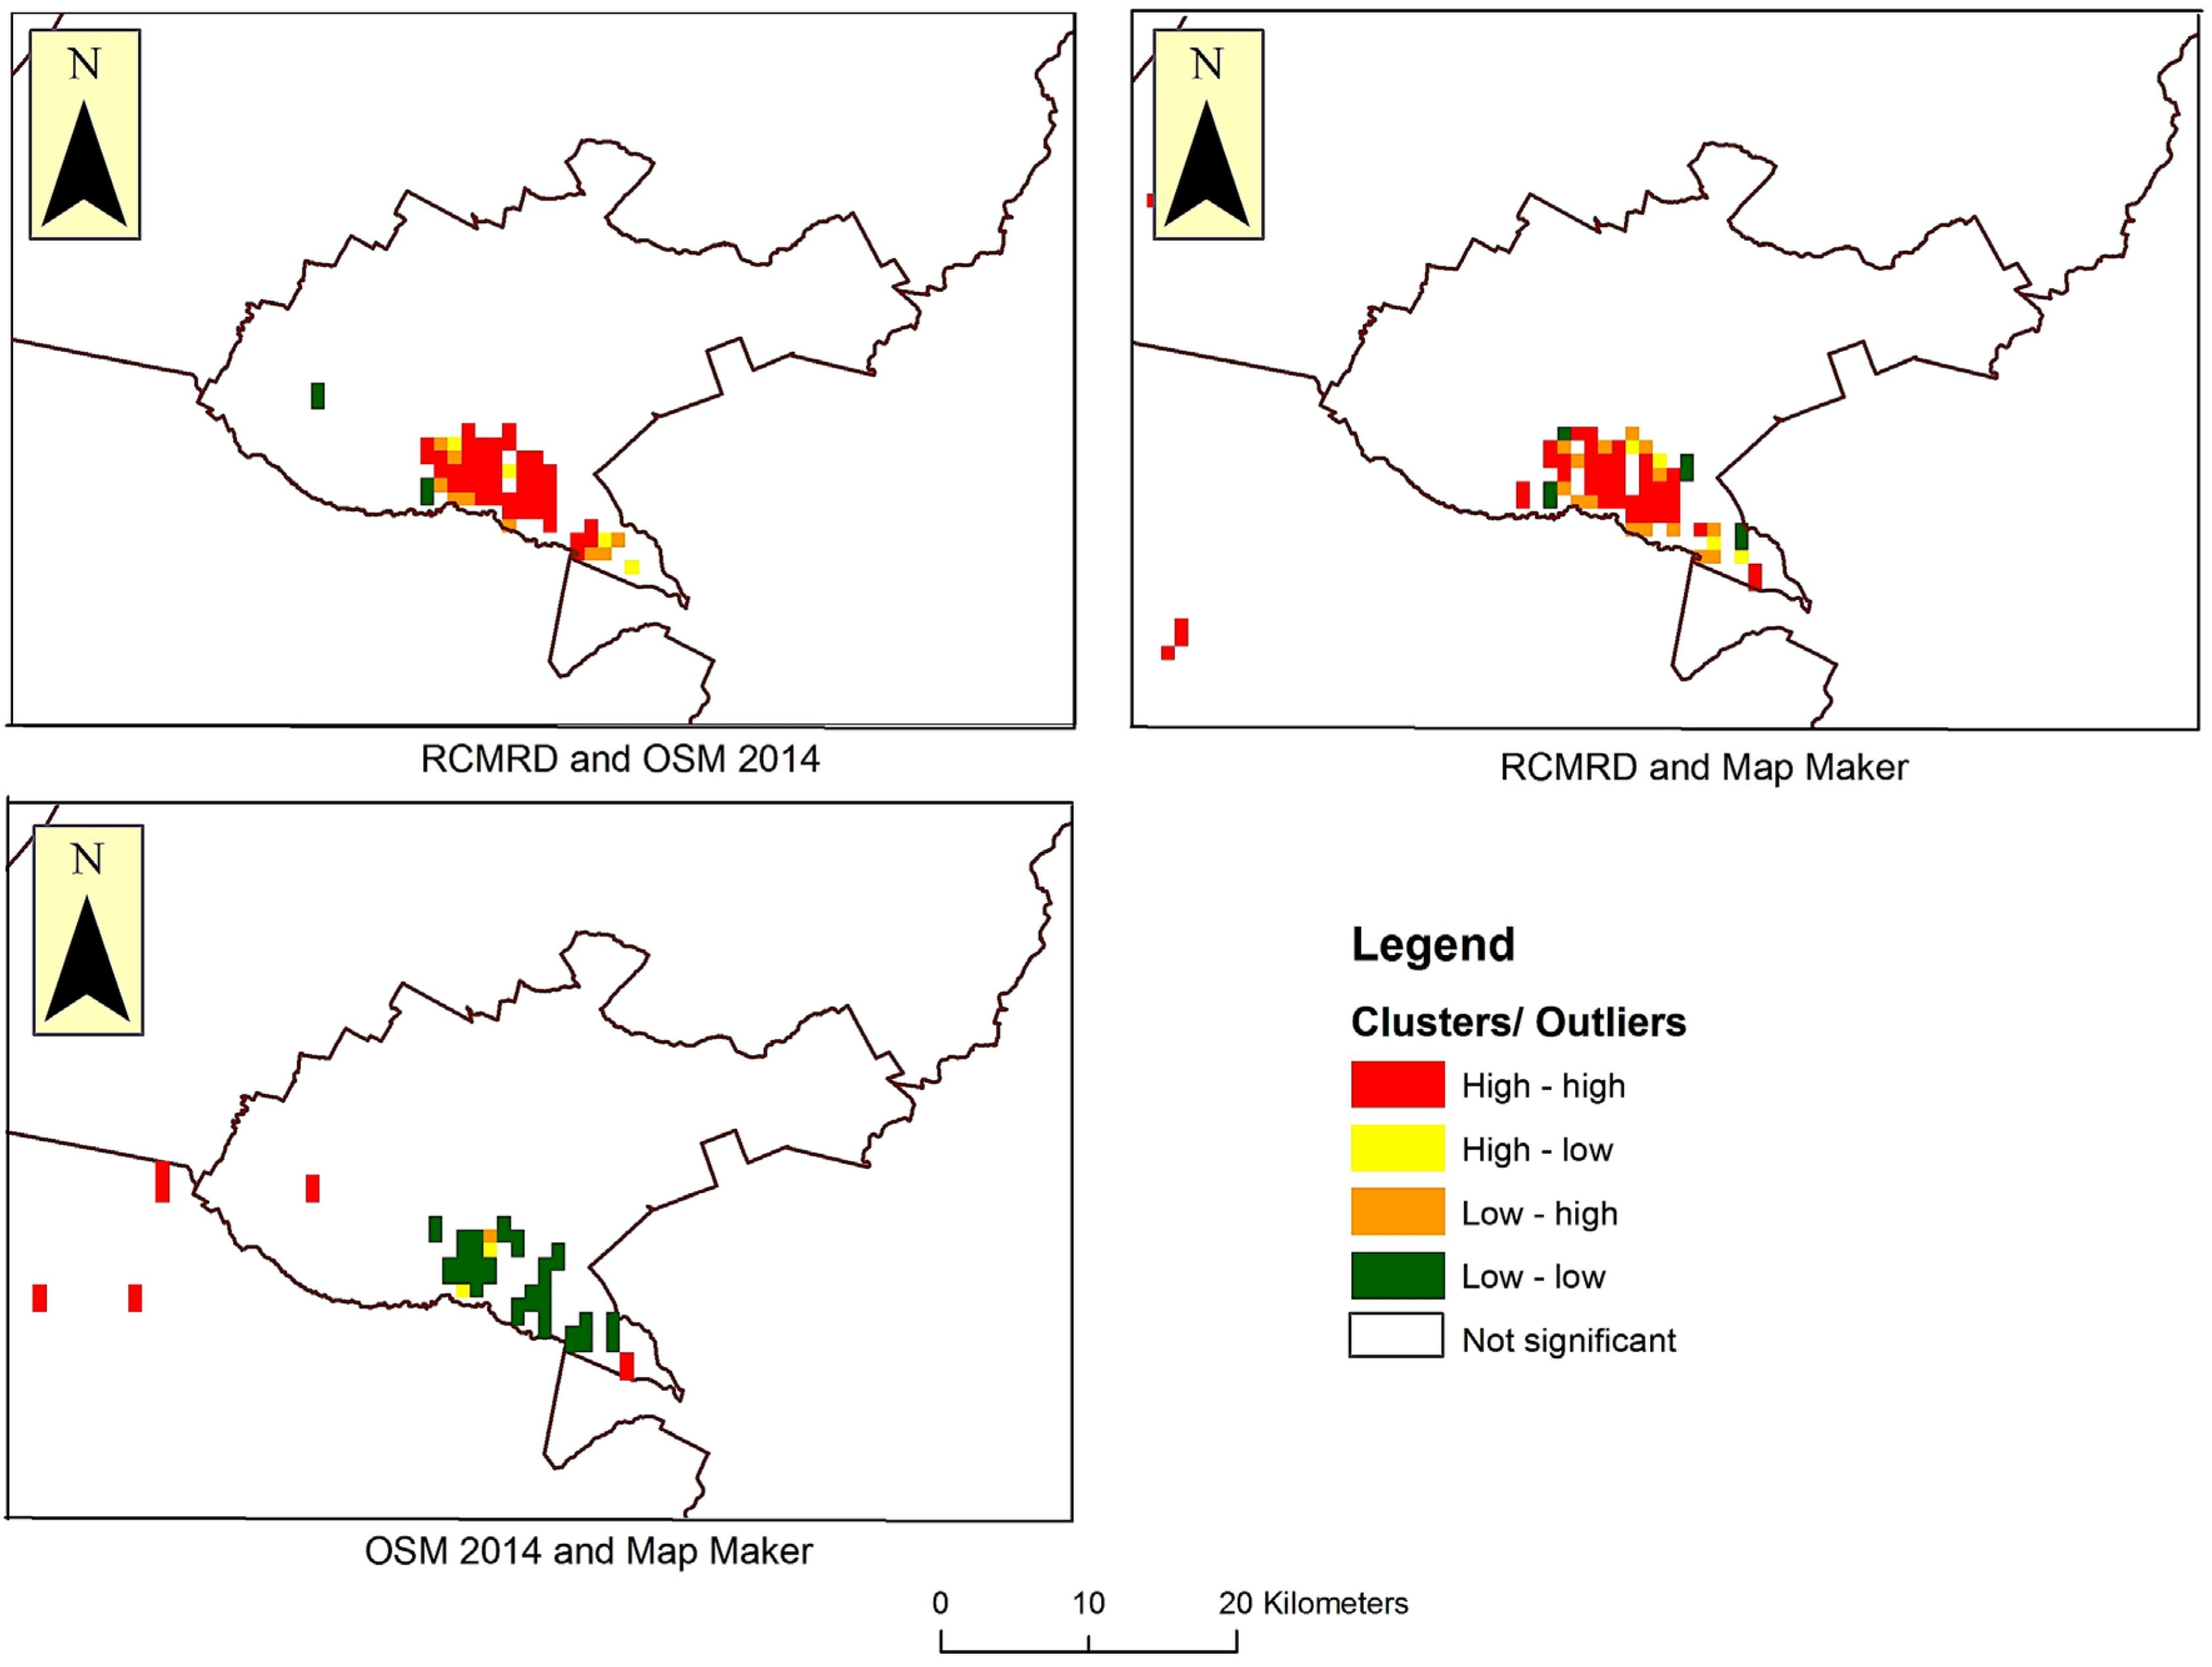
5.1. A Spatial Comparison of Road Network Coverage

Figure 3 shows the spatial distribution of the OSM, RCMRD and Map Maker road networks. Not readily observable in this figure is the dense coverage of Map Maker in Central Nairobi. This is because OSM and Map Maker coverage are very similar in this part of the study area, with roads from Map Maker being overshadowed by OSM roads. Moving away from Central Nairobi, however, it can be seen that there is a greater variability in coverage between road networks, with Kajiado and Machakos having a much higher presence of RCMRD coverage. In the same figure, we can see the sparse coverage of OSM and Map Maker in the county of Machakos.
In order to address the first and second research questions set forth in the Introduction, we compare and contrast authoritative and VGI road data for the same time period, as well as for different time periods. As mentioned earlier, the authoritative RCMRD road dataset available in 2014 was circa 2011, whereas OSM data were available for both 2011 and 2014 (referred to herein as OSM 2011 and OSM 2014, respectively). Map Maker data, on the other hand, were only available for 2014. In Table 2, we summarize the key statistics of these datasets. RCMRD has higher (total) road coverage in the overall study area compared to its counterparts. More specifically, OSM 2011, OSM 2014 and Map Maker only represent 50%, 83% and 94%, respectively, of RCMRD’s total road length.
In order to assess the spatial distribution of these road networks, we tessellate our area of study into 4056 cells of 1 km × 1 km each. We observe then that 97% of these cells had at least one road segment crossing through them in RCMRD, providing a measure of the broad spatial coverage of that dataset. In contrast, OSM 2011, OSM 2014 and Map Maker datasets had 40%, 66% and 64%, respectively, of their cells containing at least one road segment. This pattern is visible in Figure 4, which also shows that OSM 2011, OSM 2014 and Map Maker have much denser coverage in Central Nairobi compared to RCMRD. In general, OSM 2014 and Map Maker show comparable road coverage, which extends towards the northern county of Kiambu. OSM 2011 and OSM 2014, as also shown in Table 2, have the highest (maximum) density of roads (almost 21,000 m), which occurs in Central Nairobi and is visible in Figure 4.
To compare and contrast these datasets, we explore the following pairwise dataset comparisons: (1) RCMRD 2011 vs. Map Maker 2014; (2) RCMRD 2011 vs. OSM 2011; (3) RCMRD 2011 vs. OSM 2014; (3) OSM 2014 vs. Map Maker 2014. Figure 5 shows the pairwise difference in coverage between these different road datasets. In that figure, red cells indicate that the first layer of the ordered pair has higher values (greater coverage), whereas green cells indicate the opposite, namely that the second layer provides higher road coverage. For example, where OSM 2014 and Map Maker are compared (Figure 5iv), red cells show locations where OSM has greater coverage, whereas green cells show locations where Map Maker has greater coverage. The comparisons of RCMRD vs. OSM 2014 and RCMRD vs. Map Maker display comparable patterns. This is not unexpected, given the similar patterns of spatial coverage offered by OSM 2014 and Map Maker (Figure 4). The OSM 2011 vs. RCMRD comparison leads to higher discrepancies, but nevertheless displays a comparable pattern, as well: OSM 2011 leads in the central Nairobi area and some parts of Kajiado, but lags behind RCMRD elsewhere.
The comparison of OSM 2014 vs. Map Maker (Figure 5iv) shows there is a much higher concentration of OSM 2014 roads in Central Nairobi compared with Map Maker (a difference of nearly 12 km length in some places). This is primarily the case in downtown Nairobi. The greater prevalence of OSM 2014 is also noticeable in southern and western areas where Nairobi meets the borders of the surrounding counties. These areas represent the transition from urban to rural. In contrast, Map Maker leads in areas north and east of Nairobi.
In conjunction with the comparison between OSM 2011 and RCMRD and between OSM 2014 and RCMRD, it is also of interest to compare OSM 2011 with OSM 2014 in order to study the evolution of OSM coverage as it applies to this particular dataset. Figure 6 shows the result of this comparison. As can be seen therein, the differences between these two datasets were due to both wider coverage through the incorporation of additional cells (2254 cells include at least one road segment in OSM 2014, compared to 1611 in OSM 2011), as well as the overall extension of the mapped network (a growth of 60% in the total length of mapped road network, from a little less than 4000 km in 2011 to over 6000 km in 2014).
Most of the additions in OSM 2014 occur near and towards the outer periphery of Nairobi. As Figure 6 demonstrates, the differences are not solely due to additions (red cells), but we also have few negative differences (green cells). This may appear to be counterintuitive; however, it becomes clear when one considers that OSM is an evolving product and as such is subject not only to extension, but also to cleanup and deletions [84]. In Figure 7, we show an example of such a negative cell, showing the loss of coverage that results from the deletion of forest trails between 2011 and 2014 in the OSM database.
In order to spatially assess the pairwise differences between RCMRD and OSM 2014, RCMRD and Map Maker and OSM 2014 and Map Maker, we applied LISA analysis. The results of this analysis for these differences are shown in Figure 8. Overall, the comparison between RCMRD and OSM 2014 and RCMRD and Map Maker show distinct patterns of change. On the other hand, between OSM 2014 and Map Maker, areas of high-high values are shown clustered in Central Nairobi. The northern part of this area represents a forested region, Karura forest, with much better coverage of trails visible in OSM 2014. The southern connected area contains residential settlements with OSM 2014 capturing more of the minor roads. The eastern connected area and the other two clusters of high-high values overlap with large slums. These slums continue to be mapped by the Map Kibera project, and therefore, it is understandable why they have very high coverage of roads in OSM 2014. In areas to the east and north of Nairobi where there are clusters of low-low coverage values, these represent areas with large amounts of vegetation, which helps explain the low coverage of roads in these locations. The other two main areas of high-high clustered values were residential settlements to the west and south and on the periphery of Nairobi. There were also a few cases of high-low and low-high outliers observed, which upon further investigation were found to be mainly clusters of roads surrounded by large areas of vegetation and settlements containing minor roads. The LISA analysis results, particularly comparing RCMRD to OSM 2014 and Map Maker, highlight the potential utility of VGI contributions for supplementing, and even extending, authoritative data sources in developing countries.

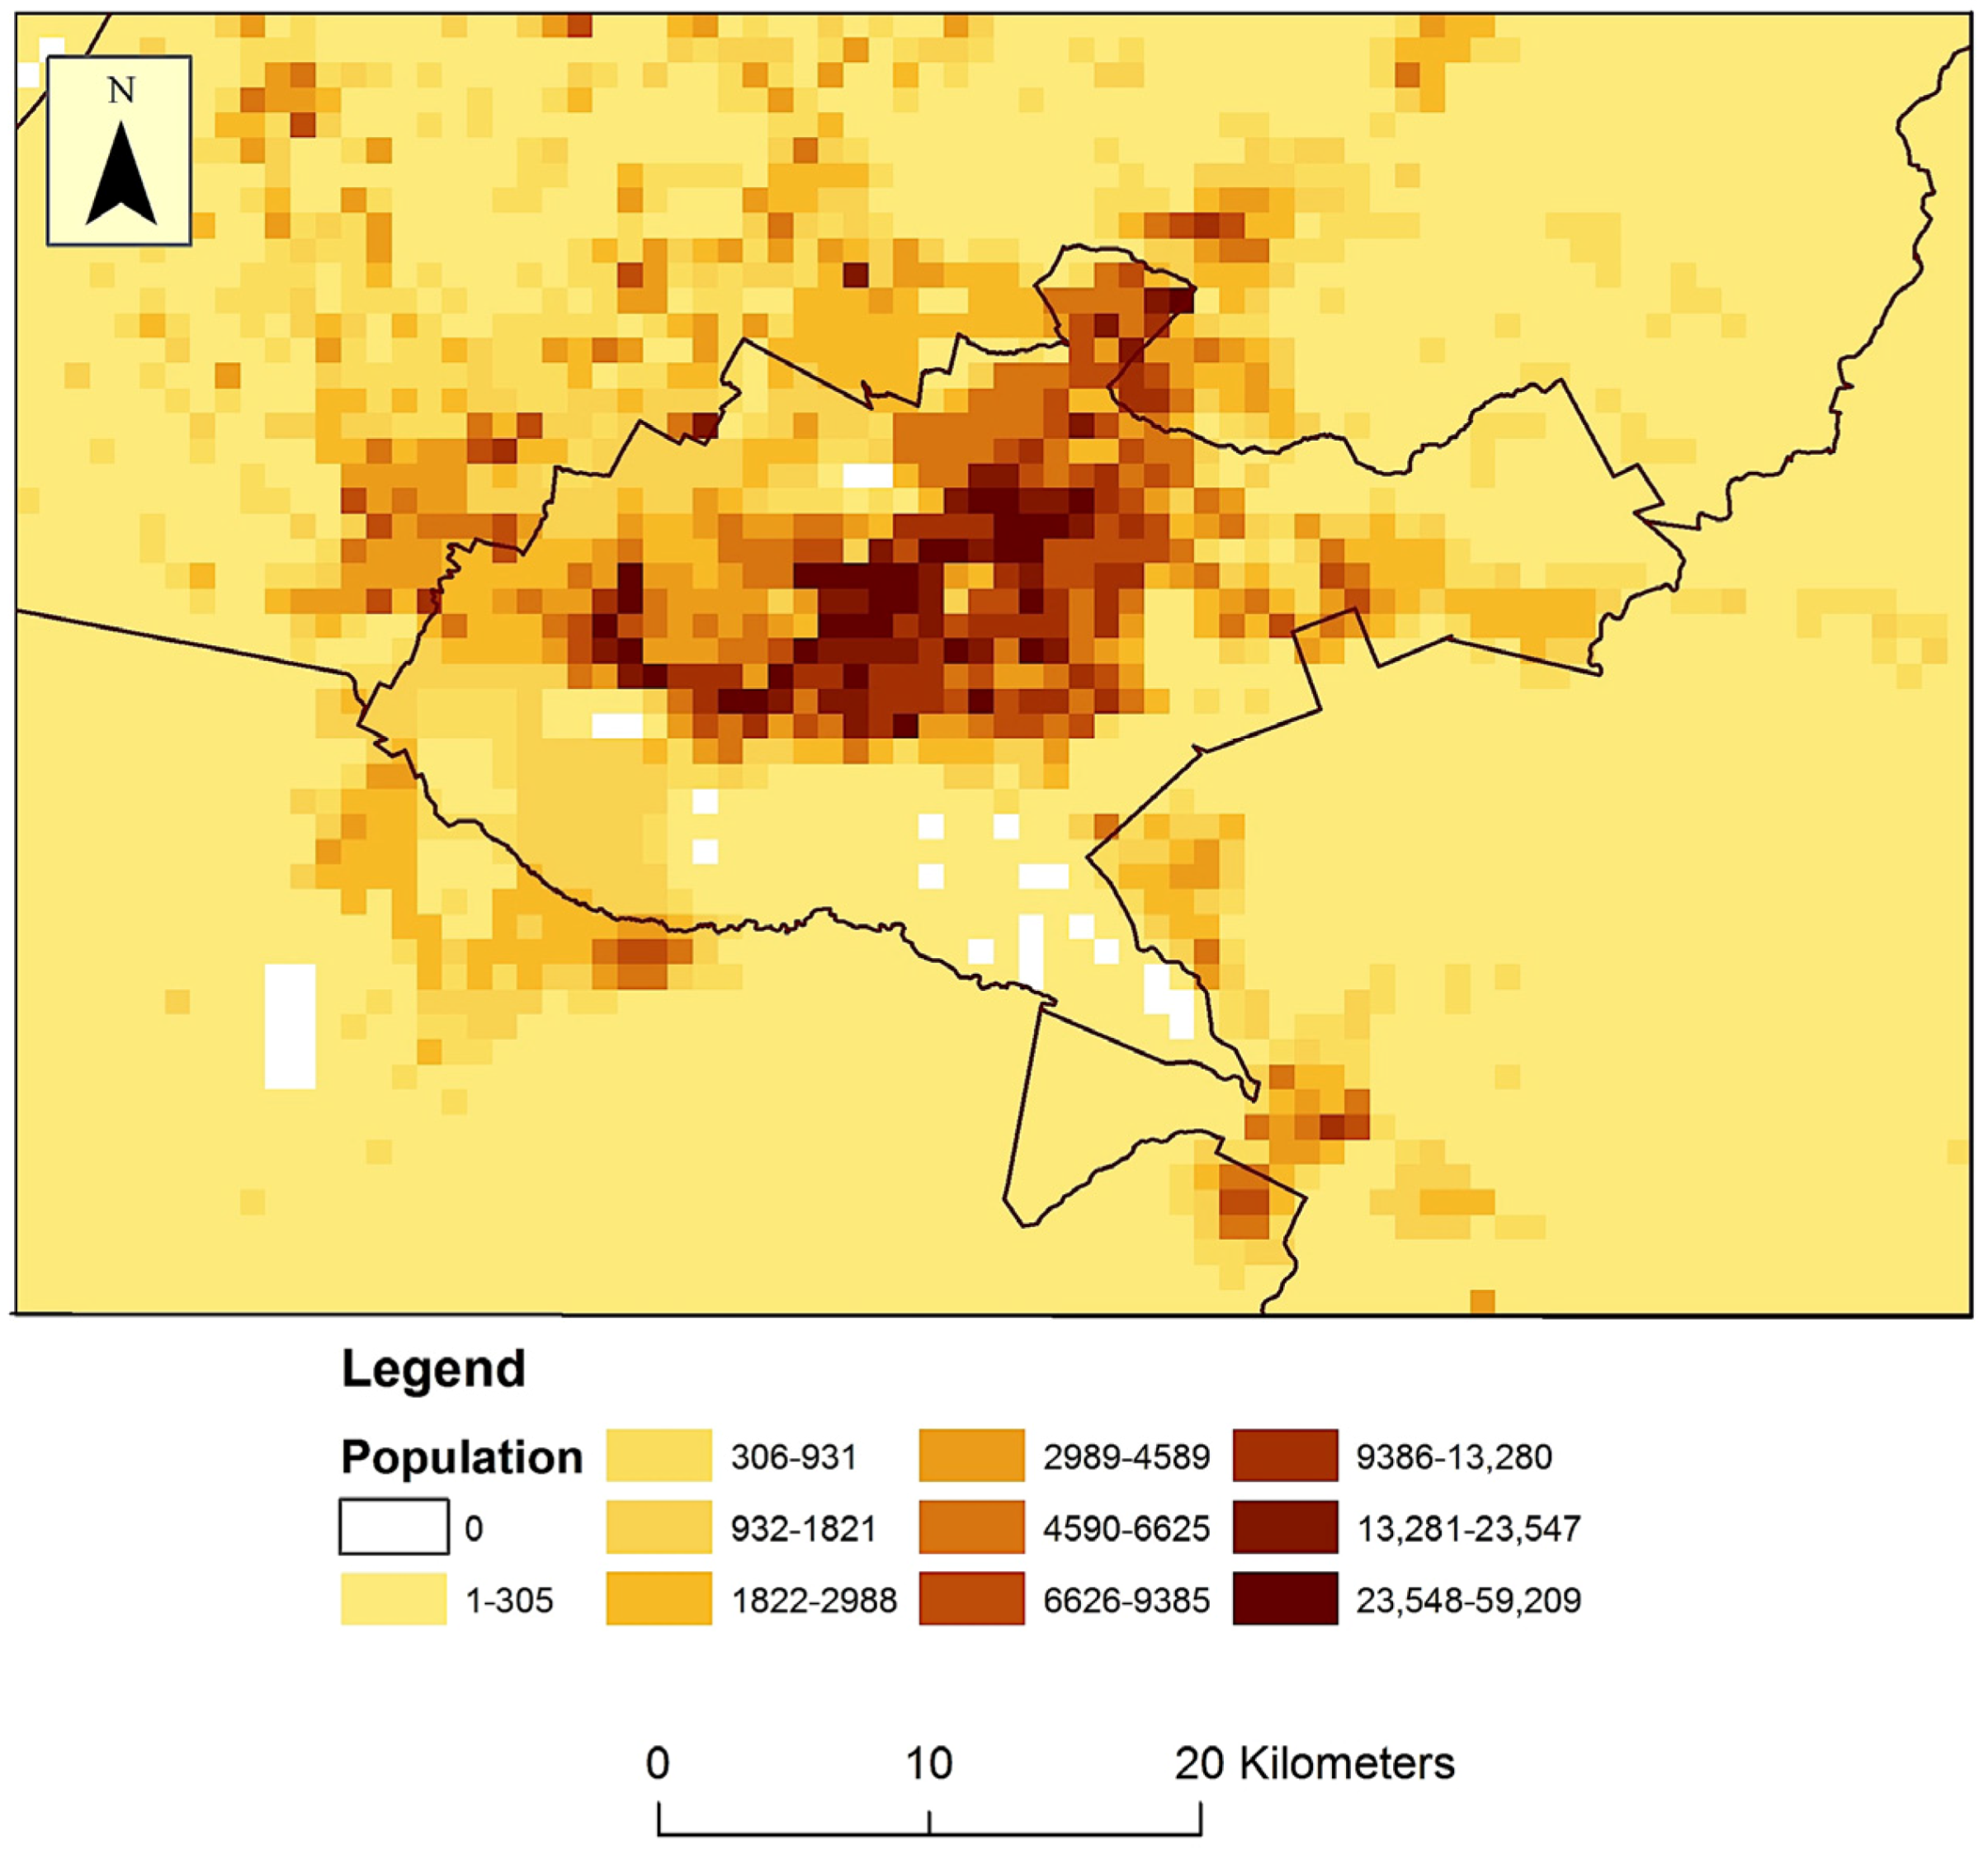
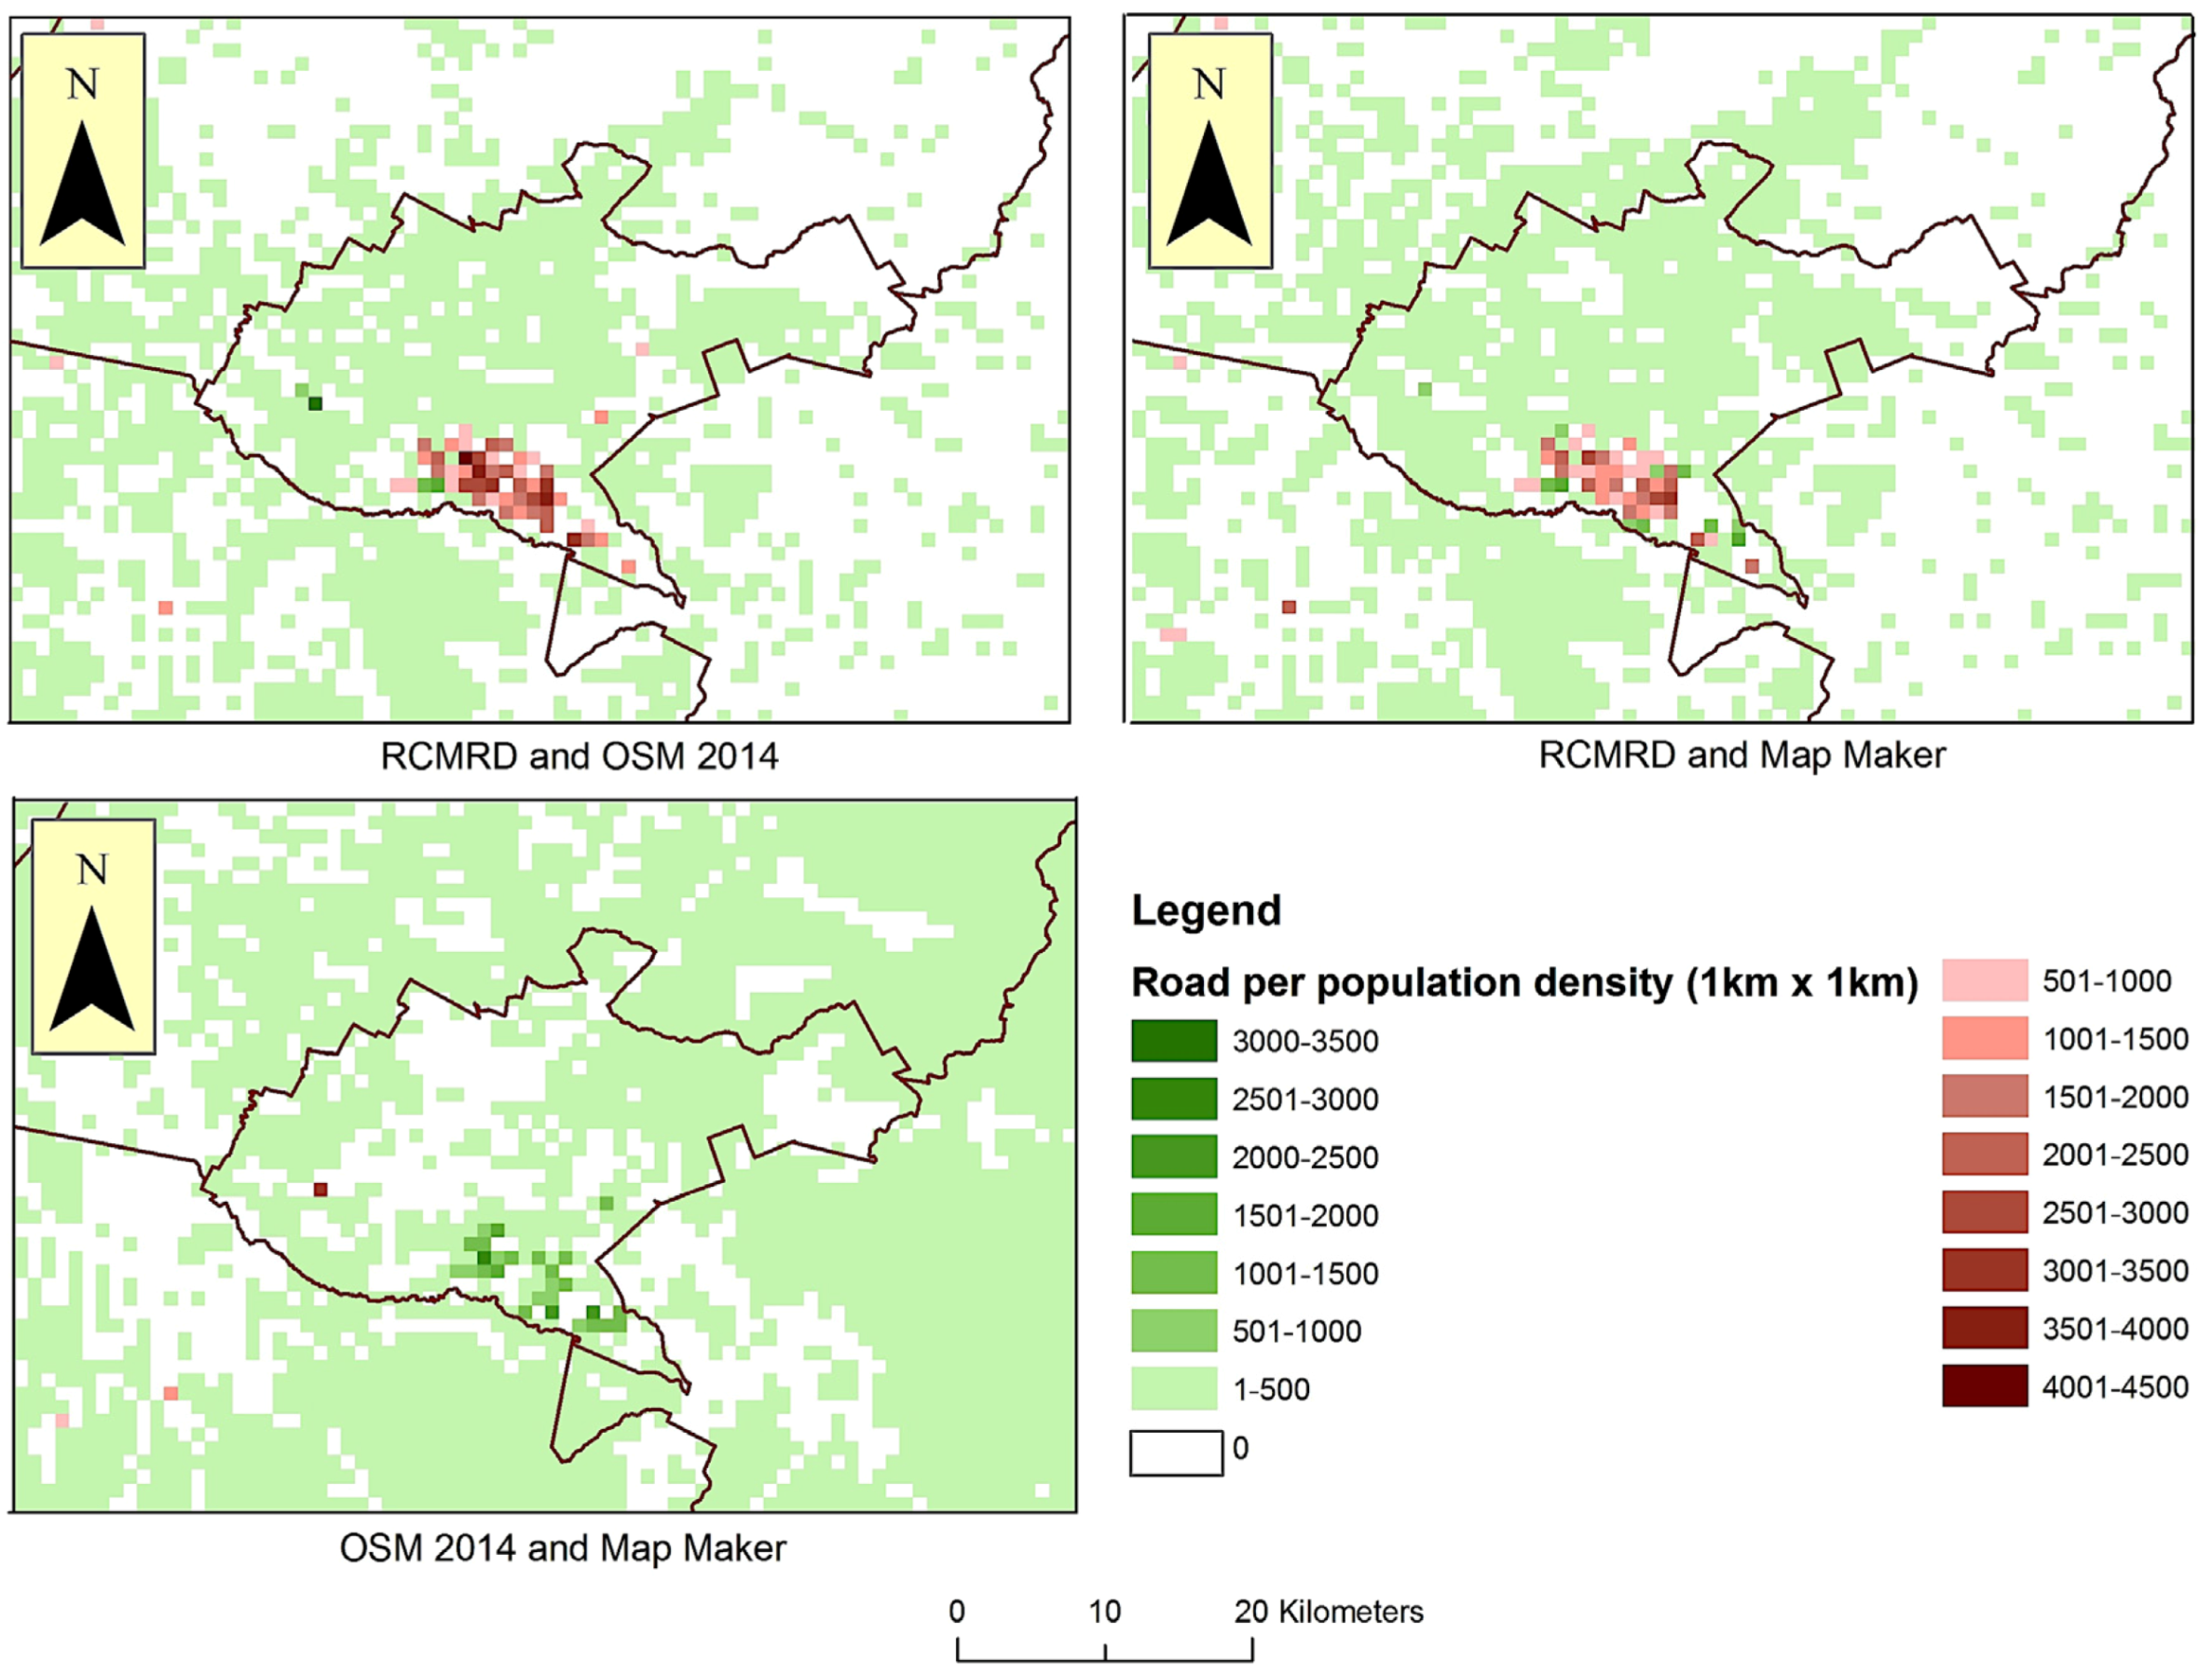
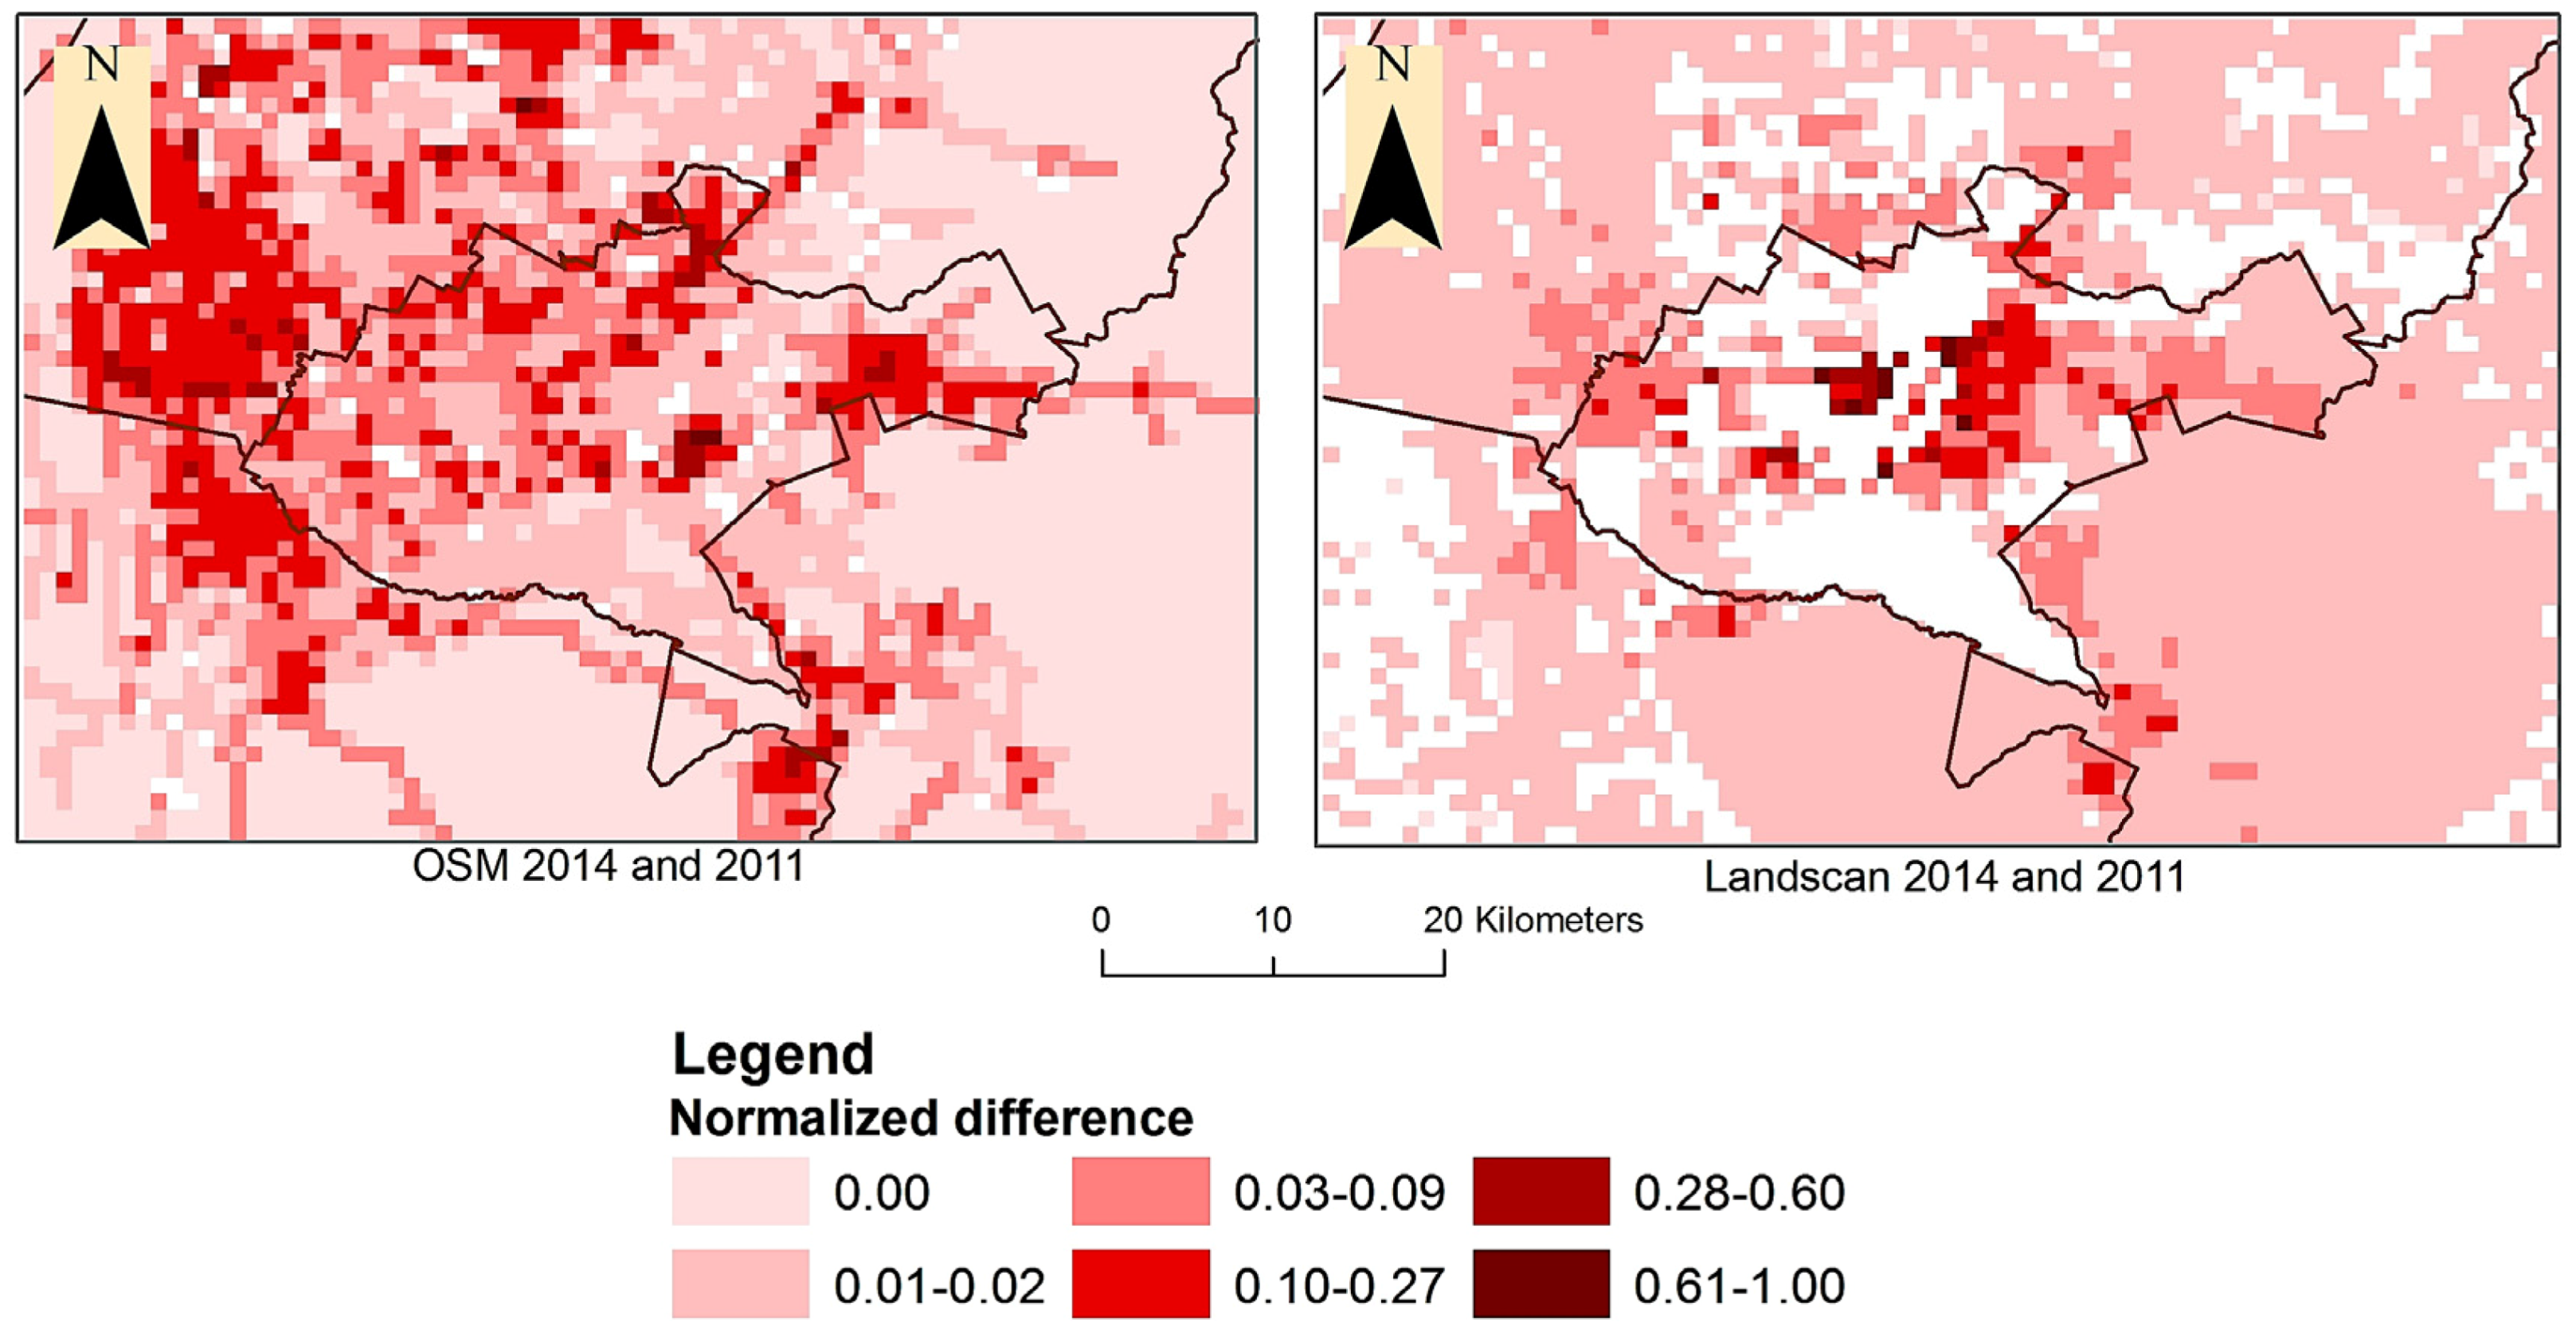
5.2. The Relationship between Population Density and Road Coverage

To address our third research question, that is a possible relationship between population density and coverage, we begin with an examination of population density for our study area. Figure 9 shows the spatial distribution of population density, with the highest density of people located in Central Nairobi and areas towards Kiambu. This figure shows similarities to road coverage for OSM 2014 and Map Maker in Figure 3. One of the main sources of data used in LandScan is road data, as indicated by Bhaduri et al. [76]. This suggests that roads play, or at least are weighted heavily, in the generation of the LandScan population data over the study area. The normalized coverage of roads using population data is shown in Figure 10. RCMRD (as previously observed in Figure 3 and Table 1) has overall better coverage when taking into account the entire study area. OSM 2014 and Map Maker, on the other hand, have very limited coverage in most of Kajiado and Machakos counties, that is counties to the east and south of Nairobi. All three datasets, however, have intersecting coverage in Nairobi and most parts of Kiambu county, just northwest of Nairobi. Kiambu county contains a much larger and dispersed population compared to the other counties surrounding Nairobi. Because there is also a large amount of vegetation interspersed with residential housing in Kiambu, this helps explain why the population distribution for this county, as viewed in Figure 9, shows an overall low distribution per 1 km × 1 km grid cell. The very high number of roads per population grid cells visible in Figure 10 for all three coverage maps represents Nairobi National Park. Roads and trails are outlined in this area, with little to no population, resulting in large values for road coverage. These results suggest that population does impact coverage, with more populated areas having greater road coverage in OSM and Map Maker VGI data than less populated areas.
Figure 11 shows the pairwise differences in road coverage normalized using the population data. The differences between RCMRD with OSM 2014 and RCMRD with Map Maker are comparable. The green areas, as explained previously, suggest that RCMRD has limited roads in the Nairobi National Park. The difference for OSM 2014 and Map Maker, however, shows that Map Maker has greater coverage of roads for this park. Figure 12 shows the results after the application of LISA to the different data layers normalized by population. The results confirm the previous observed clustering in Figure 10 occurring in the Nairobi National Park.
In order to assess the relation between population growth and changes in road coverage, we compare the trends of change in OSM coverage in the three-year period between 2011 and 2014 to the patterns of change in population density in Nairobi for the same period. For the latter, we use LandScan data as a proxy. Of course, we have to remain cognizant that possible changes in the methodology that LandScan uses to estimate population density may have affected the input datasets [85], but nevertheless, this is the closest approximation available, since the last census in Kenya was conducted in 2009.
Figure 13 shows this comparison. In order to support the visual comparison of change trends we have normalized both OSM and population change data. In that figure, dark red cells are the ones with the highest rate of increase, whereas very light pink cells are the ones with no change. The comparison of these two figures shows that while some population growth hotspots do indeed match coverage growth hotspots (e.g., in the Ngong area at the tri-county border of Nairobi county with Kajiado and Kiambu on the west), the pattern of growth in OSM coverage is not attributed solely to population growth. Accordingly, one could argue that growth of coverage in OSM is likely the outcome of both population growth and the broadening of the coverage of the OSM database.

6. Discussion and Conclusions

By harnessing the power of the crowd, VGI has emerged as a prominent spatial data source. As such, VGI presents a complementing, and sometimes even the only, spatial data source for a wide range of domains. The specific role of VGI within a spatial data ecosystem for a given area can change along a continuum that ranges between being complementing to that of being the only one available. In developing countries, which often lack readily accessible authoritative spatial data, VGI has a significant potential of overcoming such a lack of authoritative spatial data. However, in order to fully understand the role that VGI can play in developing countries, a better understanding of the characteristics of VGI is needed. In this paper, we contribute towards this issue by focusing primarily on the coverage offered by VGI platforms in Kenya. By contributing this first case study of its type in the African continent, we augment the very limited literature [16,46] on this topic and help advance our understanding of the value of citizen-contributed data for developing countries, as well as of the challenges associated with this evolving paradigm of geospatial data collection for such communities.
More specifically, we considered three different sources of road network data for the broader Nairobi area, namely the OSM and Map Maker VGI platforms, and the authoritative dataset available through RCMRD. We compared the spatial patterns of coverage of these three datasets primarily along three lines of inquiry: (i) a comparison of authoritative and VGI road data in terms of coverage for the same time period; (ii) an assessment of how the coverage of constantly updated and available VGI data compares to rather fixed update cycles of authoritative datasets; and (iii) an exploration of the relationship between population density and road coverage in our study area.
The results of this study show good coverage by all three sources of road data for Nairobi, with OSM and Map Maker providing similar, but greater coverage in downtown Nairobi. However, moving further outside of Nairobi to the surrounding counties of Kiambu, Kajiado and Machakos, the coverage of OSM and Map Maker diminishes. In the more rural areas of Kajiado and Machakos, counties south and east of Nairobi, road coverage provided by OSM and Map Maker was generally poorer compared to RCMRD.
It is important to consider again the differences in update cycles for the compared datasets. While all three datasets represent what was current at a certain moment in time (i.e., 2014), the RCMRD data were last updated in 2011, therefore raising the possibility that some of the discrepancy between the RCMRD data and the other two datasets (i.e., OSM and Map Maker) could be attributed to newer road segments being added between 2011 and 2014. One could argue that the reason for their discrepancies (i.e., lack of data or lack of currency) may be considered secondary to the fact that they are different. In this paper, we assess this degree of difference, as we argued above. As a matter of fact, lack of authoritative data currency is endemic to developing nations, which renders volunteered content even more valuable for these communities.
Focusing on road networks, RCMRD showed greater overall coverage across the entire study area. This is in line with the overall mission of national or regional mapping agencies, which are often tasked with providing more complete coverage of roads for a country or region. On the other hand, OSM and Map Maker have no such constraints, leading to a skewed distribution in road coverage within them. However, OSM overall was found to offer greater coverage compared to the RCMRD authoritative dataset in the impoverished slum areas of downtown Nairobi. As noted above, this is indicative of the power of targeted civic engagement campaigns (e.g., Map Kibera), as OSM groups continue to actively work with communities on the ground in slums in Nairobi, empowering the general public to map such areas.
Moving beyond urban areas towards suburban and rural areas leads to a drop in road coverage in OSM and Map Maker, suggesting a relationship between population density and coverage in these VGI platforms. In rural green areas such as the Nairobi National Park, Map Maker outperformed OSM, but both were behind the coverage offered by RCMRD. The lower road coverage of OSM compared to Map Maker in the park may be attributed to differences in mapping interests by these two communities.
In practice, it is important to realize that there are many factors that influence VGI coverage, ranging from individual contributors’ motivation to that of targeted mapping campaigns in response to natural disasters. For example, our results show that the Map Kibera project has been highly influential in VGI coverage over some slum areas in Nairobi. Moreover, in the wake of recent natural disasters (e.g., Nepal earthquake in 2015) and pandemics (e.g., Ebola outbreak in West Africa in 2014), many organized mapping efforts have tended to focus on urban areas. This could be attributed to a large number of people at risk in these locations.
As this case study showed, both authoritative and volunteered geographical information in developing countries offer certain advantages while suffering from some distinct disadvantages, such as their coverage, feature typology or level of detail. The results presented in this paper suggest that in developing countries, these data sources should be considered as complementary rather than competing and that their fusion can potentially result in geographical data that better serve the needs of such countries. For example, RCMRD can be used as the primary data source in rural areas with roads from VGI sources being used to improve urban RCMRD coverage. Further, in areas where large slums exist, OSM may provide the most up-to-date coverage of roads for such areas. This information can be used for supporting better intervention strategies to assist these communities with respect to increasing accessibility and the improving of much needed infrastructure among others. Moreover, in emergency cases, for instance, in the wake of a natural disaster, a hybrid dataset containing the most up-to-date spatial road coverage can be of immense benefit for steering populations to safety. However, the conflation of such geographical data is not without its own set of challenges, with many studies using different approaches to address this ongoing issue (e.g., [86,87]). Further research is therefore required in order to leverage such research towards the creation of hybrid (i.e., VGI and authoritative) datasets.
In view of the work presented here, several areas of inquiry could be further developed. The first relates to the resolution at which the analysis is carried out. With much finer resolution up-to-date population data becoming available (e.g., WorldPop at 100 m × 100 m [88]), a more detailed analysis of the spatial and temporal variations of the relationship between population density and road coverage in the developing world context could be performed. This would also further support the study of VGI in the context of marginalized communities (e.g., slums) given the small footprint of many such communities in comparison to the resolution of currently available up-to-date population data (i.e., 1 km by 1 km). While in some developing countries, finer resolution data do exist, many developing countries still continue to lack such data, particularly for marginalized communities and rural areas [28].
A second area of inquiry, which was eluded to above, relates to what drives users’ motivations to contribute VGI. While population density clearly has a role in fueling such contributions, other factors need to be explored. For example, our understanding of relationships between functional elements of populated areas and the characteristics of the VGI corresponding to these areas is still in its infancy. Specifically, the relationships between urban form and function and how it affects VGI contributions [23,89] should be further examined. Moreover, with the increasing availability of Internet access, it would also be interesting to explore the impact of such access on VGI contributions in developing countries.
In line with the abovementioned areas of inquiry, it would also be interesting to study the types of users contributing to VGI and to assess the accuracy of their contributions. For example, work by Leeuw et al. [90] in western Kenya showed that local knowledge plays an important role in improving the accuracy of VGI contributions. In that study, participants with local knowledge, on average, were able to classify roads with over 92% accuracy, compared to professional surveyors (67.7%) and other laymen users without local knowledge of the area (42.9%). Such results suggest the need for a more inclusive framework, whereby local expertise may improve national mapping products. This is a representative example of the types of inquiry that are becoming increasingly important as the geospatial community attempts to improve their understanding of the underlying mechanisms that govern VGI contributions and characteristics.
Much effort has also been focused on evaluating the potential of VGI using road networks; however, the world of VGI extends well beyond roads. For example, several studies have investigated the potential of VGI to support 2D and 3D mapping and characterizing buildings (e.g., [91,92,93,94]), land use and land cover (e.g., [26,95,96,97]) and for cataloging spatial features, such as small fish ponds near homes [14]. Given the increasing digital engagement of non-expert mappers, and the wikification of geographic information [98], VGI is now enabling users to capture what they perceive as important , both tangible and intangible. It is therefore important to explore new methods and metrics that can be used to adequately evaluate the potential of such data.
Pursuing areas of inquiry such as the ones outlined here is becoming increasingly important for the developing world. As developing countries continue to evolve, so do their geospatial information needs. This represents a self-reinforced data deprivation cycle for such countries: while such countries are in need of reliable high quality spatial data for their development, they are increasingly burdened by the lack of reliable geospatial datasets or the means to obtain them. VGI has the potential to break this cycle. While many VGI studies have focused on the developed world where authoritative data are often plentiful, this is not often the case in developing countries. This paper makes a contribution towards a better understanding of the quality of VGI data in a developing country setting and highlights its potential for such countries.

Acknowledgments

Publication of this article was funded in part by the George Mason University Libraries Open Access Publishing Fund.

Author Contributions

All authors contributed to the design of the methodology and the writing of the paper. Ron Mahabir collected the data and carried out the analysis. All of the authors contributed to the preparation of the manuscript and approved the final version to be published.

Conflicts of Interest

The authors declare no conflict of interest.

References

  1. Crooks, A.T.; Hudson-Smith, A.; Croitoru, A.; Stefanidis, A. The evolving geoweb. In Geocomputation; Abrahart, R.J., See, L.M., Eds.; CRC Press: Boca Raton, FL, USA, 2014; pp. 69–96. [Google Scholar]
  2. Sun, D.; Li, S.; Zheng, W.; Croitoru, A.; Stefanidis, A.; Goldberg, M. Mapping floods due to hurricane Sandy using NPP VIIRS and ATMS data and geotagged Flickr imagery. Int. J. Digit. Earth 2016, 9, 427–441. [Google Scholar] [CrossRef]
  3. Jenkins, A.; Croitoru, A.; Crooks, A.T.; Stefanidis, A. Crowdsourcing a collective sense of place. PLoS ONE 2016, 11, e0152932. [Google Scholar] [CrossRef] [PubMed]
  4. Goodchild, M.F. Citizens as sensors: The world of volunteered geography. GeoJournal 2007, 69, 211–221. [Google Scholar] [CrossRef]
  5. Stefanidis, T.; Crooks, A.T.; Radzikowski, J. Harvesting ambient geospatial information from social media feeds. GeoJournal 2013, 78, 319–338. [Google Scholar] [CrossRef]
  6. Mandarano, L.; Meenar, M.; Steins, C. Building social capital in the digital age of civic engagement. J. Plan. Lit. 2010, 25, 123–135. [Google Scholar] [CrossRef]
  7. Carletti, L.; Giannachi, G.; Price, D.; McAuley, D.; Benford, S. Digital humanities and crowdsourcing: An exploration. In Proceedings of the 2013 Museums and the Web Conference, Portland, OR, USA, 17–20 April 2013.
  8. Brabham, D.C. Moving the crowd at threadless: Motivations for participation in a crowdsourcing application. Inf. Commun. Soc. 2010, 13, 1122–1145. [Google Scholar] [CrossRef]
  9. Hossain, M. Users’ motivation to participate in online crowdsourcing platforms. In Proceedings of the 2012 International Conference on Innovation Management and Technology Research, Malacca, Malaysia, 21–22 May 2012; pp. 310–315.
  10. Budhathoki, N.R.; Haythornthwaite, C. Motivation for open collaboration crowd and community models and the case of OpenStreetMap. Am. Behav. Sci. 2013, 57, 548–575. [Google Scholar] [CrossRef]
  11. Sui, D.; Elwood, S.; Goodchild, M.F. Volunteered geographic information, the exaflood, and the growing digital divide. In Crowdsourcing Geographic Knowledge: Volunteered Geographic Information (VGI) in Theory and Practice; Sui, D., Elwood, S., Goodchild, M.F., Eds.; Springer: New York, NY, USA, 2013; pp. 1–12. [Google Scholar]
  12. Neis, P.; Zielstra, D. Recent developments and future trends in volunteered geographic information research: The case of Openstreetmap. Future Internet 2014, 6, 76–106. [Google Scholar] [CrossRef] [Green Version]
  13. Paudyal, D.R.; McDougall, K.; Apan, A. Exploring the application of volunteered geographic information to catchment management: A survey approach. ISPRS Ann. Photogramm. Remote Sens. Spat. Inf. Sci. 2012, 1–4, 275–280. [Google Scholar] [CrossRef]
  14. Schmid, F.; Cai, C.; Frommberger, L. A new micro-mapping method for rapid VGI-ing of small geographic features. In Proceedings of the 7th International Conference on Geographic Information Science, Columbus, OH, USA, 18–21 September 2012.
  15. Haklay, M.; Antoniou, V.; Basiouka, S.; Soden, R.; Mooney, P. Crowdsourced Geographic Information Use in Government; World Bank Publications: London, UK, 2014. [Google Scholar]
  16. Camboim, S.P.; Bravo, J.V.M.; Sluter, C.R. An investigation into the completeness of, and the updates to, OpenStreetMap data in a heterogeneous area in Brazil. ISPRS Int. J. Geo-Inf. 2015, 4, 1366–1388. [Google Scholar] [CrossRef]
  17. Zook, M.; Graham, M.; Shelton, T.; Gorman, S. Volunteered geographic information and crowdsourcing disaster relief: A case study of the Haitian earthquake. World Med. Health Policy 2010, 2, 7–33. [Google Scholar] [CrossRef]
  18. Meier, P. Crisis mapping in action: How open software and global source volunteer networks are changing the world, one map at a time. J. Map Geogr. Lib. 2012, 8, 89–100. [Google Scholar] [CrossRef]
  19. Verrucci, E.; Perez-Fuentes, G.; Rossetto, T.; Bisby, L.; Haklay, M.; Rush, D.; Rickles, P.; Fagg, G.; Joffe, H. Digital engagement methods for earthquake and fire preparedness: A review. Nat. Hazards 2016. [Google Scholar] [CrossRef]
  20. Hagen, E. Mapping change: Community information empowerment in Kibera (innovations case narrative: Map Kibera). Innov. Technol. Gov. Glob. 2011, 6, 69–94. [Google Scholar] [CrossRef]
  21. Government of Saint Lucia. Map Saint Lucia. Available online: http://www.govt.lc/news/map-saint-lucia (accessed on 10 June 2016).
  22. Sutherland, M.; Tienaah, T.; Seeram, A.; Ramlal, B.; Nichols, S. Public participatory GIS, spatial data infrastructure, and citizen-inclusive collaborative governance. In Spatial Enablement in Support of Economic Development and Poverty Reduction; Harlan, O., Rajabifard, A., Eds.; GSDI Association Press: Needham, MA, USA, 2013; pp. 123–140. [Google Scholar]
  23. Crooks, A.T.; Pfoser, D.; Jenkins, A.; Croitoru, A.; Stefanidis, A.; Smith, D.A.; Karagiorgou, S.; Efentakis, A.; Lamprianidis, G. Crowdsourcing urban form and function. Int. J. Geogr. Inf. Sci. 2015, 29, 720–741. [Google Scholar] [CrossRef]
  24. Stefanidis, A.; Jenkins, A.; Croitoru, A.; Crooks, A. Megacities through the lens of social media. Homel. Def. Secur. Inf. Anal. Cent. 2016, 3, 24–29. [Google Scholar]
  25. Johnson, P.A.; Sieber, R.E. Situating the adoption of VGI by government. In Crowdsourcing Geographic Knowledge: Volunteered Geographic Information (VGI) in Theory and Practice; Sui, D., Elwood, S., Goodchild, M.F., Eds.; Springer: New York, NY, USA, 2013; pp. 65–81. [Google Scholar]
  26. Arsanjani, J.J.; Mooney, P.; Zipf, A.; Schauss, A. Quality assessment of the contributed land use information from OpenStreetMap versus authoritative datasets. In OpenStreetMap in Giscience: Experiences, Research, and Applications; Arsanjani, J.J., Zipf, A., Mooney, P., Helbich, M., Eds.; Springer: New York, NY, USA, 2015; pp. 37–58. [Google Scholar]
  27. Mahabir, R.; Crooks, A.; Croitoru, A.; Agouris, P. The study of slums as social and physical constructs: Challenges and emerging research opportunities. Reg. Stud. Reg. Sci. 2016, 3, 400–420. [Google Scholar] [CrossRef]
  28. Lachman, B.E.; Wong, A.; Knopman, D.; Gavin, K.E. Lessons for the Global Spatial Data Infrastructure; Rand Corporation: Santa Monica, CA, USA, 2002. [Google Scholar]
  29. Haklay, M.; Weber, P. OpenStreetMap: User-generated street maps. IEEE Perv. Comput. 2008, 7, 12–18. [Google Scholar] [CrossRef]
  30. OpenStreetMap. Stats. Available online: http://www.wiki.openstreetmap.org/wiki/Stats (accessed on 10 June 2016).
  31. Arsanjani, J.J.; Zipf, A.; Mooney, P.; Helbich, M. OpenStreetMap in GIScience; Springer International Publishing: Cham, Switzerland, 2015. [Google Scholar]
  32. Neis, P. Measuring the reliability of wheelchair user route planning based on volunteered geographic information. Trans. GIS 2015, 19, 188–201. [Google Scholar] [CrossRef]
  33. Luxen, D.; Vetter, C. Real-time routing with OpenStreetMap data. In Proceedings of the 19th ACM SIGSPATIAL International Conference on Advances in Geographic Information Systems, Chicago, IL, USA, 1–4 November 2011.
  34. Goetz, M.; Zipf, A. Towards defining a framework for the automatic derivation of 3D citygml models from volunteered geographic information. Int. J. 3D Inf. Model. 2012, 1, 1–16. [Google Scholar] [CrossRef]
  35. Doctors without Borders. GIS Support for the MSF Ebola Response in Guinea in 2014. Available online: http://www.cartong.org/sites/cartong/files/GIS%20Support%20Ebola%202015_EN.pdf (accessed on 15 August 2016).
  36. Rehrl, K.; Gröchenig, S. A framework for data-centric analysis of mapping activity in the context of volunteered geographic information. ISPRS Int. J. Geo-Inf. 2016, 5, 37. [Google Scholar] [CrossRef]
  37. Map Kibera. Citizen Mapping and Citizen Media. Available online: http://www.mapkibera.org/ (accessed on 1 June 2016).
  38. Zielstra, D.; Hochmair, H.H. Digital street data: Free versus proprietary. GIM Int. 2011, 29–33. Available online: http://www.gim-international.com/content/article/digital-street-data (accessed on 10 June 2016). [Google Scholar]
  39. Flanagin, A.; Metzger, M. The credibility of volunteered geographic information. GeoJournal 2008, 72, 137–148. [Google Scholar] [CrossRef]
  40. Forghanu, M.; Delavar, M.R. A quality study of the OpenStreetMap dataset for Tehran. ISPRS Int. J. Geo-Inf. 2014, 3, 750–763. [Google Scholar] [CrossRef]
  41. Mooney, P.; Corcoran, P.; Winstanley, A.C. Towards quality metrics for OpenStreetMap. In Proceedings of the 18th SIGSPATIAL Conference on Advances in Geographic Information Systems, San Jose, CA, USA, 3–5 November 2010; pp. 514–517.
  42. See, L.; Comber, A.; Salk, C.; Fritz, S.; van der Velde, M.; Perger, C.; McCallum, I.; Kraxner, F.; Obersteiner, M. Comparing the quality of the crowdsourced data collected by experts and non-experts. PLoS ONE 2013, 8, e69958. [Google Scholar] [CrossRef] [PubMed]
  43. Haklay, M. How good is volunteered geographical information? A comparative study of OpenStreetMap and Ordnance Survey datasets. Environ. Plan. B 2010, 37, 682–703. [Google Scholar] [CrossRef]
  44. Ludwig, I.; Voss, A.; Krause-Traudes, M. A comparison of the street networks of navteq and OSM in Germany. In Advancing Geoinformation Science for a Changing World; Geertman, S., Reinhardt, W., Toppen, F., Eds.; Springer: New York, NY, USA, 2011; pp. 65–84. [Google Scholar]
  45. Neis, P.; Zielstra, D.; Zipf, A. Comparison of volunteered geographic information data contributions and community development for selected world regions. Future Internet 2013, 5, 282–300. [Google Scholar] [CrossRef]
  46. Haklay, M. Haiti—How Can VGI Help? Comparison of OpenStreetMap and Google Map Maker. Available online: https://www.povesham.wordpress.com/2010/01/18/haiti-how-can-vgi-help-comparison-of-openstreetmap-and-google-map-maker/ (accessed on 10 June 2016).
  47. Girres, J.F.; Touya, G. Quality assessment of the French OpenStreetMap dataset. Trans. GIS 2010, 14, 435–459. [Google Scholar] [CrossRef]
  48. Mullen, W.; Jackson, S.P.; Croitoru, A.; Crooks, A.T.; Stefanidis, A.; Agouris, P. Assessing the impact of demographic characteristics on spatial error in volunteered geographic information features. GeoJournal 2015, 80, 587–605. [Google Scholar] [CrossRef]
  49. Mashhadi, A.; Quattrone, G.; Capra, L. The impact of society on volunteered geographic information: The case of OpenStreetMap. In OpenStreetMap in Giscience: Experiences, Research, and Applications; Arsanjani, J.J., Zipf, A., Mooney, P., Helbich, M., Eds.; Springer: New York, NY, USA, 2015; pp. 125–141. [Google Scholar]
  50. Ciepłuch, B.; Jacob, R.; Mooney, P.; Winstanley, A. Comparison of the accuracy of OpenStreetMap for Ireland with Google maps and Bing maps. In Proceedings of the Ninth International Symposium on Spatial Accuracy Assessment in Natural Resuorces and Enviromental Sciences, Leicester, UK, 20–23 July 2010.
  51. Hochmair, H.H.; Zielstra, D.; Neis, P. Assessing the completeness of bicycle trail and lane features in OpenStreetMap for the United States. Trans. GIS 2015, 19, 63–81. [Google Scholar] [CrossRef]
  52. Zielstra, D.; Zipf, A. A comparative study of proprietary geodata and volunteered geographic information for Germany. In Proceedings of the 13th AGILE International Conference on Geographic Information Science, Guimarães, Portugal, 11–14 May 2010; pp. 1–15.
  53. Dorn, H.; Törnros, T.; Zipf, A. Quality evaluation of VGI using authoritative data—A comparison with land use data in Southern Germany. ISPRS Int. J. Geo-Inf. 2015, 4, 1657–1671. [Google Scholar] [CrossRef]
  54. Johnson, I.; Hecht, B. Structural causes of bias in crowd-derived geographic information: Towards a holistic understanding. In Proceedings of the Association for the Advancement of Artificial Intelligence 2016 Spring Symposium on Observational Studies through Social Media and Other Human-Generated Content, Palo Alto, CA, USA, 21–23 March 2016.
  55. Haklay, M.M.; Basiouka, S.; Antoniou, V.; Ather, A. How many volunteers does it take to map an area well? The validity of linus’ law to volunteered geographic information. Cartogr. J. 2010, 47, 315–322. [Google Scholar] [CrossRef]
  56. Mundia, C.N.; Aniya, M. Dynamics of landuse/cover changes and degradation of Nairobi city, Kenya. Land Degrad. Dev. 2006, 17, 97–108. [Google Scholar] [CrossRef]
  57. Oyugi, M.O.; K’Akumu, O.A. Land use management challenges for the city of Nairobi. Urban Forum 2007, 18, 94–113. [Google Scholar] [CrossRef]
  58. KOD. Kenya Opendata. Available online: https://www.opendata.go.ke (accessed on 14 June 2016).
  59. Dutta, S.; Geiger, T.; Lanvin, B. The Global Information Technology Report 2015; World Economic Forum: Geneva, Switzerland, 2015. [Google Scholar]
  60. Ridwan, S.B.; Ferdous, H.S.; Ahmed, S.I. The challenges and prospect of OpenStreetMap in Bangladesh. In Proceedings of the 14th International Conference on Computer and Information Technology, Dhaka, Bangladesh, 22–24 December 2011.
  61. African Population and Health Research Center (APHRC). Population and Health Dynamics in Nairobi’s Informal Settlements: Report of the Nairobi Cross-Sectional Slums Survey (NCSS) 2012; African Population and Health Research Center: Nairobi, Kenya, 2014. [Google Scholar]
  62. KNBS. Population and Housing Census 2009, Kenya National Bureau of Statistics. Available online: http://www.knbs.or.ke/index.php?option=com_phocadownload&view=category&id=100&Itemid=1176 (accessed on 10 June 2016).
  63. World Bank. Kenya—Inside Informality: Poverty, Jobs, Housing and Services in Nairobi’s Slums; Report Number 36347-K; World Bank: Washington, DC, USA, 2006. [Google Scholar]
  64. World Bank. Kenya Poverty and Inequality Assessment; Report Number 44190-KE; World Bank: Washington, DC, USA, 2008. [Google Scholar]
  65. Amnesty International. Kenya—The Unseen Majority: Nairobi’s Two Million Slum Dwellers; Amnesty International: London, UK, 2009. [Google Scholar]
  66. Bontemps, S.; Defourny, P.; Bogaert, E.V.; Arino, O.; Kalogirou, V.; Perez, J.R. Globcover 2009—Products Description and Validation Report; Universite Catholique de Louvain and European Space Agency: Louvain-la-Neuve, Belgium, 2011. [Google Scholar]
  67. Virtual Kenya. Available online: http://www.maps.virtualkenya.org/ (accessed on 8 August 2016).
  68. OpenStreetMap. Available online: http://www.planet.openstreetmap.org/planet/full-history/ (accessed on 10 October 2016).
  69. BBBike. Available online: http://www.download.bbbike.org/osm/ (accessed on 2 April 2014).
  70. Google. Google Map Maker. Available online: https://www.services.google.com/fb/forms/mapmakerdatadownload/ (accessed on 2 April 2014).
  71. ORNL. Landscan. Available online: http://www.web.ornl.gov/sci/landscan/ (accessed on 3 April 2016).
  72. RCMRD. Regional Centre for Mapping of Resources for Development. Available online: http://www.rcmrd.org/organization/ (accessed on 10 June 2016).
  73. Leidig, M.; Teeuw, R.M. Correction: Quantifying and Mapping Global Data Poverty. PLoS ONE 2015, 10, e0145591. [Google Scholar] [CrossRef] [PubMed]
  74. Mulaku, G.C.; Kiema, J.B.K.; Siriba, D.N. Assessment of Kenya’s readiness for geospatial data infrastructure take off. Surv. Rev. 2013, 39, 328–337. [Google Scholar] [CrossRef]
  75. Guigoz, Y.; Giuliani, G.; Nonguierma, A.; Lehmann, A.; Mlisa, A.; Ray, N. Spatial Data Infrastructures in Africa: A Gap Analysis. J. Environ. Inf. 2016. [Google Scholar] [CrossRef]
  76. Bhaduri, B.; Bright, E.; Coleman, P.; Dobson, J. Landscan. Geoinformatics 2002, 5, 34–37. [Google Scholar]
  77. Okuku, J.; Bregt, A.; Grus, L. Assessing the development of Kenya National Spatial Data Infrastructure. S. Afr. J. Geoinf. 2014, 3, 95–112. [Google Scholar]
  78. OpenStreetMap. Available online: http://www.wiki.openstreetmap.org/wiki/Tag:highway%3Dunclassified (accessed on 12 October 2016).
  79. Rice, M.T.; Paez, F.I.; Mulhollen, A.P.; Shore, B.M.; Caldwell, D.R. Crowdsourced Geospatial Data: A Report on the Emerging Phenomena of Crowdsourced and User-Generate Geospatial Data; Report No. AA10-4733; Topographic Engineering Center: Alexandra, VA, USA, 2012. [Google Scholar]
  80. ESRI. Available online: http://www.esri.com/software/arcgis/arcgisonline (accessed on 22 August 2016).
  81. World Fact Book. Available online: https://www.cia.gov/library/publications/the-world-factbook/rankorder/2085rank.html (accessed on 16 August 2016).
  82. MapBox. Available online: https://www.mapbox.com/data-platform/country/#kenya (accessed on 16 August 2016).
  83. Anselin, L. Local indicators of spatial association—LISA. Geogr. Anal. 1995, 27, 93–115. [Google Scholar] [CrossRef]
  84. Neis, P.; Goetz, M.; Zipf, A. Towards Automatic Vandalism Detection in OpenStreetMap. Int. J. Geo Inf. 2012, 1, 315–332. [Google Scholar] [CrossRef]
  85. ORNL. LandScan Frequently Asked Questions. Available online: http://www.web.ornl.gov/sci/landscan/landscan_faq.shtml (accessed on 7 December 2016).
  86. Chen, C.C.; Knoblock, C.A.; Shahabi, C. Automatically conflating road vector data with orthoimagery. GeoInformatica 2006, 10, 495–530. [Google Scholar] [CrossRef]
  87. Song, W.; Haithcoat, T.L.; Keller, J.M. A snake-based approach for tiger road data conflation. Cartogr. Geogr. Inf. Sci. 2006, 33, 287–298. [Google Scholar] [CrossRef]
  88. Stevens, F.R.; Gaughan, A.E.; Linard, C.; Tatem, A.J. Disaggregating census data for population mapping using random forest with remotely-sensed and ancillary data. PLoS ONE 2015, 10, e0107042. [Google Scholar] [CrossRef] [PubMed]
  89. Crooks, A.; Croitoru, A.; Jenkins, A.; Mahabir, R.; Agouris, P.; Stefanidis, A. User-Generated Big Data and Urban Morphology. Built Environ. 2016, 42, 396–414. [Google Scholar] [CrossRef]
  90. De Leeuw, J.; Said, M.; Ortegah, L.; Nagda, S.; Georgiadou, Y.; DeBlois, M. An assessment of the accuracy of volunteered road map production in Western Kenya. Remote Sens. 2011, 3, 247–256. [Google Scholar] [CrossRef]
  91. Jackson, S.P.; Mullen, W.; Agouris, P.; Crooks, A.T.; Croitoru, A.; Stefanidis, A. Assessing completeness and spatial error of features in volunteered geographic information. ISPRS Int. J. Geo-Inf. 2013, 2, 507–530. [Google Scholar] [CrossRef]
  92. Klonner, C.; Barron, C.; Neis, P.; Höfle, B. Updating digital elevation models via change detection and fusion of human and remote sensor data in urban environments. Int. J. Digit. Earth 2015, 8, 153–171. [Google Scholar] [CrossRef]
  93. Fan, H.; Zipf, A.; Fu, Q.; Neis, P. Quality assessment for building footprints data on OpenStreetMap. Int. J. Geogr. Inf. Sci. 2014, 28, 700–719. [Google Scholar] [CrossRef]
  94. Fan, H.; Zipf, A. Modelling the work in 3D from VGI/Crowdsourced data. In European Handbook of Crowdsourced Geographic Information; Capineri, C., Haklay, M., Huang, H., Antoniou, V., Kettunen, J., Ostermann, F., Purves, R., Eds.; Ubiquity Press: London, UK, 2016; pp. 435–446. [Google Scholar]
  95. Sabri, S.; Rajabifarb, A.; Ho, S.; Amirebrahimi, S.; Bishop, I. Leveraging VGI integrated with 3D spatial technology to support urban intensification in Melbourne, Australia. Urban Plan. 2016, 1, 32–48. [Google Scholar] [CrossRef]
  96. Fritz, S.; McCallum, I.; Schill, C.; Perger, C.; See, L.; Schepaschenko, D.; Van der Velde, M.; Kraxner, F.; Obersteiner, M. Geo-wiki: An online platform for improving global land cover. Environ. Model. Softw. 2012, 31, 110–123. [Google Scholar] [CrossRef]
  97. See, L.; Schepaschenko, D.; Lesiv, M.; McCallum, I.; Fritz, S.; Comber, A.; Perger, C.; Schill, C.; Zhao, Y.; Maus, M.V.; et al. Building a hybrid land cover map with crowdsourcing and geographically weighted regression. ISPRS J. Photogramm. Remote Sens. 2015, 103, 48–56. [Google Scholar] [CrossRef] [Green Version]
  98. Sui, D. The wikification of GIS and its consequences: Or Angelina Jolie’s new tattoo and the future of GIS. Comput. Environ. Urban Syst. 2008, 32, 1–5. [Google Scholar] [CrossRef]
Figure 1. Study area: Nairobi, Kenya, and its surrounding counties.
Ijgi 06 00024 g001
Figure 2. Spatial distribution of road types from different sources for a residential settlement in western Nairobi (background imagery source: ESRI [80]).
Ijgi 06 00024 g002
Figure 3. Roads in Nairobi and surrounding areas.
Ijgi 06 00024 g003
Figure 4. Road coverage per km2.
Ijgi 06 00024 g004
Figure 5. Pairwise difference in road coverage. Clockwise from top left: (i) RCMRD 2011 vs. Map Maker 2014; (ii) RCMRD 2011 vs. OSM 2011; (iii) RCMRD 2011 vs. OSM 2014; (iv) OSM 2014 vs. Map Maker 2014 (red cells: first layer has higher coverage; green cells: second layer has higher coverage).
Ijgi 06 00024 g005
Figure 6. OSM Road Networks in (i) 2011; and (ii) 2014; and (iii) difference in Road Coverage between OSM 2011 and 2014 (where green represents areas where road coverage was reduced and red represents areas where road coverage was increased between 2011 and 2014).
Ijgi 06 00024 g006
Figure 7. OSM roads in the Ngong Forest Reserve, Nairobi, Kenya (background imagery source: ESRI [80]).
Ijgi 06 00024 g007
Figure 8. Cluster/outliers between road networks.
Ijgi 06 00024 g008
Figure 9. Population density per 1 km by 1 km in Nairobi and surrounding areas.
Ijgi 06 00024 g009
Figure 10. Road coverage in relation to population density per km2.
Ijgi 06 00024 g010
Figure 11. Pairwise difference in roads per population density (green, second layer have higher values; red, first layer has higher values).
Ijgi 06 00024 g011
Figure 12. Cluster/outliers between road networks normalized by population.
Ijgi 06 00024 g012
Figure 13. Normalized changes in OSM change vs. population density change due to additions.
Ijgi 06 00024 g013
Table 1. Datasets used for this study. RCMRD, Regional Center for Mapping of Resources for Development; ORNL, Oak Ridge National Laboratory.
Data SourceMode of AcquisitionLast UpdatedReference
Road datasets:
RCMRDVirtual Kenya geoportal2011[67]
OSMOpenStreetMap 2011[68]
OSMBBBike online application2014[69]
Map MakerApplication submitted online to Map Maker program2014[70]
Auxiliary datasets:
LandScanORNL LandScan geoportal 2014[71]
County Kenya Open Data geoportal 2014[58]
Land coverEuropean Space Agency geoportal 2009[66]
Table 2. Summary statistics of road data for Nairobi and surrounding area.
RCMRDOSM 2011OSM 2014Map Maker
Cells containing roads (out of 4056)3521161122542197
Maximum total road length per cell (m)11,903.520,915.620,951.816,799.1
Total road length per dataset (m)7,522,529.53,737,231.16,228,540.17,078,607.4
Mean value of road coverage length per cell (m)1854.7921.41535.71745.2

