
Locating Automated External Defibrillators in a Complicated Urban Environment Considering a Pedestrian-Accessible Network that Focuses on Out-of-Hospital Cardiac Arrests

Abstract
:1. Introduction
- ·
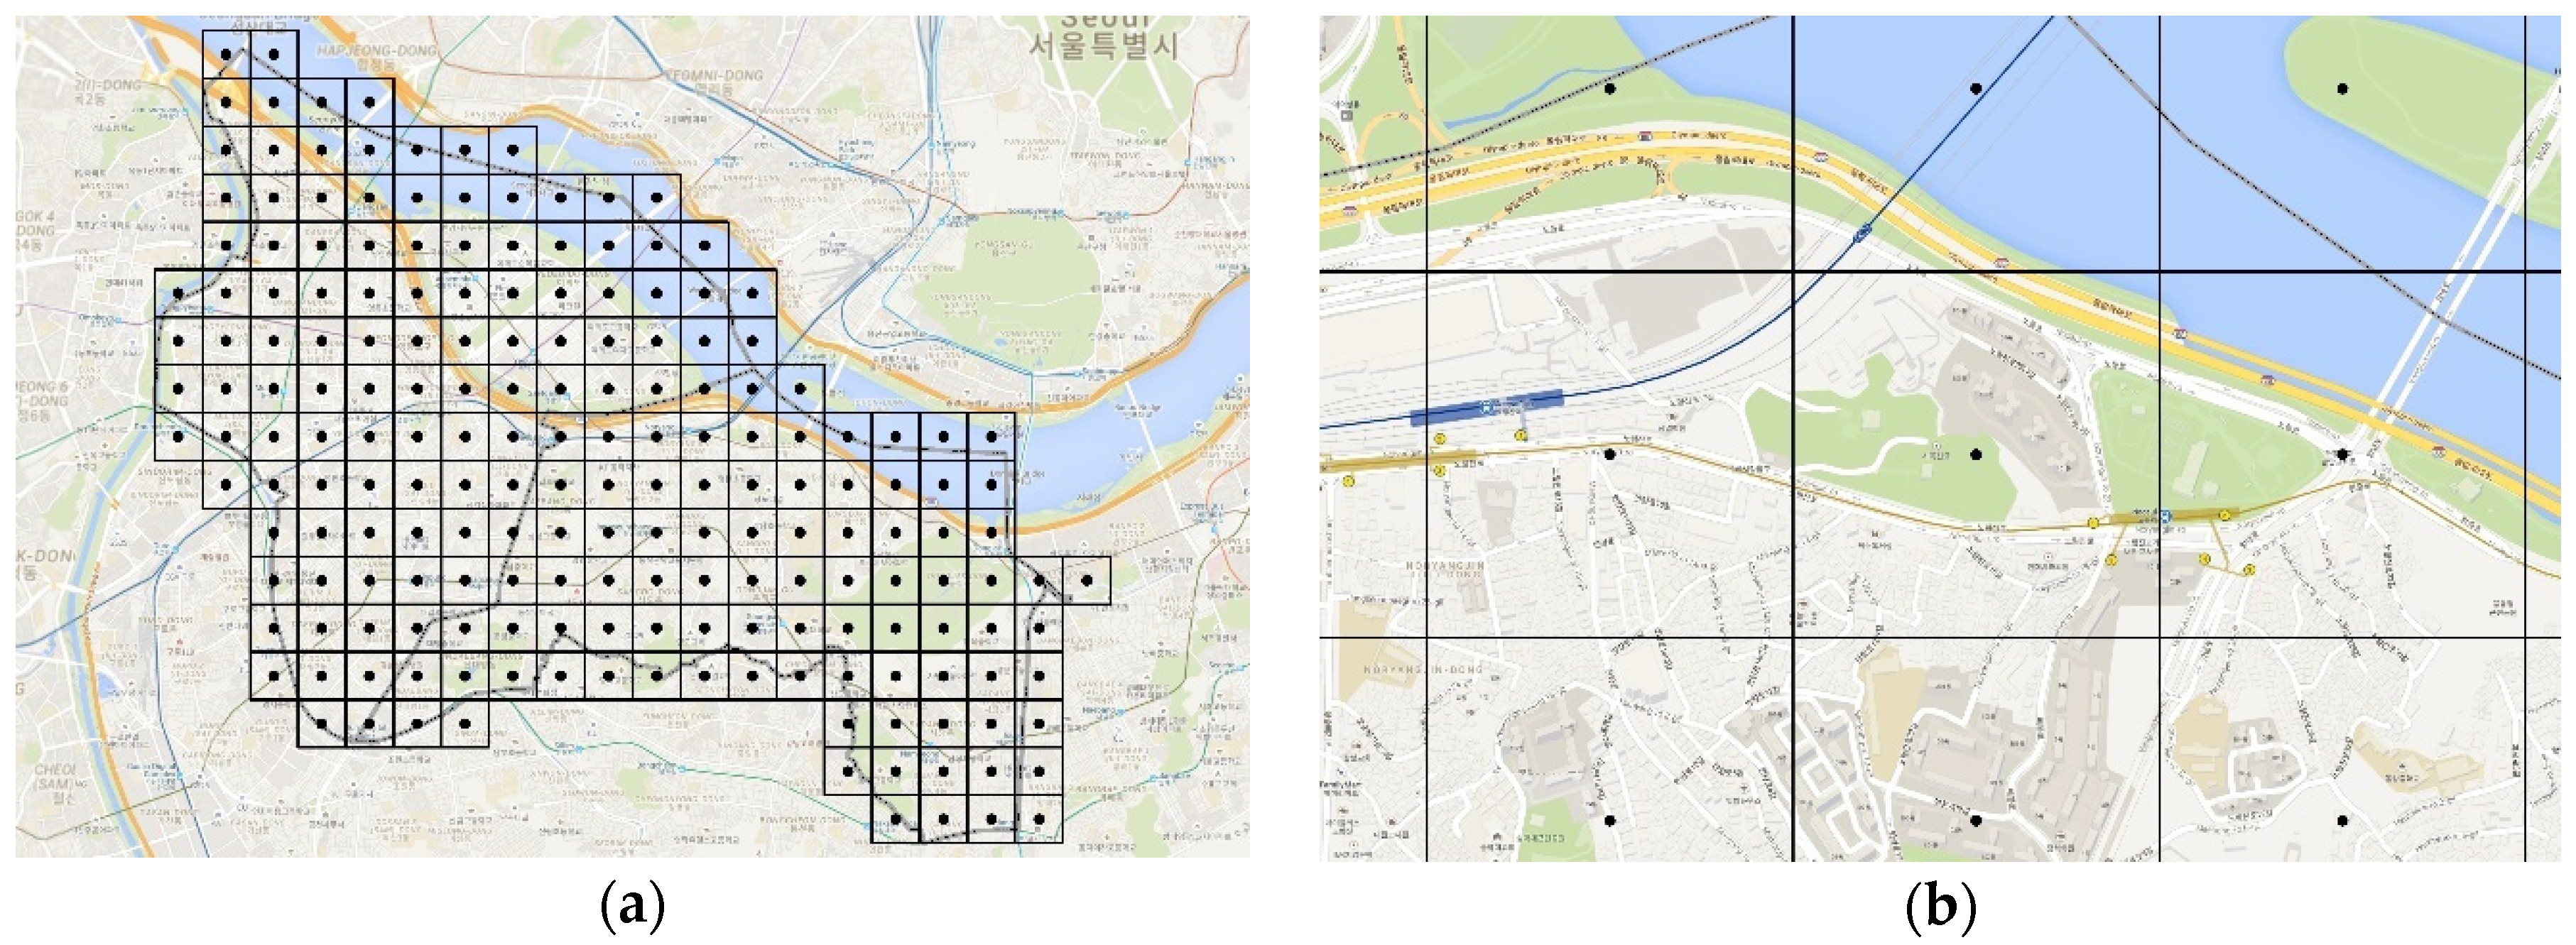
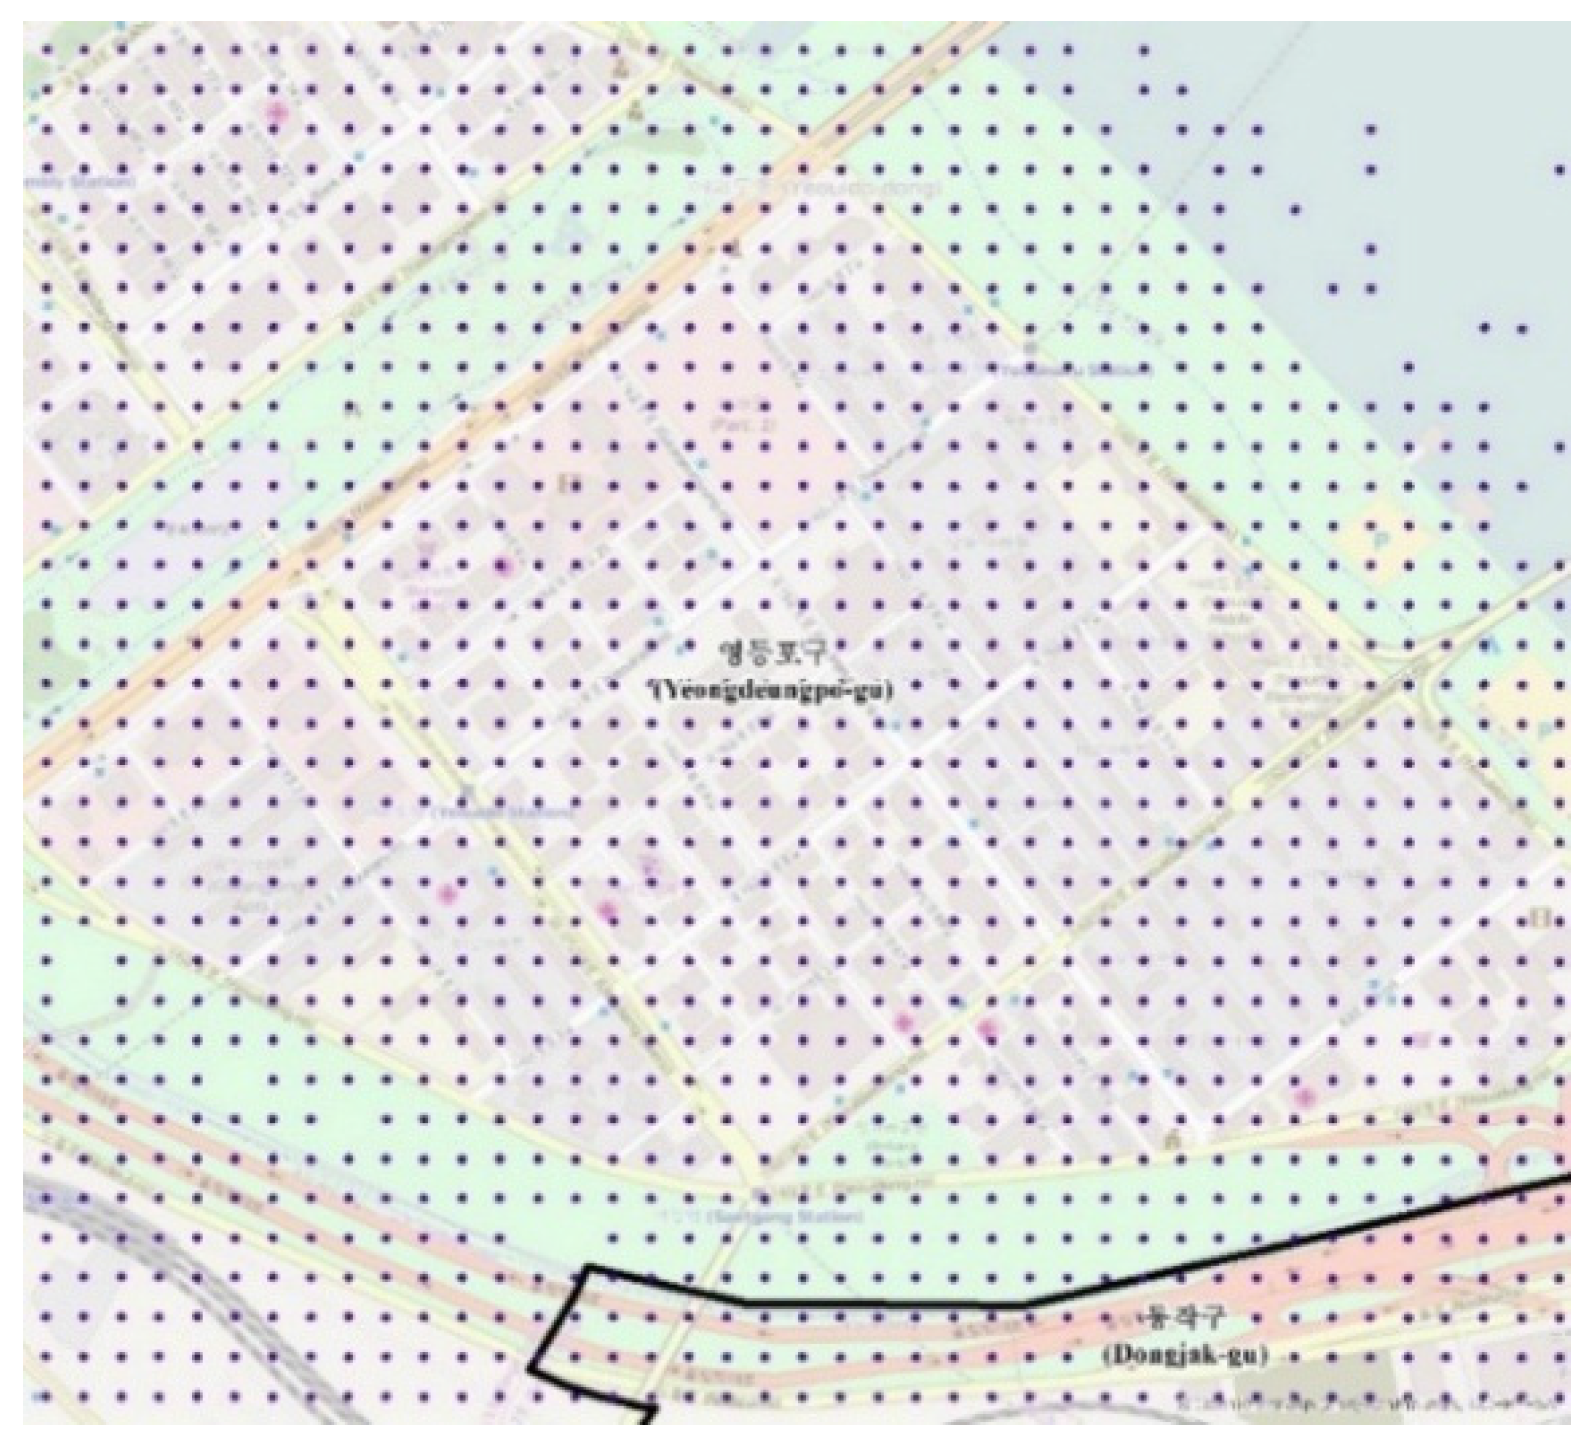
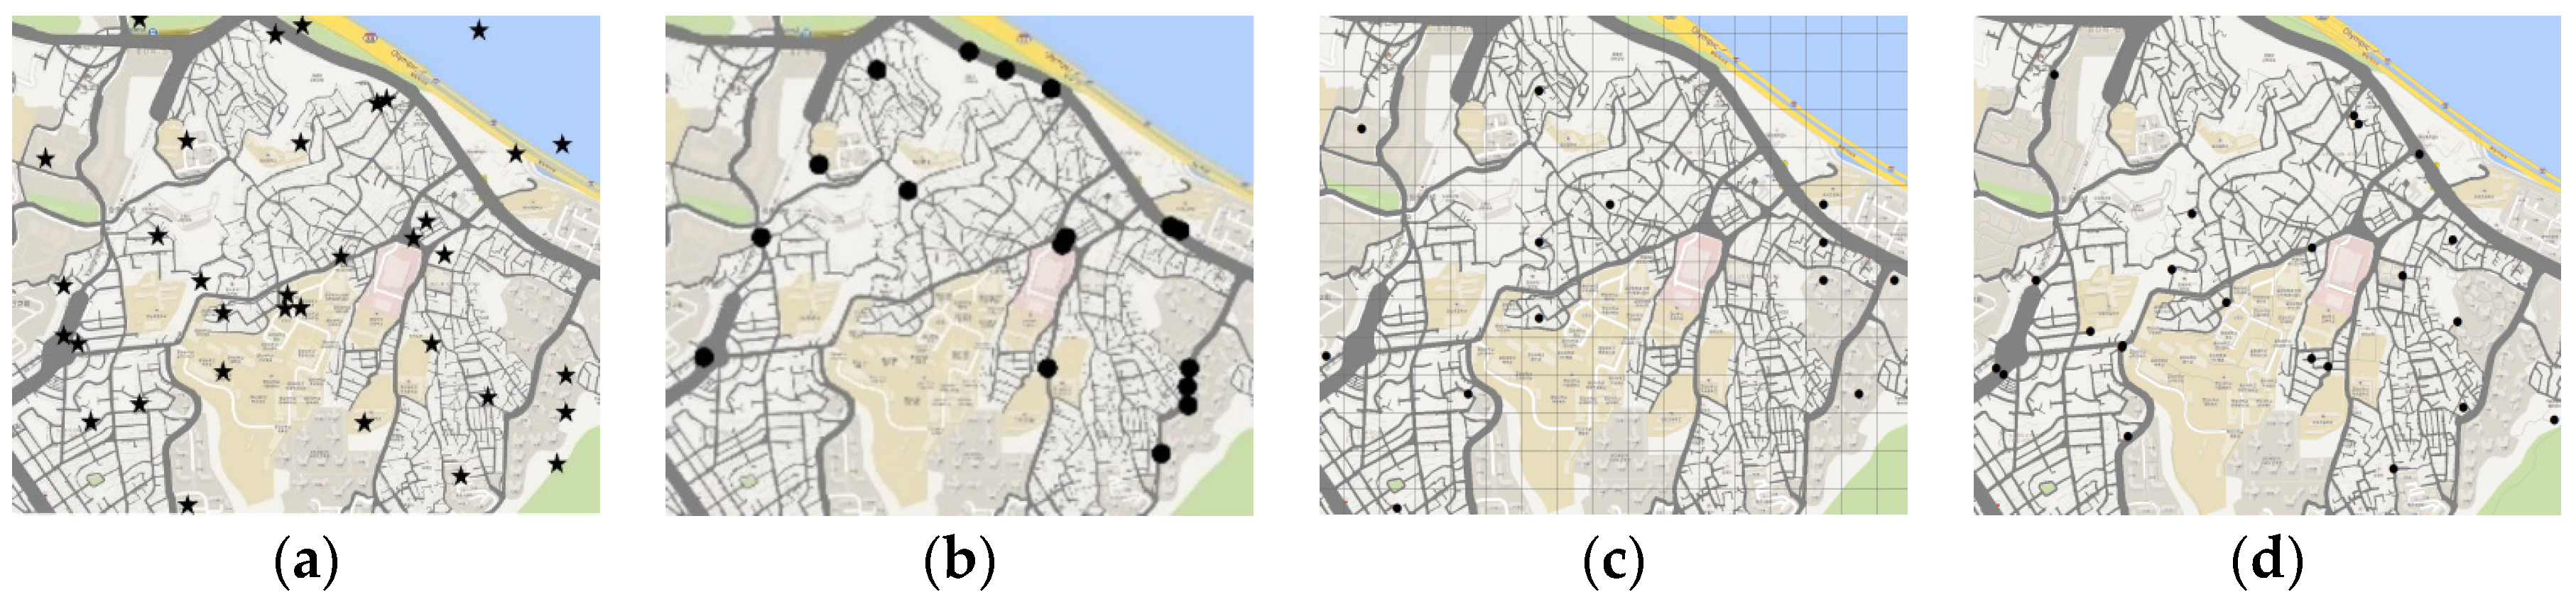
- As shown in Figure 1b, considering the geographical characteristics of a study area is impossible unless the grid size is sufficiently small to distinguish the features from the pedestrian perspective.
- ·
- Distorted results can be obtained if the candidate nodes are simply the centroid of grids or administration boundaries because the grid size changes (i.e., modifiable areal unit problem).
- ·
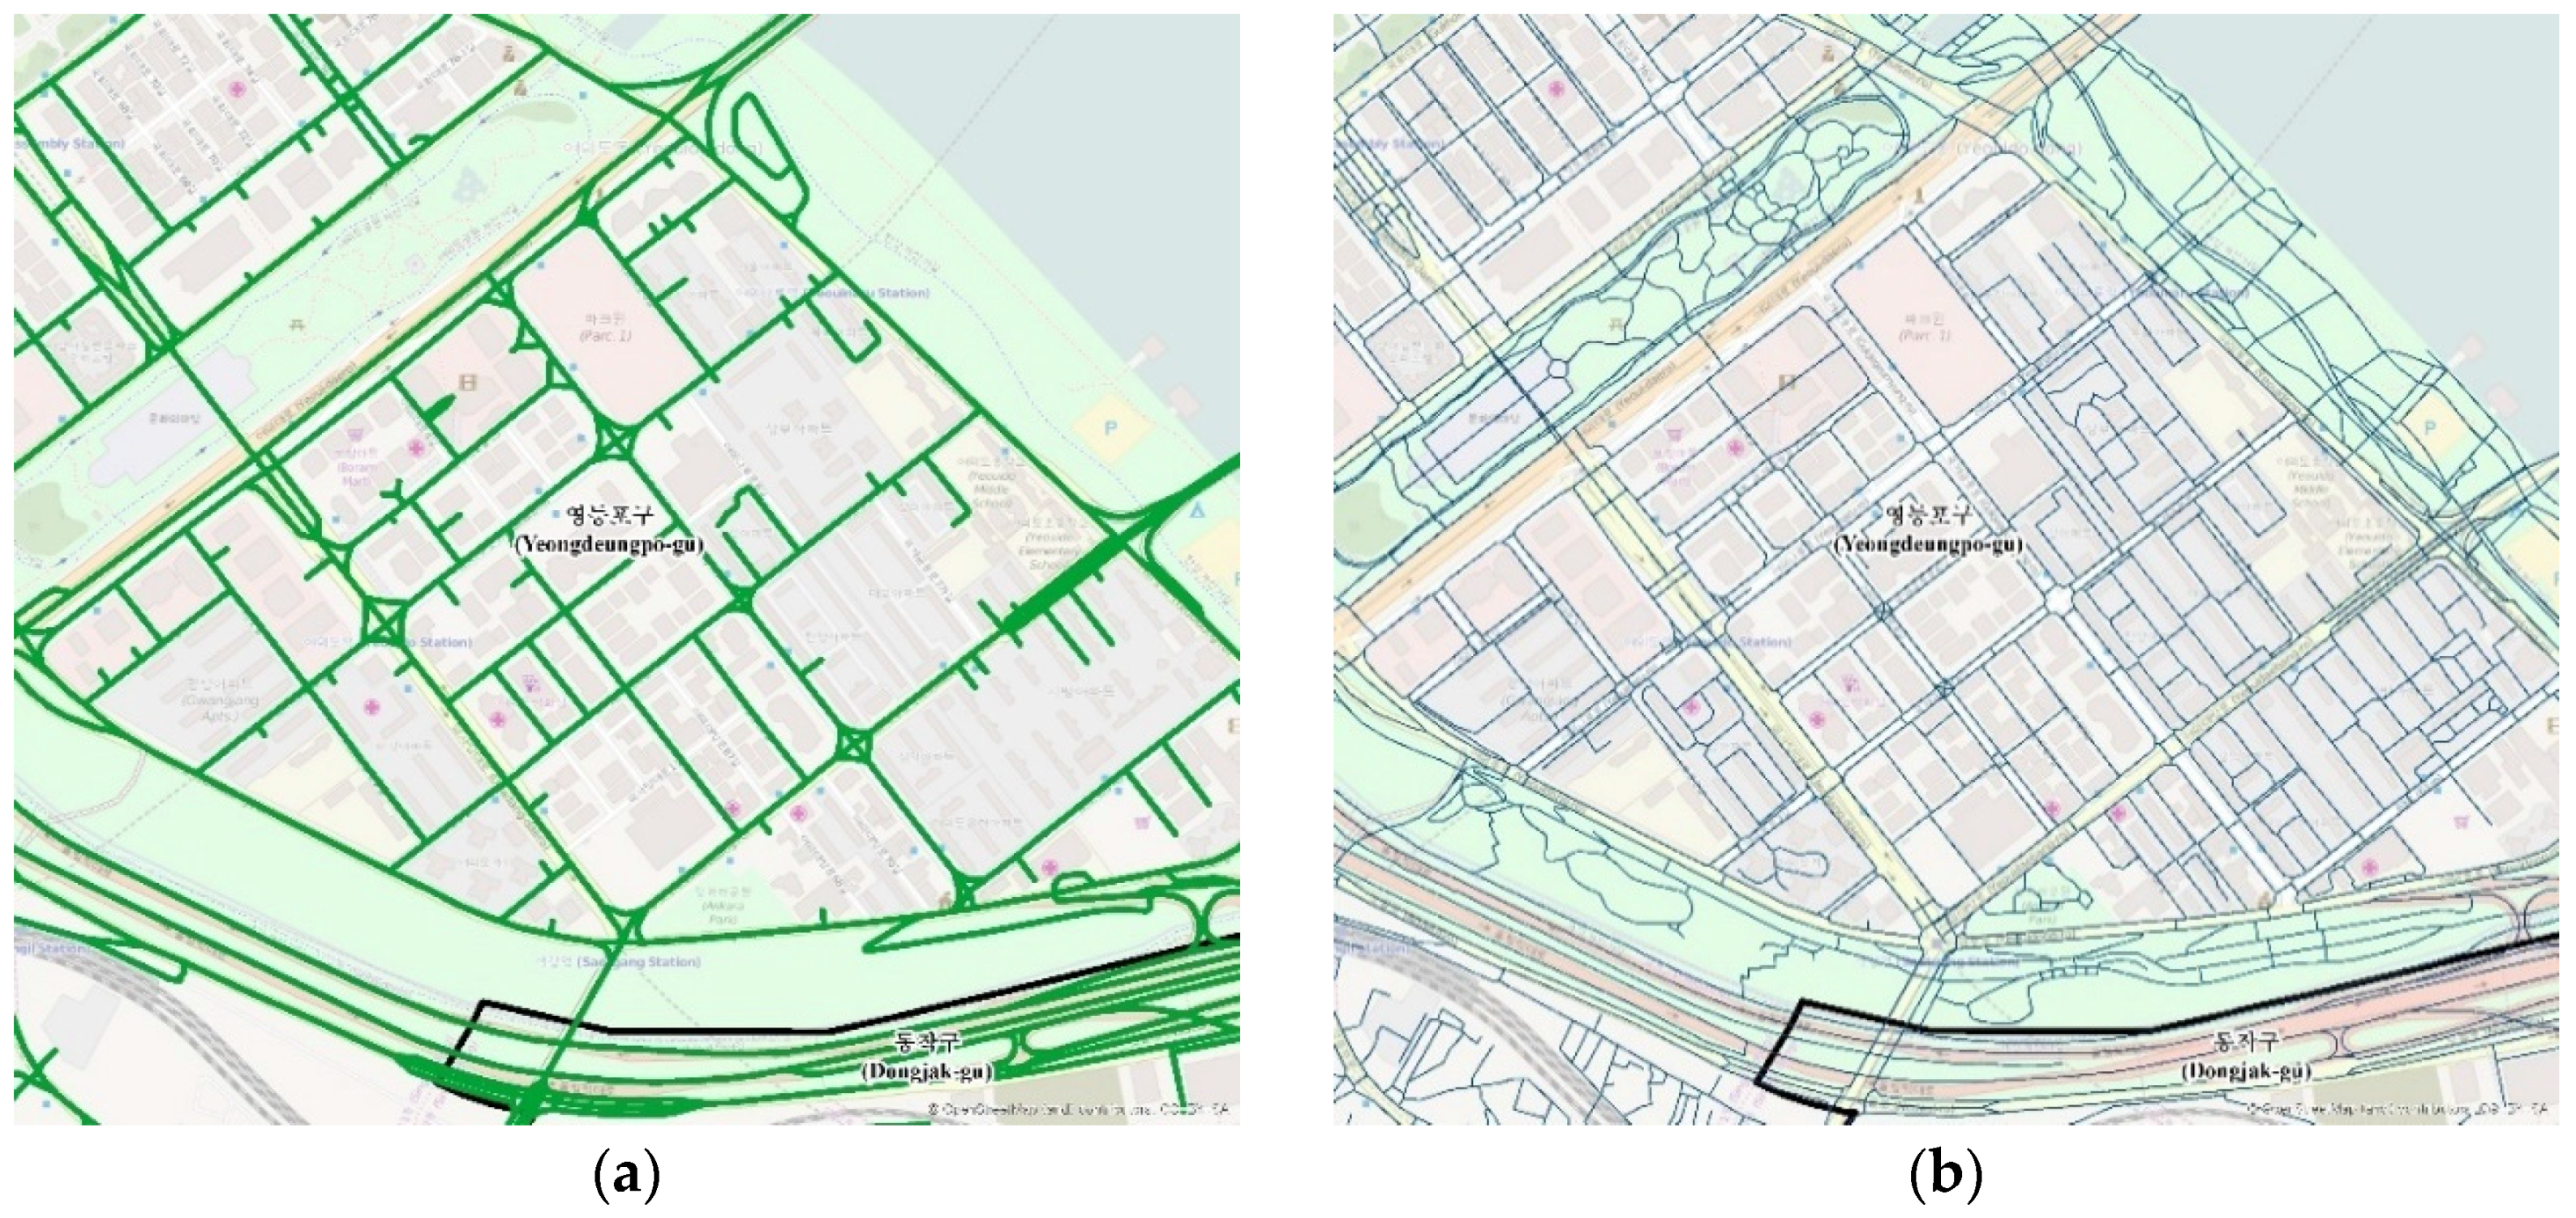
- Pedestrian barriers such as crosswalks and buildings, which are important components in complicated urban environments, as well as underpasses and overpasses or similar network structures, have 3D information that cannot be represented using the centroid of grids or administration boundaries.
2. Study Area, Data, and Method
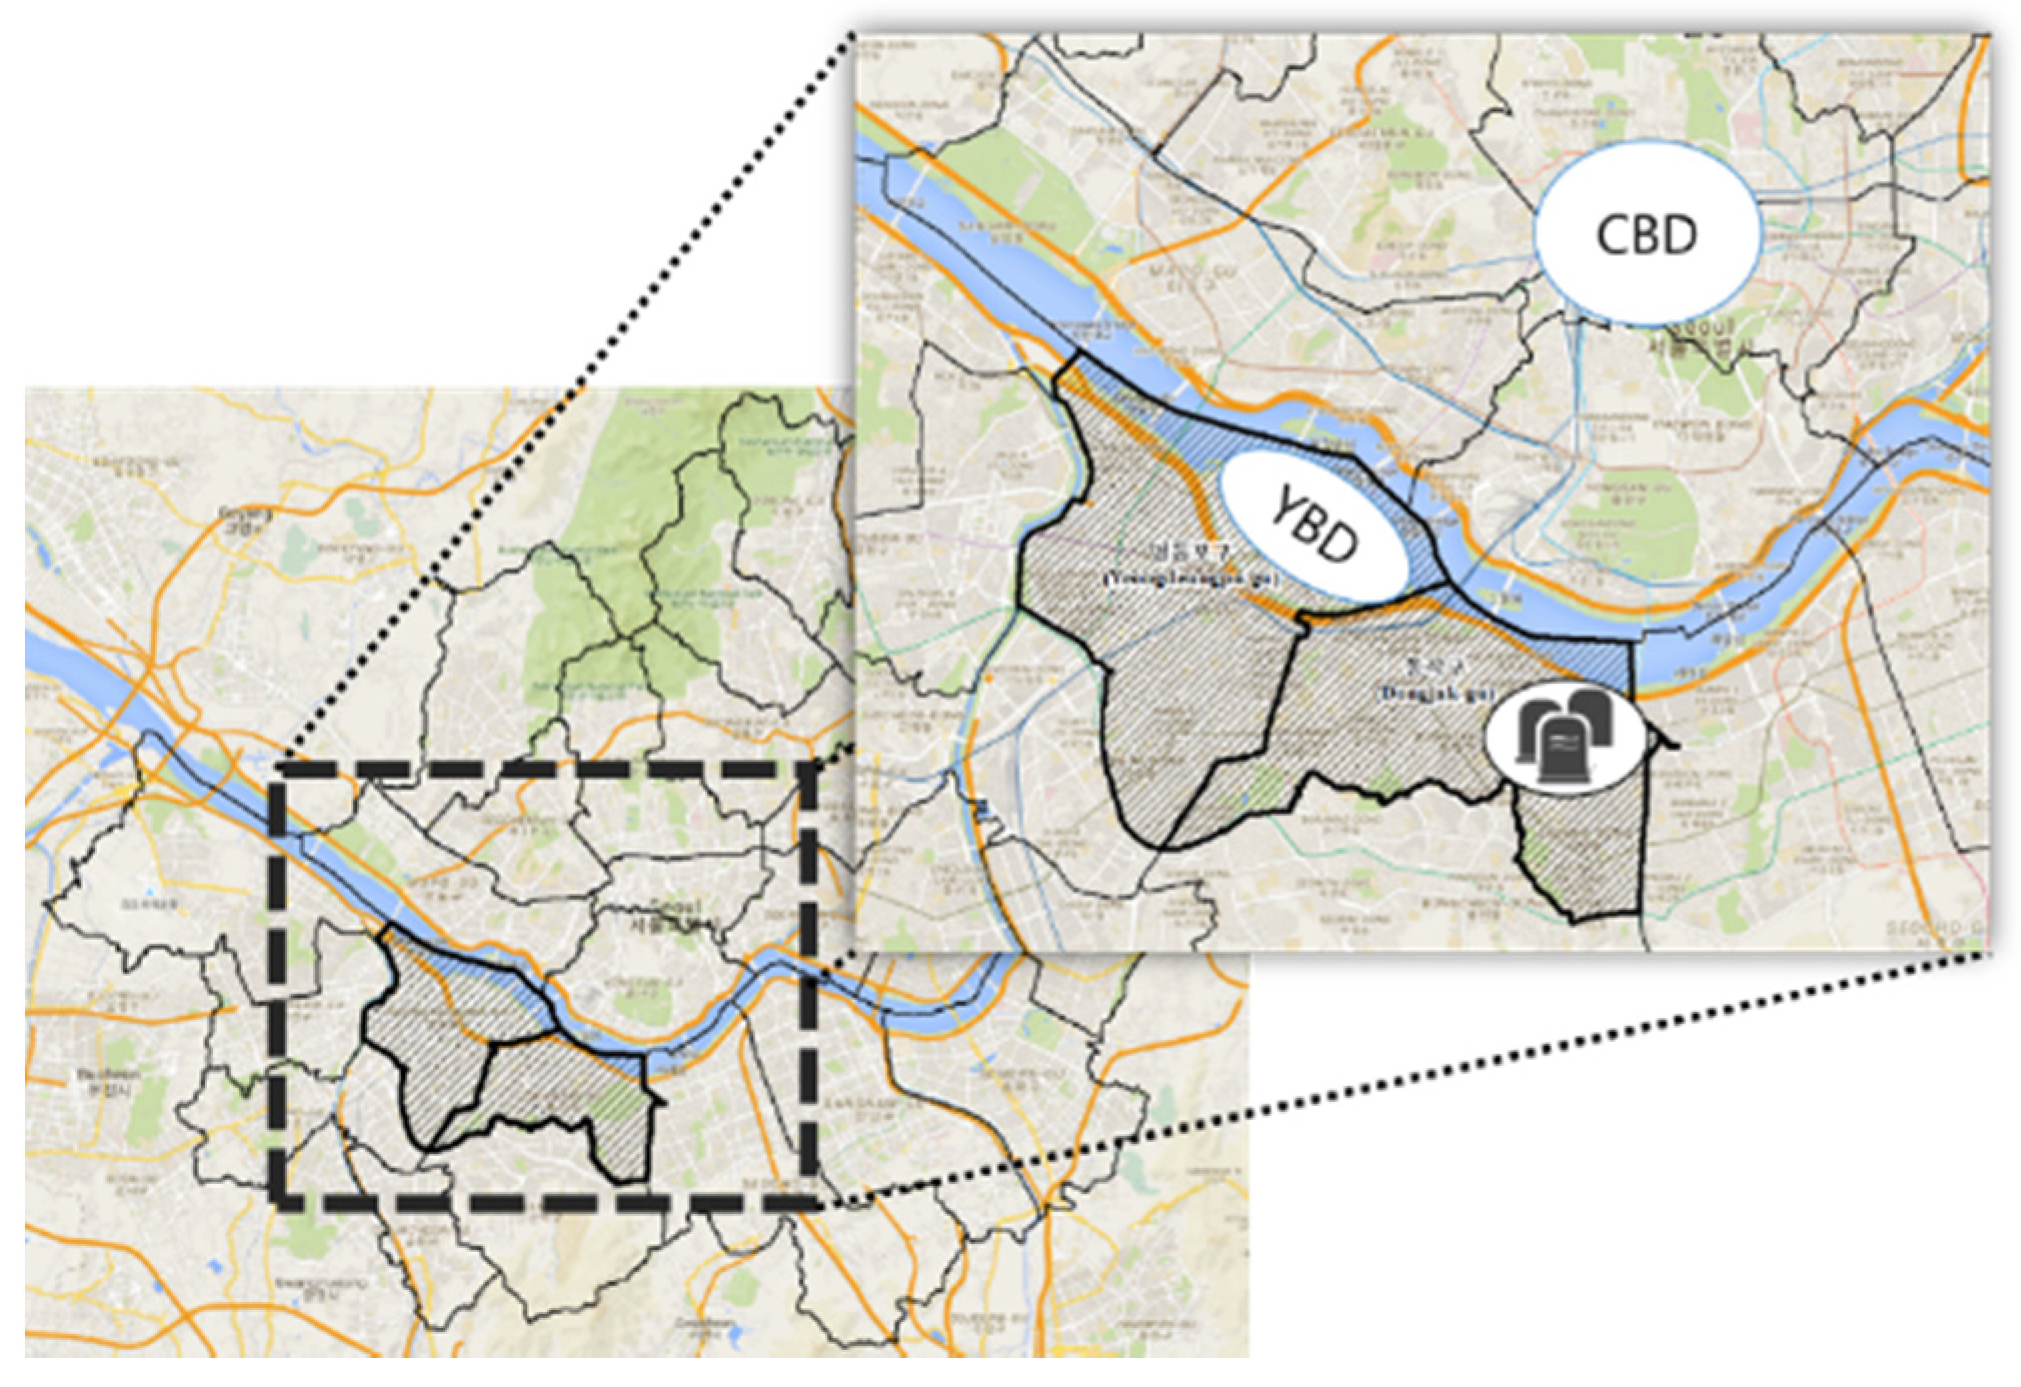
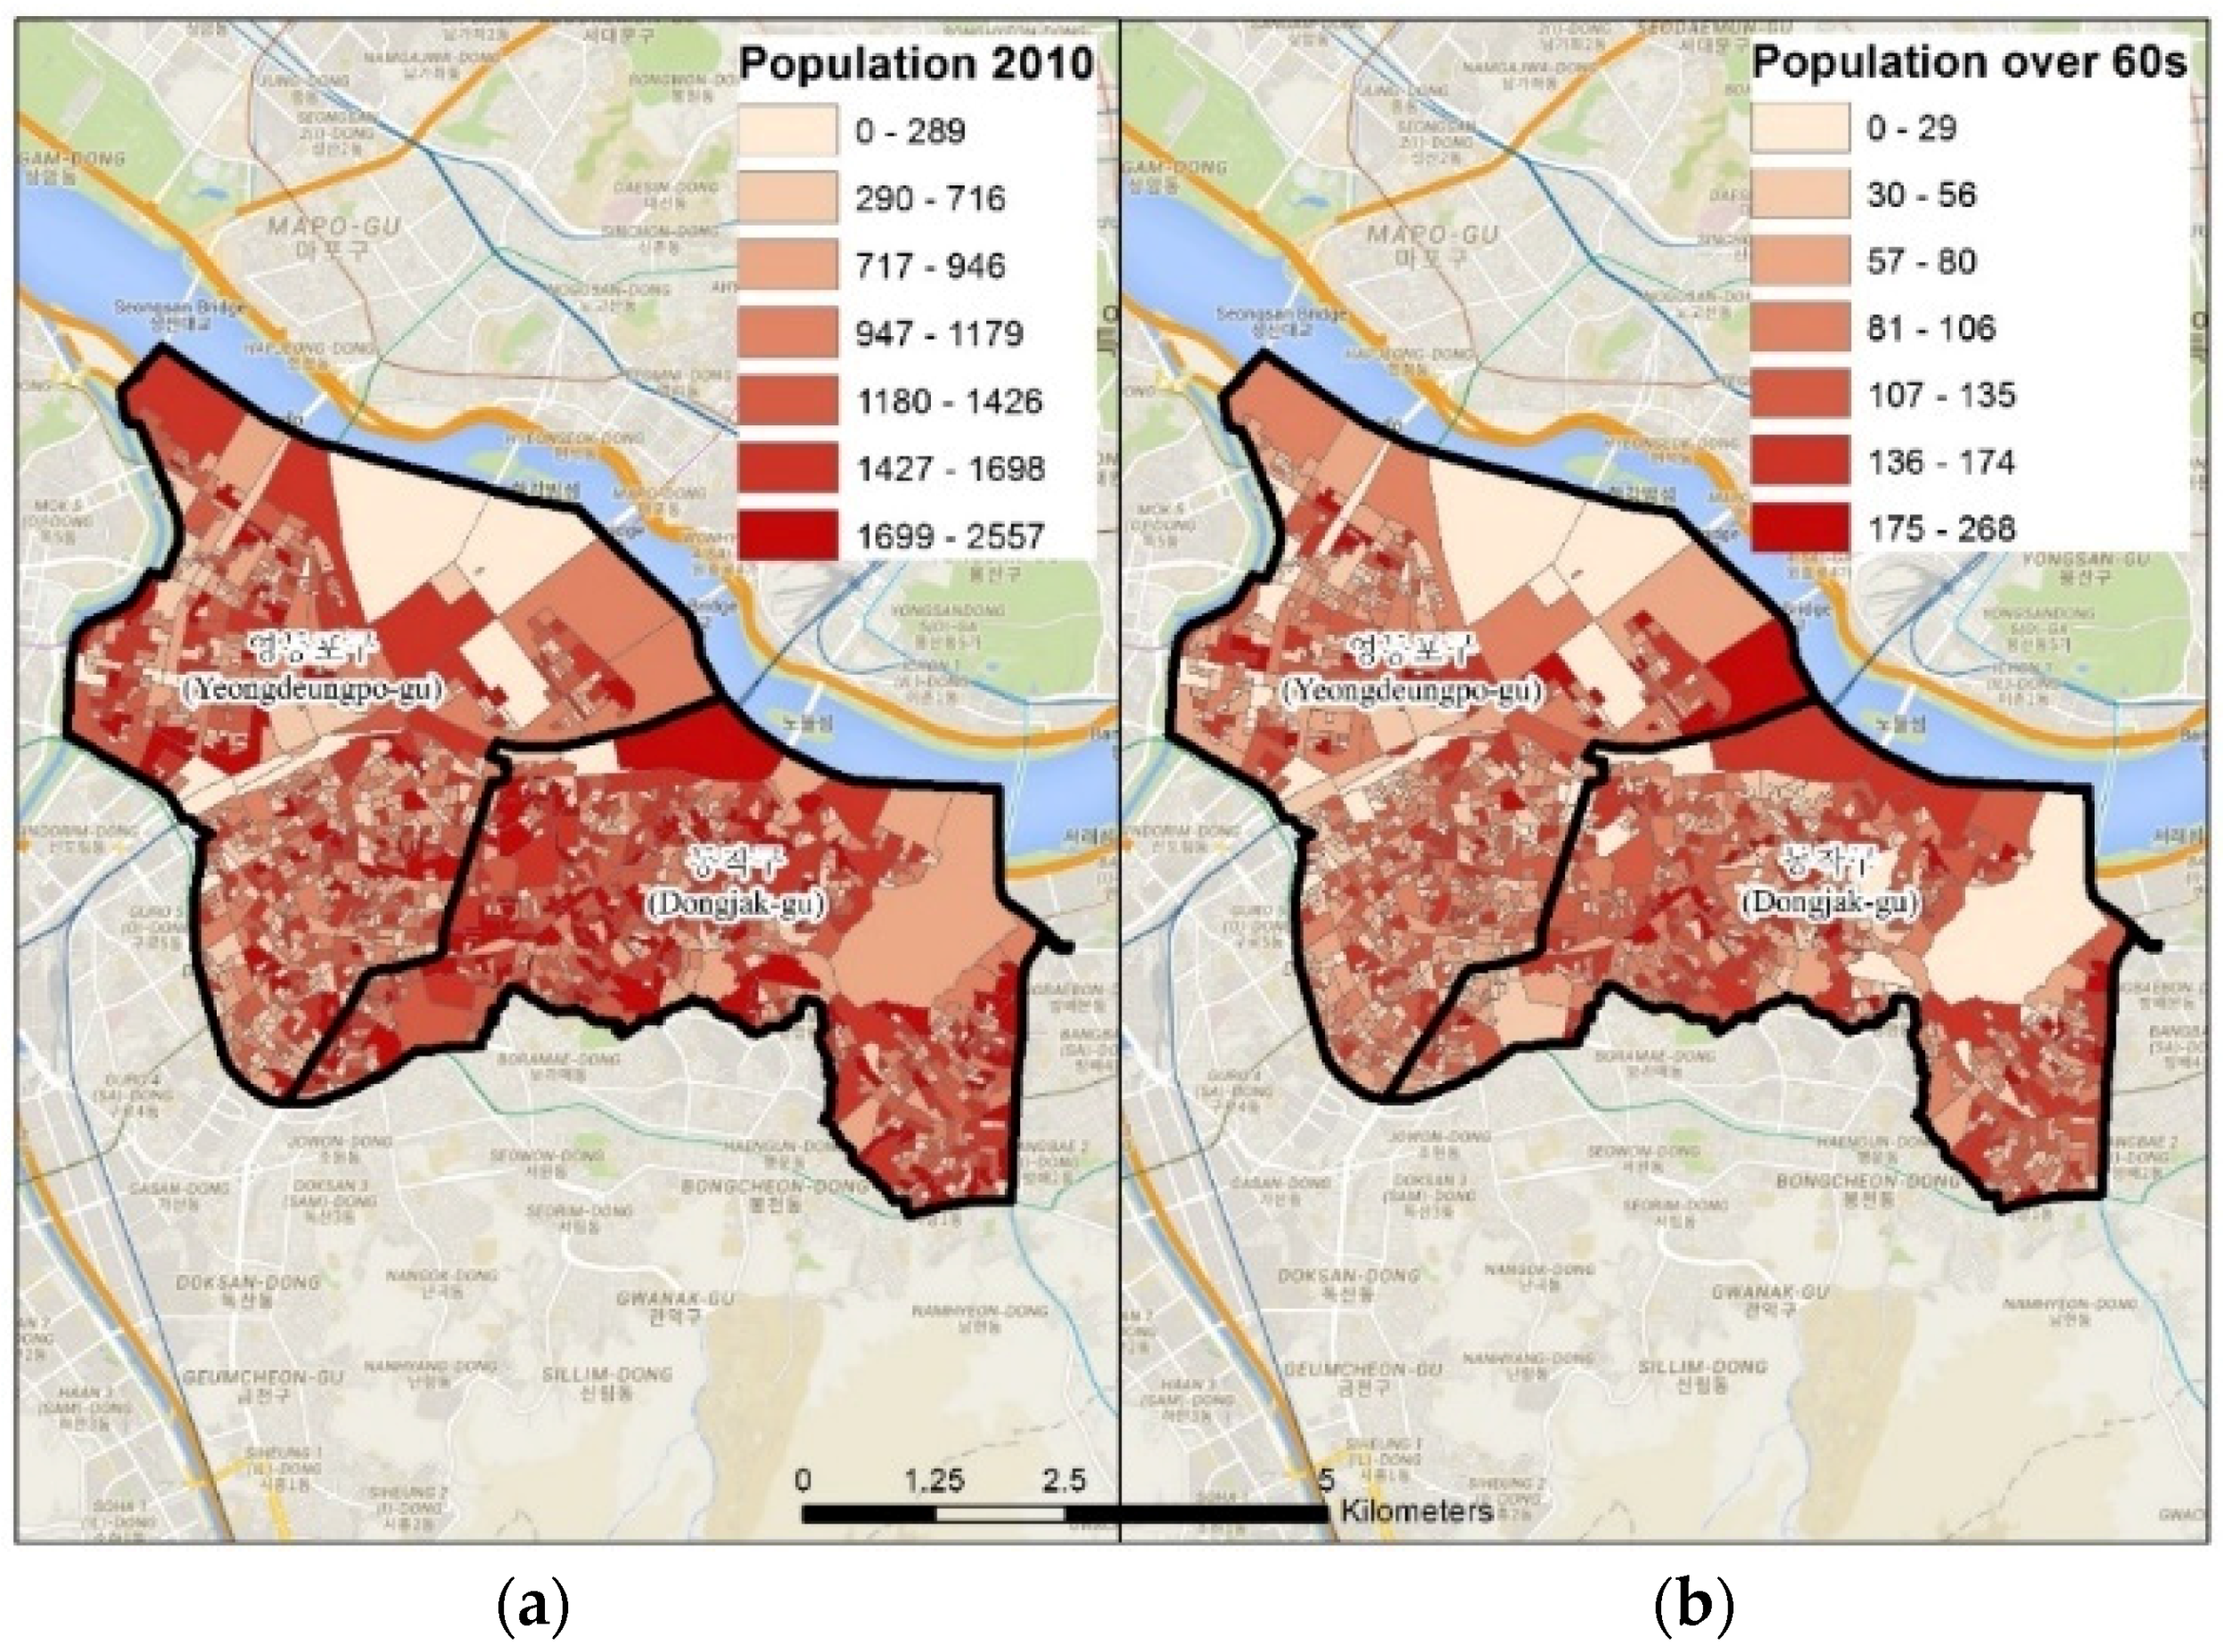
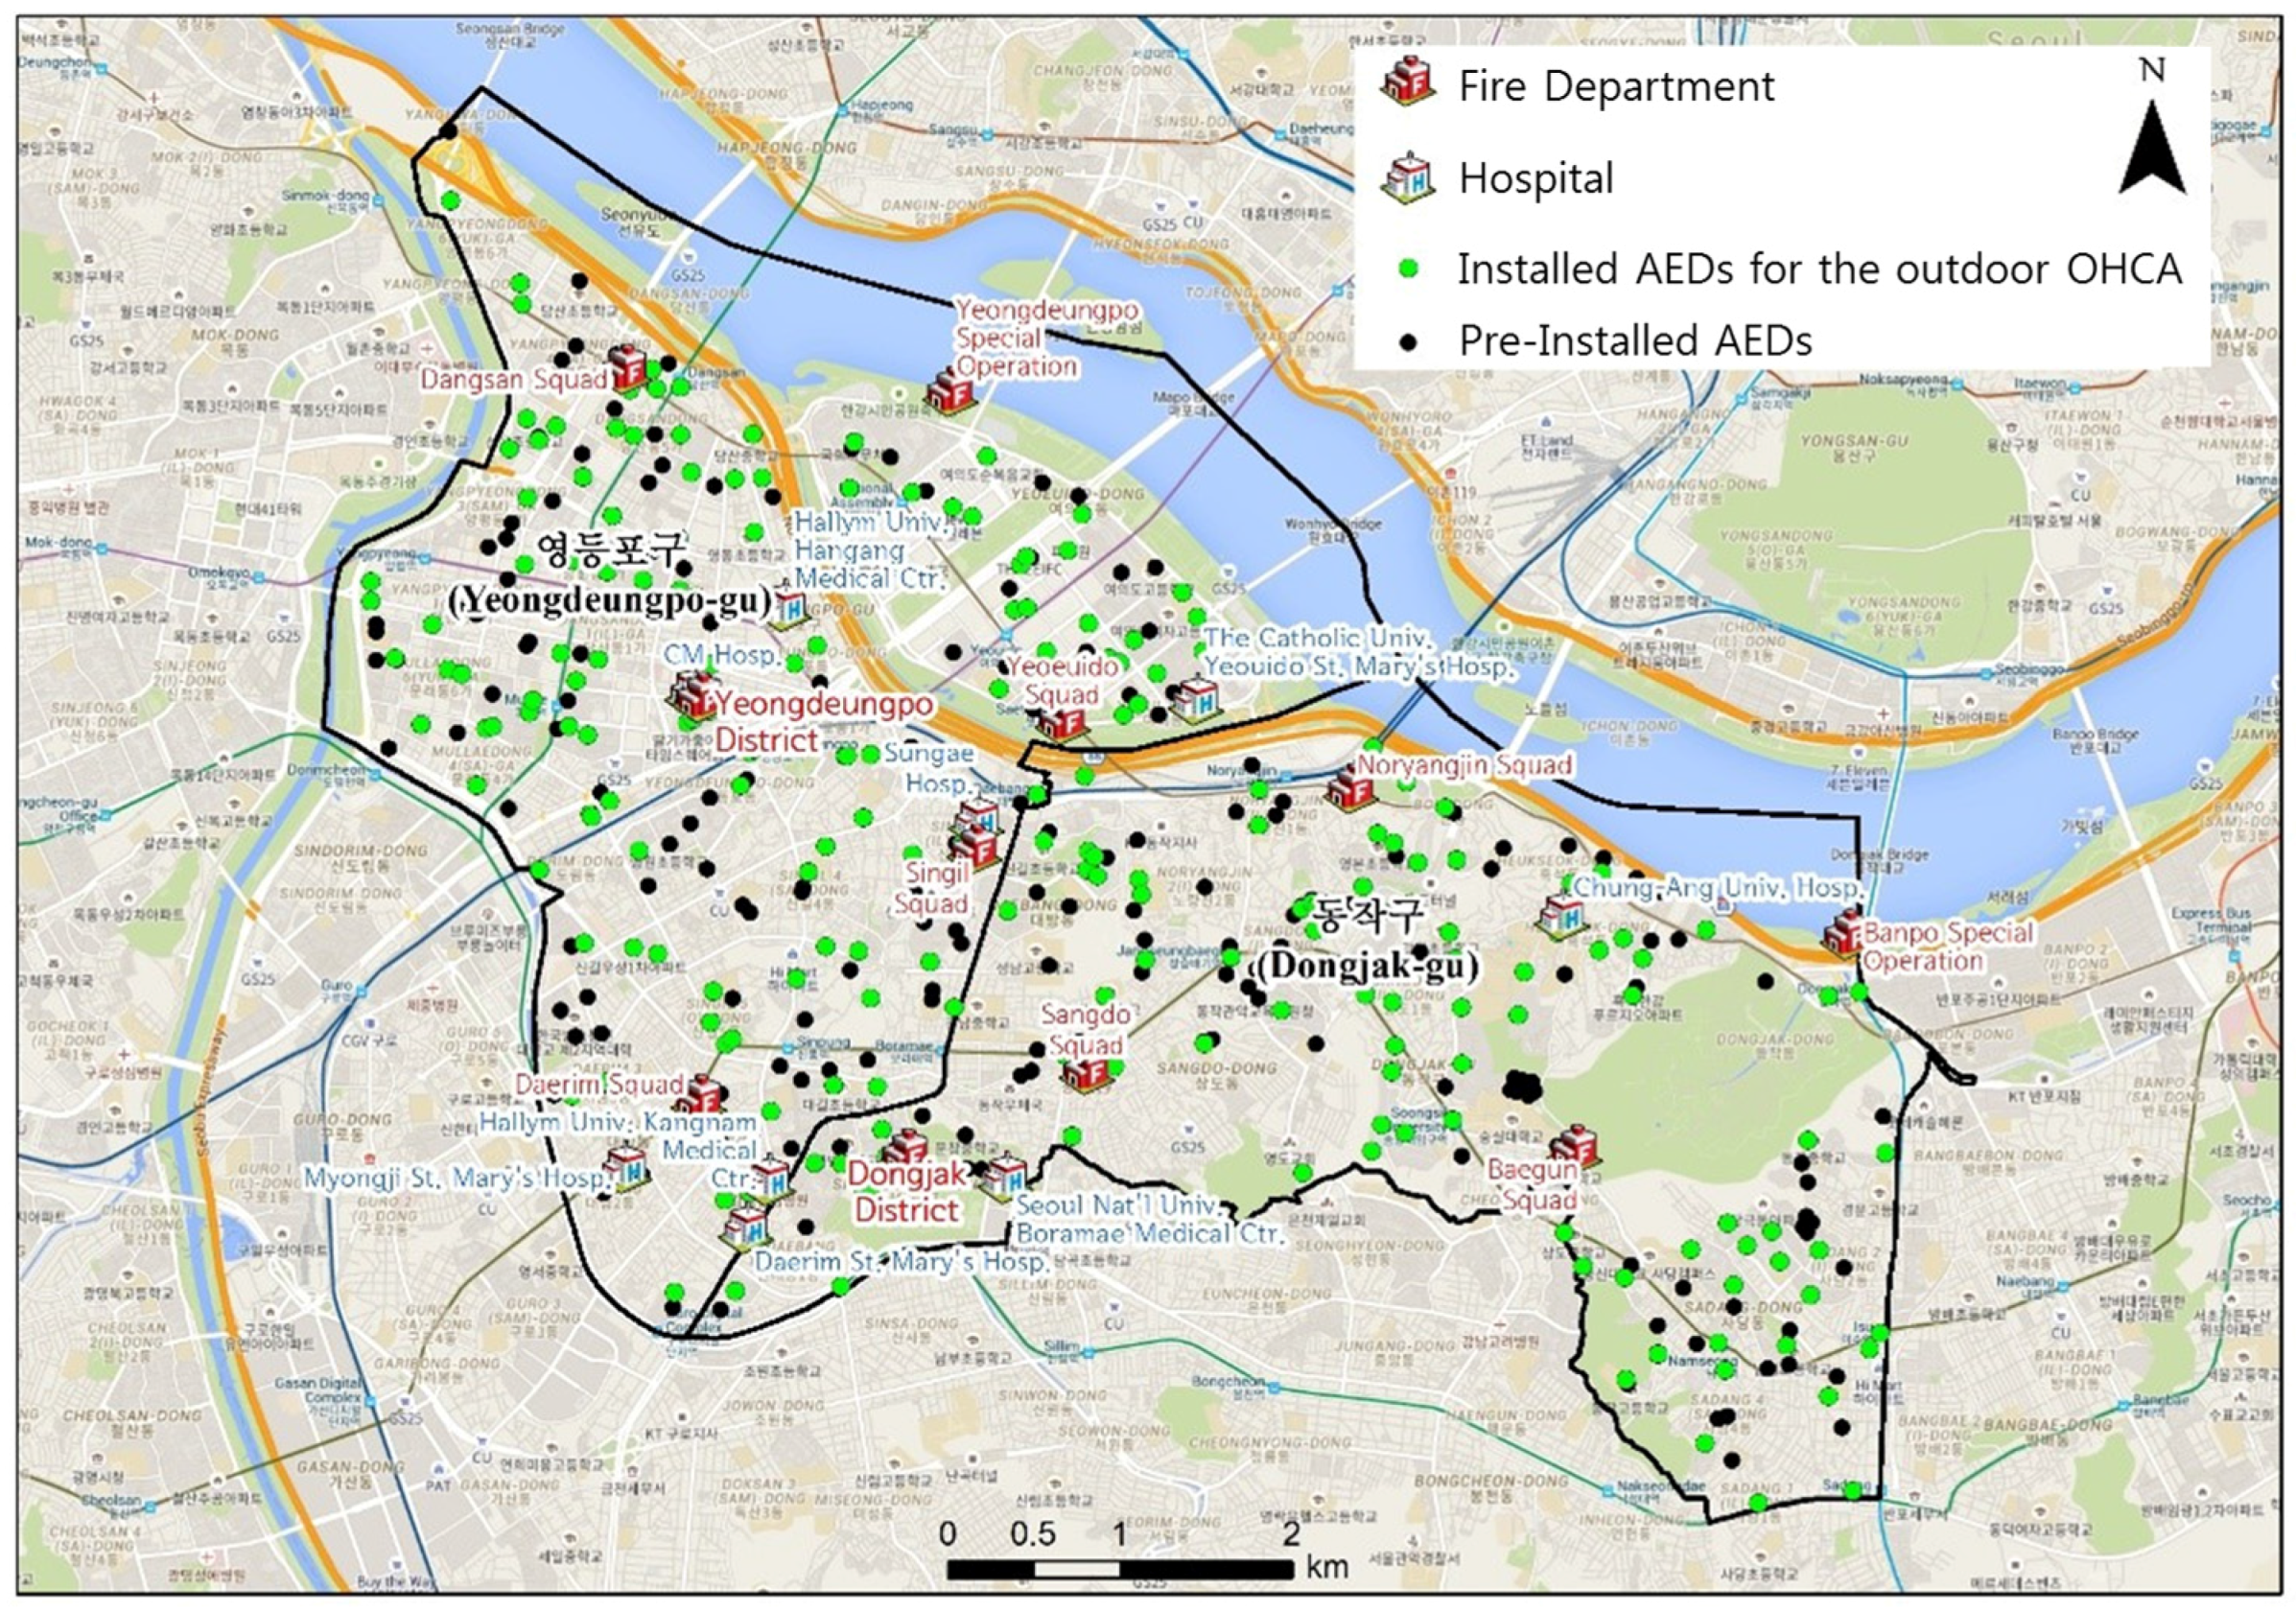
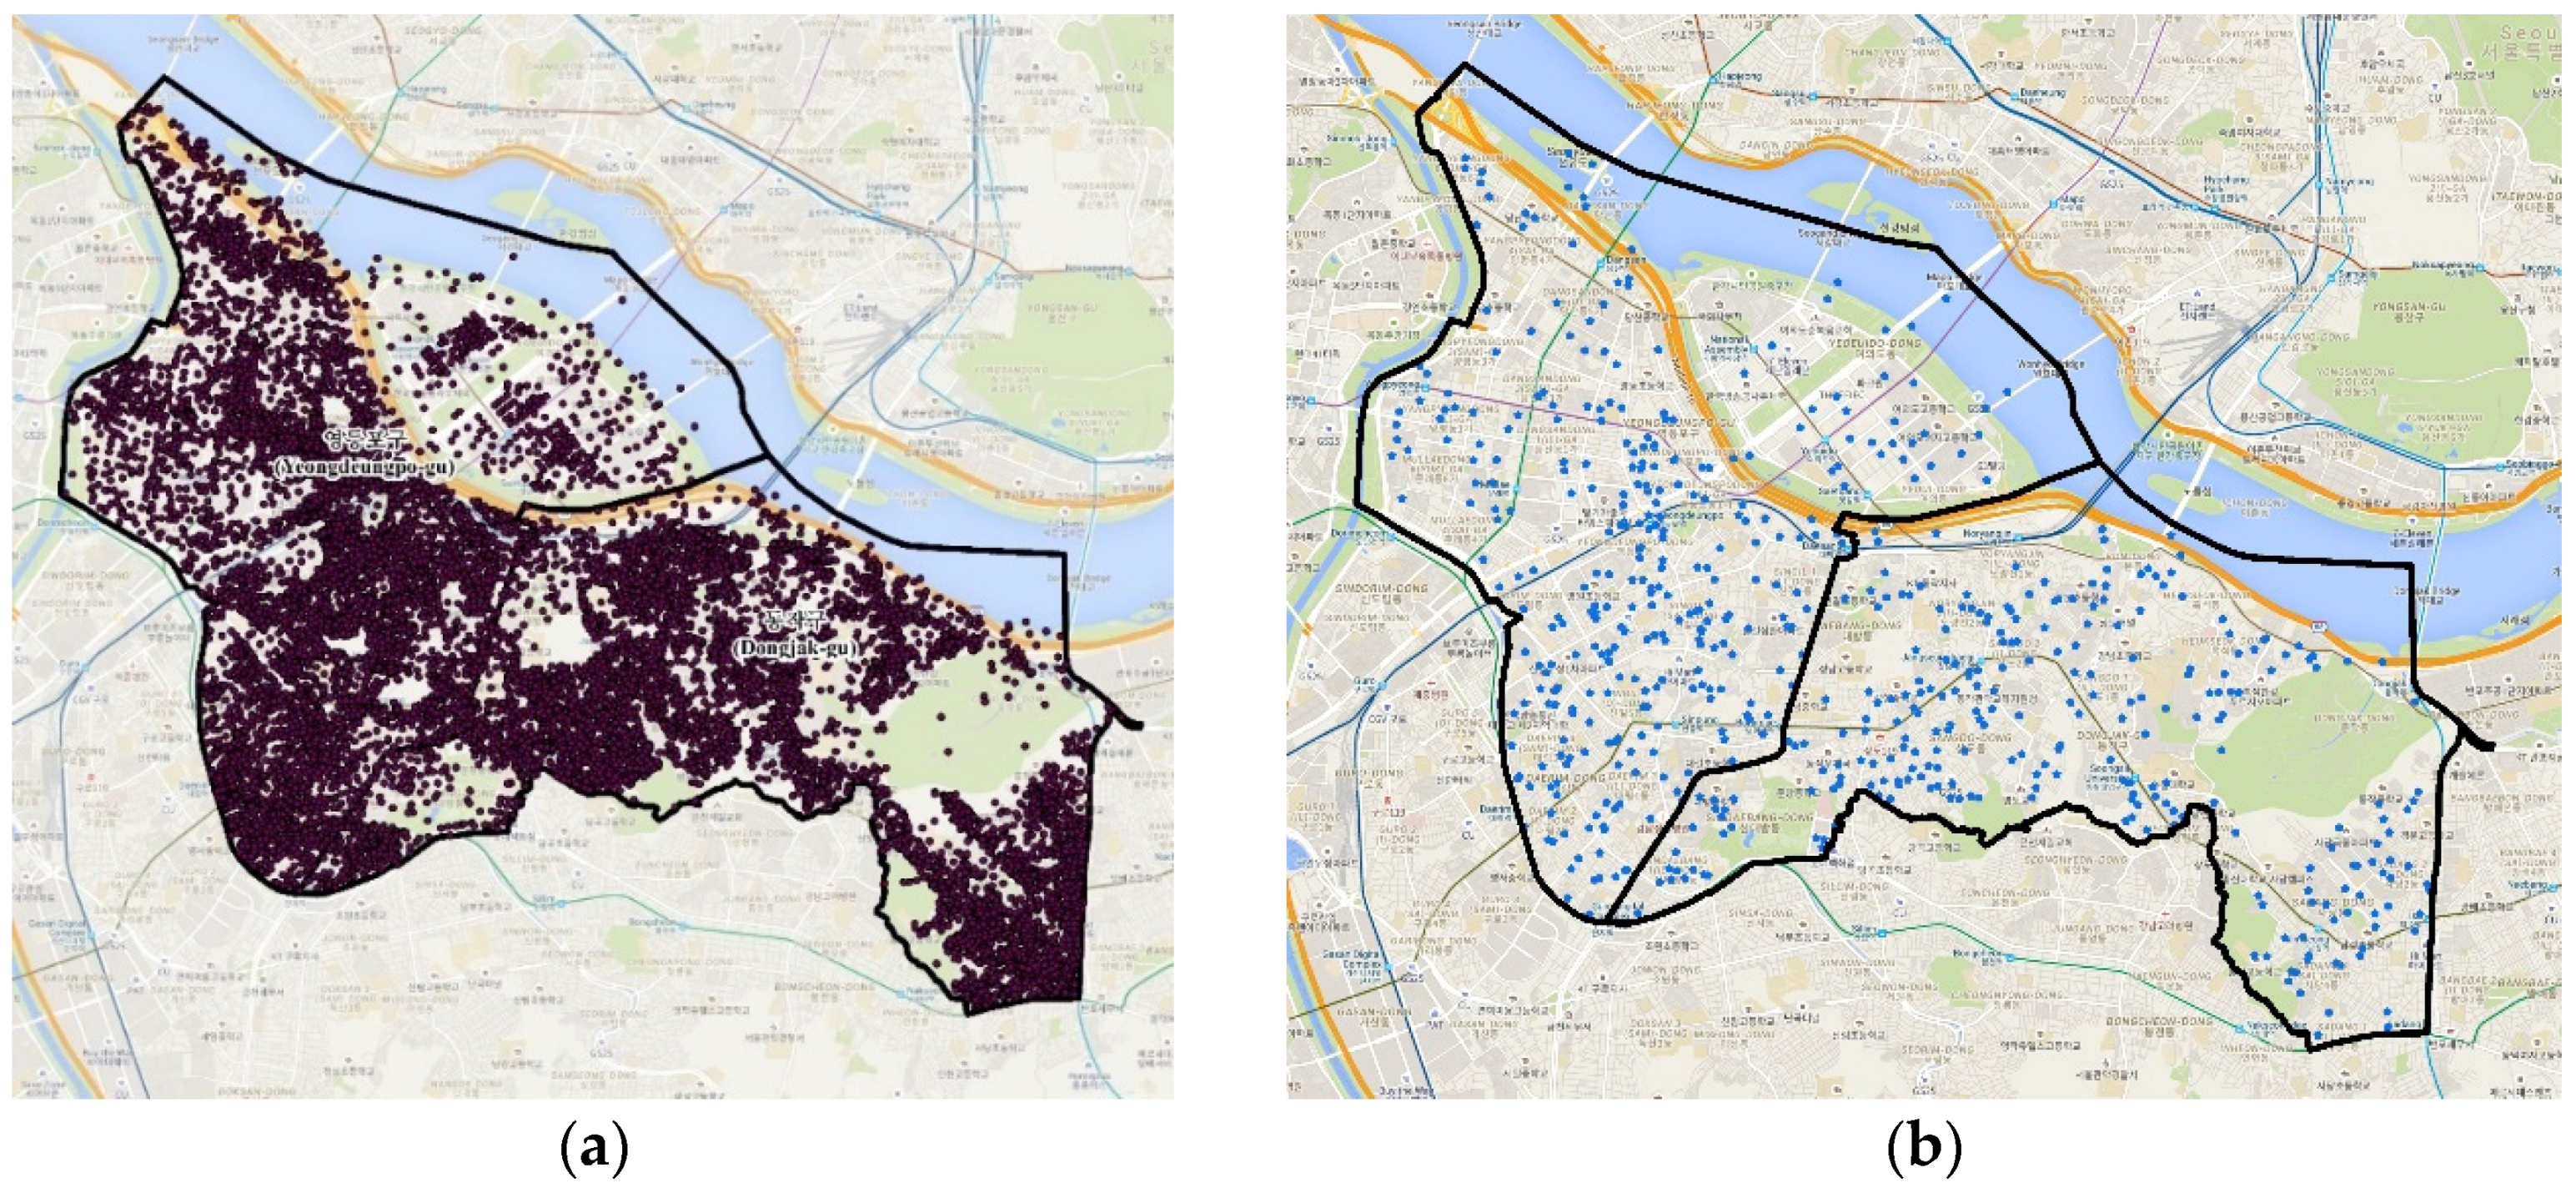
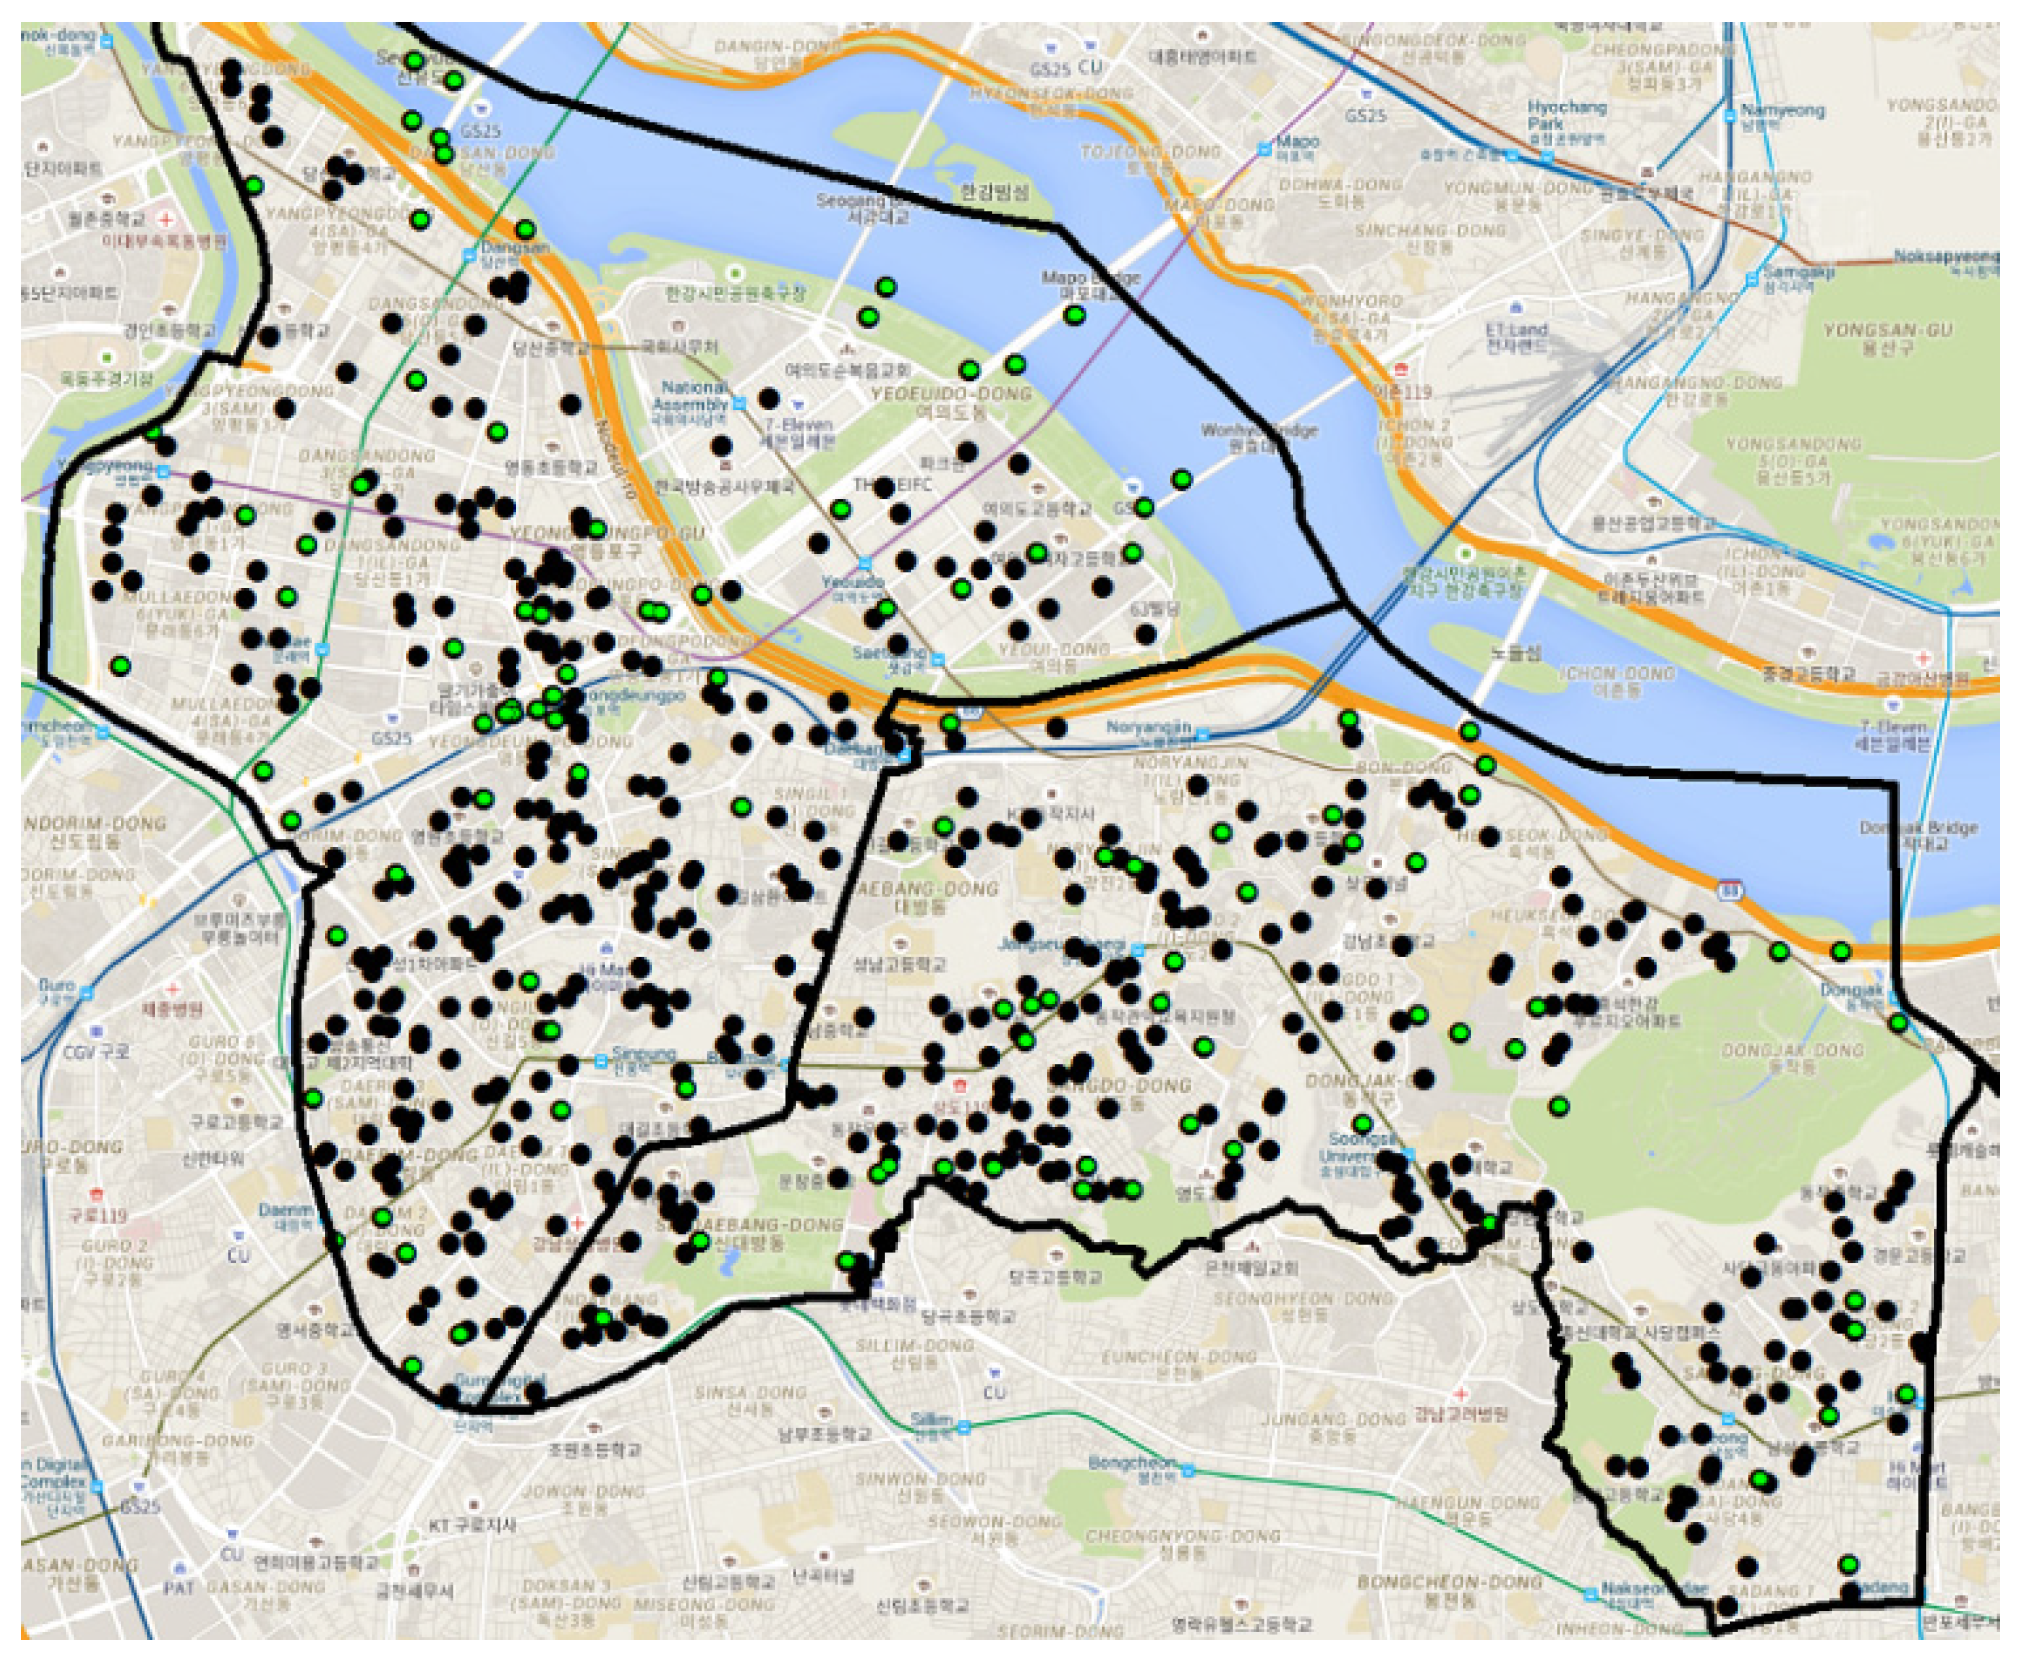
2.1. Study Area
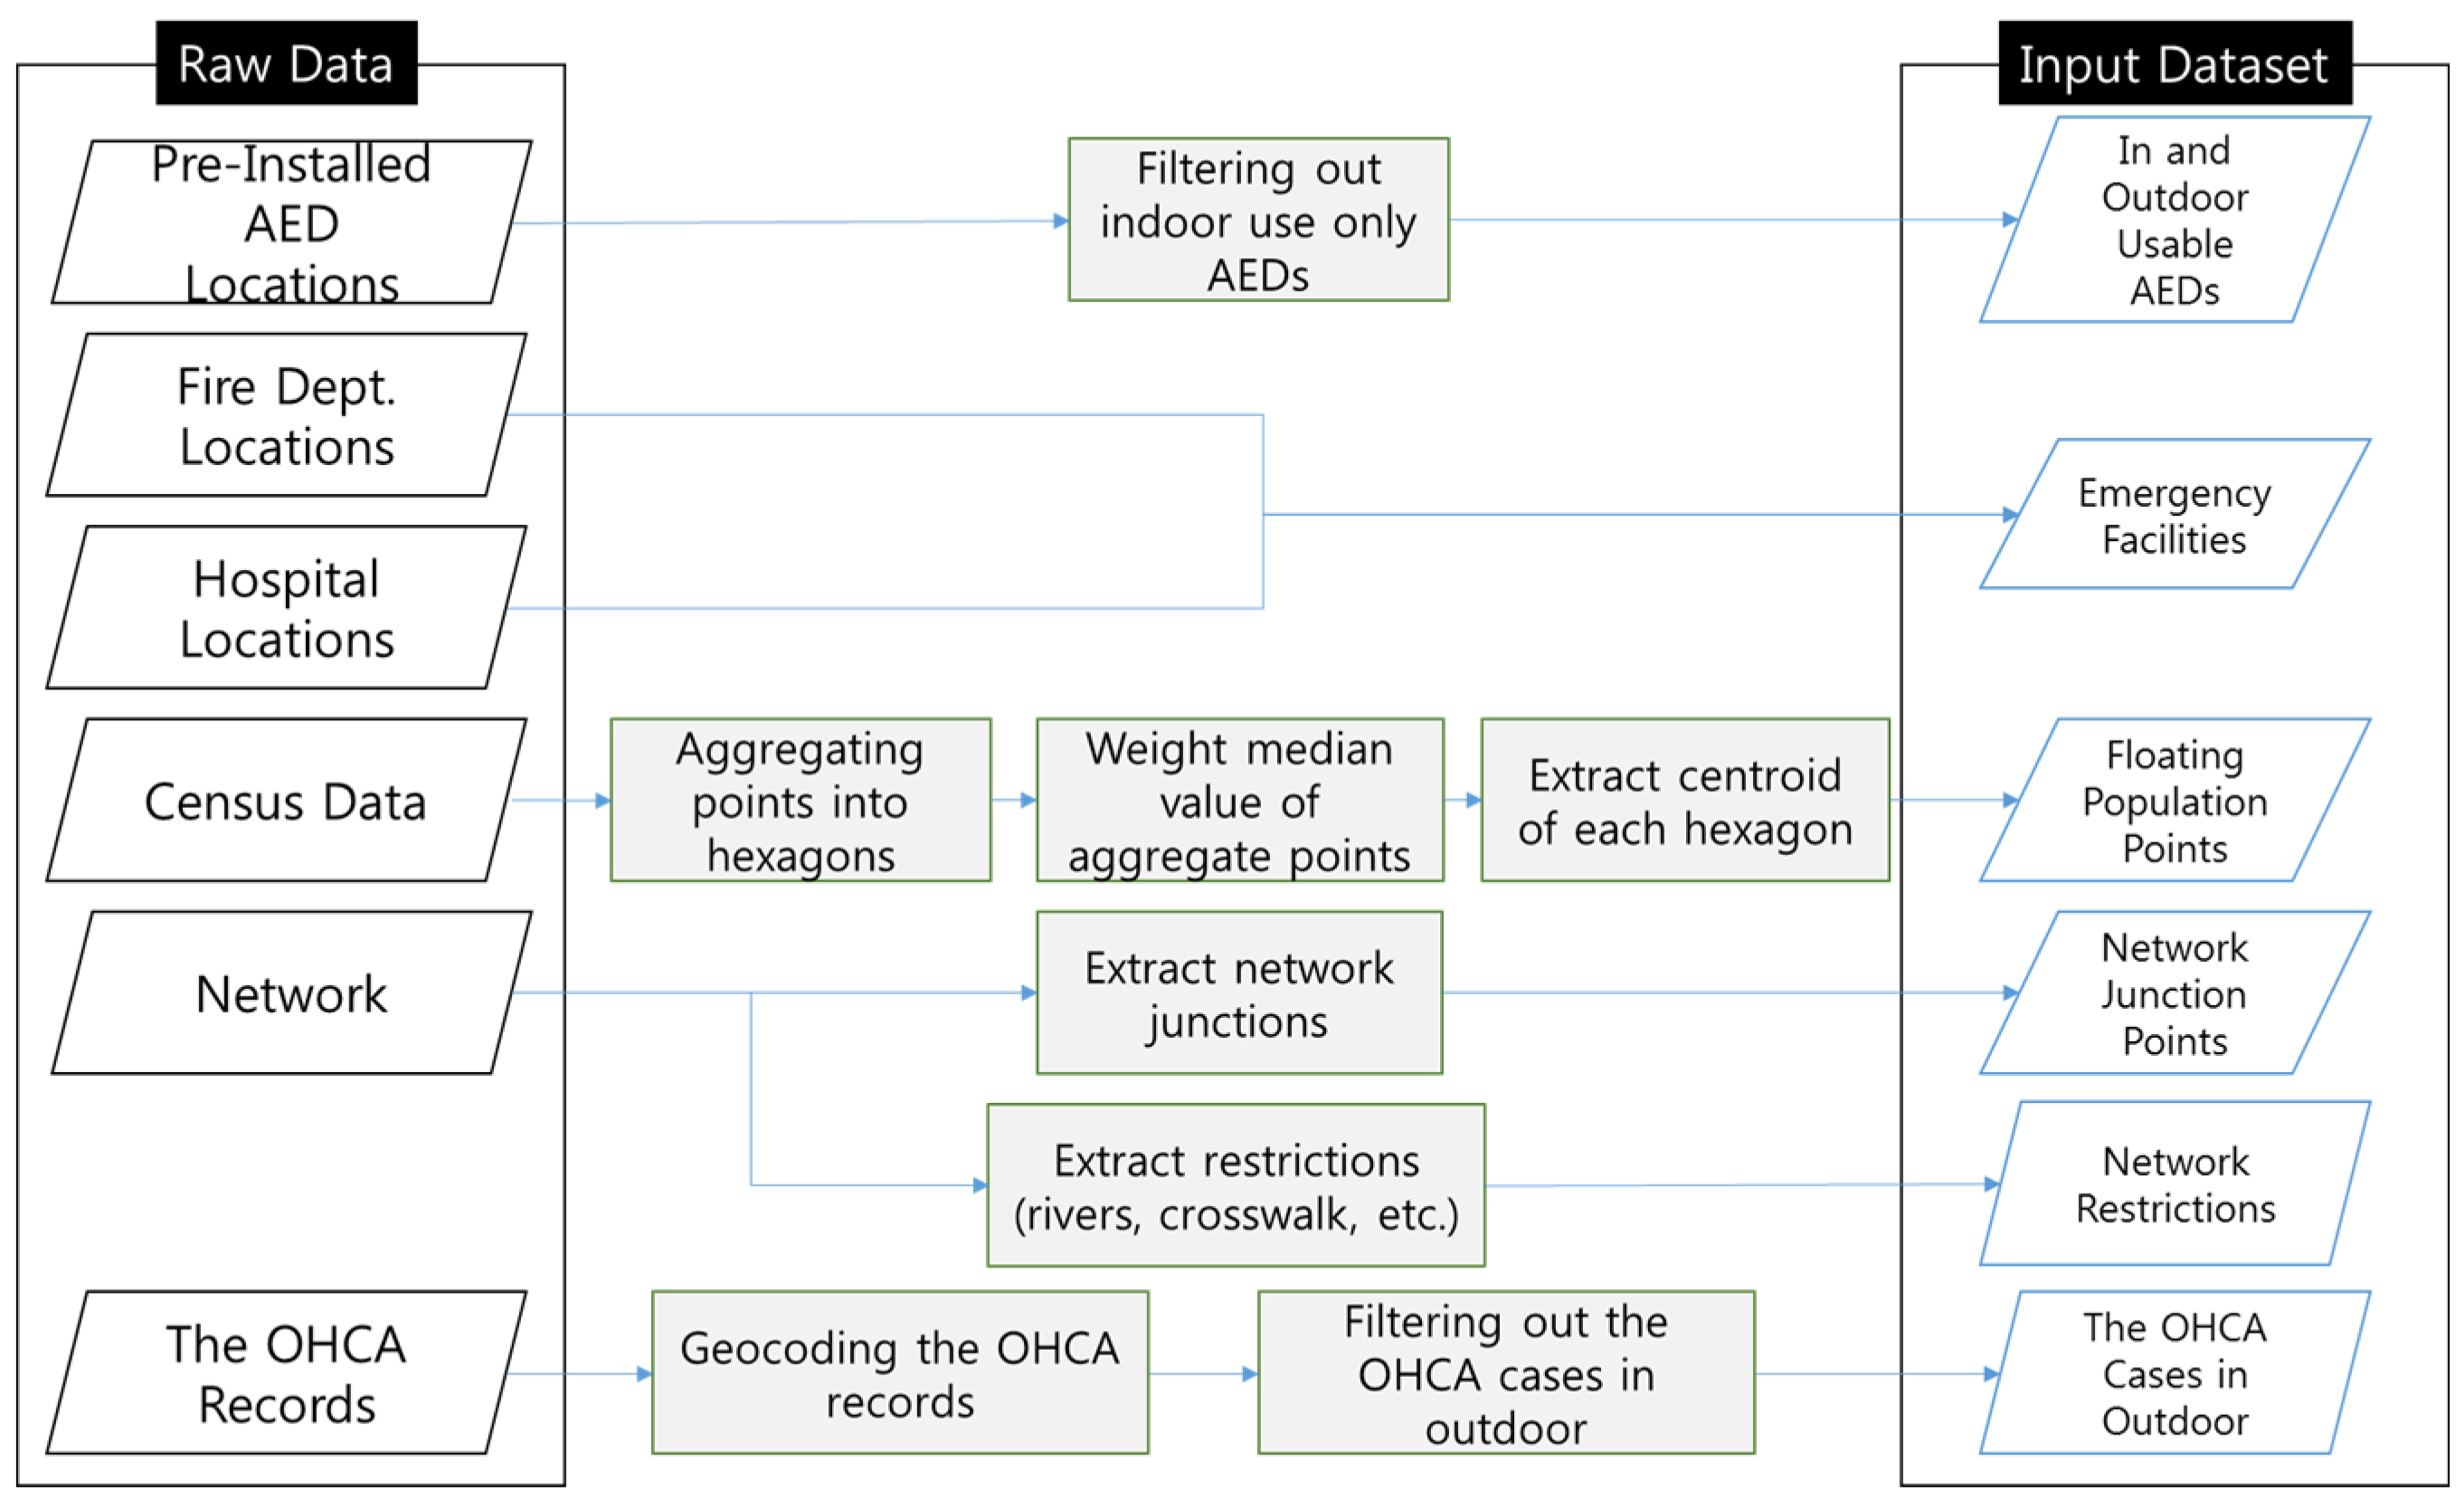
2.2. Data Process and Methods
- ·
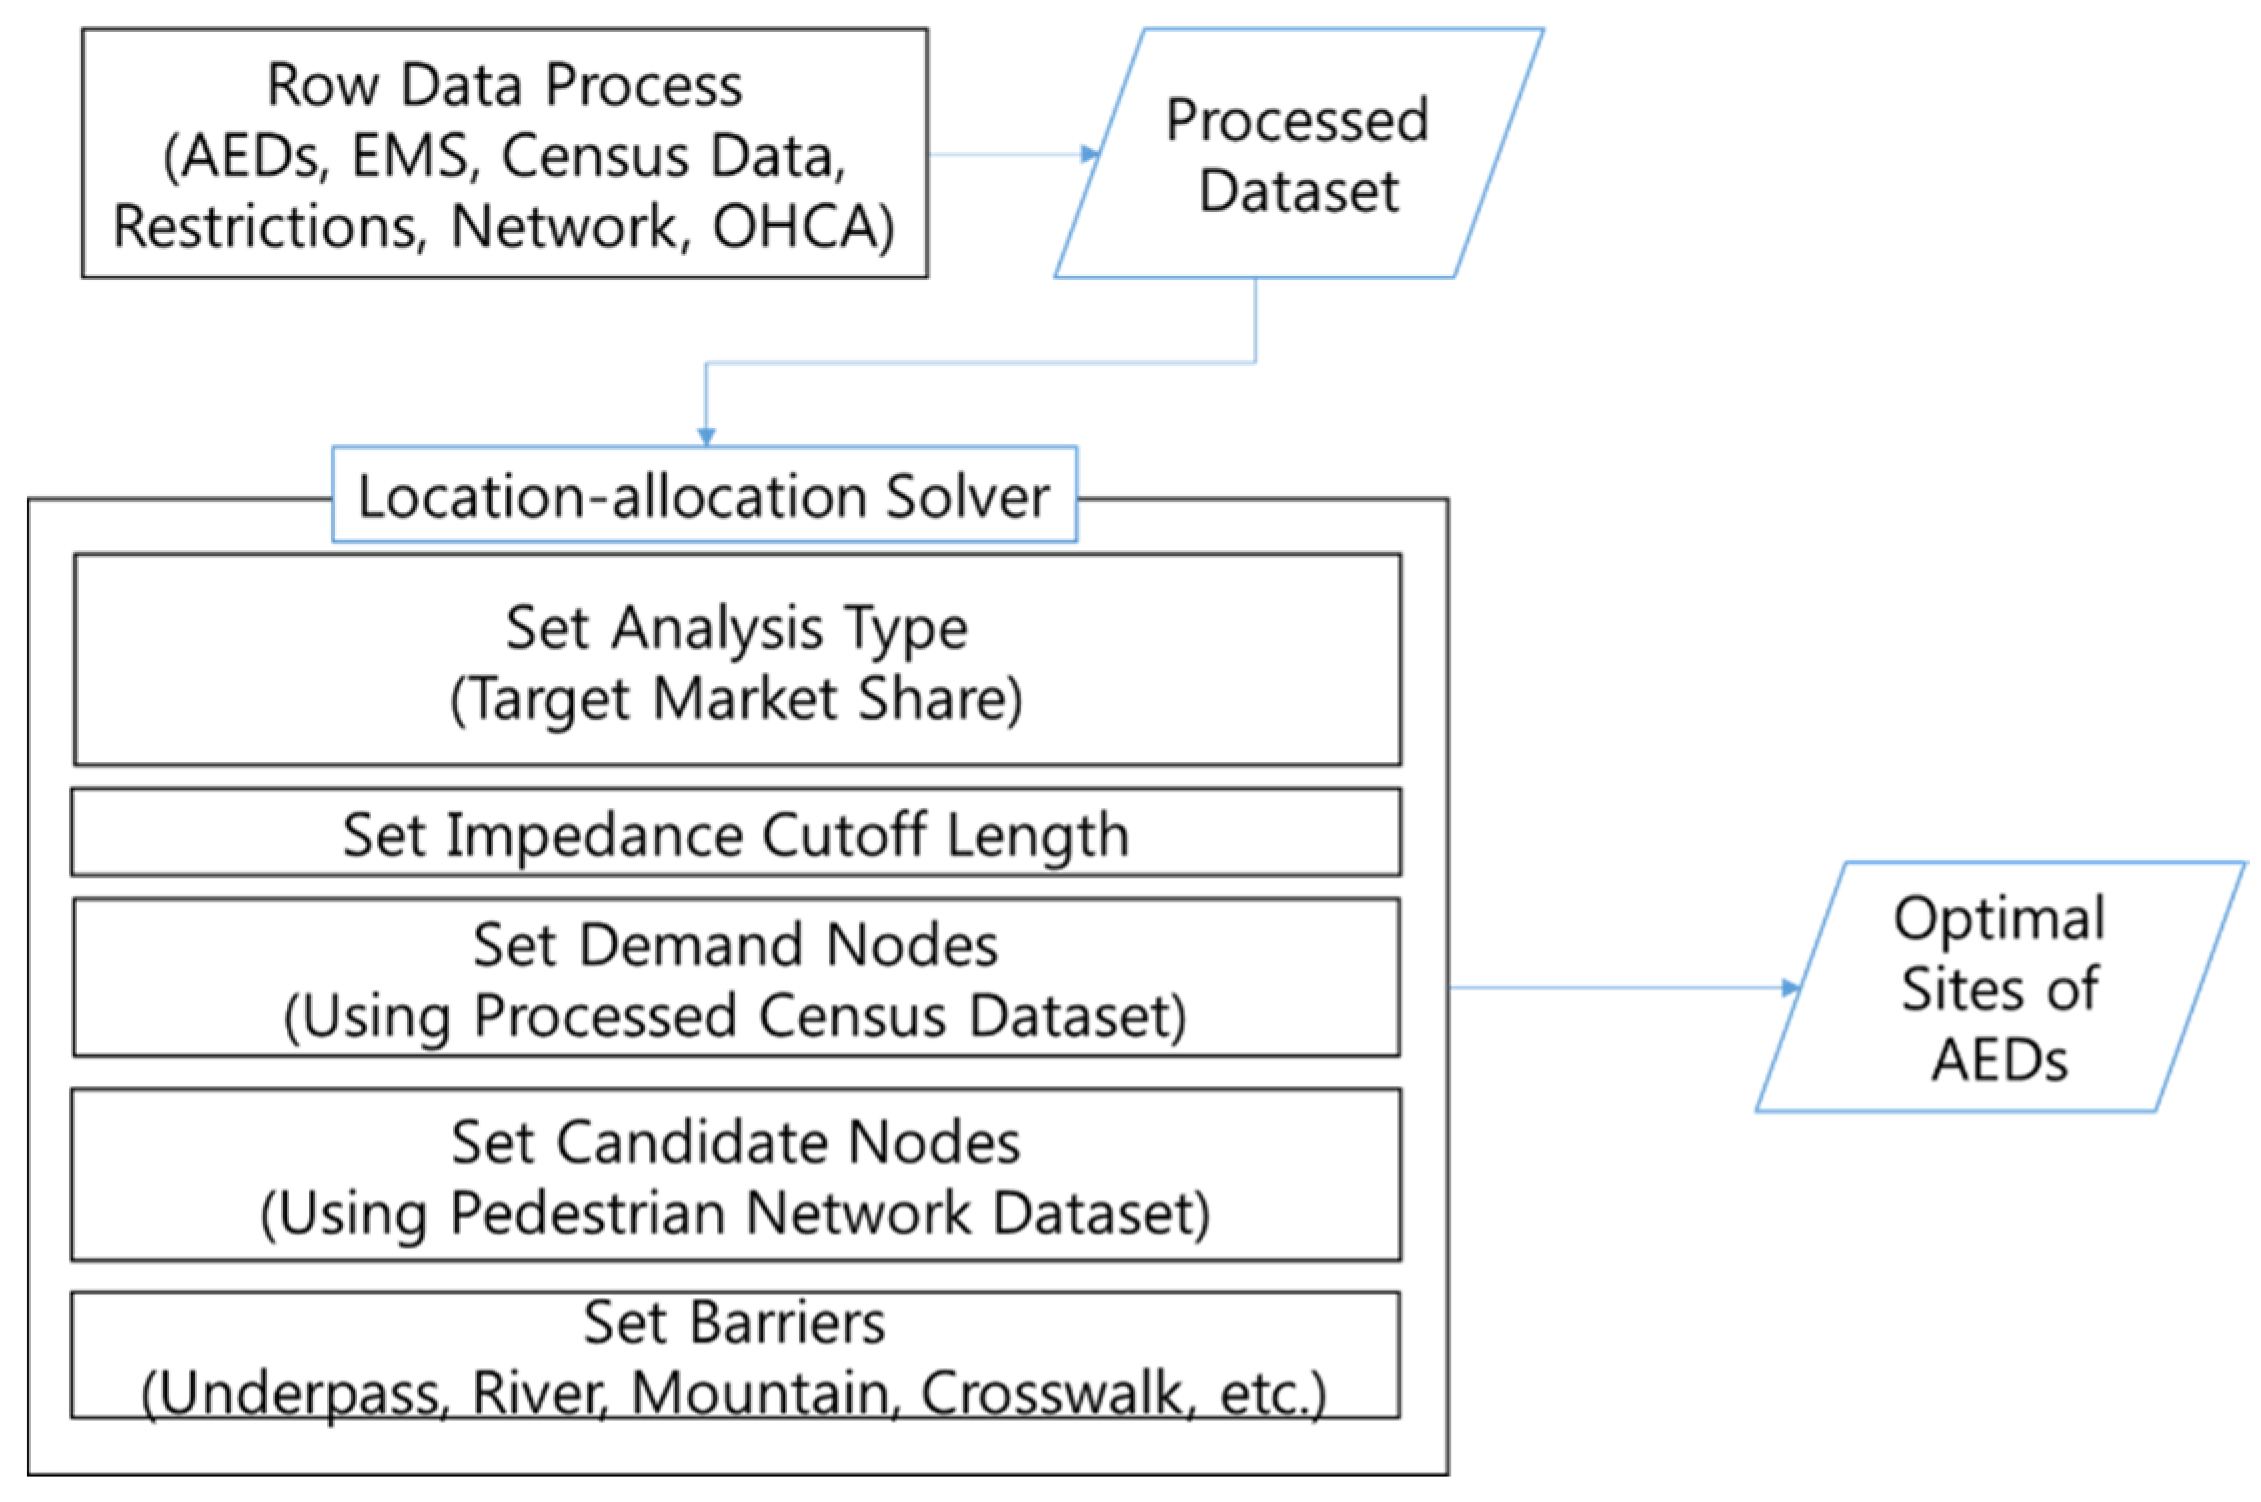
- The Network Analyst in the ArcMap platform is applied to locate the AEDs.
- ·
- The analysis type in the location-allocation solver in the Network Analyst of ArcMap is adjusted by the “target market share” method to consider the relationship between the pre-installed and additionally installed AEDs.
- ·
- The effective AED coverage (cutoff length) is calculated by considering the normal walking speed of pedestrians.
- ·
- The candidate and demand nodes are extracted based on the pedestrian network and census datasets (i.e., floating population). The details of the candidate and demand nodes are described in the next section.
- ·
- The psychological barriers under emergency situations (e.g., tunnel, crosswalk, and overpass) are determined on the road network to reflect a real-world situation.
2.2.1. Data Description and Process
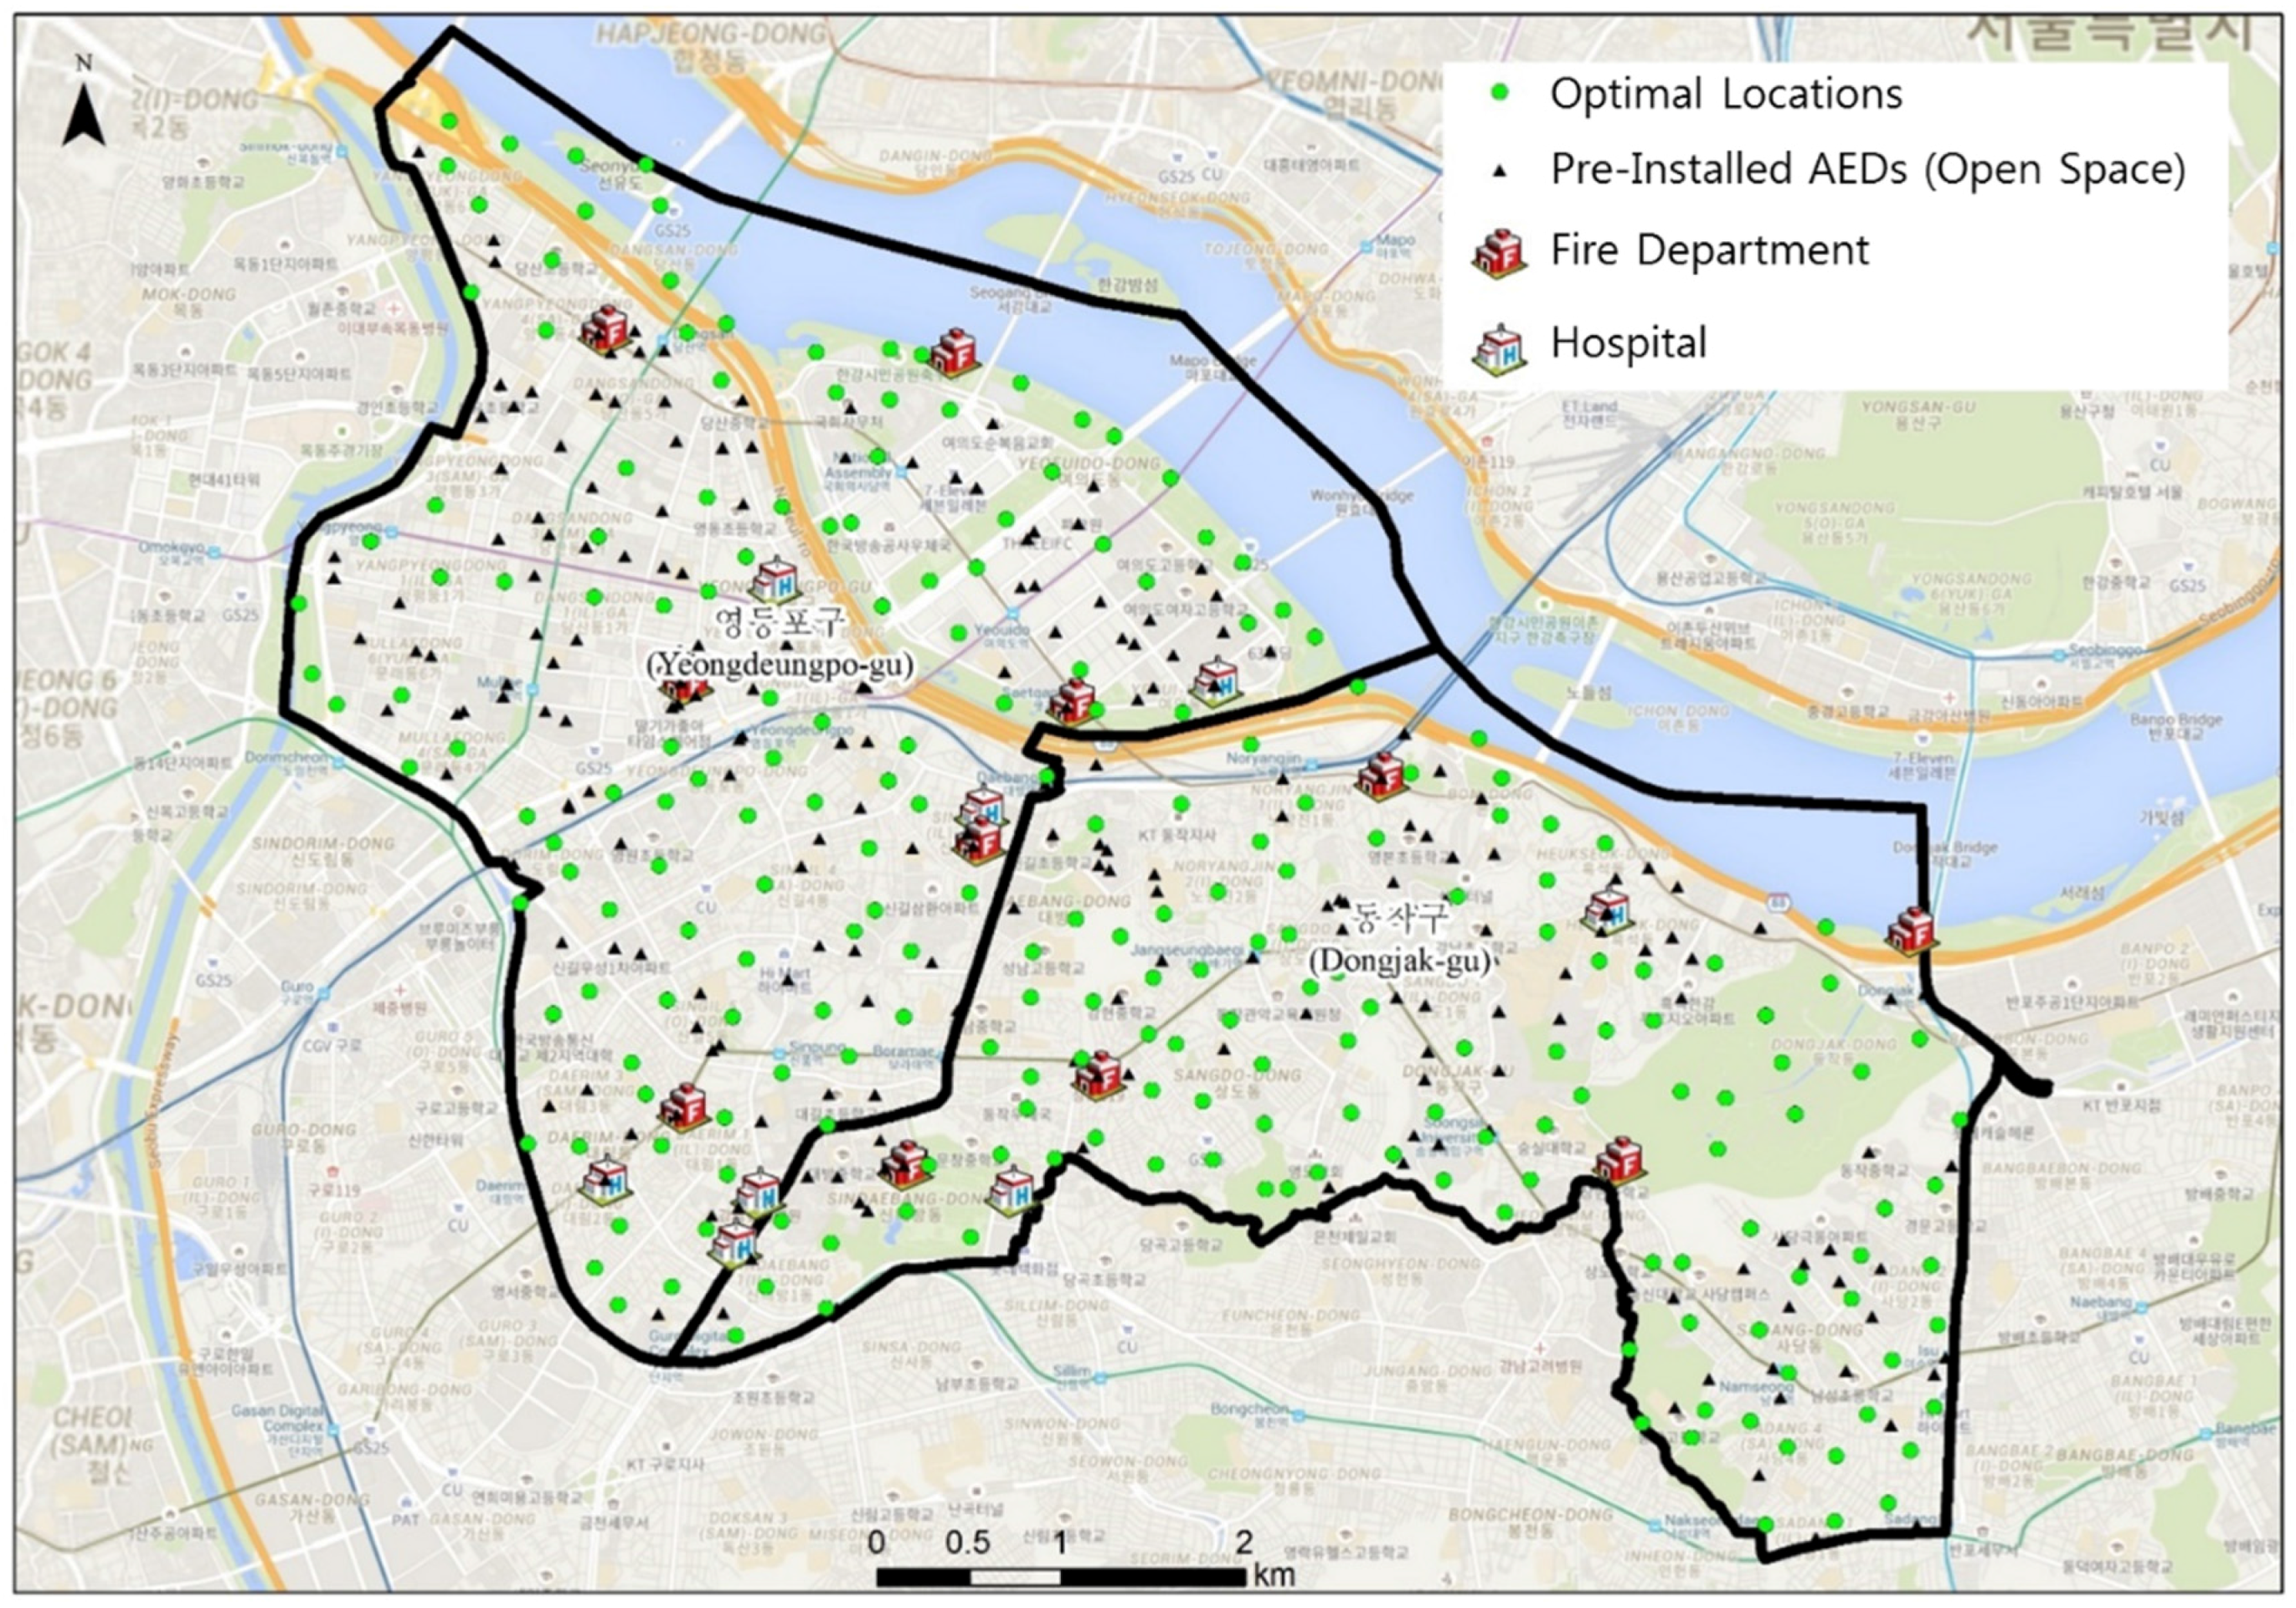
2.2.2. Finding Optimal Locations for Additional AEDs
- ·
- impedance cutoff (how far can a facility be effective)
- ·
- demand nodes (where needs must be served and contain a certain quantity of service needs)
- ·
- candidate nodes (possible locations for new facilities)
- ·
- network barriers
3. Results and Analysis
4. Conclusions
Acknowledgments
Author Contributions
Conflicts of Interest
References
- Ahn, K.O.; Do Shin, S.; Suh, G.J.; Cha, W.C.; Song, K.J.; Kim, S.J.; Lee, E.J.; Ong, M.E.H. Epidemiology and outcomes from non-traumatic out-of-hospital cardiac arrest in Korea: A nationwide observational study. Resuscitation 2010, 81, 974–981. [Google Scholar] [CrossRef] [PubMed]
- Becker, L.B.; Ostrander, M.P.; Barrett, J.; Kondos, G.T. Outcome of cpr in a large metropolitan area—Where are the survivors? Ann. Emerg. Med. 1991, 20, 355–361. [Google Scholar] [CrossRef]
- Herlitz, J.; Engdahl, J.; Svensson, L.; Ängquist, K.-A.; Young, M.; Holmberg, S. Factors associated with an increased chance of survival among patients suffering from an out-of-hospital cardiac arrest in a national perspective in Sweden. Am. Heart J. 2005, 149, 61–66. [Google Scholar] [CrossRef] [PubMed]
- Ritter, G.; Wolfe, R.A.; Goldstein, S.; Landis, J.R.; Vasu, C.M.; Acheson, A.; Leighton, R.; Medendrop, S.V. The effect of bystander CPR on survival of out-of-hospital cardiac arrest victims. Am. Heart J. 1985, 110, 932–937. [Google Scholar] [CrossRef]
- Stiell, I.G.; Wells, G.A.; DeMaio, V.J.; Spaite, D.W.; Field, B.J.; Munkley, D.P.; Lyver, M.B.; Luinstra, L.G.; Ward, R.; Group, O.S. Modifiable factors associated with improved cardiac arrest survival in a multicenter basic life support/defibrillation system: OPALS study phase I results. Ann. Emerg. Med. 1999, 33, 44–50. [Google Scholar] [CrossRef]
- Swor, R.A.; Jackson, R.E.; Cynar, M.; Sadler, E.; Basse, E.; Boji, B.; Rivera-Rivera, E.J.; Maher, A.; Grubb, W.; Jacobson, R. Bystander CPR, ventricular fibrillation, and survival in witnessed, unmonitored out-of-hospital cardiac arrest. Ann. Emerg. Med. 1995, 25, 780–784. [Google Scholar] [CrossRef]
- Valenzuela, T.D.; Roe, D.J.; Cretin, S.; Spaite, D.W.; Larsen, M.P. Estimating effectiveness of cardiac arrest interventions a logistic regression survival model. Circulation 1997, 96, 3308–3313. [Google Scholar] [CrossRef] [PubMed]
- Kim, H.S.; Uhm, D.C.; Hong, S.W. Factors influencing cardiopulmonary resuscitation performance on a stranger. J. Korean Acad. Soc. Nursi. Educ. 2010, 16, 339–346. [Google Scholar] [CrossRef]
- Ro, Y.S.; Do Shin, S.; Song, K.J.; Lee, E.J.; Kim, J.Y.; Ahn, K.O.; Chung, S.P.; Kim, Y.T.; Hong, S.O.; Choi, J.-A. A trend in epidemiology and outcomes of out-of-hospital cardiac arrest by urbanization level: A nationwide observational study from 2006 to 2010 in South Korea. Resuscitation 2013, 84, 547–557. [Google Scholar] [CrossRef] [PubMed]
- Lyon, R.; Cobbe, S.; Bradley, J.; Grubb, N. Surviving out of hospital cardiac arrest at home: A postcode lottery? Emerg. Med. J. 2004, 21, 619–624. [Google Scholar] [CrossRef] [PubMed]
- U.S. Department of Health & Human Services. What is an automated external defibrillator? Available online: https://www.nhlbi.nih.gov/health/health-topics/topics/aed (accessed on 26 November 2016).
- Gundry, J.W.; Comess, K.A.; DeRook, F.A.; Jorgenson, D.; Bardy, G.H. Comparison of naive sixth-grade children with trained professionals in the use of an automated external defibrillator. Circulation 1999, 100, 1703–1707. [Google Scholar] [CrossRef] [PubMed]
- Jorgenson, D.B.; Skarr, T.; Russell, J.K.; Snyder, D.E.; Uhrbrock, K. Aed use in businesses, public facilities and homes by minimally trained first responders. Resuscitation 2003, 59, 225–233. [Google Scholar] [CrossRef]
- Hoke, R.S.; Chamberlain, D. Skeletal chest injuries secondary to cardiopulmonary resuscitation. Resuscitation 2004, 63, 327–338. [Google Scholar] [CrossRef] [PubMed]
- Jin, S.-M. The public perception and importance of public education and information about automated external defibrillator (AED). Master’s Thesis, Kyungpook National University, Daegu, Korea, 2013. [Google Scholar]
- Folke, F.; Gislason, G.H.; Lippert, F.K.; Nielsen, S.L.; Weeke, P.; Hansen, M.L.; Fosbøl, E.L.; Andersen, S.S.; Rasmussen, S.; Schramm, T.K. Differences between out-of-hospital cardiac arrest in residential and public locations and implications for public-access defibrillation. Circulation 2010, 122, 623–630. [Google Scholar] [CrossRef] [PubMed]
- Ong, M.E.H.; Tan, E.H.; Yan, X.; Anushia, P.; Lim, S.H.; Leong, B.S.-H.; Ong, V.Y.K.; Tiah, L.; Yap, S.; Overton, J. An observational study describing the geographic-time distribution of cardiac arrests in Singapore: What is the utility of geographic information systems for planning public access defibrillation? (PADS Phase I). Resuscitation 2008, 76, 388–396. [Google Scholar] [CrossRef] [PubMed]
- Mitamura, H. Public access defibrillation: Advances from Japan. Nat. Clin. Pract. Cardiovasc. Med. 2008, 5, 690–692. [Google Scholar] [CrossRef] [PubMed]
- Sakai, T.; Iwami, T.; Kitamura, T.; Nishiyama, C.; Kawamura, T.; Kajino, K.; Tanaka, H.; Marukawa, S.; Tasaki, O.; Shiozaki, T. Effectiveness of the new ‘mobile AED map’to find and retrieve an AED: A randomised controlled trial. Resuscitation 2011, 82, 69–73. [Google Scholar] [CrossRef] [PubMed]
- Merchant, R.M.; Asch, D.A. Can you find an automated external defibrillator if a life depends on it? Circ. Cardiovasc. Qual. Outcomes 2012, 5, 241–243. [Google Scholar] [CrossRef] [PubMed]
- Imai, K.; Fujii, A.; Nabeshima, K. AED location in public spaces: A case study in ueno park using voronoi diagrams with obstacles. J. Asian Archit. Build. Eng. 2008, 7, 271–278. [Google Scholar] [CrossRef]
- Tzeng, G.H.; Chen, Y.W. The optimal location of airport fire stations: A fuzzy multi-objective programming and revised genetic algorithm approach. Transp. Plan. Tech. 1999, 23, 37–55. [Google Scholar] [CrossRef]
- Liu, N.; Huang, B.; Chandramouli, M. Optimal siting of fire stations using GIS and ANT algorithm. J. Comput. Civ. Eng. 2006, 20, 361–369. [Google Scholar] [CrossRef]
- Lee, G.; Murray, A.T. Maximal covering with network survivability requirements in wireless mesh networks. Comput. Environ. Urban Syst. 2010, 34, 49–57. [Google Scholar] [CrossRef]
- Korea Statistics. Data Request. Available online: http://sgis.kostat.go.kr/contents/shortcut/shortcut_05.jsp (accessed on 29 June 2016).
- Chrisinger, B.W.; Grossestreuer, A.V.; Laguna, M.C.; Griffis, H.M.; Branas, C.C.; Wiebe, D.J.; Merchant, R.M. Characteristics of automated external defibrillator coverage in Philadelphia, PA, based on land use and estimated risk. Resuscitation 2016, 109, 9–15. [Google Scholar] [CrossRef] [PubMed]
- Leung, A.C.; Asch, D.A.; Lozada, K.N.; Saynisch, O.B.; Asch, J.M.; Becker, N.; Griffis, H.M.; Shofer, F.; Hershey, J.C.; Hill, S. Where are lifesaving automated external defibrillators located and how hard is it to find them in a large urban city? Resuscitation 2013, 84, 910–914. [Google Scholar] [CrossRef] [PubMed]
- SK Telecom. SK Telecom Geovision Data. Available online: http://datablog.geovision.co.kr/index.php/data/ (accessed on 15 November 2016).
- Kim, J.; Huh, Y.; Kim, J.O.; Lee, J.B. Proposal for the generation of network data for pedestrians in South Korea using large-scale maps. KSCE J. Civ. Eng. 2015, 19, 1483–1491. [Google Scholar] [CrossRef]
- Oh, K.; Jeong, S. Assessing the spatial distribution of urban parks using GIS. Landsc. Urban Plan. 2007, 82, 25–32. [Google Scholar] [CrossRef]
- Korea Transport Database. Data Download. Available online: https://www.ktdb.go.kr/www/index.do (accessed on 12 July 2016).
- Alshwesh, I.; Comber, A.; Brunsdon, C. A Comparison of GIS-Based Location Allocation Heuristics: Minimise Impedance vs Grouping Genetic Algorithm p-median; GIS Research UK: Liverpool, UK, 2013. [Google Scholar]
- Esri. Algorithms Used by the ArcGIS Network Analyst Extension. Available online: http://resources.arcgis.com/en/help/main/10.2/index.html#/Algorithms_used_by_the_ArcGIS_Network_Analyst_extension/004700000053000000/ (accessed on 18 November 2016).
- Alp, O.; Erkut, E.; Drezner, Z. An efficient genetic algorithm for the p-median problem. Ann. Oper. Res. 2003, 122, 21–42. [Google Scholar] [CrossRef]
- Esri. Location-Allocation Analysis. Available online: http://desktop.arcgis.com/en/arcmap/latest/extensions/network-analyst/location-allocation.htm (accessed on 13 July 2016).
- Im, W.-S.; Choe, H.-S.; Jeong, M.-G.; Ryu, T.-B.; Choe, H.-U. A comparison of gait characteristics between korean and western young people. J. Ergon. Soc. Korea 2006, 25, 33–42. [Google Scholar]
- Jude, J.R.; Kouwenhoven, W.B.; Knickerbocker, G.G. Cardiac arrest: Report of application of external cardiac massage on 118 patients. Jama 1961, 178, 1063–1070. [Google Scholar] [CrossRef] [PubMed]
- Eckstein, M.; Stratton, S.J.; Chan, L.S. Cardiac arrest resuscitation evaluation in Los Angeles: Care-la. Ann. Emerg. Med. 2005, 45, 504–509. [Google Scholar] [CrossRef] [PubMed]


| No. | OHCA Cases | Evaluation Methods | Testing Groups |
|---|---|---|---|
| 1 | For all | Coverage of the OHCA cases from the existing and additionally installed AEDs | Control group 1 |
| 2 | Coverage of the OHCA cases from the “filtered” existing AEDs only | Experimental group 1-1 | |
| 3 | Coverage of the OHCA cases from the existing and randomly located AEDs distributed in the entire study area | Experimental group 1-2 | |
| 4 | Coverage of the OHCA cases from the existing and randomly installed AEDs distributed on the road segments | Experimental group 1-3 | |
| 5 | Coverage of the OHCA cases from the existing and randomly located AEDs on the grid base | Experimental group 1-4 | |
| 6 | Coverage of the OHCA cases from the pre-existing and randomly located AEDs on the network junctions | Experimental group 1-6 | |
| 7 | Coverage of the OHCA cases from the pre-installed AEDs (assuming that all pre-installed AEDs are usable) | Experimental group 1-5 | |
| 1’ | Outdoor | Coverage of the outdoor OHCA cases from the existing and additionally installed AEDs | Control group 2 |
| 2’ | Coverage of the outdoor OHCA cases from the “filtered” existing AEDs only | Experimental group 2-1 | |
| 3’ | Coverage of the outdoor OHCA cases from the existing and randomly located AEDs distributed in the entire study area | Experimental group 2-2 | |
| 4’ | Coverage of the OHCA cases from the existing and randomly located AEDs distributed on the road segments | Experimental group 2-3 | |
| 5’ | Coverage of the OHCA cases from the existing and randomly located AEDs on the grid base | Experimental group 2-4 | |
| 6’ | Coverage of the OHCA cases from the pre-existing and randomly located AEDs on the network junctions | Experimental group 2-6 | |
| 7’ | Coverage of the OHCA cases from the pre-installed AEDs (assuming that all pre-installed AEDs are usable) | Experimental group 2-5 |
| No. | OHCA Cases | Evaluation Methods | Testing Group | Ratio | Percentage (%) |
|---|---|---|---|---|---|
| 1 | For all | Coverage of the OHCA cases from the pre-existing and additionally installed AEDs | Control group 1 | 516/634 | 81.39 |
| 2 | Coverage of the OHCA cases from the “filtered” pre-existing AEDs only | Experimental group 1-1 | 221/634 | 34.86 | |
| 3 | Coverage of the OHCA cases from the pre-existing and randomly located AEDs | Experimental group 1-2 | 451.83/634 | 71.27 | |
| 4 | Coverage of the OHCA cases from the pre-existing and randomly located AEDs on the road segments only | Experimental group 1-3 | 380.89/634 | 60.08 | |
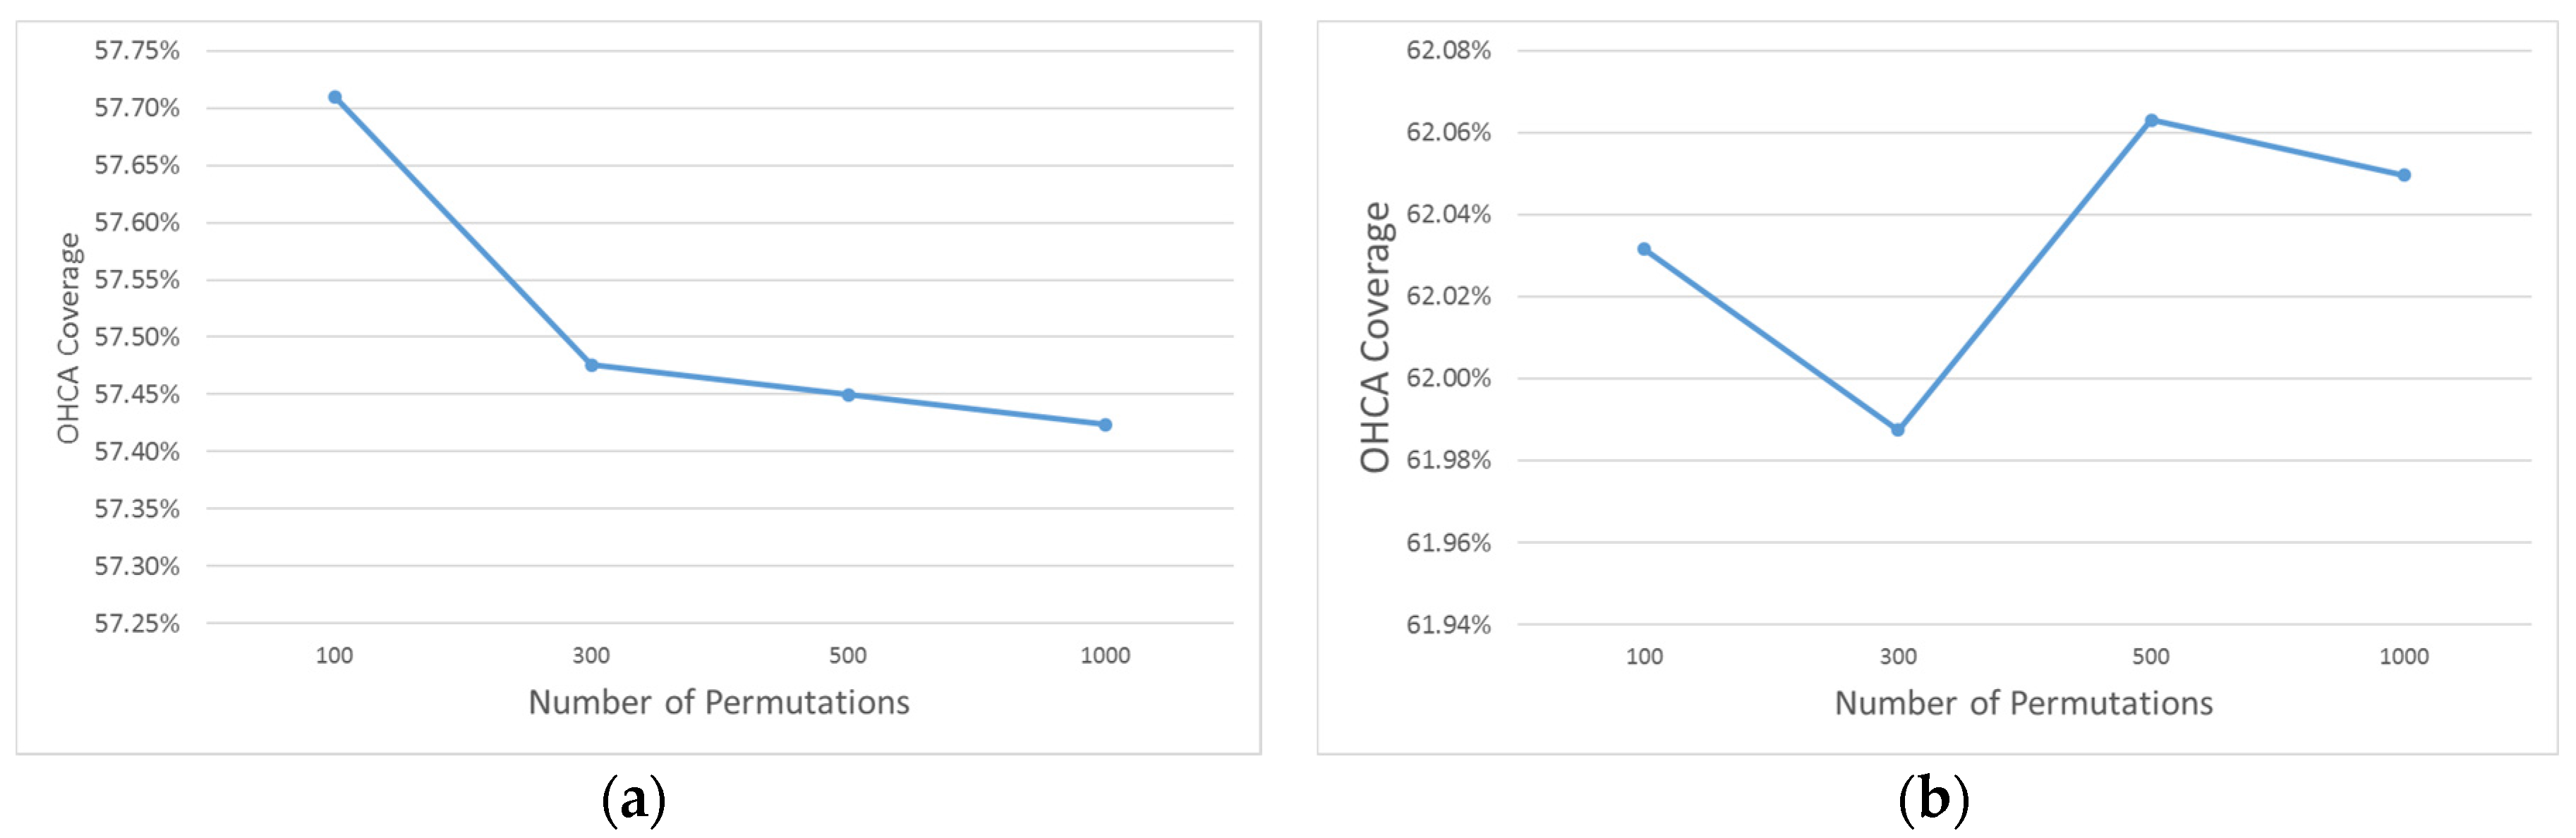
| 5 | Coverage of the OHCA cases from the existing and randomly located AEDs on the grid base | Experimental group 1-4 | 364.07/634 | 57.42 | |
| 6 | Coverage of the OHCA cases from the pre-existing and randomly located AEDs on the network junctions | Experimental group 1-6 | 393.39/634 | 62.05 | |
| 7 | Coverage of the OHCA cases from the pre-installed AEDs (assuming that all pre-installed AEDs are usable) | Experimental group 1-5 | 347/634 | 54.73 |
| No. | OHCA Cases | Evaluation Methods | Testing Group | Ratio | Percentage (%) |
|---|---|---|---|---|---|
| 1’ | Outdoor | Coverage of the OHCA cases from the pre-existing and additionally installed AEDs | Control group 2 | 92/126 | 73.02 |
| 2’ | Coverage of the OHCA cases from the “filtered” pre-existing AEDs only | Experimental group 2-1 | 36/126 | 28.57 | |
| 3’ | Coverage of the OHCA cases from the pre-existing and randomly located AEDs | Experimental group 2-2 | 80.9/126 | 64.21 | |
| 4’ | Coverage of the OHCA cases from the pre-existing and randomly located AEDs on the road segments only | Experimental group 2-3 | 66.59/126 | 52.06 | |
| 5’ | Coverage of the OHCA cases from the existing and randomly located AEDs on the grid base | Experimental group 2-4 | 61.46/126 | 48.78 | |
| 6’ | Coverage of the OHCA cases from the pre-existing and randomly located AEDs on the network junctions | Experimental group 2-6 | 60.76/126 | 48.22 | |
| 7’ | Coverage of the OHCA cases from the pre-installed AEDs (assuming that all pre-installed AEDs are usable) | Experimental group 2-5 | 51/126 | 40.48 |
© 2017 by the authors. Licensee MDPI, Basel, Switzerland. This article is an open access article distributed under the terms and conditions of the Creative Commons Attribution (CC BY) license ( http://creativecommons.org/licenses/by/4.0/).
Share and Cite
Kwon, P.; Kim, M.-J.; Lee, Y.; Yu, K.; Huh, Y. Locating Automated External Defibrillators in a Complicated Urban Environment Considering a Pedestrian-Accessible Network that Focuses on Out-of-Hospital Cardiac Arrests. ISPRS Int. J. Geo-Inf. 2017, 6, 39. https://0-doi-org.brum.beds.ac.uk/10.3390/ijgi6020039
Kwon P, Kim M-J, Lee Y, Yu K, Huh Y. Locating Automated External Defibrillators in a Complicated Urban Environment Considering a Pedestrian-Accessible Network that Focuses on Out-of-Hospital Cardiac Arrests. ISPRS International Journal of Geo-Information. 2017; 6(2):39. https://0-doi-org.brum.beds.ac.uk/10.3390/ijgi6020039
Chicago/Turabian StyleKwon, Pil, Min-Jun Kim, Youngmin Lee, Kiyun Yu, and Yong Huh. 2017. "Locating Automated External Defibrillators in a Complicated Urban Environment Considering a Pedestrian-Accessible Network that Focuses on Out-of-Hospital Cardiac Arrests" ISPRS International Journal of Geo-Information 6, no. 2: 39. https://0-doi-org.brum.beds.ac.uk/10.3390/ijgi6020039