Article

An Original Application of Image Recognition Based Location in Complex Indoor Environments

1
Department of Architecture and Design (DAD), Politecnico di Torino, 10129 Torino, Italy
2
Department of Environment, Land and Infrastructure Engineering (DIATI), Politecnico di Torino, 10129 Torino, Italy
3
Electronic and Telecommunications Research Institute (ETRI), Daejeon 34129, Korea
*
Author to whom correspondence should be addressed.
ISPRS Int. J. Geo-Inf. 2017, 6(2), 56; https://0-doi-org.brum.beds.ac.uk/10.3390/ijgi6020056
Submission received: 14 December 2016 / Revised: 14 February 2017 / Accepted: 16 February 2017 / Published: 21 February 2017

Abstract

:
This paper describes the first results of an image recognition based location (IRBL) for a mobile application focusing on the procedure to generate a database of range images (RGB-D). In an indoor environment, to estimate the camera position and orientation, a prior spatial knowledge of the surroundings is needed. To achieve this objective, a complete 3D survey of two different environments (Bangbae metro station of Seoul and the Electronic and Telecommunications Research Institute (ETRI) building in Daejeon, Republic of Korea) was performed using a LiDAR (Light Detection and Ranging) instrument, and the obtained scans were processed to obtain a spatial model of the environments. From this, two databases of reference images were generated using specific software realised by the Geomatics group of Politecnico di Torino (ScanToRGBDImage). This tool allows us to generate synthetically different RGB-D images centred in each scan position in the environment. Later, the external parameters (X, Y, Z, ω, ϕ , and κ) and the range information extracted from the retrieved database images are used as reference information for pose estimation of a set of acquired mobile pictures in the IRBL procedure. In this paper, the survey operations, the approach for generating the RGB-D images, and the IRB strategy are reported. Finally, the analysis of the results and the validation test are described.

Graphical Abstract

1. Introduction

In recent years, location-based services (LBSs) that use data acquired from mobile devices sensors to provide position, navigation, tracking, and awareness of moving objects and people [1,2,3], have become increasingly important factors in several research studies conducted by the scientific community and from industry as well. The growing spread and computational power of mobile phones, with the increase in device connectivity has allowed the development of new Internet of things (IoT) applications in many interesting fields, such as medical care [4], ambient assisted living [5], environmental monitoring [6], transportation [7], marketing [8], etc. All these services require accurate positioning to locate people, goods, vehicles, animals and assets. The global navigation satellite system (GNSS) positioning provides good accuracy only in open areas, but when this functionality is transposed in an indoor space or in an urban canyon, the GNSS signal is lost and it is necessary to overcome this issue with the integration of different techniques and sensors. In recent years, some LBSs have been proposed using integration of different technologies and methods of measurements [1]. Cameras [9,10,11], infrared (Kinect), ultrasound [12], WLAN/WiFi [13], RFID [14], mobile communication [15] and so forth are examples of the technologies that the scientific community has put at the service of indoor locations. All these positioning systems have pros and cons that make them more useful in specific scenarios, compared to other options. All the technologies using radio frequencies as a physical quantity to define the location have some common issues linked with the necessity of the line of sight (LOS), signal noise corruption, and problems of propagation and multipath. Moreover, the cost of these positioning systems could be very expensive due to the necessary infrastructure. The LBSs based on the camera sensor have strong advantages and do not need to install any network of chipsets in the environment. All the primary sensors are already installed in the user device. In this case, the system could be considered low cost. Moreover, the positioning accuracy with these systems is usually more accurate in comparison to other systems. Furthermore, most of these systems cannot determinate the orientation of the user, with important limitations to support many useful applications like augmented reality.
This scenario illustrates our interest in indoor positioning systems, exploited as unique sensors, such as those found in everyday smartphones, and our attention is focused on densely lived environments that could have critical issues.
This paper is connected to a project conducted by the Politecnico di Torino (Italy) and the Electronic and Telecommunications Research Institute (ETRI, Republic of Korea) with the aim of realising an image-recognition based location (IRBL) procedure useful for estimating the position and orientation of an image taken by a mobile device through the extraction of 3D information from a reference image. It aims to estimate the user location through the smartphone that acquire an image of the environment and query a database in a server where images with 3D information are stored. The database images are synthetic RGB-D images extracted by an accurate 3D model of the environment. The 3D model could come from a light detection and ranging (LiDAR) acquisition, from a 3D CityGML model, from a structure from motion reconstruction, from a time of flight (ToF) camera, or other devices or techniques. This approach can be a component of a hybrid navigation solution with inertial measurements unit (IMU) data [16,17,18].
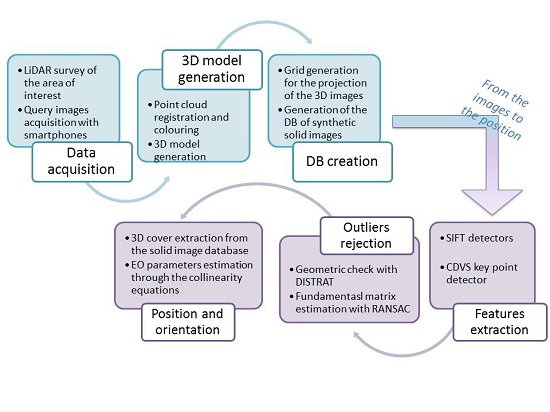
The project is still in progress and at now has seen the validation of the first results obtained in two test sites: the Bangbae metro station in Seoul and the ETRI research building in Daejeon. The basis of the IRBL procedure is the match between each real-time acquired smartphone images and a corresponding synthetically generated 3D image extracted by a database (DB), all implemented in an automated procedure. In the next sections, the entire workflow will be described. The developed algorithms will be analysed, and a complete description of the activities realised in the test sites with the validation will be reported. Figure 1 describes the procedure by the sequential steps: the 3D data acquisition with a LiDAR instrument, the 3D model generation, the database of RGB-D image realisation, the image retrieval with MPEG7 Compact Descriptor for Visual Search (CDVS) and the IRBL algorithm applications for positioning. In the next sections, the attention will be focused on data acquisition and generation of the RGB-D image DB as a fundamental part for the correct application of the procedure.

2. State of the Art

As stated above in the research dealing with the smartphone on-board sensors, particularly at this stage of the research, only the camera was analysed. A literature review on optical systems for indoor positioning has been published by Mautz and Tilch in 2011 [19]. All camera-based positioning systems deal with the definition of position and rotations in a 3D world when the primary observation is a 2D position on a camera sensor. Depth information can be obtained with the motion of the camera or can be measured directly with additional sensors, such as with a laser scanner. In the first approach, the scale of the system cannot be determined, and it requires a separate solution. The transformation from the image space into the object space and this requires distance information. If a stereo camera system is used with a known baseline, the scale can be determined from the stereoscopic images. Alternatively, distances can be measured with additional sensors, such as a laser scanner or range imaging cameras.
There are many previous research studies on indoor image based localisation that pursue different goals and use different methods and technologies also in the function of the field of interest of the research groups. The robotics community has focused on visual odometry approaches [20] and simultaneous and location mapping (SLAM) [21,22], while other groups related to geomatics and graphics are investigating semantic features [23] or structure from motion.
Some interesting work exploits the computer vision algorithm and in particular the neural network and transfer learning for visual indoor positioning and classification [3]. Some use RGB-D images to perform object recognition [24]. Other researchers use omnidirectional cameras to generate an image map database to query [25]. On the use of a smartphone as a navigation device, some interesting research can be found in [26,27,28,29].
The main objective of the project related to this paper is to investigate and develop a low-cost positioning solution in an indoor environment, which could define the camera position and orientation with high accuracy, through a database of high resolution synthetic images generated from a very accurate 3D model. Examples could be found in the research by Liang et al. [10], where the image based localisation has been performed using a backpack acquiring frame and depth information at the same time for the generation of a database of reference images. This work differs from our research due to the lower resolution of the images and the methodology of the database creation.
It is evident that these methods need a-priori information, but nowadays, with the spread of new survey instruments and techniques like photogrammetry, LiDAR, and mobile mapping systems, 3D structure information of large environment could be rapidly acquired with (as positive spillover) an accurate 3D model that could be always available for further upgrading and be usable for collateral tasks.

3. Methodology

The proposed method for IRBL is based on three fundamental components:
  • An image DB realisation for object area description: This DB uses thousands of images recorded in the form of RGB-D images.
  • A visual search technology: In this study, the CDVS, patented by TELECOM Italia, has been used to identify the reference image extracted from the image DB that is similar to a query image (acquired by the user with a smartphone).
  • A proposed algorithm for IRBL: This algorithm is based on a sequence of feature matching and robust outlier rejection that can extract a set of 2D features, homologous points between reference and query images. These 2D features can be transformed into 3D using RGB-D data for a final photogrammetric space rejection.

3.1. Generation of RGB-D Image Database

A RGB-D image is a classical RGB digital image with known internal and external orientation parameters, where a distance between the projection centre and the acquired objects are recorded for each pixel. Therefore, distance values are stored in an additional matrix with the same pixel size, number of columns, and number of rows as the RGB matrix. Additional radiometric information such as NIR, MIR, TIR, multispectral, or hyperspectral bands can be added in other matrix levels, defining in this way a new image that authors can define as RGB-D. Figure 2 contains a schema of the RGB-D structure. With the generation of a database of RGB-D of an indoor environment, it is possible to correctly represent reality.
To generate a DB of RGB-D images automatically, a realistic 3D model of the area of interest, with both geometric and colour information, is required as input data. This model could be extracted from an existing 3D model, generated by a terrestrial or aerial survey, or obtained through a mobile mapping system. Once the 3D model is generated, the RGB-D images can be automatically realised by means of the software ScanToRGBDImage developed by the Geomatics group of the Politecnico di Torino.
The software can generate an RGB-D image that needs to contain the following information:
The external orientation parameters corresponding to the position and orientation of the camera (X0, Y0, Z0, ω, φ, and κ), which are derived from the position of the point cloud.
The internal orientation parameters corresponding to focal length, the principal point position of the camera (f, ξ0, and η0) and distortions (the generated images are synthetic and are considered without distortion).
The number of pixels in the columns and the rows of RGB-D (nrow, and ncol) and the image pixel size dpix.
As input parameters, the realised program requires the focal length of the images that will be realised, nrow and ncol, the pixel size of the generated images, and the number of images that need to be extracted according to the vertical (nV) and horizontal (nH) steps (Figure 3).
Once the input parameters are fixed, the process executes the next steps [30]:
  • An empty image (RGB and range matrix levels) is generated using (ncol, nrow).
  • A subset of coloured points (Xi, Yi, Zi) with i = 1:n, (n = number of selected points) can be extracted from the original RGB point cloud according to a selection volume that can be defined by a sector of a sphere (Figure 4) with:
    • the centre in the location of the generated RGB-D image;
    • the axis direction coincident with the optical axis of the synthetic image;
    • the radius R; and
    • the amplitude defined by an angle (≤90°) that is half of the cone angle measured from the direction axis.
  • For each selected coloured point, a distance di with respect to the location of the generated image is calculated:
    d i = ( X i X 0 ) 2 + ( Y i Y 0 ) 2 + ( Z i Z 0 ) 2
  • Each selected RGB point is projected on the synthetic image defining its image coordinates (ξi, ηi) by means of the internal and external orientation parameters inside the collinearity equations:
    ξ = ξ 0 c r 11 ( X X 0 ) + r 21 ( Y Y 0 ) + r 31 ( Z Z 0 ) r 13 ( X X 0 ) + r 23 ( Y Y 0 ) + r 33 ( Z Z 0 )
    η = η 0 c r 12 ( X X 0 ) + r 22 ( Y Y 0 ) + r 32 ( Z Z 0 ) r 13 ( X X 0 ) + r 23 ( Y Y 0 ) + r 33 ( Z Z 0 )
    where ( r 11 , r 12 , r 13 , r 21 , r 22 , r 2 , 3 , r 31 , r 32 , r 33 ) are the coefficients of a 3 × 3 spatial rotation matrix depending from the camera attitude ( ω , ϕ , K ) .
    R ω ϕ κ = ( cos ϕ cos κ cos ϕ s e n κ s e n ϕ cos ω s e n κ + s e n ω s e n ϕ cos κ cos ω cos κ s e n ω s e n ϕ s e n κ s e n ω cos ϕ s e n ω s e n κ cos ω s e n ϕ cos κ s e n ω cos κ + cos ω s e n ϕ s e n κ cos ω cos ϕ )
  • The image coordinates (ξi, ηi) are converted into pixel coordinates (ci, ri) using:
    c i = ξ i d p i x + n c o l 2
    r i = η i d p o x + n r o w 2
  • The RGB values of each point are written inside the cells of the image matrix in the position (ci, ri).
  • The distance value di is written inside the cell of the range image matrix in the position (ci, ri).
At the end of the procedure, pixels that are still void are filled by means of an interpolation algorithm based on the nearest filled pixels.
After the process, ScanToRGBDImage generates a set of synthetic images with the information regarding the position and attitude, i.e., the RGB-D images database.
Figure 5 shows an example of a set of RGB-D images connected to a scan position in Bangbae metro station (X = 322,920.858, Y = 4,150,175.414, Z = 45.967 in metres—UTM-WGS84, 52S).

3.2. Compact Descriptor Visual Search

The goal of the retrieval procedure is to select a reference image out of the image DB with the highest level of similarity with the image acquired by the smartphone camera, target of the positioning procedure. For the retrieval procedure, the adopted solution is defined by MPEG7 CDVS [31] with minor optimisation. To select the most similar image out of a DB, the following operations have been defined by MPEG7-CDVS:
  • Local descriptors in query and database images are extracted and compressed.
  • The images are preliminarily ranked based on global descriptor [32] similarity scores between the query image. Global descriptors provide a statistical representation of a set of the most significant local descriptors extracted from the two images. As a result of the global descriptor preliminary screening, several potentially similar images are then selected out of the DB.
  • For the selected best ranked images by the global descriptor similarity test, the pairwise matching procedure between the extracted key points in a couple of images is executed, trying to match similar key points present in both images. For each feature descriptor of the query image, one and only one similar feature descriptor is searched in each single image part of the DB.
  • The matched key points are validated through a geometry check based on the concept that the statistical properties of the log distance ratio for pairs of incorrect matches are distinctly different from the properties of that for correct matches.
Based on a statistical model, a set of good matches can be ranked using a similarity score given by:
5.
The number of correct pairwise key points from the DISTance RATio coherence (DISTRAT) check; and
6.
The reliability of each selected match is given by the distance ratio between the first and the second closest descriptors detected in the reference image.
Due to the potential large number of images in the DB, to speed up the retrieval process, CDVS uses compressed descriptors [33]. For this reason, only a limited number of key points are used in the image search procedure. Moreover, the CDVS gives more priority to the points located in the centre of the image. It is evident that, in some common view, the centre of the picture represents the infinite point of the prospective view so the selected points could be far away from the camera, causing a loss of accuracy in the next step of location. To enhance the accuracy level of the location procedure, the criteria for ranking and selecting the key points should be modified. There is a need for homogeneous distribution of key points in the overall picture, not giving priority to those concentrated in the image centre.

3.3. Image Recognition Based Location Algorithm

Once the retrieval of the reference image is completed, it is possible to extract the 3D information of the selected features from the image to estimate the external parameters (position and attitude) of the query image. In details, the 3D information of the reference image is stored inside the DB of RGB-D images where, for each pixel, the distance (range) of the obstacle depicted in the image is reported, together with internal and external orientation parameters (IO/EO). After the extraction of the reference image, the key points and related features are extracted from the query and reference image using a state-of-the-art solution [34] that allows a preliminary association between key points of the two images. After that, a high percentage of outliers rejection is executed according to a new proposed two-step approach. At first, good matches are selected using the DISTRAT algorithm [35,36,37] using a geometric check based on the distances ratios between pairs of points in the two analysed images. Then, a RANdom SAmple Consensus (RANSAC) check is executed over a quality improved set of matches. The proposed outlier rejection approach, when applied to real working conditions, reduces the processing time by a factor of 10, with respect to the use of a standard RANSAC approach [38]. Finally, camera parameters are estimated based on 3D information available on the reference image for the selected set of key-point pairs according to the collinearity equations [39].
To analyse the detail of the processing, the next list specifies each step of the IRBL algorithm:
  • Extraction of features from query and reference images using scale-invariant feature transform (SIFT) detector [40].
  • Key-point matching procedure where the only query image key points that have one and only one similar descriptor among key points in the reference image are selected, according to a slightly modified approach [41] with respect to the one proposed in [34].
  • A geometric check (DISTRAT) is used for a coarse preliminary rejection of the matched outliers, the use of DISTRAT is required to speed up the outliers rejection procedure.
  • Given the set of common features selected out of the DISTRAT geometric check, the fundamental matrix between the query image and reference image is estimated with a RANSAC procedure, allowing exclusion of the remaining outliers from the DISTRAT check. The RANSAC is a robust iterative method to estimate the parameters of a mathematical model from a set of observed data that contains outliers, as in the DISTRAT output, a small percentage of outliers are present in the selected set of common features. The RANSAC is a non-deterministic algorithm in the sense that it produces a reasonable result only with a certain probability, with this probability increasing as more iterations are permitted. The preliminary use of DISTRAT reduces the percentage of outliers from 70% to just a few per cent;, this allows us to dramatically reduce the RANSAC execution time, by approximately 100 times (at this stage, the focal length is assumed to be similar in both images from the retrieval step, and the camera distortion model is not considered).
  • The common features between the query and reference image are transformed into 3D information using the RGB-D image derived from the three-dimensional 3D model of the scene;
  • To improve the initial external and internal orientation parameters of the query image, a direct linear transformation (DLT) could be estimated using the 3D features extracted in the previous step [42].
  • Rejection of outliers not detected by Steps 3 and 4 are processed by a data snooping process [43]. For the given 11 DLT estimations, the post-fit residuals are calculated in terms of the distance between the projection of the solid point on the query image pair and the matched key-point coordinates. If the largest residual exceeds a threshold, the worst point is discarded and the DLT parameters are estimated again.
  • Using the collinearity equations in a least square estimation, the EO parameters are refined [39,42].
The reliability of the final estimated location can be validated using the variance covariance matrix of least square adjustment [44] and checked against the post-fit residuals. This algorithm has been implemented in the MATLAB environment.

4. Data Acquisition and Processing for Image Database Construction

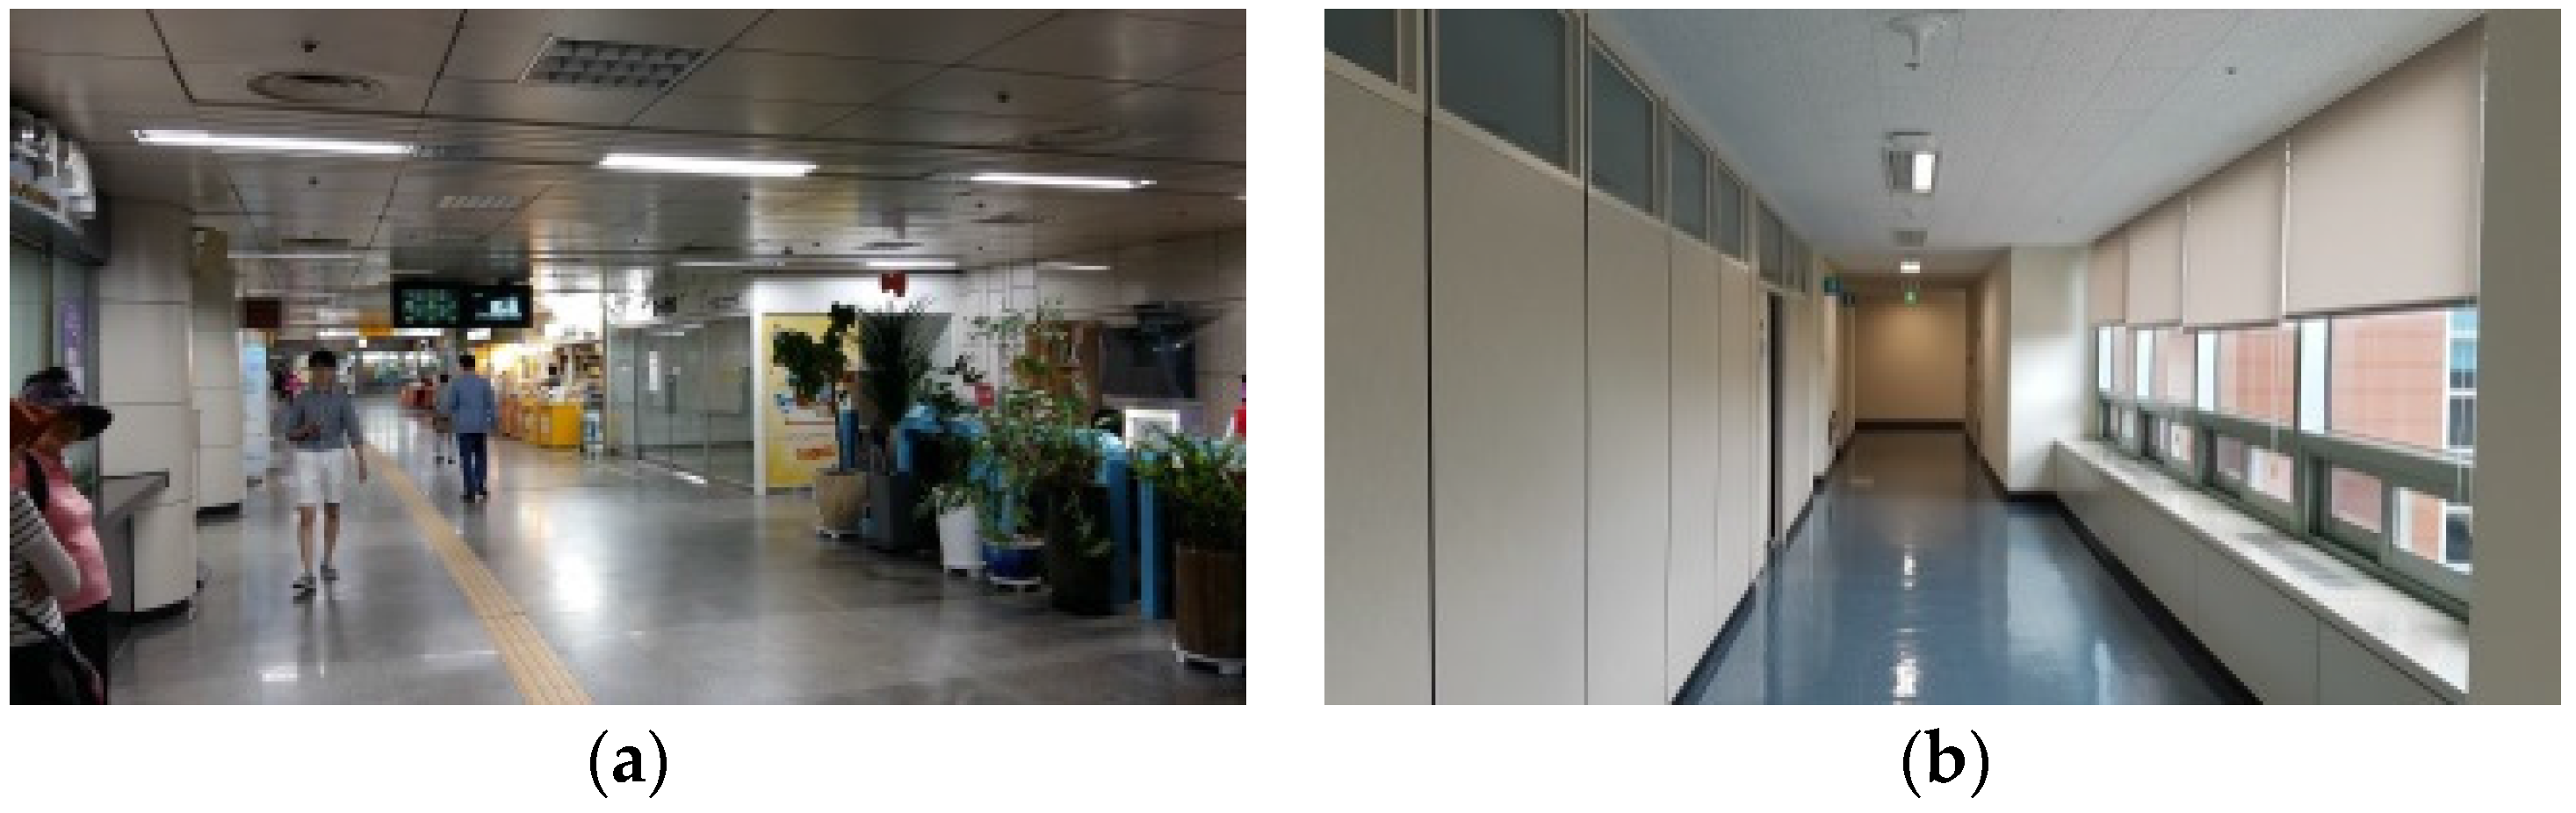
The research project between Politecnico di Torino and Electronic and Telecommunication Research Institute is based on the validation of the proposed procedure on two different test sites that have been chosen to have two different indoor scenarios with some specific issues. The first environment, the Bangbae metro station of Seoul (Republic of Korea), is an important public infrastructure of interest, where an LBS can better express its usefulness. It presents various indoor spaces with different furniture but also a very repetitive railway floor. It is also very populated, which is an important issue in a IRBL system. The second test site is the research department of the ETRI building in Daejeon (Republic of Korea) where, according to the function (research office), the internal areas are repetitive. Each floor has the same aisle with the same colour and the same furniture. The reason for the different scenario is based on the evaluation of the procedure of indoor localisation in noisy areas (very popular with a lot of people), and in similar areas where, from a first view, is difficult to find differences between the different floors (Figure 6).
From the operative point of view, the first step of the work was the realisation of a complete survey of the two test areas using a traditional LiDAR instrument and procedure [45]. To guarantee continuity of the data in all the environments, several images for a typical photogrammetric approach based on structure from motion (SfM) algorithms were acquired with the idea of combining the data in case of loss of information [46]. As the LiDAR acquisition was suitable for the entire representation of the two environments, the photogrammetric elaboration was not used for the generation of the RGB-D database.
Another aspect that needs to be underlined is that the survey at the ETRI building was not geo-referenced using a topographic network. This lack does not degrade the indoor positioning procedure that will present in this case a relative reference of the camera towards the surrounding environment.
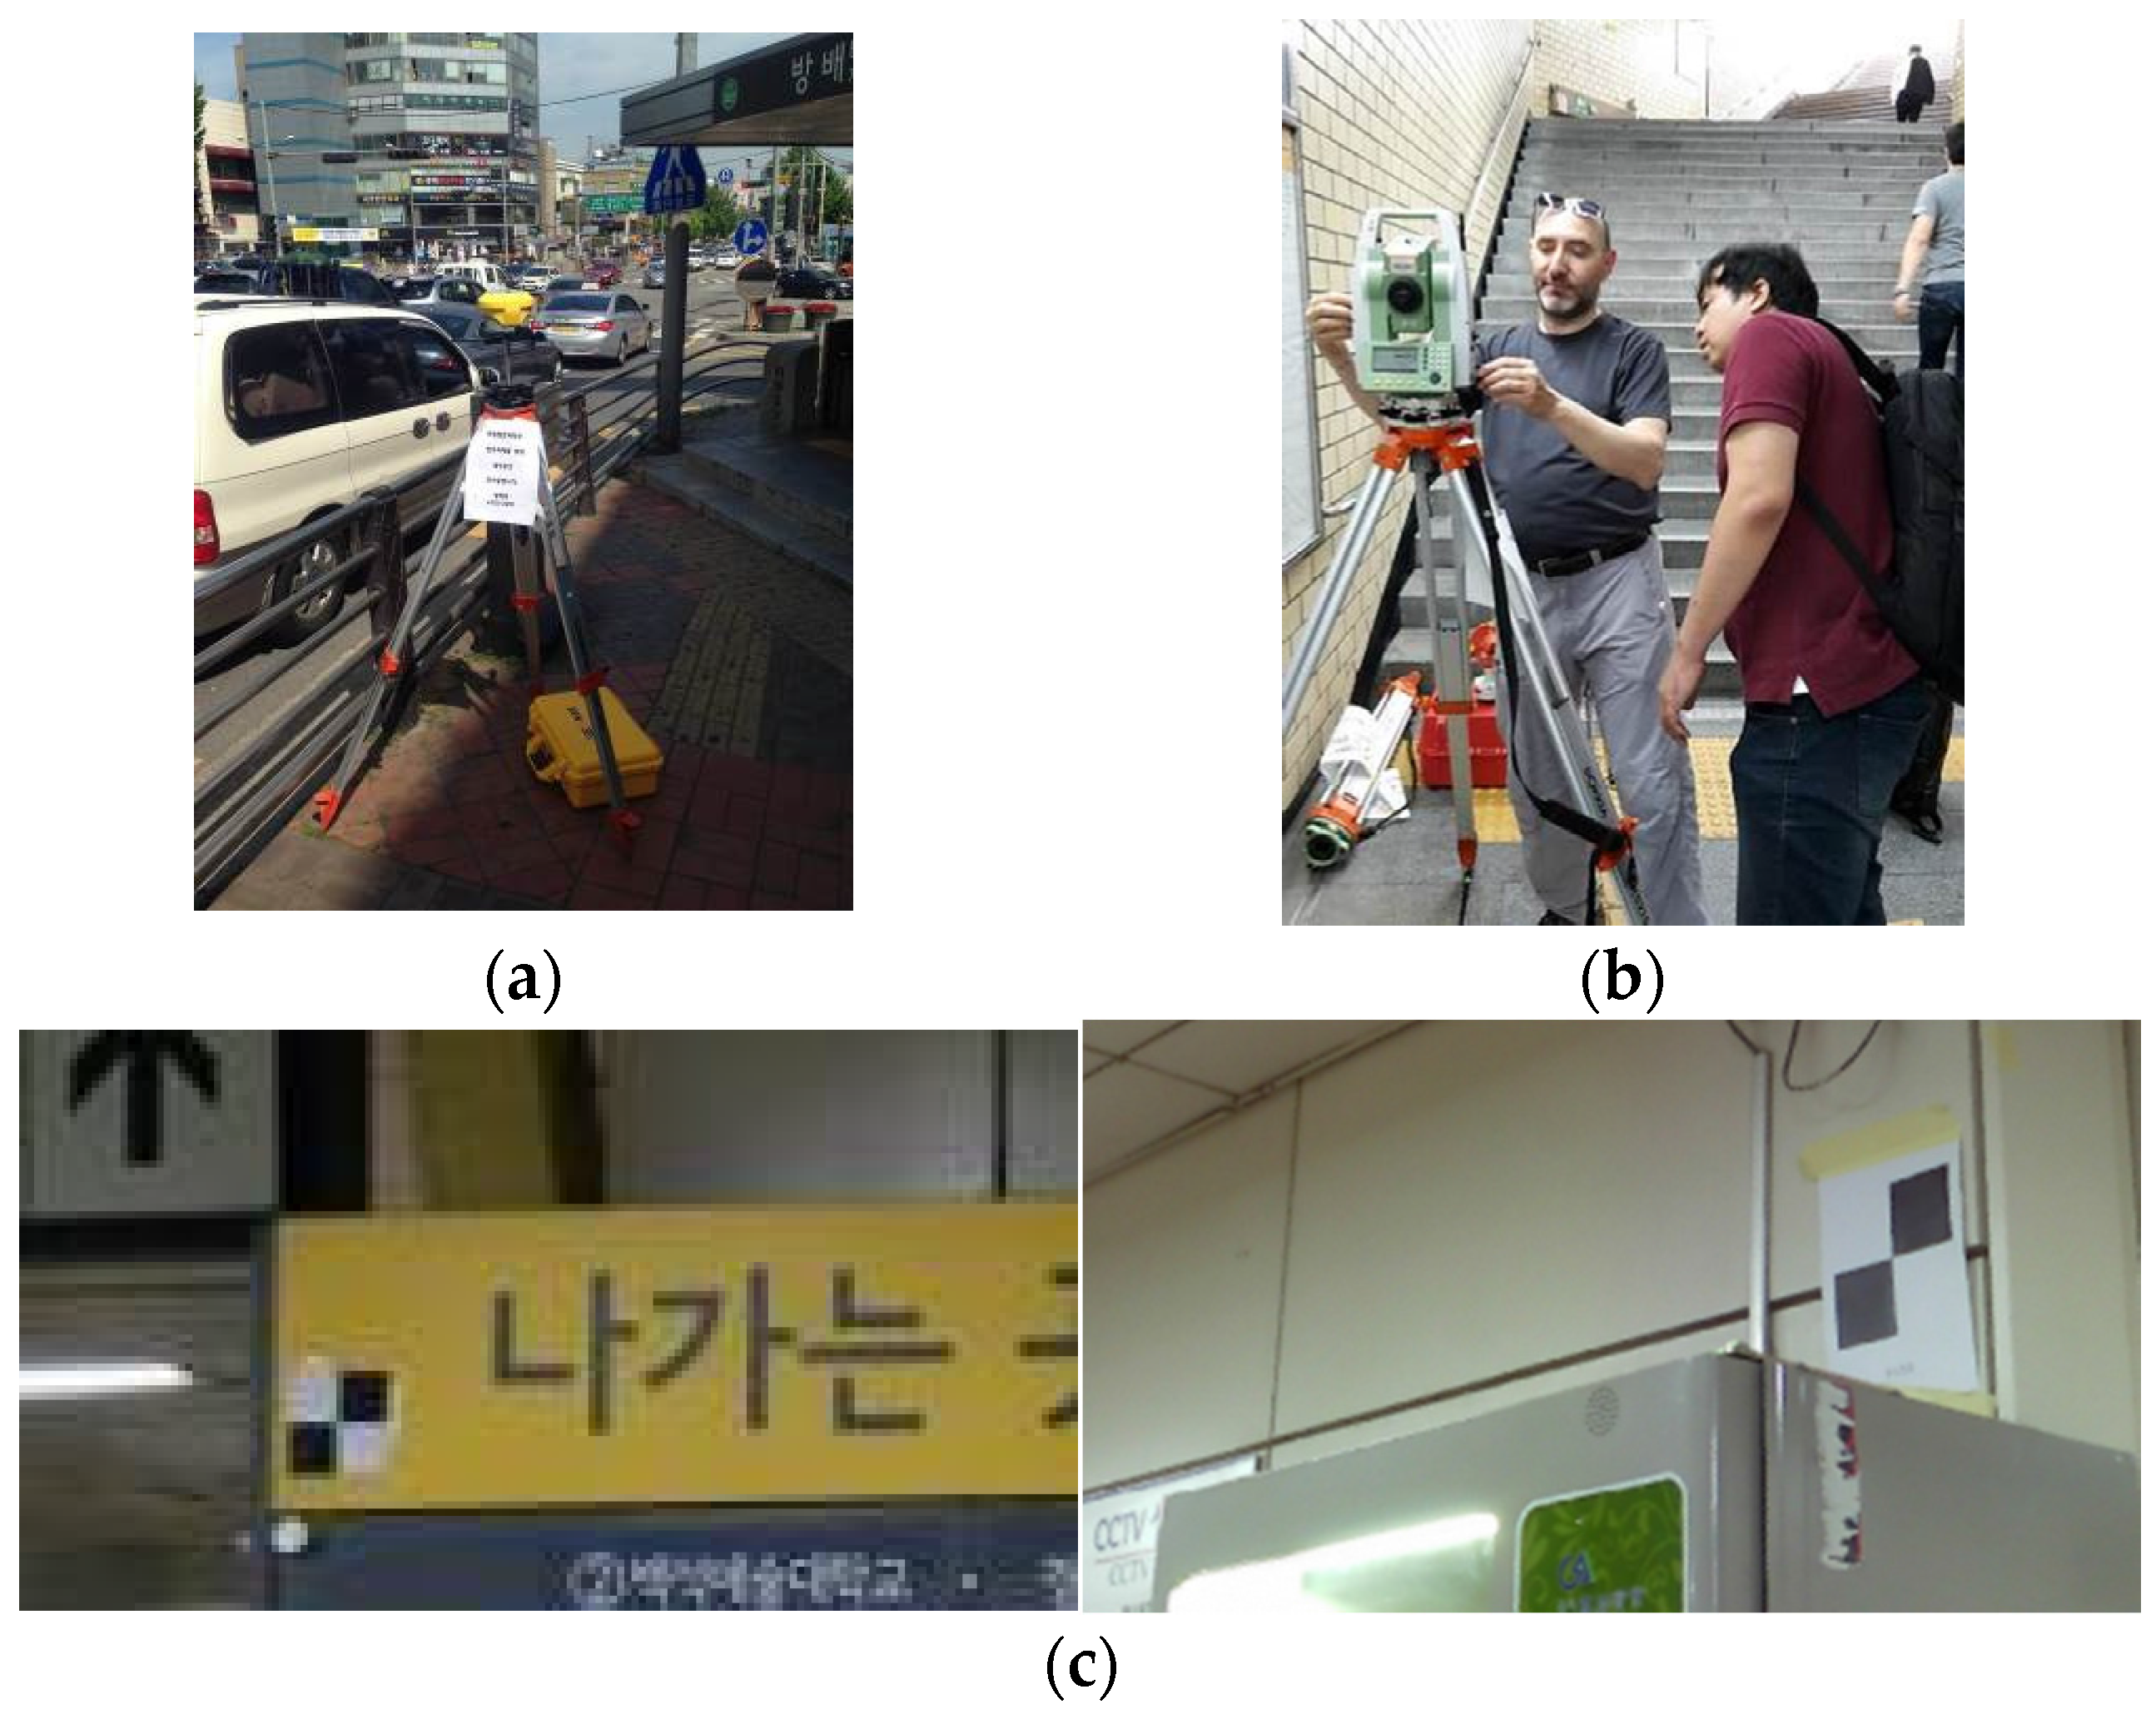
For the metric survey of Bangbae metro station, first a general topographic network of the area and the surroundings was realised to define a common reference coordinate system. In this case, a mixed GNSS and total station (TS) survey strategy was employed. The network was realised on three main levels of the subway station. The GNSS measurements naturally were acquired in outdoor conditions, Furthermore the two vertices were connected to Levels −1 and −2 with traditional TS measurements, as shown in Figure 7a,b. For the GNSS survey, a Geomax Zenith 35 receiver was employed, and for the TS network, a Leica TS06 was used.
In post-processing, the network has been adjusted with Leica Geo-office and Microsurvey Starnet software using the GNSS permanent station of Suwon (a station of the International GNSS Service network) as reference point. According to the achieved accuracy on each vertex (less than 1 cm), the next step was the survey of the markers positioned on the station area. This operation was performed with the TS using traditional side-shot measurements. The markers, in this case, black and white checkerboards, are commonly used for the registration of scans and for geo-referencing the final model (Figure 7c).
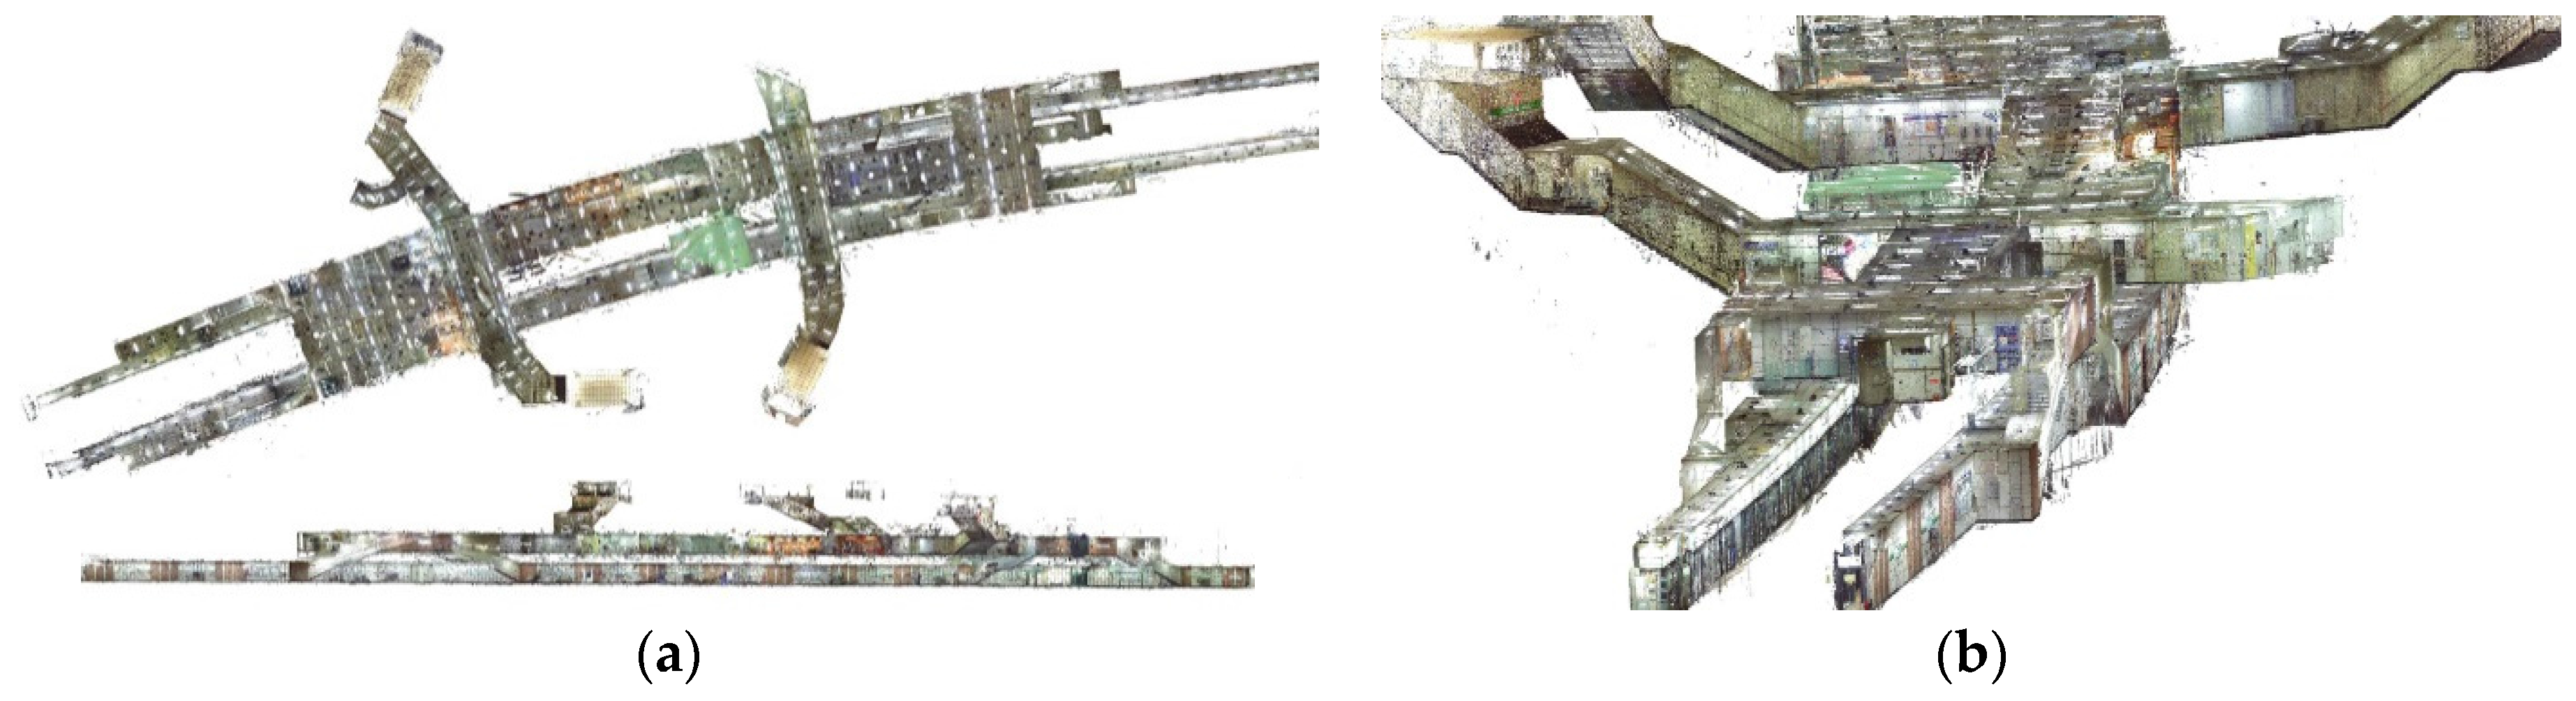
Finally, for the LiDAR acquisitions, two Faro Focus3d X130 were employed. The instrument is a phase shift laser that allows us to acquire 3D point clouds with an accuracy of ±2 mm in the following range: 0.30–130 m. During the point cloud acquisition, due to the included digital camera, it is possible to acquire the images of the scanned area as well. In the test field, the acquisition was performed with a resolution of 1/5 (a point each 9 mm at 10 m) and a quality of 4× (points measured four times). For the complete LiDAR survey of the Bangbae subway station, 114 scans were acquired (55 at Level −1 and 59 at level −2). According to the aforementioned setting of the scanner, each scan contains approximately 26 million points, and about three billion points were measured. The LiDAR data were processed according to the traditional approach [47] using Scene software by Faro, which includes the following main steps: point cloud colouring, scan registration, and scan geo-referencing. Naturally, using the markers, it is possible to evaluate the accuracy of the geo-referencing according to the residual on the measured point. The mean RMS on the measured markers (85 were employed) was 1.56 cm. Figure 8 shows three views of the complete point cloud (114 merged point clouds).
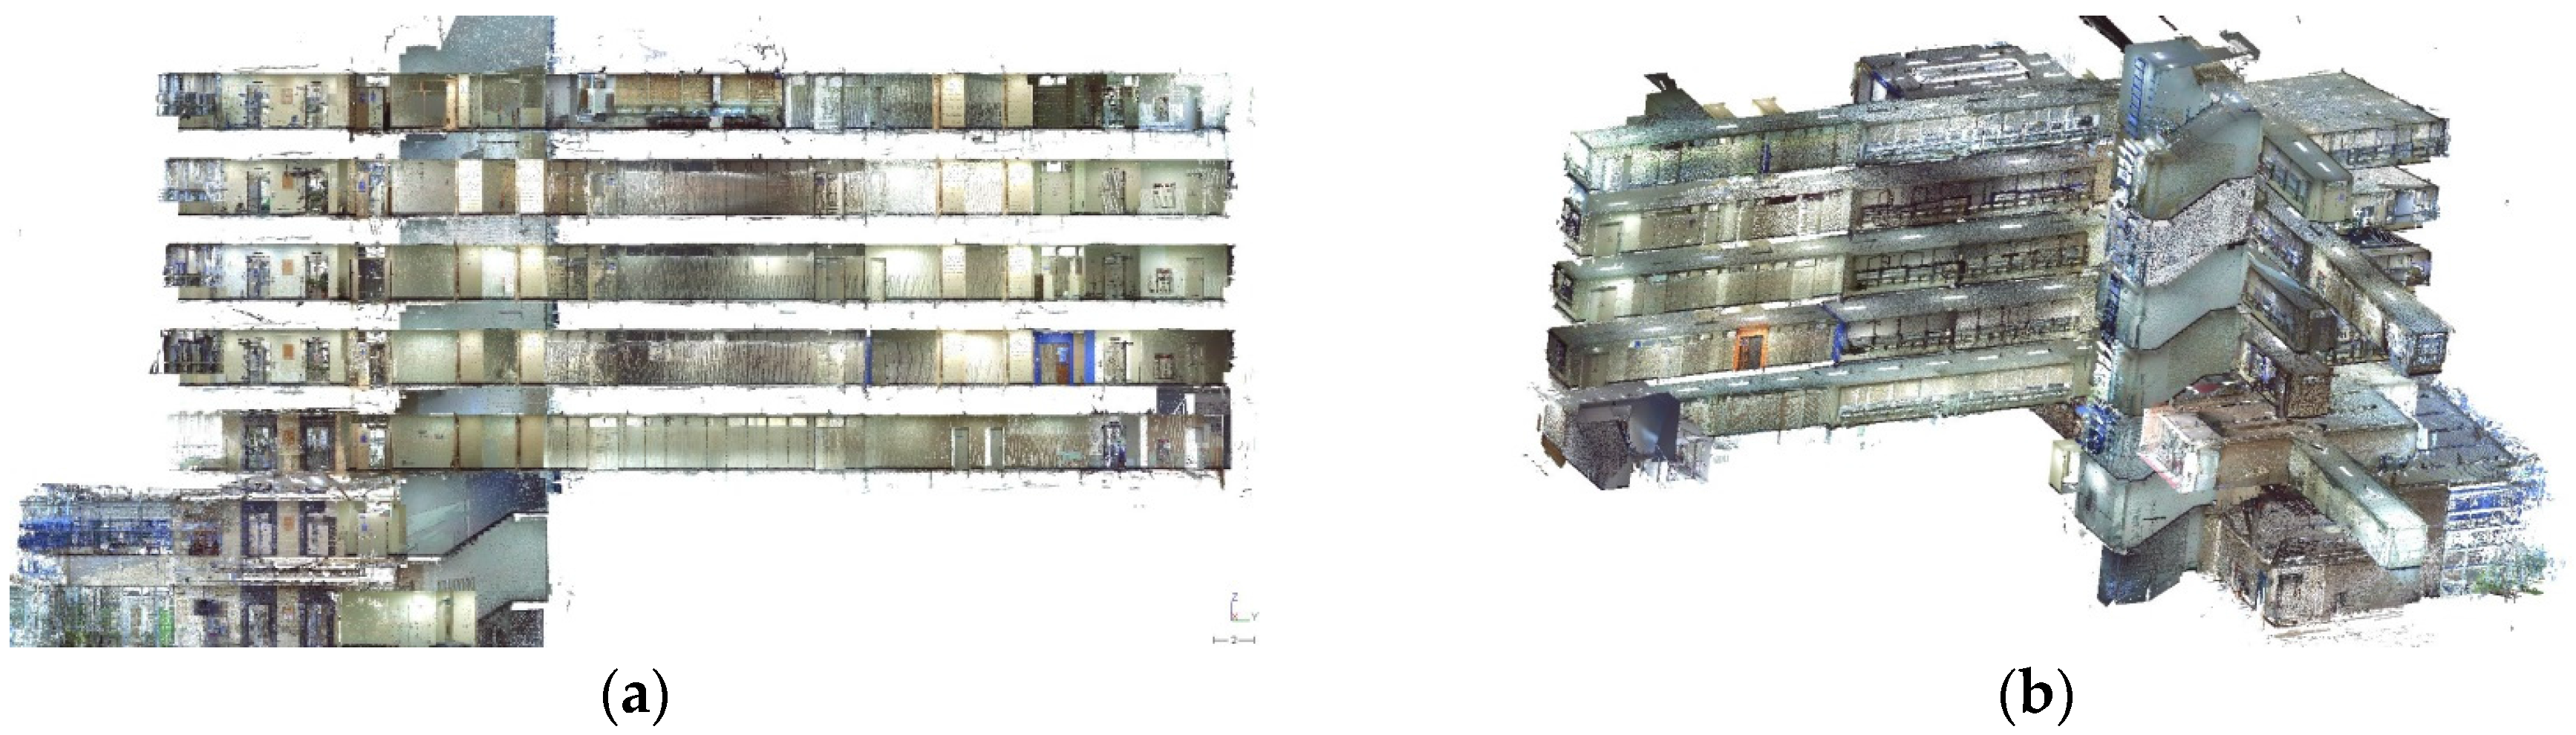
The ETRI building was only surveyed by the LiDAR in a local reference system. All the acquisitions were realised without the usually required topographic network and without the markers for the registration of the clouds. As a consequence, the final point cloud is not located in a known cartographic reference system.
As for the Bangbae station, the LiDAR acquisitions have been performed using the aforementioned Faro Focus 3D X130 that was used at a quite higher resolution: 1/4 (a point each 5 mm at 10 m) with the same quality (4×) of the Bangbae settings. The complete building (seven floors) was completely scanned with 111 scans that, according to the setting of the scanner, delivered each scan with 40 million of points approximately. Approximately 4.5 billion points were measured.
In the case of the ETRI building, the data were processed using Scene software by Faro, but the scan registration was realised using the cloud-to-cloud approach [48]. This approach, based on the iterative closest point (ICP) well-known algorithms [49,50,51], has been implemented starting from Version 5.5 of the Scene software and, nowadays is working very well in the pipeline of the Scene LiDAR data processing. Using this approach, it is first important to define an initial setting of the several scan positions. After the initial position, the algorithm allows us to improve the position of the adjacent scans using the shape of the different clouds. In terms of accuracy, in this case, it is possible to understand only the discrepancy between the adjacent clouds that, in the case of the ETRI building, were for all the registered scans under 1 cm. Naturally, as is reported above, with the cloud-to-cloud approach, the geo-referencing was not allowed since no ground control points (GCPs) were measured on the area. All the point clouds were referenced to a local system that started from an arbitrary position of the first achieved scan in the building. In Figure 9, two views of the complete point cloud are shown.
The final step for both the buildings was the generation of the .xyz file. This ASCII file contains the X, Y, and Z coordinates of each point and the R, G, and B values extracted from the LiDAR internal camera. This file was used for the generation of the RGB-D images.
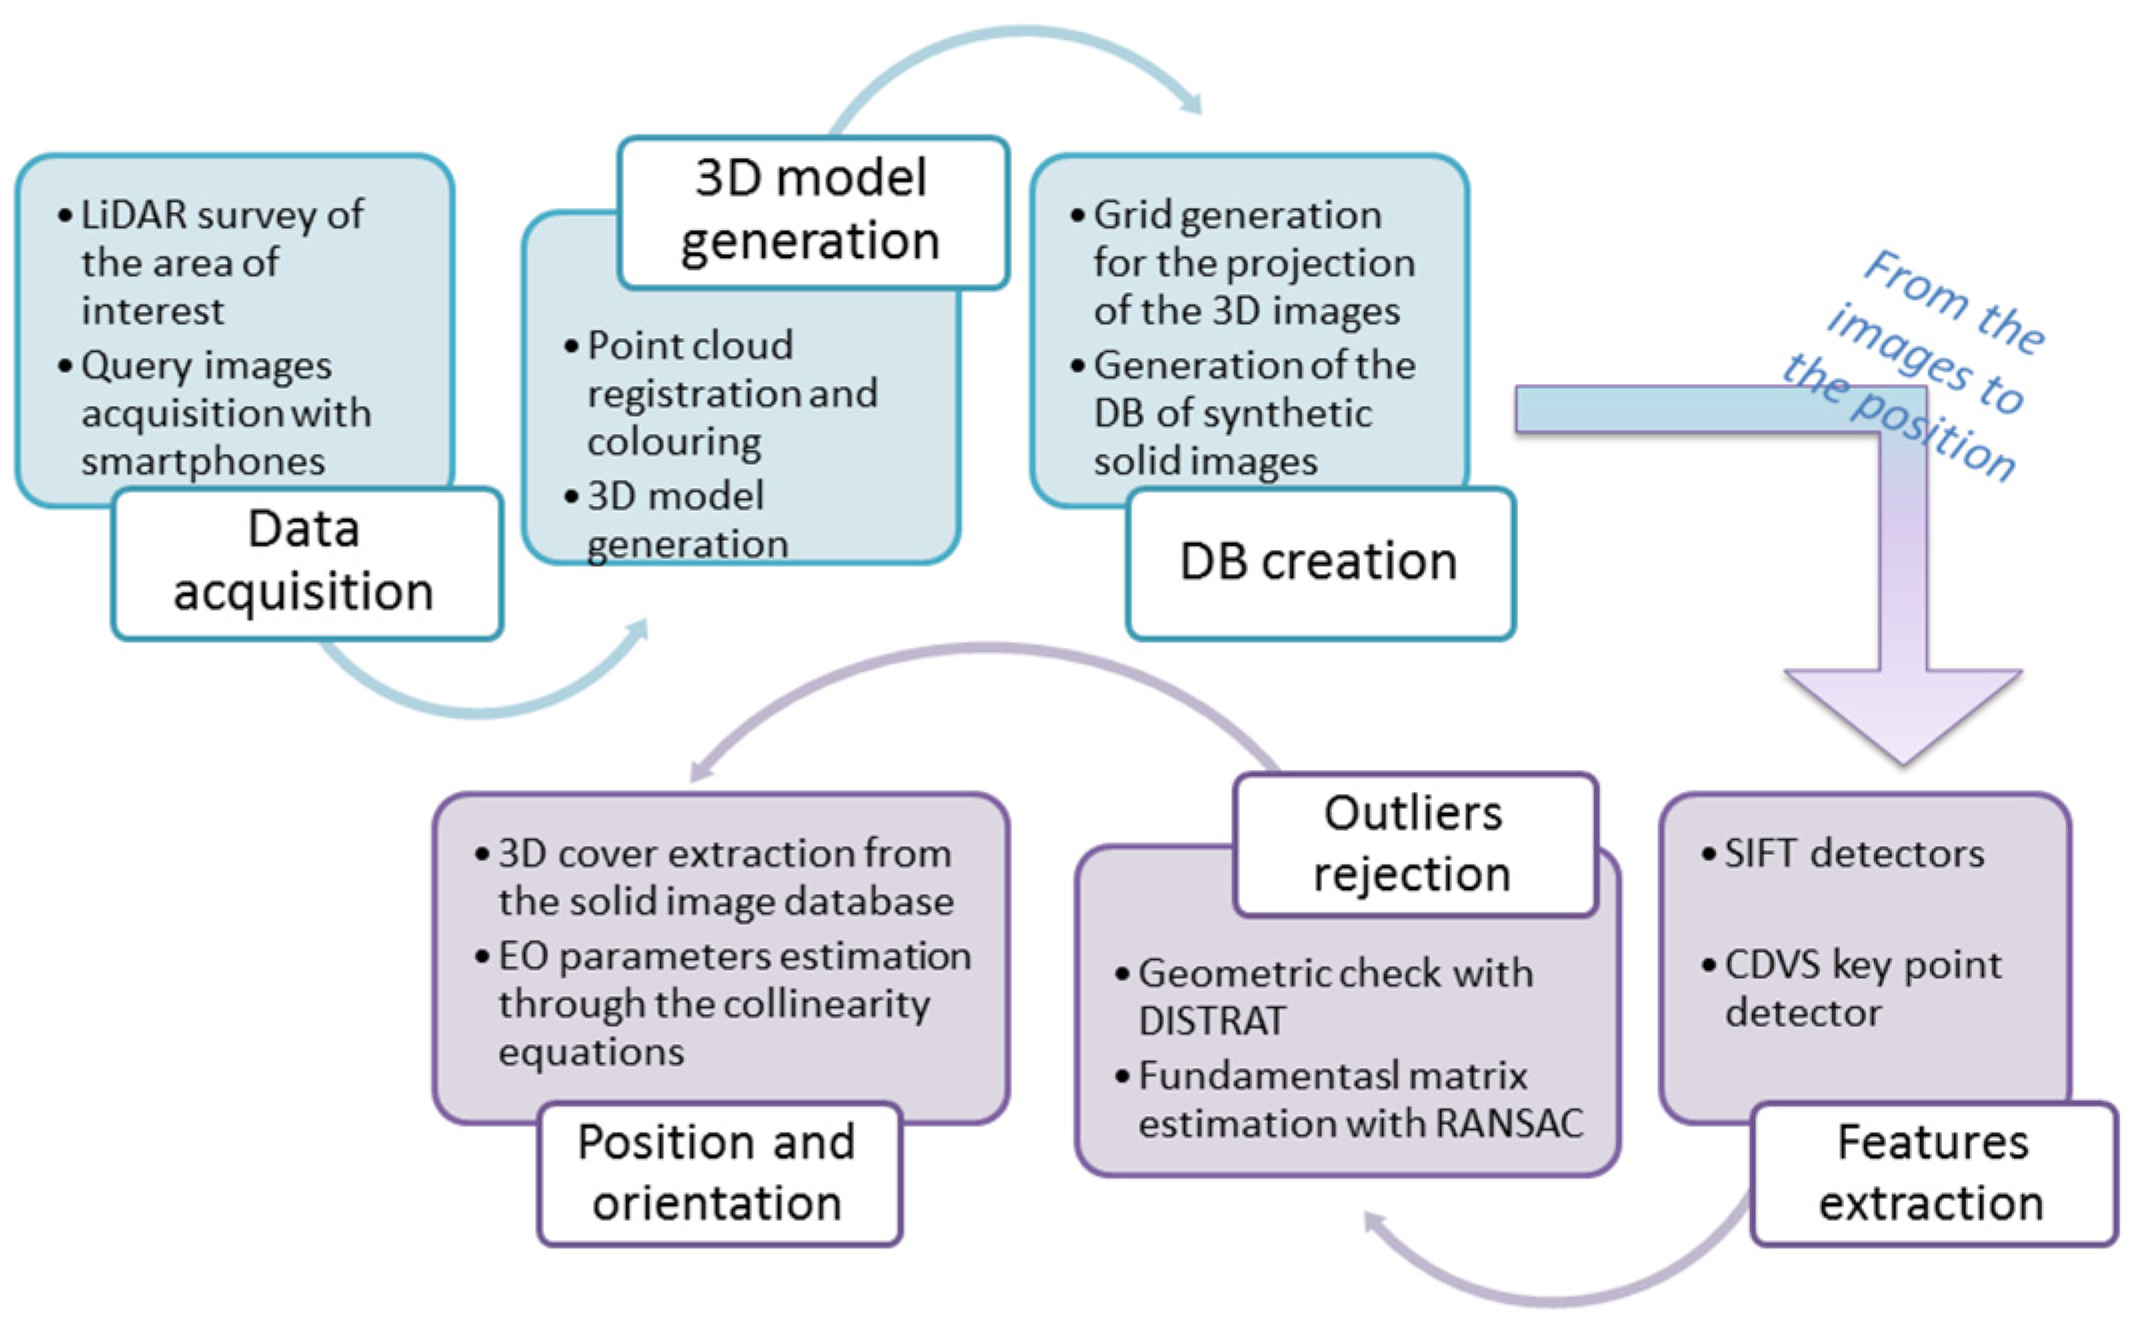
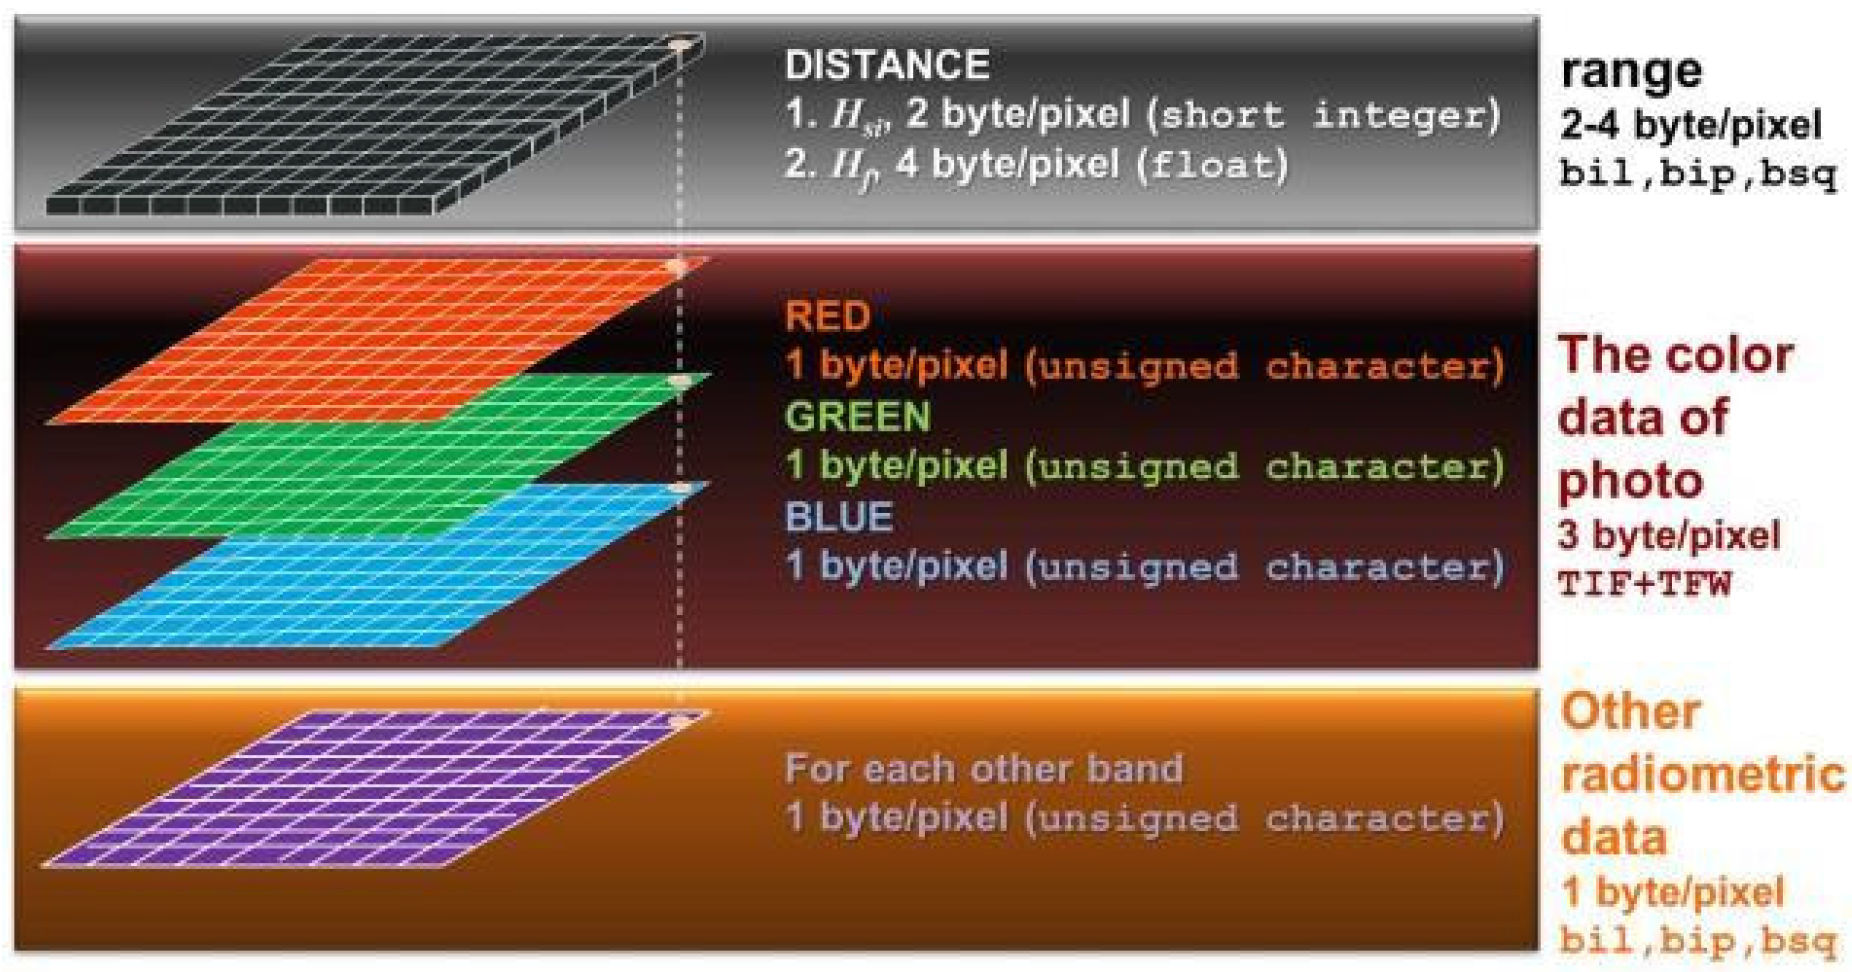
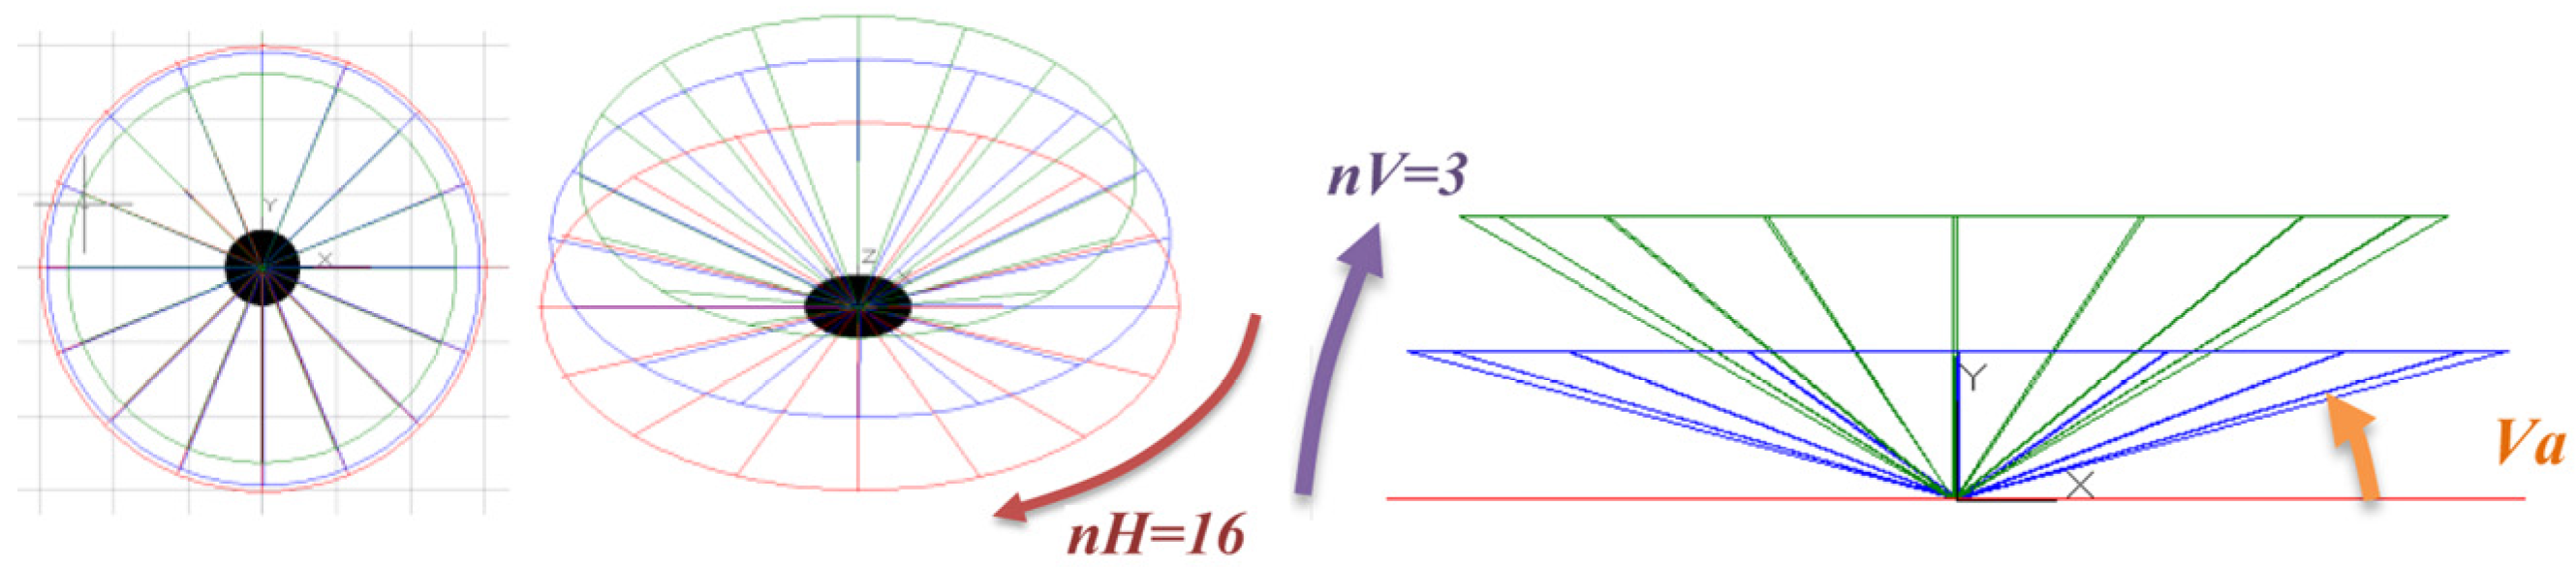
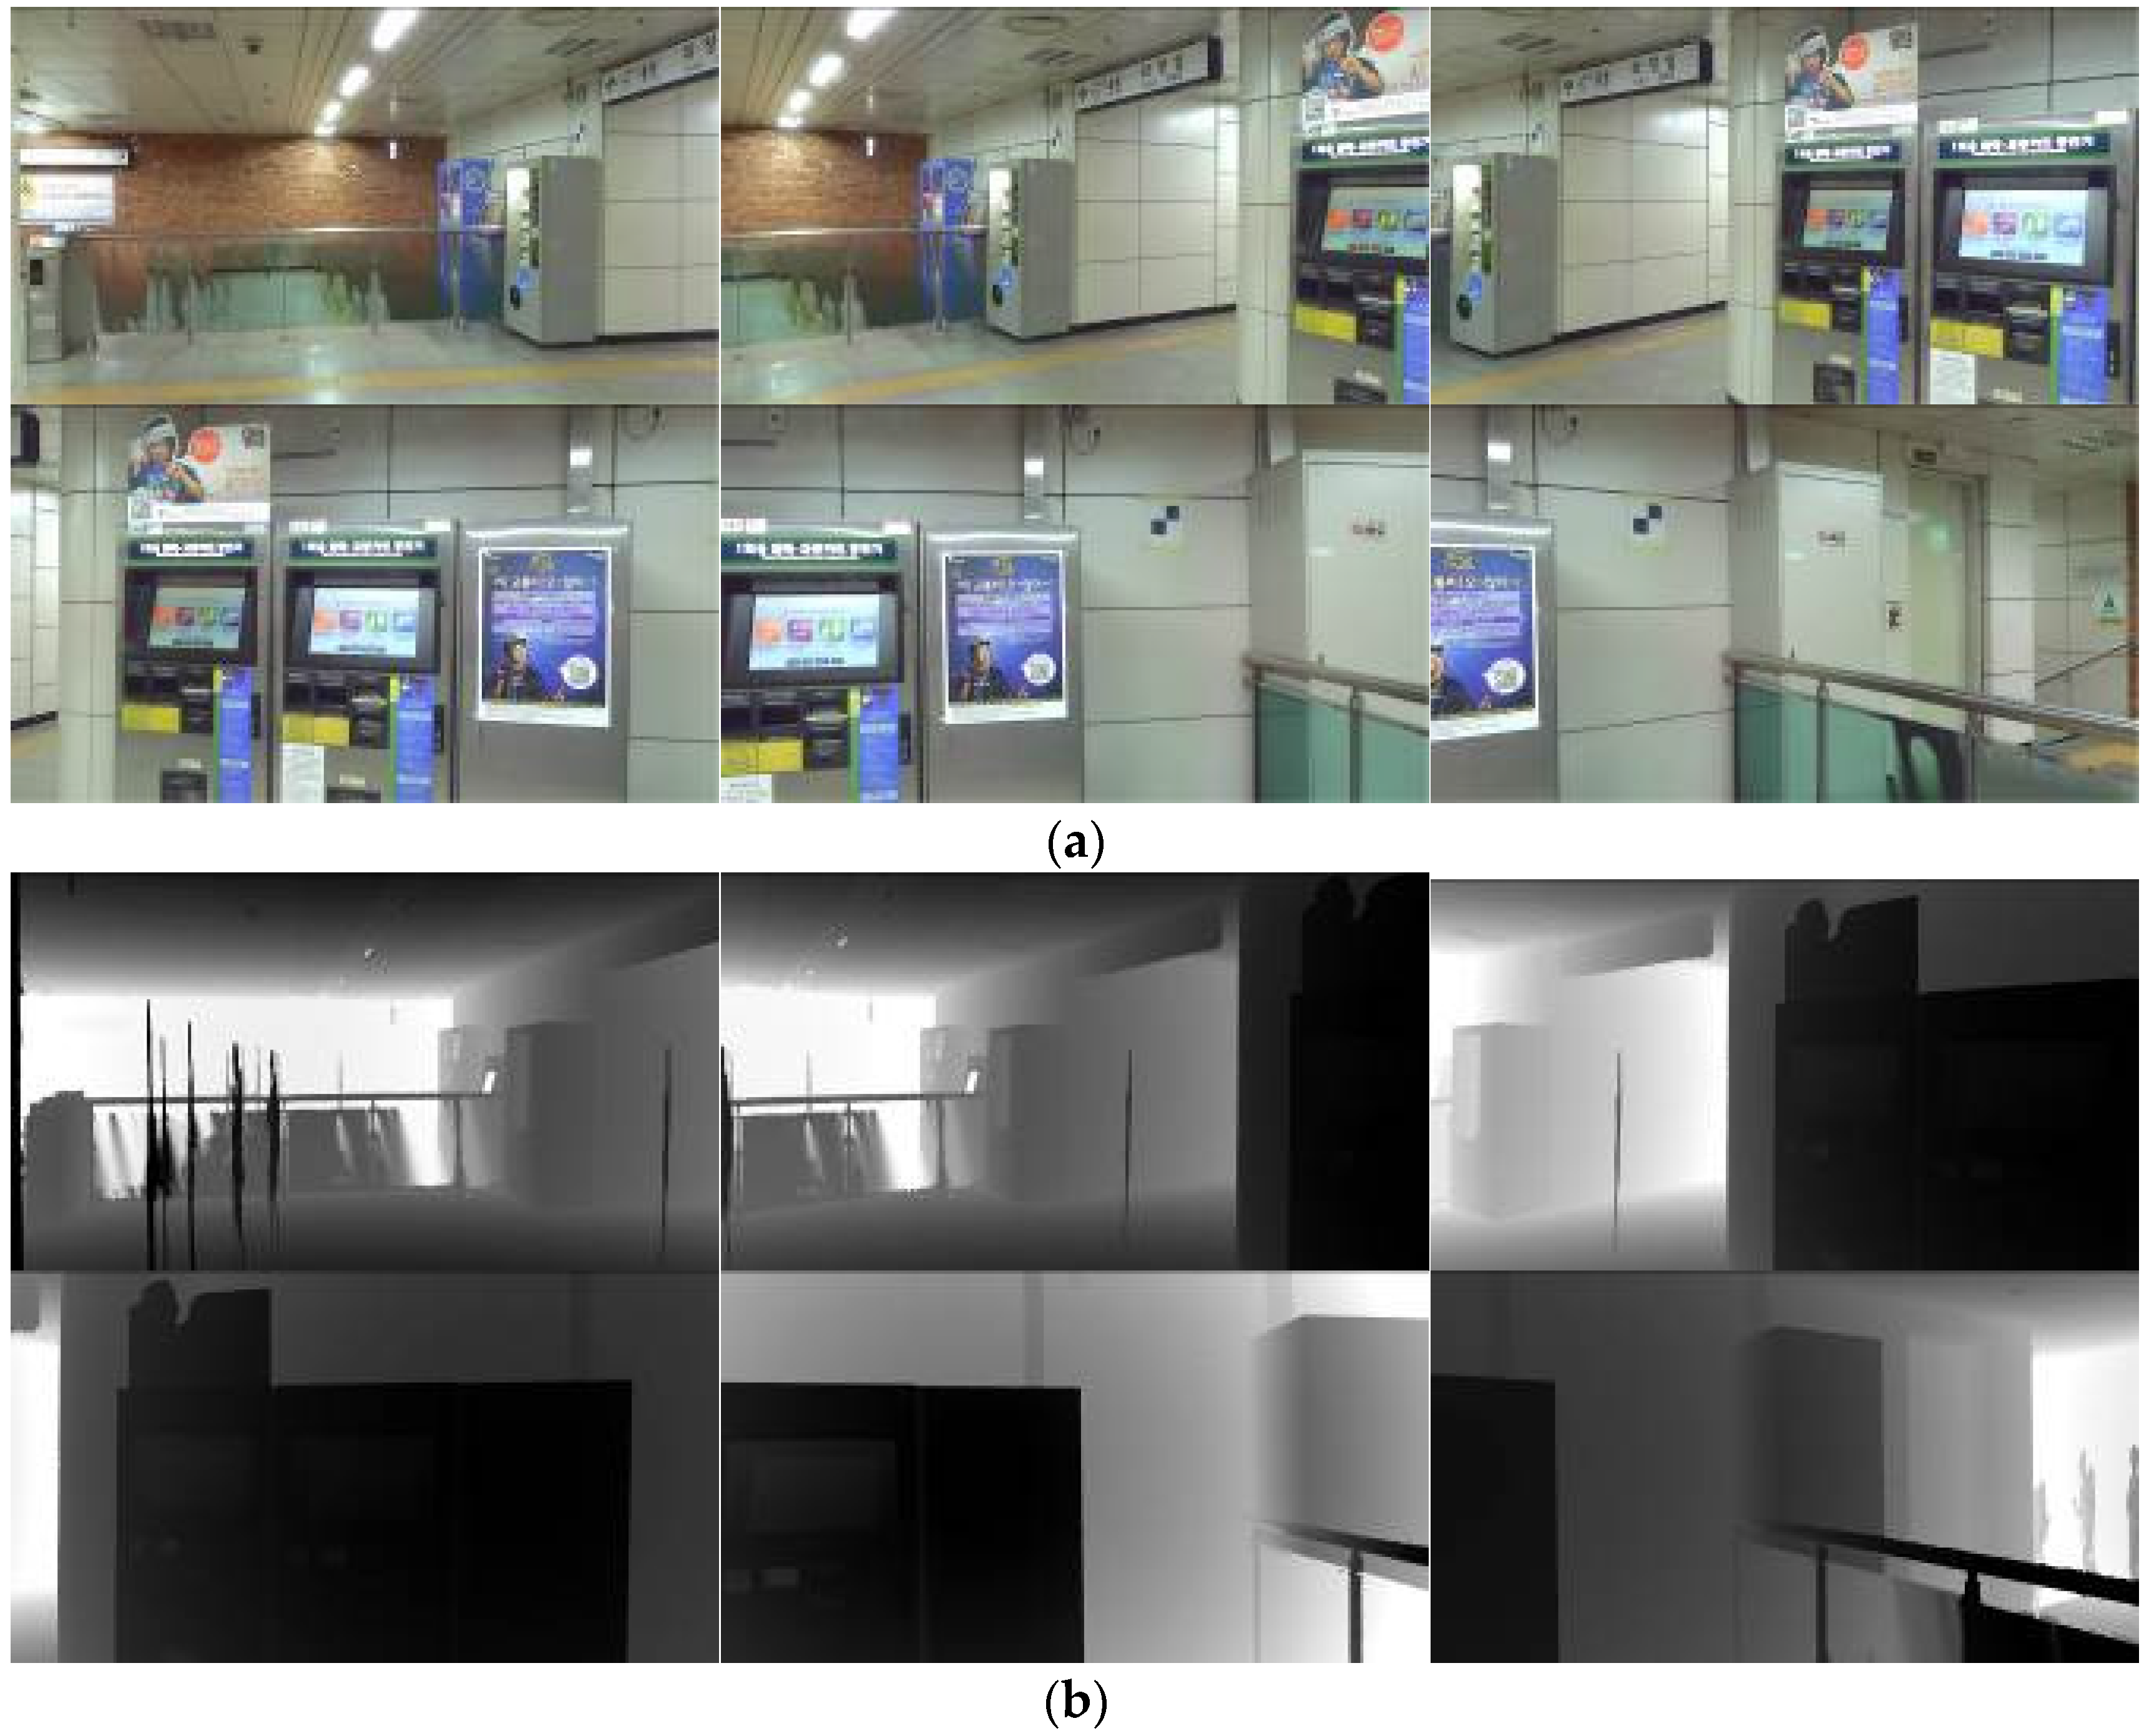
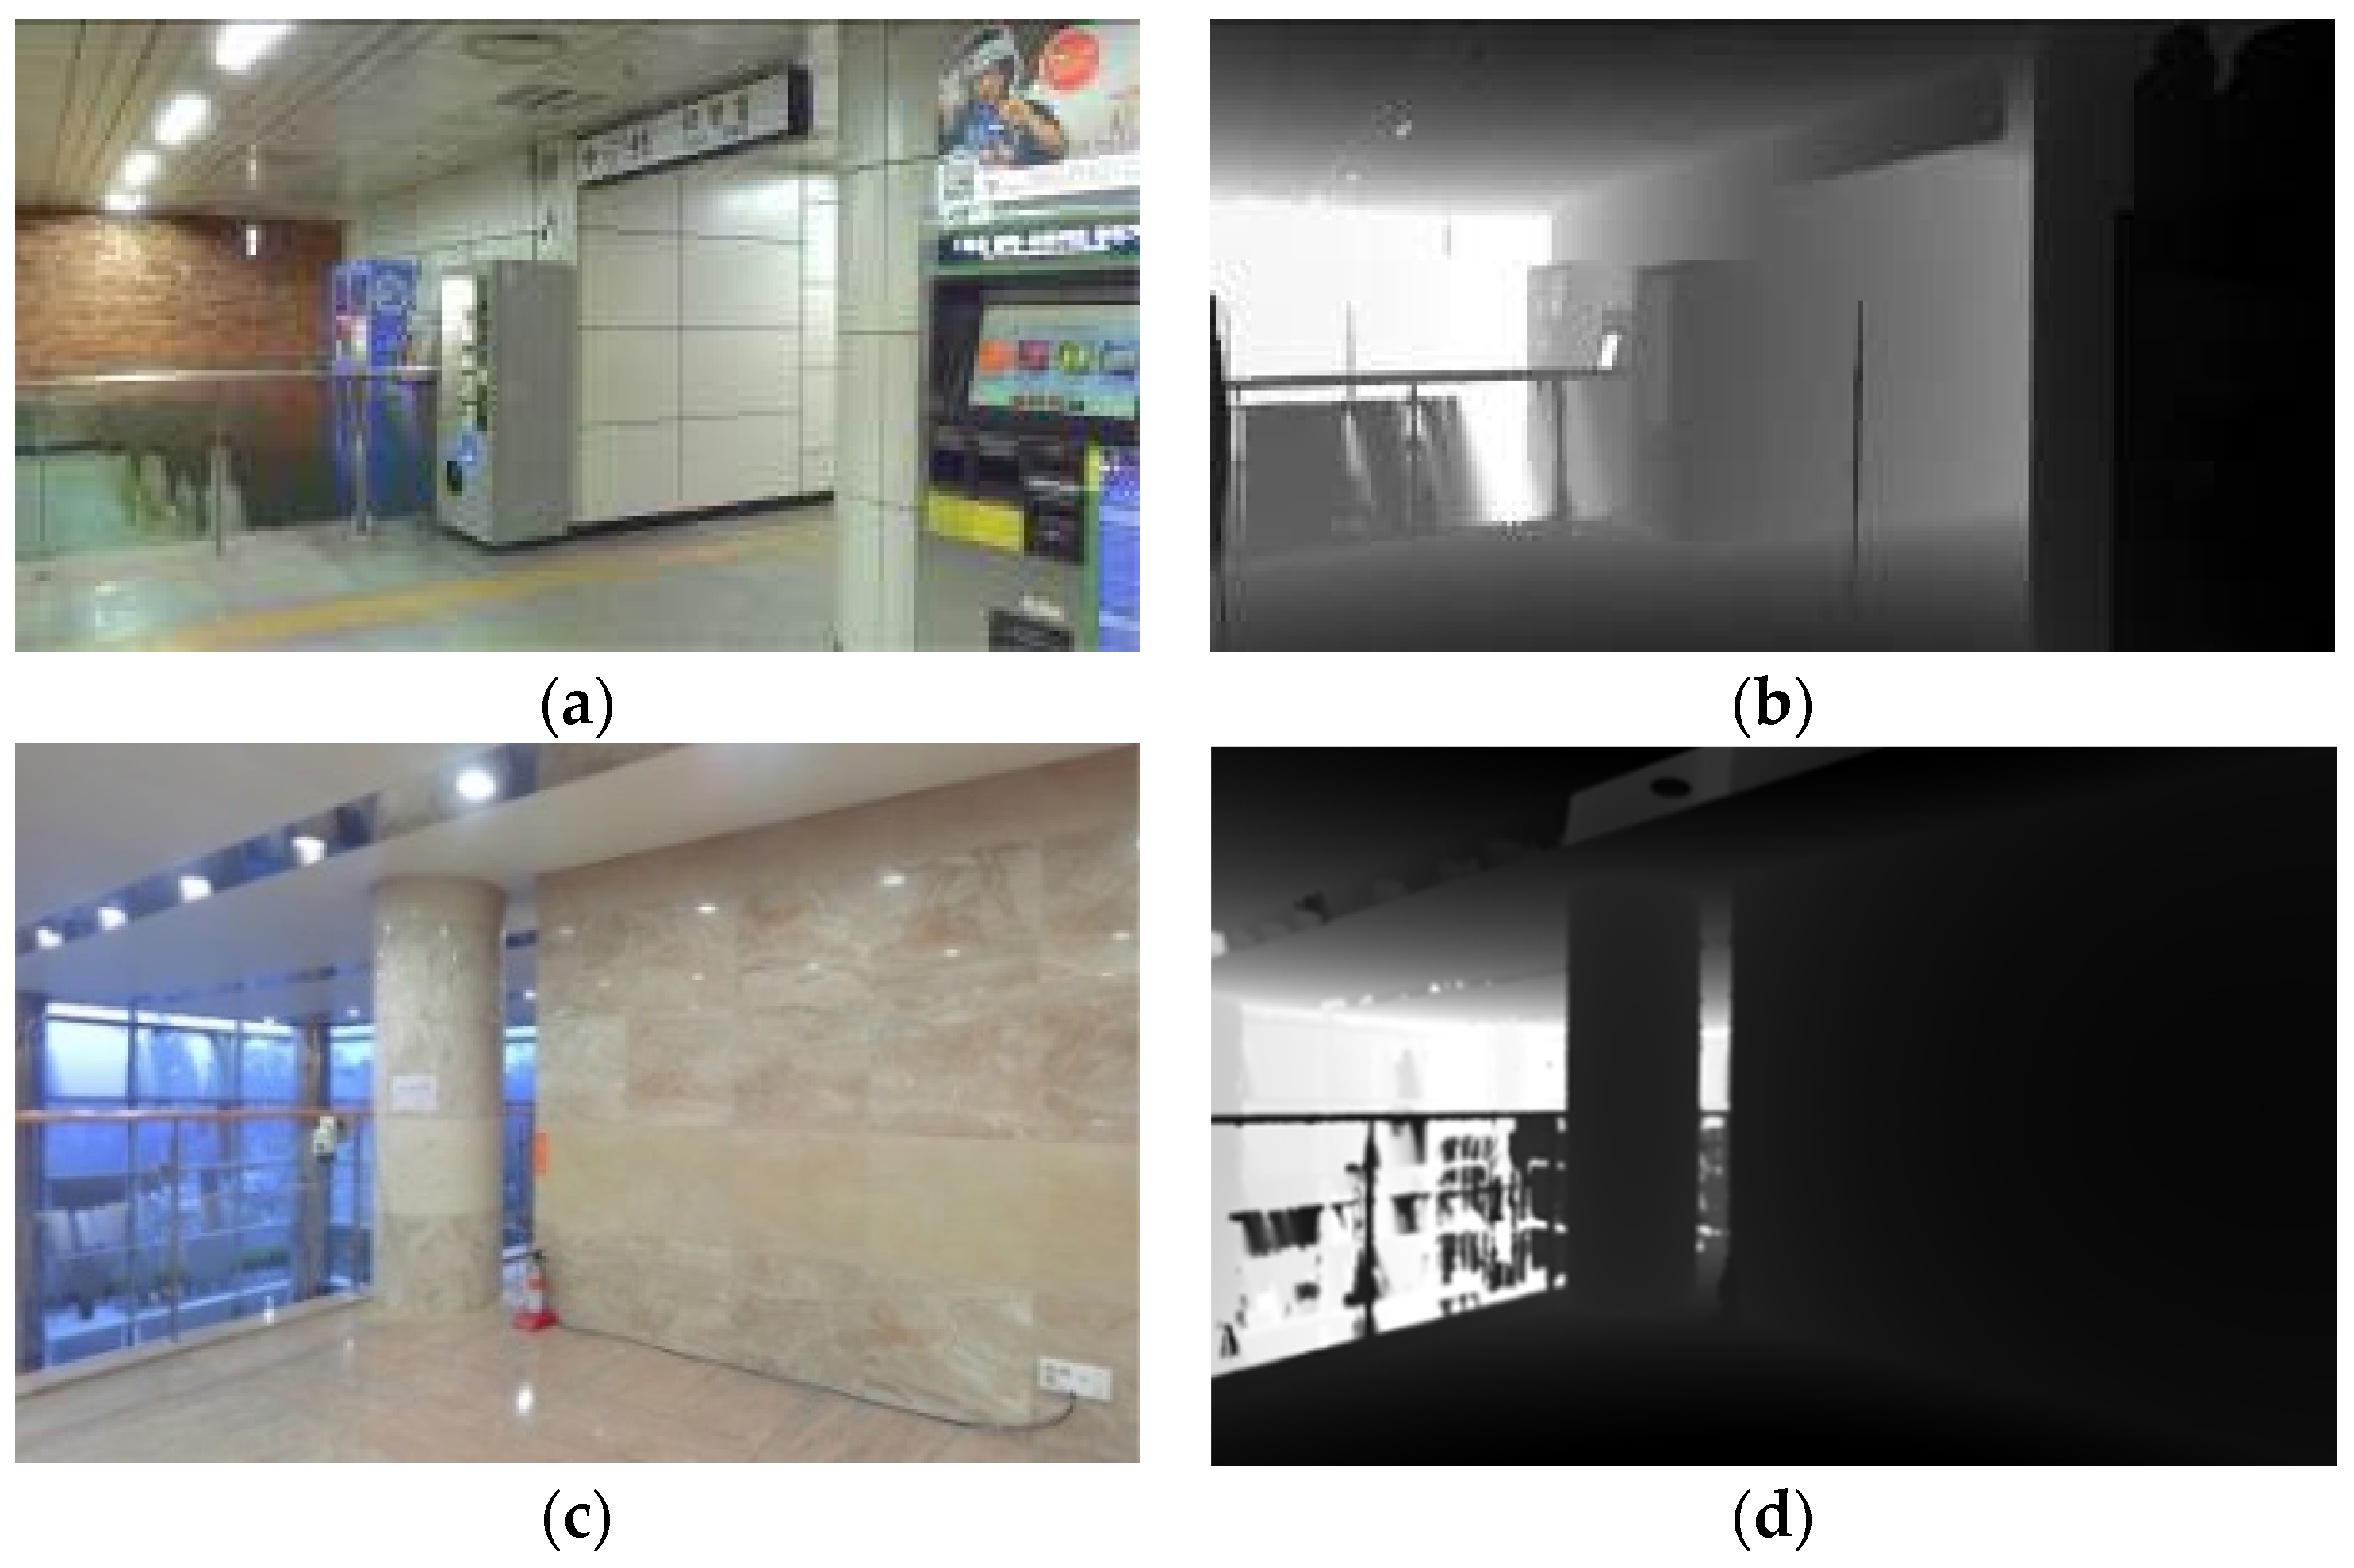
The synthetic RGB-D image can be automatically generated by means of ScanToRGBDImage software tools (developed by the Geomatics research group of the Politecnico di Torino in Intel Visual Fortran) starting from the LiDAR point cloud. The ScanToRGBDImage software generates a set of “synthetic” .JPG images with correspondent range images (Figure 10). For each scan position, 96 images have been generated: 32 horizontal directions for three different inclinations of 0°, 10°, and 20° with respect to the horizontal plane with 2500 × 1600 pixels, 3 μm pixel size, and a focal length of 4.667 mm. For the Bangbae DB, almost 9700 RGB-D images have been produced in about 36 hours of batch processing time with a desktop computer (i7 5600 U 2.66 GHz 32 Gb RAM), while for the ETRI building, 10,700 images have been produced in about 40 hours with a computer with the same characteristics.

5. Smartphone Image Acquisition for Retrieval Procedure and Definition of Ground Truth

On site, with the aim to evaluate the retrieval procedure, several pictures of the test areas have been taken with commercial mobile devices, namely the Samsung Galaxy A5, Galaxy S5, and Galaxy S7 Edge were used to compare different sensors.
The devices used for the acquisitions are smartphones with an integrated non-metric camera that requires a calibration through analytical procedures to define the characteristics of the optical-digital system to evaluate the distortion parameters and other errors. The calibration allows the evaluation of the effects of the radial and tangential distortion of the sensors that are involved in the definition of the camera internal orientation using the collinearity equations. However, as an approximation, it is possible to consider only the effects of the radial distortion, expressed in this case by two parameters K1, and K2.
Knowing the object coordinates of some points acquired by the camera, it is possible to obtain the unknown parameters by solving the bundle-adjustment calculation. The unknown are the six external orientation parameters of the images and the five parameters of the camera (ξ0, η0, c, K1, and K2). The object on which the calibration is usually made is a calibration grid, which is specifically made where the coordinates of the grid points are known with high precision. This procedure is known as the self-calibration of the camera sensor.
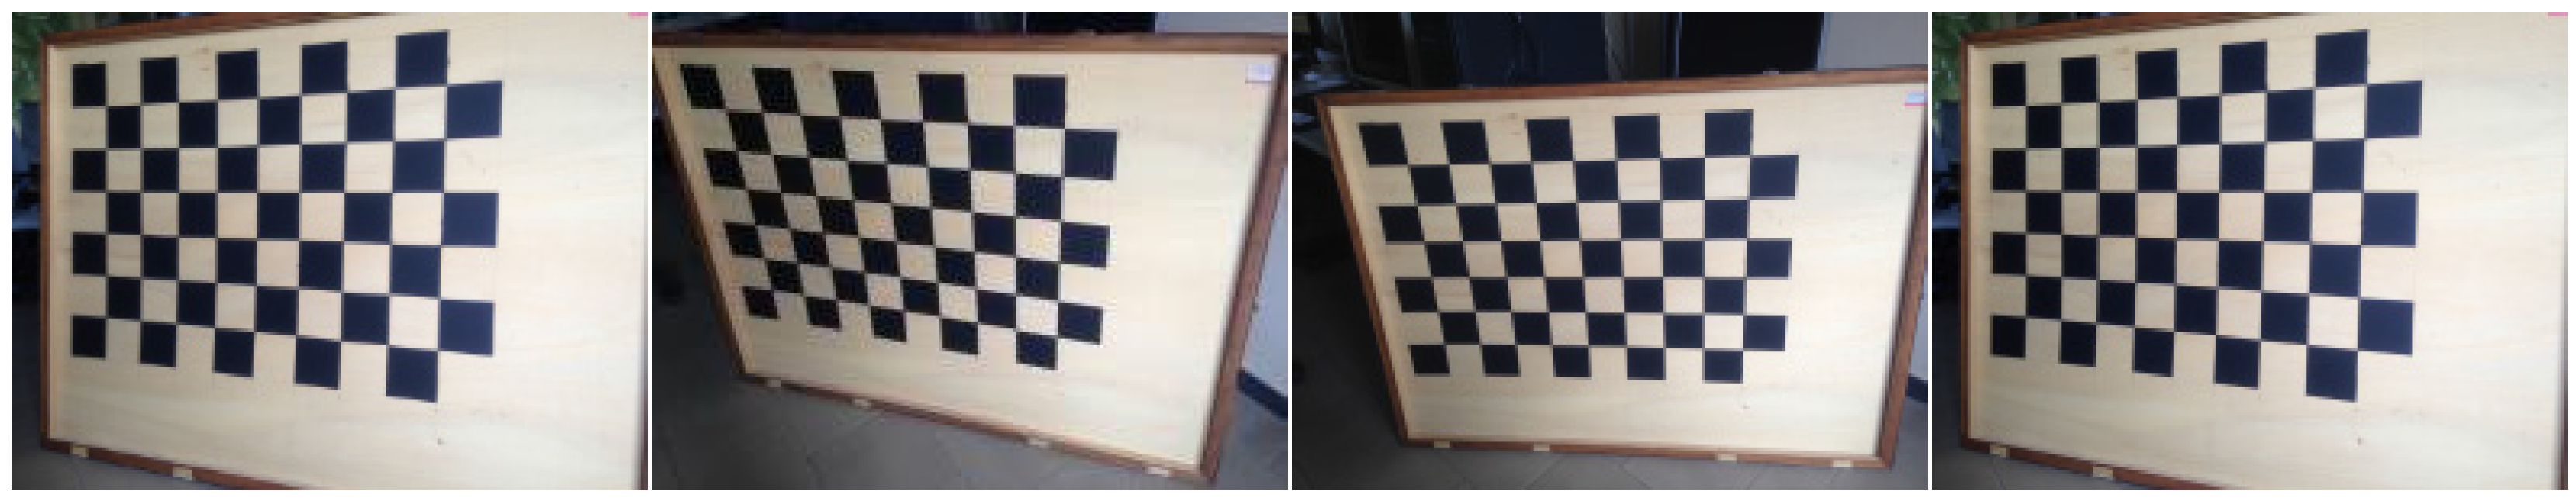
To include the calibration process in the IRBP procedure, the “Camera Calibrator” tool of MATLAB was tested. This tool can estimate intrinsic, extrinsic, and lens distortion parameters to remove the distortion effects and to reconstruct the 3D scene. The application requires the use of a specific checkerboard pattern that must not be square (Figure 11). The images of the pattern must be acquired with a fixed zoom and focus. The calibration requires at least three images, but it is suggested to use 10–20 images from different distances and orientations to obtain the best results. The tool’s data browser displays the images with the detected points, due to the not square checkerboard pattern. A reference system is also defined using the different numbers of squares in the two directions. The calibration algorithm assumes a pinhole camera model, and after processing the applications, displays the results and the accuracies of the process.
In this work, the self-calibration was made on the three different smartphones used in the procedure of IBRP, and the results are shown in Table 1.
After the internal calibration, to define the position and attitude of the acquired smartphone images and then use it as “ground-truth”, a photogrammetric process was employed. In the case of single-shot acquisition, it is possible to perform s single image adjustment (or pyramid vertex) that allows us to evaluate the coordinates of the acquisition point (X0, Y0, and Z0) and the assets as well (ω, ϕ 
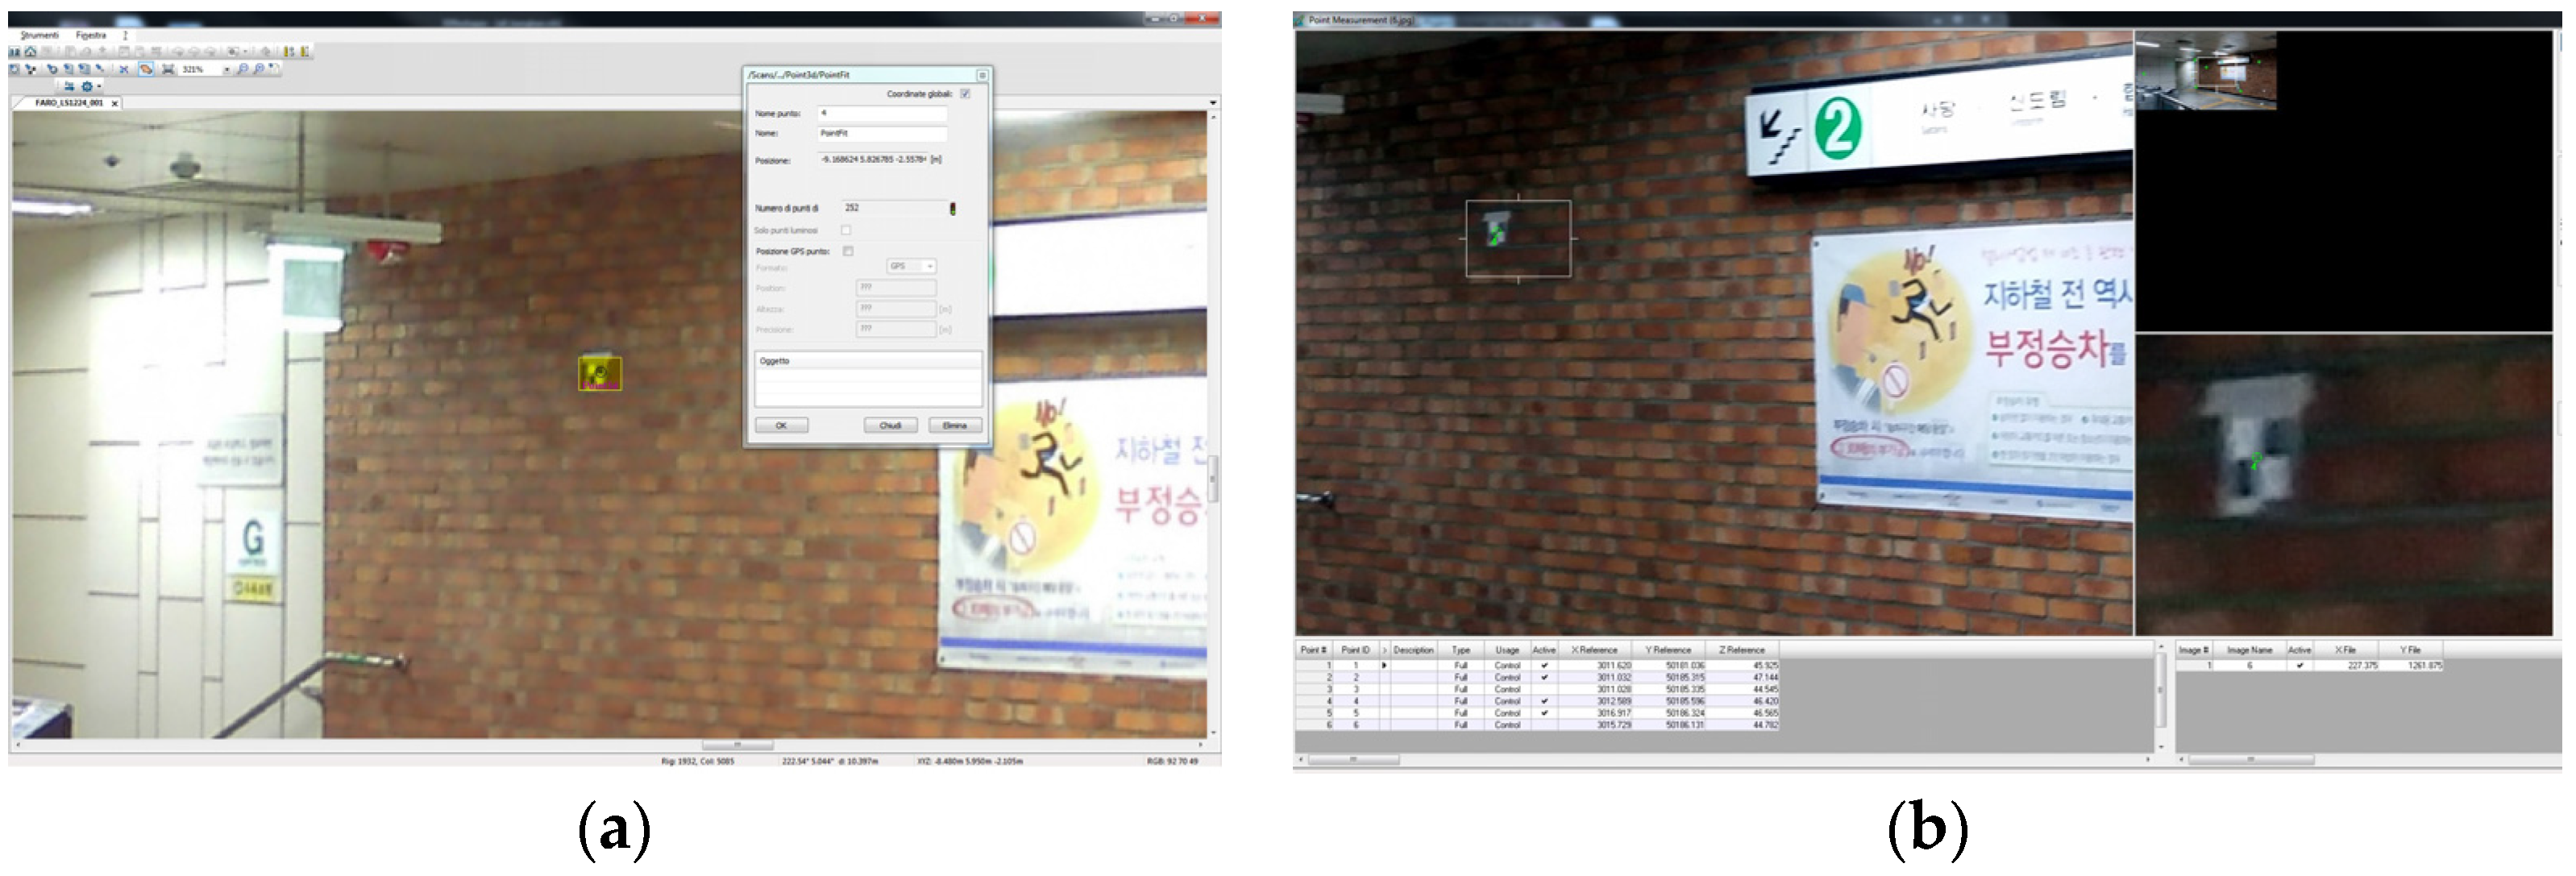
, and κ). For this task, at least six collinearity equations must be written which means that to perform this process, three plano-altimetric GCPs are required. The coordinates of the GCPs were extracted directly from the previous LiDAR point clouds using Scene. First, a visible point was selected on the smartphone image. Afterwards, the same point was measured on the point cloud, and the coordinate were extracted. These values (coordinates) were used as GCPs in the employed photogrammetric software (Figure 12). In the present research, Erdas Imagine by Hexagon Geospatial was employed for the process. To have an accurate control of the results, at least six points were used as GCPs. The final precision for all the analysed images was around 5 cm for the position and around 10 mgon for the angular values. Twenty query images were used for the check for Bangbae station (10 images for each floor) and 10 images were used for the ETRI building.
As stated in Section 3.2, the visual search technology allows us to retrieve the best reference images form the RGB-D images database and ranked them with a priority score. These procedures were applied on the selected query images for both the test sites, and the results of the extraction are shown in Table 2 for the Bangbae metro station and in Table 3 for the ETRI building. In these tables, the obtained scores of the 1st ranked image selected by the CDVS server are reported. This is the best solutions from the three possible candidates proposed by CDVS. As shown in Table 2, the score is always greater than 3, indicating quite good solutions. In most cases, the score is greater than 5, indicating a good solution. The time for the query retrieval process is estimated at about treee seconds. In the second test site, 10 check images have been acquired by the smartphone Samsung S7. The results of the reference image extraction using CDVS are greater than 3, indicating quite good solutions, excluding Image No. 2 (score = 2.54) that was ignored since the resulting IRBL solution was incorrect.

6. Results

After the data acquisition and processing for the DB generation and the image retrieval and ground truth definition, the next step was applying the IRBL algorithm to define the position and orientation of the acquired smartphone camera. This step was applied on the 30 acquired images using as query and was completed automatically using the proposed algorithm described in Section 3.3.

6.1. Accuracy Evaluation

The images were located in a few seconds using the RGB-D images extracted by CDVS as reference images.
The results for the Bangbae test site have been summarised in Table 4 (main floor, A5 smartphone) and Table 5 (train floor, S5 smartphone). The table illustrates:
  • The IRBL and ground truth results for the best solutions (Images 4 and 17) and the worst solutions (Images 8 and 16) for two analysed floors;
  • The discrepancies between the IRBL solutions and the ground truth for the best solutions and the worst solutions expressed by the differences from the six external orientation parameters of IRBL and ground truth results; and
  • Some statistical parameters (min, max, mean, and root mean squares error = RMSE) of discrepancies.
We found the following results:
  • The discrepancies in X, Y, and Z are always lower than 1.5 m in absolute value, excluding the gross error of Image 12 in X. According to the shape of the train floor (long and narrow)m some critical problems of incorrect geometry of feature points were founded,
  • The standard deviations of the discrepancies in X is about 1 m and in Y is about 50 cm, which is the XY quality of DB.
  • The standard deviations of the discrepancy in Z are about 40 cm; this is the Z quality of the DB.
  • The angular values are estimated with a precision of about 10 gon.
  • The estimated averages are not significant for all the parameters; therefore, there are no systematic estimations.
Calculating the relative frequencies of 3D discrepancies, it is possible to define that the 25% of IRBL solutions have discrepancies of less than 0.5 m, the 65% with less than 1 m, and 95% with less than 2 m. An example of a good solution is shown in Figure 13 with a quite good solution in Figure 14.
For the ETRI building, in the present paper, only the discrepancies are reported in Table 6. Excluding Image 2, the discrepancies between IRBL solutions and ground truth are similar to the Bangbae station with some differences. In two cases, the results presents outliers in the Y direction (over 3 m of discrepancies) due to the low number of feature points that are rather close. In the other two cases, there are discrepancies in Z that are very high (over 8 m) due to the similarity between the different floors in the ETRI building causing an incorrect retrieval (Figure 15).

6.2. IRBL Reliability

In the proposed procedure, the estimation of the fundamental matrix between the reference and query images uses a robust estimation algorithm based on RANSAC. This technique can cause a certain variability in the final solution based on the number of sample extractions used. For some images, the IRBL procedure has been repeated 20 times to define the reliability of the solutions (min, max, mean, and RMSE) for the six external orientation parameters. The results are reported in Table 7 to demonstrate the substantial reliability of the estimated solutions. The RMSE corresponding to the nominal precision of this method is less than the estimated accuracy.

7. Conclusions and Future Works

The procedure that is reported in the article is well tested and demonstrates that the first part of the proposed workflow can be successfully performed without problems according to the area that needs to be surveyed. The timeframe is connected to the data acquisition and processing of the LiDAR data. New approaches, such as Kinect, SLAM instruments, ToF cameras, or photogrammetric SfM techniques are under development and have been studied to improve the quickness of the survey operations. Nowadays, the performance of the realised software is stable and work efficiently with a large dataset as well. Further improvements using a new version in C++ are under development to speed up the computational time for the generation of the RGB-D images. The resolution of the generated images is connected to the LiDAR model and especially to the on-board camera that is used for acquiring the RGB information after the scans. Compared to other 3D acquisition devices, this is the best solution. The developed CDVS procedure is efficient and works without any problems, delivering excellent results very quickly during the retrieval process.
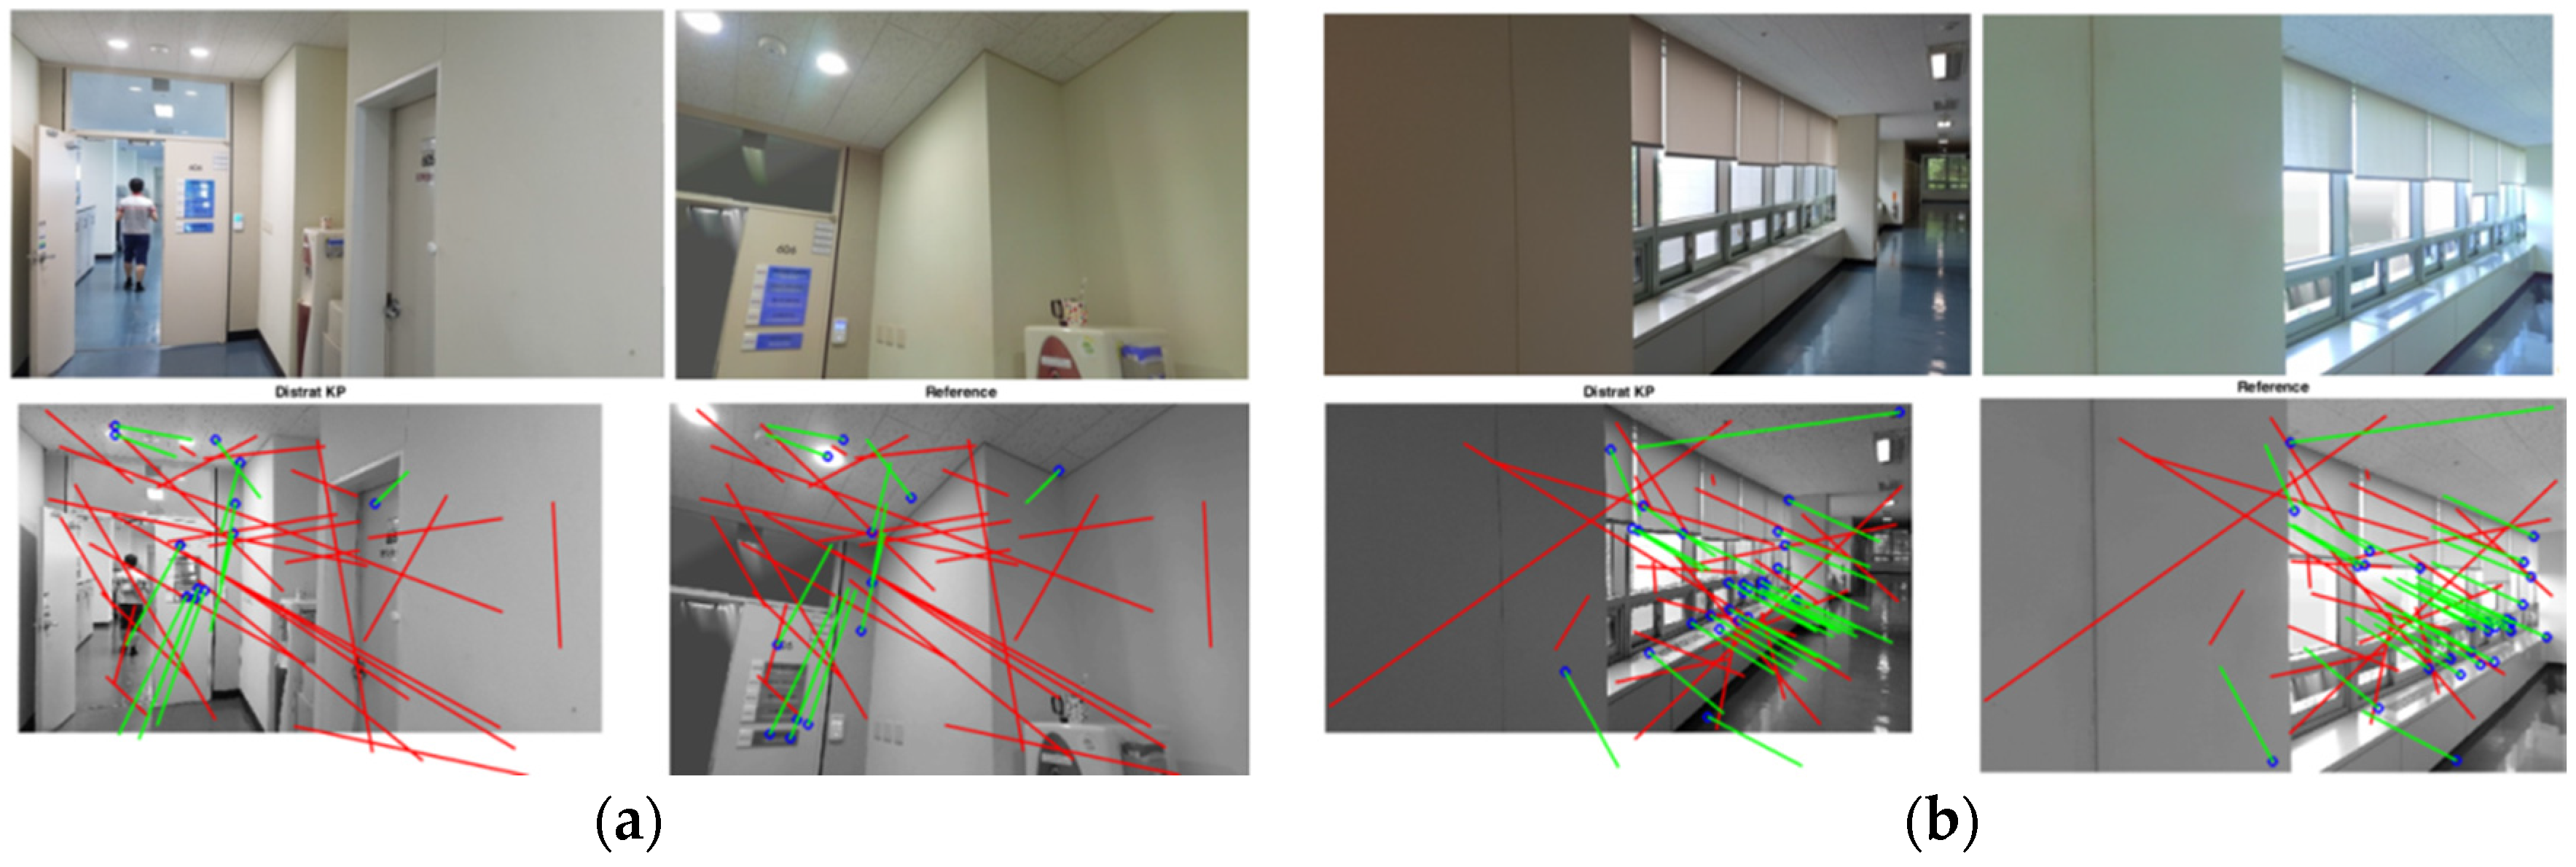
The approach of the IRBL procedure is new. The most important improvement is connected to the use of the DISTRAT algorithm combined with RANSAC that speeds up the process 100 times compared to the use of the RANSAC only. The use of a more controlled photogrammetric approach allows us to evaluate the real accuracy of the positioning, as seen in the reported results. According to the evaluated accuracy in the previous sections, this approach can obtain correct indoor positioning using smartphone images with sub-metrical accuracy for the position and a few gons for attitude. The IRBL can obtain a correct solution in complex conditions (noise due to people, narrow corridors, artificial light, and other environmental problems).
Since the IRBL procedure is under testing, the available application is only developed in MATLAB and needs to be improved using other programming languages to obtain a product with higher performance in terms of usability and speed. The research is still in progress. First, an integration of the survey operation connecting to photogrammetric data and LiDAR data is under evaluation. Moreover, the employment of a Kinect, ToF cameras, and SLAM instruments are good options for the future works. Some first results using the Kinect are promising, and a more accurate analysis of the results is under evaluation. Furthermore, the next steps of the project according to the common research (Politecnico and ETRI) will be the server realisation using the CDVS technology to allow execution of the retrieval using the web.
Finally, the IRBL algorithm will be improved with the new development of a realisation of an application programming interface (API) that will allow to extracting the needed information for the indoor positioning and delivering the results directly on the smartphone.

Acknowledgments

This work was supported by Institute for Information & communications Technology Promotion (IITP) grant funded by the Korea government (MSIP) (R101-16-0306, Development of Autonomous Location Infrastructure DB Update Technology based on User Crowd-sourcing).

Author Contributions

All authors have equally contributed to the research and to the realization of the present article.

Conflicts of Interest

The authors declare no conflict of interest.

References

  1. Li, S.; Qin, Z.; Song, H. A temporal-spatial method for group detection, locating and tracking. IEEE Access 2016, 4, 4484–4494. [Google Scholar]
  2. Zhou, Y.; Zlatanova, S.; Wang, Z.; Zhang, Y.; Liu, L. Moving human path tracking based on video surveillance in 3D indoor scenarios. ISPRS Ann. Photogramm. Remote Sens. Spat. Inf. Sci. 2016, 4, 97–101. [Google Scholar] [CrossRef]
  3. Werner, M.; Hahn, C.; Schauer, L. DeepMoVIPS: Visual indoor positioning using transfer learning. In Proceedings of the 7th International Conference on Indoor Positioning and Indoor Navigation (IPIN), Madrid, Spain, 5–7 October 2016.
  4. Fisher, J.A. Indoor positioning and digital management: Emerging surveillance regimes in hospitals. In Surveillance and Security: Technological Politics and Power in Everyday Life; Taylor & Francis: New York, NY, USA, 2006; pp. 77–88. [Google Scholar]
  5. Zetik, R.; Shen, G.; Thomä, R. Evaluation of requirements for UWB localization systems in home-entertainment applications. In Proceedings of the 2010 International Conference on Indoor Positioning and Indoor Navigation (IPIN), Zurich, Switzerland, 15–17 September 2010.
  6. Tellez, M.; El-Tawab, S.; Heydari, H.M. Improving the security of wireless sensor networks in an IoT environmental monitoring system. In Proceedings of the 2016 Systems and Information Engineering Design Symposium (SIEDS), Charlottesville, VA, USA, 29 April 2016.
  7. Xiao, Z.; Havyarimana, V.; Li, T.; Wang, D. A nonlinear framework of delayed particle smoothing method for vehicle localization under non-Gaussian environment. Sensors 2016, 16, 692. [Google Scholar] [CrossRef] [PubMed]
  8. Kagawa, T.; Li, H.-B.; Ryu, M. A UWB navigation system aided by sensor-based autonomous algorithm-Deployment and experiment in shopping mall. In Proceedings of the 2014 International Symposium on Wireless Personal Multimedia Communications (WPMC), Sydney, Australia, 7–10 September 2014.
  9. Liu, J.J.; Philips, C.; Daniilidis, K. Video-based localization without 3D mapping for the visually impaired. In Proceedings of the IEEE Computer Society Conference Computer Vision and Pattern Recognition Workshops (CVPRW), San Francisco, CA, USA, 13–18 June 2010; pp. 23–30.
  10. Liang, J.Z.; Corso, N.; Turner, E.; Zakhor, A. Image based localization in indoor environments. In Proceedings of the 2013 Fourth International Conference on Computing for Geospatial Research and Application (COM. Geo), San Jose, CA, USA, 22–24 July 2013; pp. 70–75.
  11. Anwar, Q.; Malik, A.W.; Thornberg, B. Design of coded reference labels for indoor optical navigation using monocular camera. In Proceedings of the International Conference Indoor Positioning and Indoor Navigation (IPIN), Montbeliard, France, 28–31 October 2013; pp. 1–8.
  12. Ijaz, F.; Yang, H.K.; Ahmad, A.W.; Lee, C. Indoor positioning: A review of indoor ultrasonic positioning systems. In Proceedings of the 15 International Conference Advanced Communication Technology (ICACT), Pyeongchang, Korea, 27–30 January 2013; pp. 1146–1150.
  13. Bumgon, K.; Wonsun, B.; Kim, Y.C. Indoor localization for Wi-Fi devices by cross-monitoring AP and weighted triangulation. In Proceedings of the IEEE Consumer Communications and Networking Conference (CCNC), Las Vegas, NV, USA, 9–12 January 2011.
  14. Lau, E.E.L.; Chung, W.Y. Enhanced RSSI-based real-time user location tracking system for indoor and outdoor environments. In Proceedings of the International Conference on Convergence Information Technology, Gyeongju, Korea, 21–23 November 2007.
  15. Cui, X.; Gulliver, T.A.; Song, H.; Li, J. Real-time positioning based on millimeter wave device to device communications. IEEE Access 2016, 4, 5520–5530. [Google Scholar] [CrossRef]
  16. Dabove, P.; Ghinamo, G.; Lingua, A.M. Inertial sensors for smartphones navigation. Springerplus 2015, 4, 1–18. [Google Scholar] [CrossRef] [PubMed]
  17. Piras, M.; Dabove, P. Comparison of two different mass-market IMU generations: Bias analyses and real time applications. In Proceedings of the 2016 IEEE/ION Position, Location and Navigation Symposium, PLANS 2016, Savannah, GA, USA, 11–14 April 2016.
  18. Dabove, P.; Aicardi, I.; Grasso, N.; Lingua, A.; Ghinamo, G.; Corbi, C. Inertial sensors strapdown approach for hybrid cameras and MEMS positioning. In Proceedings of the 2016 IEEE/ION Position, Location and Navigation Symposium, PLANS 2016, Savannah, GA, USA, 11–14 April 2016.
  19. Mautz, R.; Sebastian, T. Survey of optical indoor positioning systems. In Proceedings of the 2011 International Conference on Indoor Positioning and Indoor Navigation (IPIN), Madrid, Spain, 21–23 September 2011.
  20. Huang, A.S.; Bachrach, A.; Henry, P.; Krainin, M.; Maturana, D.; Fox, D.; Roy, N. Visual odometry and mapping for autonomous flight using an RGB-D camera. In Robotics Research; Springer: Berlin, Germany, 2017; pp. 235–252. [Google Scholar]
  21. Lima, M.V.; Bastos, V.B.; Kurka, P.R.; Araujo, D.C. vSlam experiments in a custom simulated environment. In Proceedings of the 2015 International Conference on Indoor Positioning and Indoor Navigation (IPIN), Banff, AB, Canada, 13–16 October 2015.
  22. Levchev, P.; Krishnan, M.N.; Yu, C.; Menke, J.; Zakhor, A. Simultaneous fingerprinting and mapping for multimodal image and WiFi indoor positioning. In Proceedings of the 2014 International Conference on Indoor Positioning and Indoor Navigation (IPIN), Busan, Korea, 27–30 October 2014.
  23. Liu, L.; Sisi, Z. A semantic data model for indoor navigation. In Proceedings of the Fourth ACM SIGSPATIAL International Workshop on Indoor Spatial Awareness, Redondo Beach, CA, USA, 6 November 2012; ACM: New York, NY, USA, 2012. [Google Scholar]
  24. Li, X.; Fang, M.; Zhang, J.J.; Wu, J. Learning coupled classifiers with RGB images for RGB-D object recognition. Pattern Recognit. 2017, 61, 433–446. [Google Scholar] [CrossRef]
  25. Kawaji, H.; Hatada, K.; Yamasaki, T.; Aizawa, K. Image-based indoor positioning system: Fast image matching using omnidirectional panoramic images. In Proceedings of the 1st ACM International Workshop on Multimodal Pervasive Video Analysis, Firenze, Italy, 29 October 2010.
  26. Liang, J.Z.; Corso, N.; Turner, E.; Zakhor, A. Image-based positioning of mobile devices in indoor environments. In Multimodal Location Estimation of Videos and Images; Springer: Berlin, Germany, 2005; pp. 85–99. [Google Scholar]
  27. Dong, J.; Xiao, Y.; Noreikis, M.; Ou, Z.; Ylä-Jääski, A. Demo: iMoon: Using Smartphones for Image-based Indoor Navigation. In Proceedings of the 13th ACM Conference on Embedded Networked Sensor Systems, Seoul, Korea, 1–4 November 2015; pp. 449–450.
  28. Cho, Y.S.; Ji, M.; Kim, J.Y.; Jeon, J.I. High-scalable 3D indoor positioning algorithm using loosely-coupled Wi-Fi/sensor integration. In Proceedings of the 17th International Conference on Advanced Communication Technology (ICACT), Pyeongchang, Korea, 1–3 July 2015; pp. 96–99.
  29. Yang, J.; Xu, R.; Lv, Z.; Song, H. Analysis of camera arrays applicable to the internet of things. Sensors 2016, 16, 421. [Google Scholar] [CrossRef] [PubMed]
  30. Bornaz, L.; Dequal, S. A new concept: The solid image. In Proceedings of the XIXth International Symposium, CIPA 2003: New Perspectives to Save Cultural Heritage, Antalya, Turkey, 30 September–4 October 2003.
  31. Lingua, A.; Aicardi, I.; Ghinamo, G.; Corbi, C.; Francini, G.; Lepsoy, S.; Lovisolo, P. The MPEG7 Visual Search Solution for image recognition based positioning using 3D models. In Proceedings of the 27th International Technical Meeting of the Satellite Division of the Institute of Navigation (ION GNSS+ 2014), Tampa, FL, USA, 8–12 September 2014; pp. 2078–2088.
  32. Sikora, T. Visual Standard for Content Description—An Overview, Sikora. Available online: http://0-ieeexplore-ieee-org.brum.beds.ac.uk/document/927422/ (accessed on 17 January 2017).
  33. ISO/IEC JTC1/SC29/WG11/W13564 Test Model 6: Compact Descriptors for Visual Search. Available online: http://www.iso.org/iso/home/store/catalogue_tc/catalogue_detail.htm?csnumber=65393 (accessed on 17 February 2017).
  34. Lowe, D. Distinctive image features from scale-invariant keypoints. Int. J. Comput. Vis. 2004, 60, 91–110. [Google Scholar] [CrossRef]
  35. Lepsoy, S.; Francini, G.; Cordara, G.; de Gusmao, P.P. Statistical modelling of outliers for fast visual search. In Proceedings of the IEEE International Conference on Multimedia and Expo (ICME), Barcelona, Spain, 11–15 July 2011; pp. 1–6.
  36. Giovanni Cordara, Gianluca Francini, Skjalg Lepsoy, Pedro Porto Buarque De Gusmao. Method and System for Comparing Images. US 9008424 B2, 14 April 2015.
  37. Gianluca Francini, Skjalg Lepsoy. Method and System for Comparing Images. US 9245204 B2, 26 January 2016.
  38. Hartley, R.; Zisserman, A. Multiple View Geometry in Coputer Vision, 2nd ed.; Cambridge University Press: Cambridge, UK, 2004. [Google Scholar]
  39. Chris, J.M.; Edward, M.M.; James, S.B. Manual of Photogrammetry, 5th ed.; ASPRS: Bethesda, MD, USA; pp. 280–281.
  40. CDVS. Compact Descriptors for Visual Search; ISO/IEC DIS 15938-13; CDVS: Oakland, CA, USA, 2014. [Google Scholar]
  41. Vedaldi, A. An Open Implementation of the SIFT Detector and Descriptor; UCLA CSD Technical Report 070012; UCLA: Los Angeles, CA, 2007. [Google Scholar]
  42. Karara, H.M. Non Topography Photogrammetry, 2nd ed.; ASPRS: Bethesda, Maryland, USA; pp. 46–48.
  43. Baarda, W. A Testing Procedure for Use in Geodetic Networks; NCG: Delft, The Netherlands, 1968; pp. 53–55. [Google Scholar]
  44. Kraus, K. Photogrammetry: Geometry from Images and Laser Scans; Walter de Gruyter: Berlin, Germany, 2017; Volume 1, pp. 21–29, 184–189. [Google Scholar]
  45. Balletti, C.; Guerra, F.; Vernier, P.; Studnicka, N.; Riegl, J.; Orlandini, S. Practical Comparative Evaluation of an Integrated Hybrid Sensor Based on Photogrammetry and Laser Scanning for Architectural Representation. Available online: http://www.isprs.org/proceedings/XXXV/congress/comm5/papers/612.pdf (accessed on 17 January 2017).
  46. Bastonero, P.; Donadio, E.; Chiabrando, F. ASpanò fusion of 3d models derived from TLS and image-based techniques for CH enhanced documentation. In Proceedings of the ISPRS Annals of the Photogrammetry, Remote Sensing and Spatial Information Sciences, Riva Del Garda, Italy, 23–25 June 2014.
  47. Noardo, F. Dense Image Matching Per Il Recupero Di Contenuto Metrico Da Immagini Di Documentazione E Camere Non Metriche. Available online: http://sifet.org/sifet/phocadownloadpap/sifet1_2015_noardo_abs.pdf (accessed on 17 January 2017).
  48. Hao Men, Biruk Gebre, Kishore Pochiraju Color point cloud registration with 4D ICP algorithm. In Proceedings of the IEEE International Conference on Robotics and Automation, Shanghai, China, 9–13 May 2011.
  49. Paul, B.J.; McKay, N.D. A method for registration of 3-D shapes. In IEEE Transaction on Pattern Analysis and Machine Intelligence; IEEE Computer Society: Los Alamitos, CA, USA, 1992; pp. 239–256. [Google Scholar]
  50. Chen, Y.; Gerard, M. Object modelling by registration of multiple range images. In Image Vision Computing; Butterworth-Heinemann: Newton, MA, USA, 1991; pp. 145–155. [Google Scholar]
  51. Zhang, Z. Iterative point matching for registration of free-form curves and surfaces. Int. J. Comput. Vis. 1994, 13, 119–152. [Google Scholar] [CrossRef]
Figure 1. Workflow of the image recognition based location (RBL) procedure.
Ijgi 06 00056 g001
Figure 2. RGB-D structure.
Ijgi 06 00056 g002
Figure 3. An example of definition of RGB-D axis directions for each position.
Ijgi 06 00056 g003
Figure 4. The selection sphere for RGB-D image generation.
Ijgi 06 00056 g004
Figure 5. (a) Example of six RGB-D images generated with the software ScanToRGBDImage in RGB visualization; and (b) example of six RGB-D images in a depth map visualisation.
Ijgi 06 00056 g005
Figure 6. (a) An indoor Bangbae station view; and (b) a typical aisle in the ETRI building.
Ijgi 06 00056 g006
Figure 7. (a) GNSS acquisition; (b) total station measurements; and (c) an example of two markers positioned in the surveyed area.
Ijgi 06 00056 g007
Figure 8. (a) Prospectic views; and (b) 3D view of the complete point cloud of Bangbae station.
Ijgi 06 00056 g008
Figure 9. (a) Lateral view; and (b) 3D view of the ETRI building point cloud.
Ijgi 06 00056 g009
Figure 10. (a) An example of an RGB image in Bangbae; and (b) the corresponding range image. (c) An example in the ETRI building; and (d) the corresponding range image.
Ijgi 06 00056 g010
Figure 11. Some images of the checkerboard acquired by a smartphone for camera calibration.
Ijgi 06 00056 g011
Figure 12. (a) GCP coordinate extraction from LiDAR data; and (b) GCP measurement in Erdas.
Ijgi 06 00056 g012
Figure 13. A good solution for Bangbae station, Image 17: (a) query image; (b) reference image from DB; (c) query image; and (d) reference image with used feature points; the matched points that have been rejected are in red.
Ijgi 06 00056 g013
Figure 14. An example of quite good solution for Bangbae station, image No. 8: (a) query image; (b) reference image from DB; (c) query image; and (d) reference image with used feature points; the matched points that have been rejected are in red.
Ijgi 06 00056 g014aIjgi 06 00056 g014b
Figure 15. (a) Worst solution for the ETRI Building due to the low number of feature points that are rather close; and (b) worst solution in Z for the ETRI Building due to image similarity from different floors.
Ijgi 06 00056 g015
Table 1. Internal calibration parameters.
ParametersSamsung Galaxy A5Samsung Galaxy S5Samsung Gal. S7 Edge
Pixel size 1 µm1.14 µm1.4 µm
Focal lengths fx (pixels)3706.04290.83168.7
Focal lengths fy (pixels)3722.64282.83178.9
Princ. Point ξ0 (pixels)2070.12667.81995.3
Princ. Point η0 (pixels)1135.41477.81204.4
Radial distortion K10.13860.11480.3444
Radial distortion K2−0.25870.0100−0.6117
Focal length (mm)3.7144.8014.446
Princ. Point ξ0 (mm)0.0060.014−0.087
Princ. Point η0 (mm)0.0260.018−0.179
Table 2. Results of reference image extraction from the image DB of Bangbae Station using CDVS.
Query ImagesReference Image 1Score
query/1.jpgdataset/b022_i___+0_+0_24_02.jpg8.3
query/10.jpgdataset/b011_i___+0_+0_18_02.jpg20.2
query/2.jpgdataset/b012_i___+0_+0_09_01.jpg8.9
query/3.jpgdataset/b002_i___+0_+0_10_01.jpg7.4
query/4.jpgdataset/b004_i___+0_+0_10_01.jpg17.7
query/5.jpgdataset/b006_i___+0_+0_07_03.jpg15.3
query/6.jpgdataset/b013_i___+0_+0_27_01.jpg31.9
query/7.jpgdataset/b013_i___+0_+0_25_01.jpg9.5
query/8.jpgdataset/b007_i___+0_+0_16_03.jpg4.5
query/9.jpgdataset/b011_i___+0_+0_15_02.jpg48.7
query/11.jpgdataset/v004_i___+0_+0_15_02.jpg42.2
query/12.jpgdataset/v020_i___+0_+0_09_01.jpg4.5
query/13.jpgdataset/v008_i___+0_+0_10_01.jpg3.1
query/14.jpgdataset/v008_i___+0_+0_25_02.jpg12.0
query/15.jpgdataset/v006_i___+0_+0_11_01.jpg3.3
query/16.jpgdataset/v040_i___+0_+0_22_01.jpg6.0
query/17.jpgdataset/v038_i___+0_+0_04_02.jpg59.7
query/18.jpgdataset/v038_i___+0_+0_07_01.jpg11.7
query/19.jpgdataset/v039_i___+0_+0_25_02.jpg3.2
query/20.jpgdataset/v023_i___+0_+0_26_02.jpg8.8
Table 3. Results of reference image extraction from the image DB of ETRI building using CDVS.
Query ImagesReference Image 1Score
query/1_01.jpgdataset/s020_i___+0_+0_25_01.jpg7.27
query/1_02.jpgdataset/s021_i___+0_+0_12_02.jpg2.54
query/2_03(2).jpgdataset/s011_i___+0_+0_12_03.jpg4.54
query/3_03(2).jpgdataset/d011_i___+0_+0_31_01.jpg6.02
query/3_05.jpgdataset/d008_i___+0_+0_29_01.jpg8.51
query/4_01.jpgdataset/s066_i___+0_+0_18_01.jpg6.46
query/4_03(3).jpgdataset/d008_i___+0_+0_17_01.jpg6.56
query/5_01(2).jpgdataset/d012_i___+0_+0_03_01.jpg9.6
query/5_04(2).jpgdataset/d011_i___+0_+0_19_01.jpg6.25
query/5_06.jpgdataset/d012_i___+0_+0_03_01.jpg8.10
Table 4. Accuracy in Bangbae station with Samsung A5.
ImagesNumber of PointsX (m)Y (m)Z (m)ω (gon) ϕ (gon)k (gon)
IRBL algorithm
4713007.4850,177.346.10147.638309.17949.148
8193021.6550,178.6046.32101.725373.332198.649
Ground truth
4 3007.4350,177.3846.12−59.216−110.713242.225
8 3020.7350,179.3746.15305.1−45.201204.819
Discrepancies
ΔX (m)ΔY (m)ΔZ (m)ω (gon) ϕ (gon)k (gon)
4 0.055−0.019−0.0156.85419.8916.922
8 0.930−0.7640.171−3.37518.533−6.170
min−1.001−0.764−0.480−21.016−2.727−6.170
max0.9300.5480.17111.44230.88521.047
mean0.195−0.005−0.089−1.88110.8844.295
RMSE0.5730.4580.1829.22813.3677.998
Table 5. Accuracy in Bangbae station with Samsung S5.
imnpX (m)Y (m)Z (m)ω (gon) ϕ (gon)k (gon)
IRBL algorithm
16192959.1750171.2142.28226.35184.371177.549
173142983.9350177.0341.33101.543−56.282−0.14
Ground truth
16 2960.70450171.9341.016244.87974.385196.816
17 2984.19350177.1941.322101.869−55.630.233
Discrepancies
ΔX (m)ΔY (m)ΔZ (m)ω (gon) ϕ (gon)k (gon)
16 −1.52−0.711.27218.5289.986−19.267
17 −0.26−0.160.008−0.326−0.652−0.373
min−1.52−0.71−0.053−18.989−0.652−19.267
max1.081.441.27218.5289.98613.697
mean0.380.320.2061.0392.233−1.492
RMSE0.910.610.41710.8493.24210.95
Table 6. Accuracy in ETRI building with Samsung Galaxy S7 Edge.
ΔX (m)ΔY (m)ΔZ (m)ω (gon) ϕ (gon)k (gon)
min−0.83−3.57−0.81−9.414−1.705-4.938
max0.343.730.562.6663.9864.446
mean−0.26−0.270.01−1.1931.0520.334
RMSE0.342.130.423.5931.9953.379
Table 7. Reliability analysis in Bangbae station data set.
X (m)Y (m)Z (m)ω (gon)φ (gon)k (gon)
An example: Image n.11
mean3021.4250,173.6146.211.385−0.905−0.116
min3020.8750,173.3946.481.201−1.069−0.215
max3021.8950,174.0746.691.648−0.8040.000
RMSE0.260.280.230.2050.0710.103
Summary of all the query image
RMSE0.120.180.110.0530.0510.158

