Article

Comparative Research of Visual Interpretation of Aerial Images and Topographic Maps for Unskilled Users: Searching for Objects Important for Decision-Making in Crisis Situations

Department of Geography, Faculty of Education, Masaryk University, Porici Str. 7, Brno CZ-60300, Czech Republic
*
Author to whom correspondence should be addressed.
ISPRS Int. J. Geo-Inf. 2017, 6(8), 231; https://0-doi-org.brum.beds.ac.uk/10.3390/ijgi6080231
Submission received: 3 June 2017 / Revised: 21 July 2017 / Accepted: 25 July 2017 / Published: 27 July 2017

Abstract

:
The article presents the results of research focused on the speed and success rate of reading aerial images and topographic maps showing the same territory in the Czech Republic. Attention was focused on searching for objects of importance in terms of disaster management (railway and road bridges, road, watercourse, railway station, airport). The success rate was electronically evaluated by the Hypothesis software as a whole for the image, and the map was created for all respondents and for selected groups of respondents. The results showed that, with the exception of watercourse identification, other strategic objects are found faster and more reliably on color aerial images. No differences in speed and success of interpretation were found between men and women, laymen and experts. Soldiers and crisis management personnel were faster than laymen, but they were equally successful. Color aerial images or color aerial orthophotomaps have thus proved to be a key source of data for effective decision-making on a territory where a crisis event is taking place and where the deployment of a crisis unit is a need.

1. Introduction

Modern technologies of aerial and satellite image analysis in many cases significantly improve their purposeful use. It can be rightfully believed that most of the tasks that are associated with searching for objects and areas of a particular type can be solved using either some suitable software (e.g., for a contextual analysis) or, in a digital environment, such tool can be operatively created. However, both the quality of the imaging material and the technologies available play an important role. Thus, it is commonplace that the optimal state is not reached and the key role in the correct purposeful evaluation of the image is within the competence of the subject of the image reader [1].
The spectrum of potential users of aerial and satellite imagery is extremely large and includes virtually all population groups, as in both everyday and professional life there may be situations where they will face a task of obtaining the necessary information from the available image material. It might be available in an analogue or much more often in digital form. At present, when most households and institutions in the Czech Republic have at least a minimum digital information and communication technology, digital imaging material is more likely to be available. However, this does not mean that the available technology includes appropriate digital image processing tools. Even though the images are in digital form, a decisive part in the correctness of processing the material lies with the person of the processor and especially with his visual perception of the images [2].
An important role is thus played by the personality characteristics of the image processor, the complexity of the task and the time pressure on the task. Apart from health characteristics of the processor, experience with image processing is important, whether acquired by the means of education (in schools, employment courses, interest organizations etc.), or directly by working with the images themselves. Most people are more likely to have to search for some locations or objects of interests on maps (the most common task is to search for something on the map). However, in the event of a crisis situation, people may be faced with an urgent task requiring a quick decision. It is, therefore, interesting to learn how recent publicly accessible imaging materials are comprehensible for the general population. The results may be useful to the scientific, technical and distribution community from which there is a clear interest in the broadest possible social application of remote sensing of the Earth and its products. Some reflections on this interest are brought by the present contribution.

2. Current State-of-Art

Visual perception is to a large extent a process of interpretation and is influenced by the observer’s characteristics, his:
  • biological condition (age, gender, eyesight—sharpness, color vision, outages in the field of vision - , IQ, etc.)
  • psychological and social status (setting, vigilance, interest, motivation, emotional tuning, adaptation, priming).
From biological characteristics, age is the most important for visual perception. Higher age is also manifested by a number of changes in the retinal image, including the decrease in photoreceptors [2]. The loss of light falling on the retina may be up to 90% [3] at the age 70 and more. Children from three years of age begin to understand aerial imagery as a representation of the real world, even though understanding of the images develops until adulthood [4,5,6]. Although airplanes capture land from a bird’s eye perspective as well as maps, they are more readable for children than maps, especially because it is a real representation of the landscape, while map depicts individual elements using different symbols [7]. With increasing age, the ability to find and identify objects and stimuli worsens [8,9], reaction time increases [10,11]; perception of space, orientation and navigation deteriorates [12].
Another frequently discussed biological feature in relation to visual perception is gender. Men have shown slightly better results in tests focused on the ability to solve spatial problems [13,14]. Women recognize colors better and more quickly [15] and they recall colors more easily [16]. Hund and Gill [17] found that women were faster if more stimuli were available for orientation, for men no difference was noted in the time needed to find a way. Middle-aged men showed the best orientation skills; on the contrary, women worsened with age. From the studies by Linn and Petersen [13], Halpern and Crothers [18] show that men are more successful in solving spatial problems when using short-term memory; on the other hand, women recall spatial information better from long-term memory [19,20].
An important clue for recognizing an object is its color, especially if it is typical for the object. Different cases of color blindness are distinguished. The most common is the inability to detect red and green while maintaining blue and yellow perception [21]. Further research on the relationship between color blindness and reading or processing maps has been published by Brewer [22], and Olson and Brewer [23].
In interpreting maps, knowledge of the type of the territory is also positively manifested. Assumptions of what kinds of objects could occur in the region, i.e., object expectation and spatial context, are very important for the process of visual interpretation [24,25]. Similarly, interpretations using typical properties of objects are accompanied by experience—what properties can be expected for a general object [26,27,28].
An important role is also played by cartographic literacy and experience in image reading. Geographers are thus good image-reading experts due to their knowledge of relationships in the landscape [29].
Due to the use of images in extraordinary and crisis situations, the influence of stress has to be taken into account. Stress weakens cognitive functions, concentration, logical and abstract thinking. This weakening is caused by a high level of emotional activity, which disturbs information processing. Under stress, some people resort to developmentally earlier forms of behavior [30]. An effect of stress on thinking and associated weakening of abstract thinking can be expected. In the event of high stress, people may be under great pressure, i.e., reading an image would be less reliable in this situation. In this respect, however, exact research has not been published in the Czech Republic or in the world.

3. Data Collection

In order to determine the state of comprehension of aerial images and maps among the general public in the event of decision-making in crisis situations, it was necessary to create a sufficiently large team of respondents, to offer them appropriate images, to arrange hardware and software for the demonstration of images and registration of the respondents’ response to them and a package of statistical tools for the analysis of the data obtained. The speed and success rate in reading images were compared with reading maps to assess which document is more suitable for operational decision making.
For a comparative analysis of respondents’ reading of images and maps, working hypotheses were formed, a set of methodological steps and source materials taking into account the individual test tasks was prepared (Table 1). With regard to the widest possible application of the results, there was a close cooperation with experts from the Integrated Rescue System (Integrovany zachranny system—in Czech)—firefighters, medical first aid rescuers and police officers.
For each of the research tasks:
  • the content of the interpretation was specified (what type of objects will be searched/interpreted by the respondent);
  • the interpretation method (classification, listing, delimitation) was given;
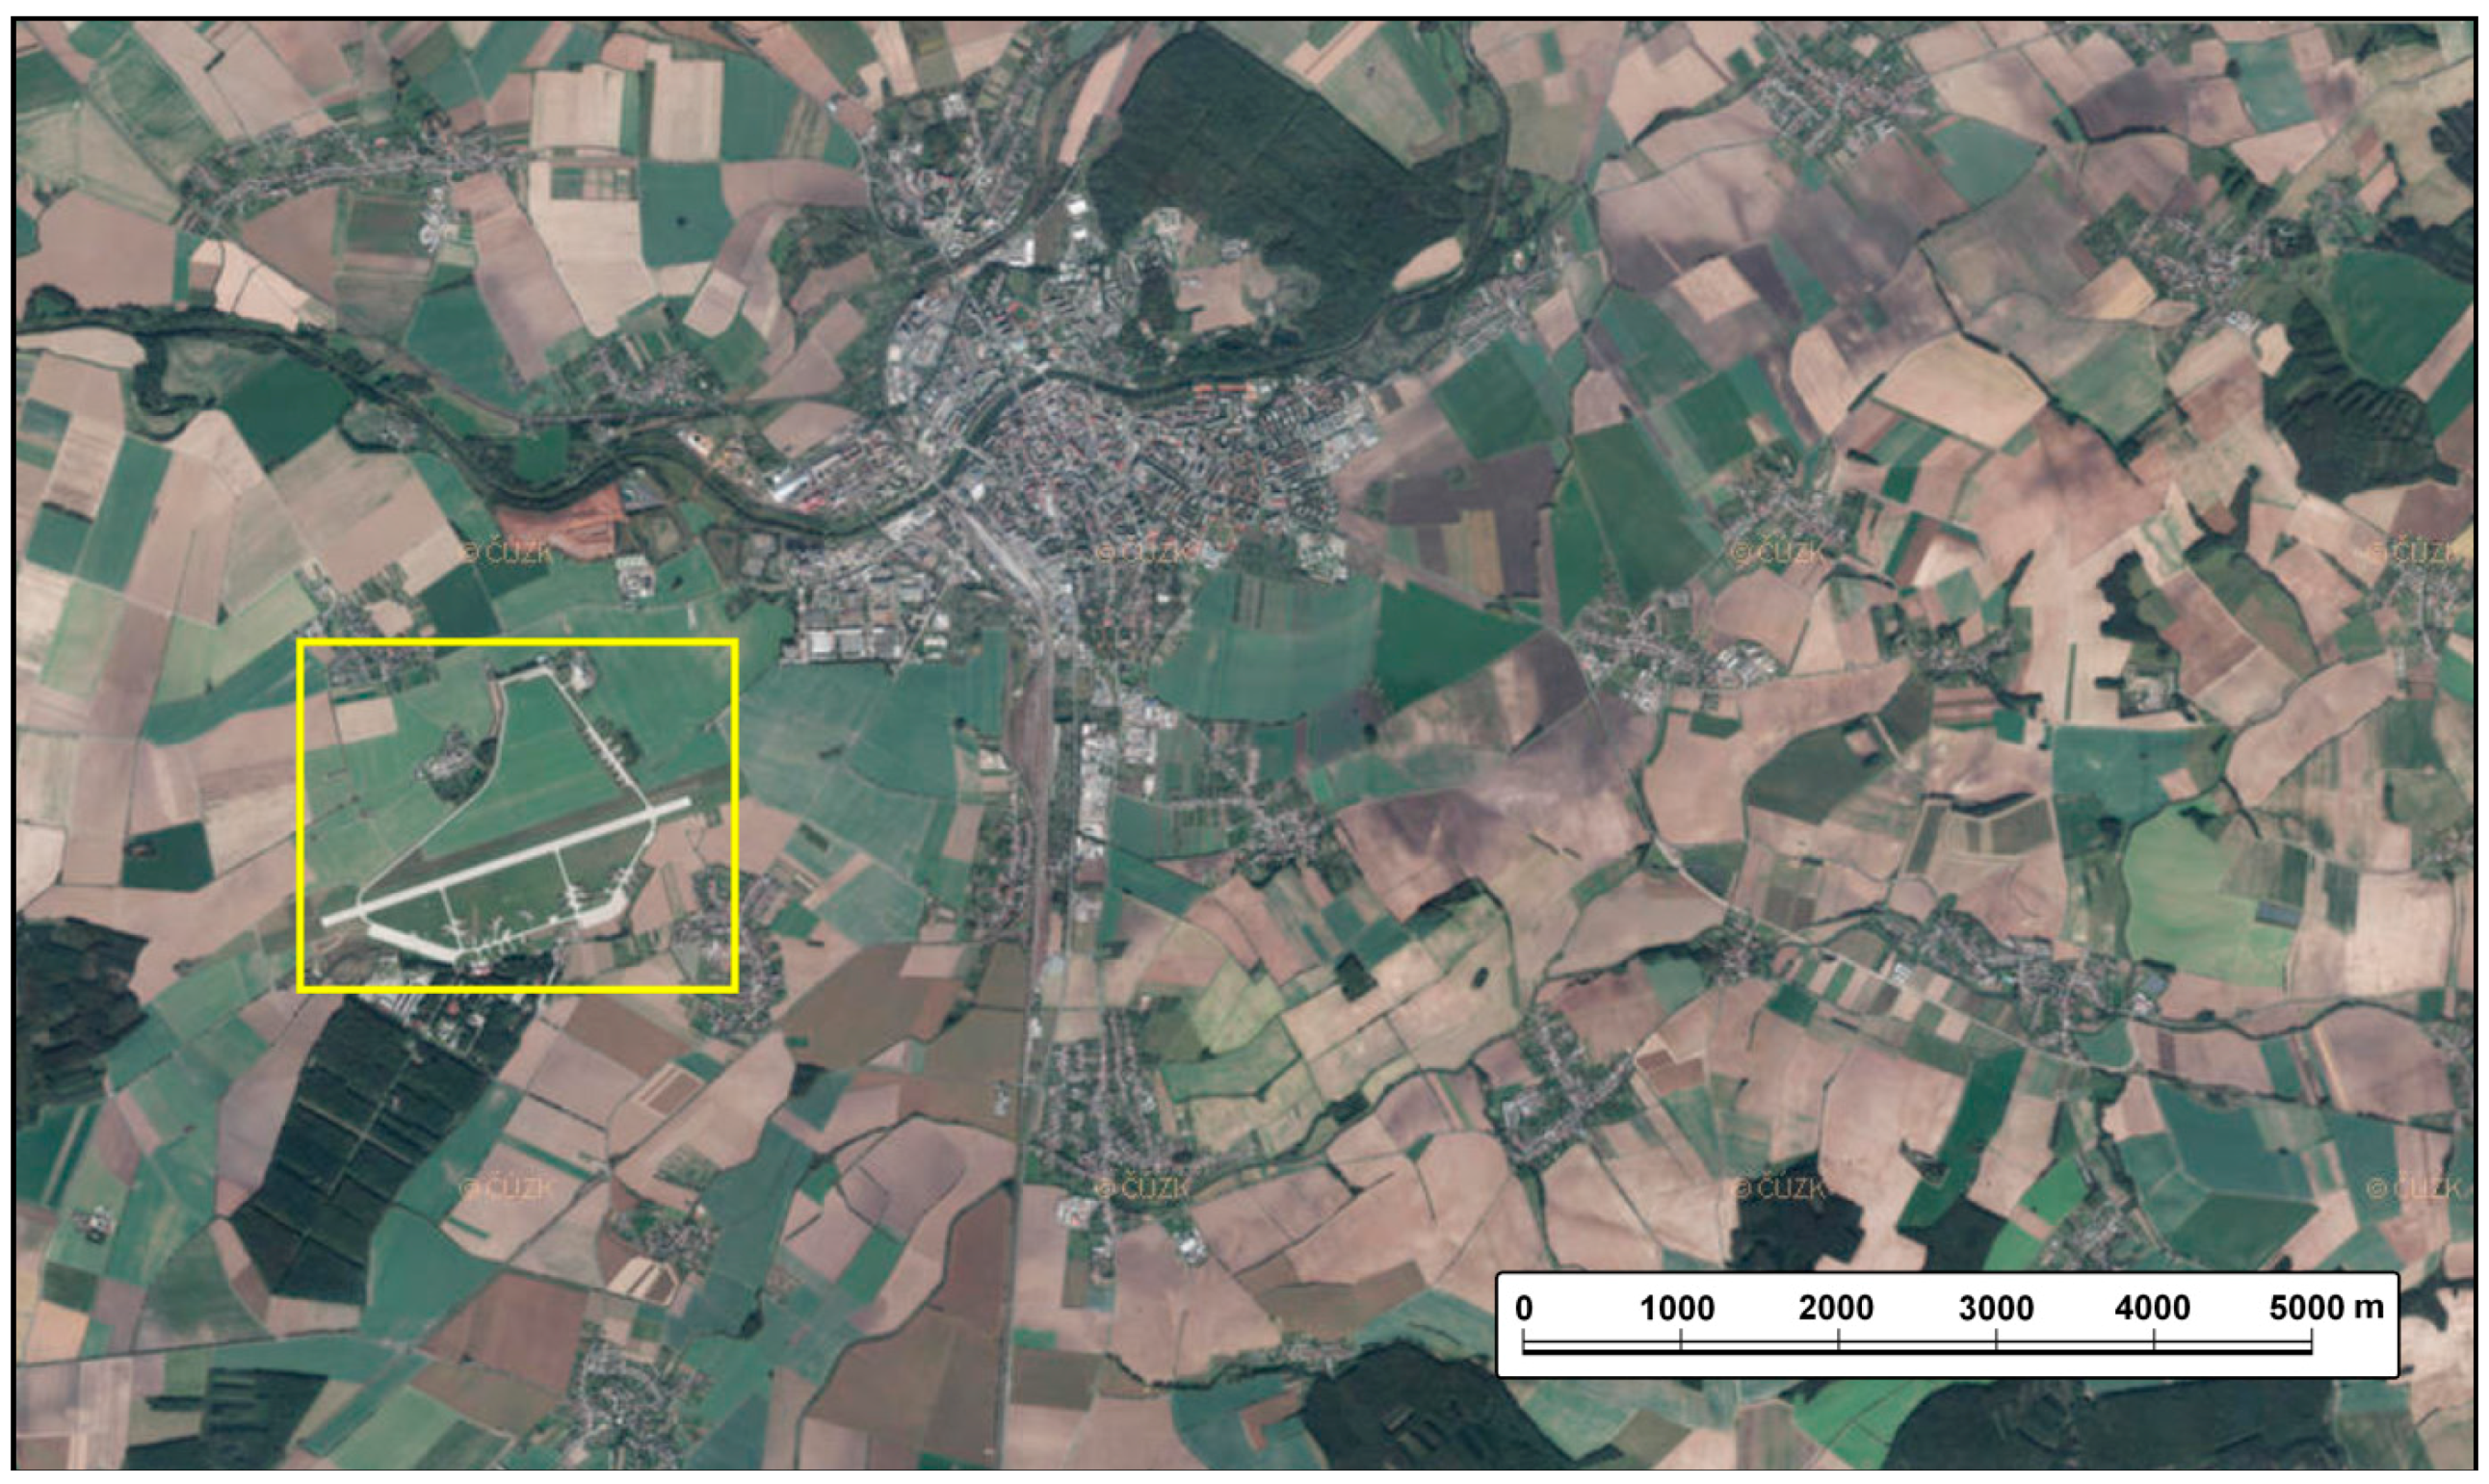
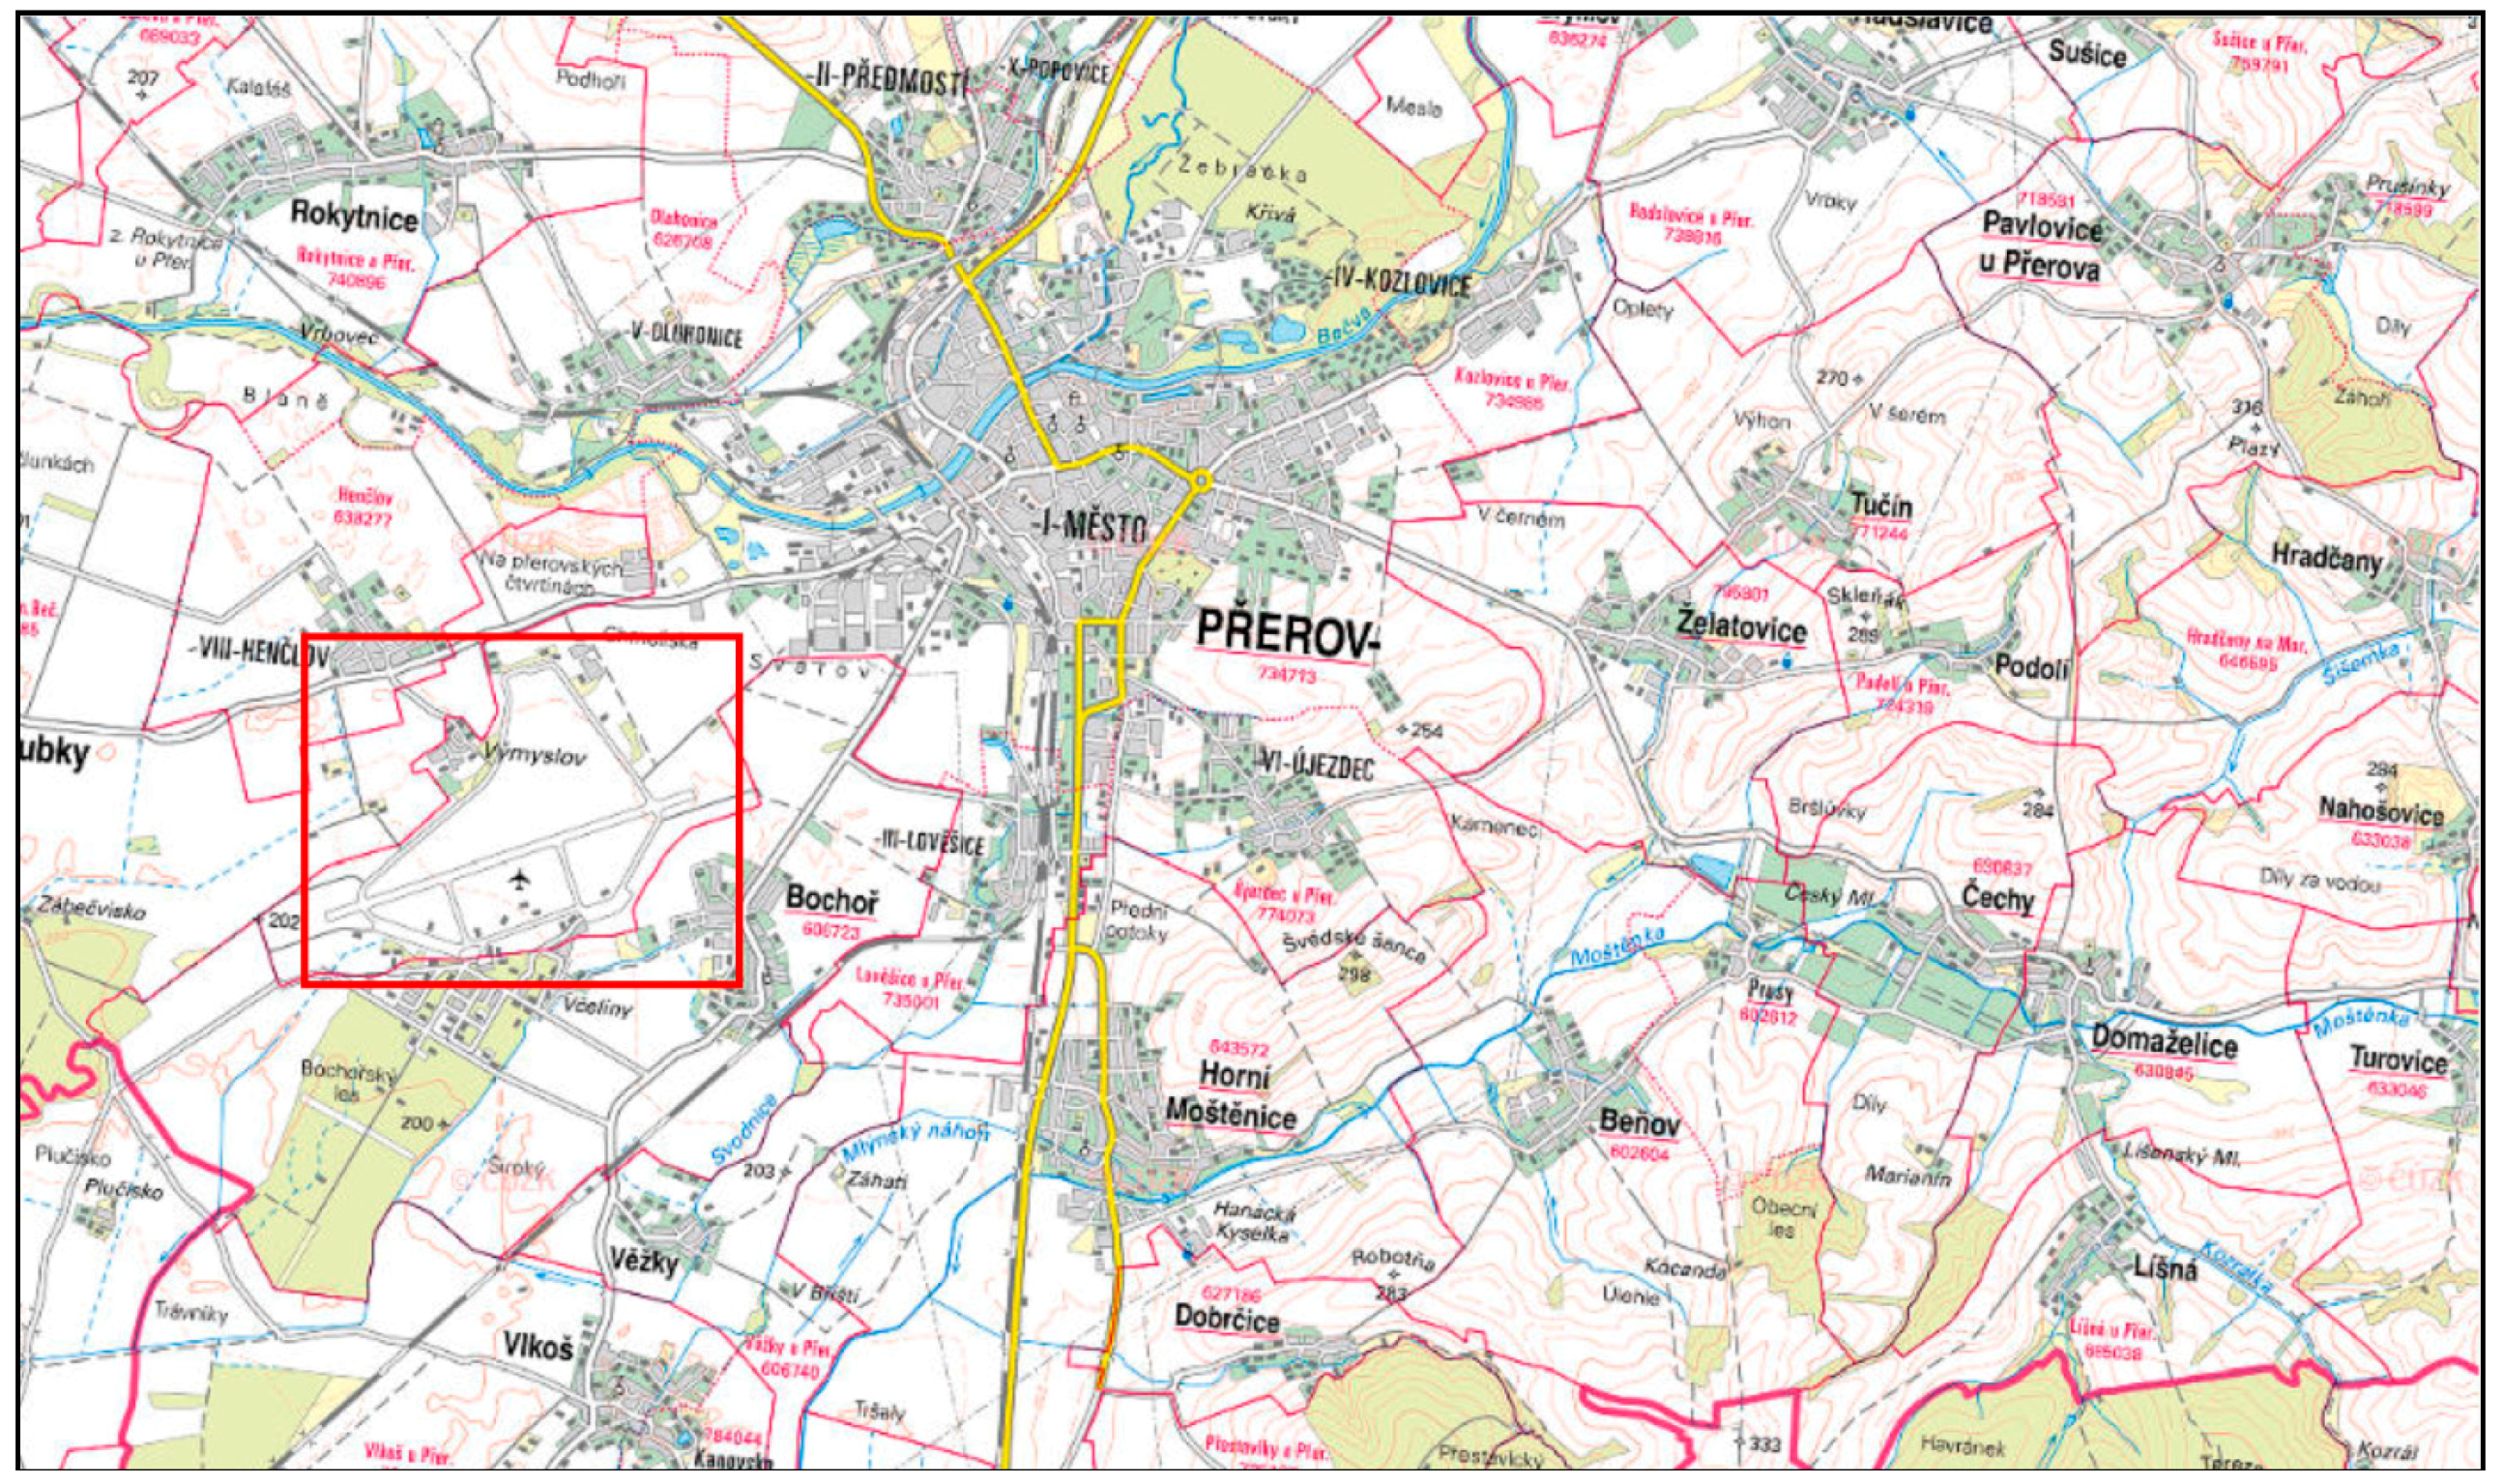
  • a suitable source image and a paired control map were chosen to allow a clear answer (in order to find a railway bridge, an image containing a larger number of bridges, but only a single railway bridge, had to be found);
  • the structure of the tests and their evaluation was prepared;
  • results were statistically processed and conclusions drawn;
  • cooperation with experts from the Integrated Rescue System—firefighters, medical first aid rescuers and police officers was established in checking the suitability of used imagery as typical in their work.
The control objects of image interpretation were:
  • selected critical objects of the built-up area, representing obstacles to movement, possible source of risk or possibility of escape from the risk in progress (bridges, roads, watercourses, airports).
The test image material originated from unknown areas outside the city of Brno, while most of the respondents came from Brno.
The actual preparation of testing, task assignment, sources preparation including test programming, test validation, image testing by respondents, and the analysis of the results took place in 2013 and 2014 with evaluation and generalization of knowledge going on to this date. The works took place in the GIS Laboratory of the Faculty of Education of the Masaryk University and in computer rooms of the Faculty of Science of the Masaryk University, the Faculty of Military Technologies of the University of Defense, Brno City Police, Fire Rescue Service, Ambulance Service of the South Moravian Region, Military Geographic and Hydro-meteorological Office in Dobruska. Because of the large number of test rooms and therefore the hardware used, technical compatibility of the monitors was not ensured.
With regard to the intended test evaluation—comparison of the success and speed differences in solving of tasks on paired source materials from open access sources (pair of aerial image-maps, see figures below), pair testing and corresponding data processing was conducted. The five research hypotheses (see Section 4.1.) were tested at a significance level of 0.05 (i.e., the hypothesis is applicable with 95% probability), p-values were calculated (the probability that the value of the result is an element of the value range that indicates against the validity of the hypothesis at the chosen level of significance). Hypotheses were tested using non-parametric methods (Wilcoxon’s test) and parametric methods (t-test, binomial split test, χ 2 tests, McNemar’s test). The reason of the statistical testing was to have mutually independent data sets (on the speed and on the correctness of the respondent’s reaction) at disposal for the processing and result assessment. Hypotheses testing and data processing were performed with the MATLAB 8.1 computational program, graphical processing of the results was performed with the programs Statistics and MS Excel.
The test was done in pairs, i.e., from each respondent two sets of results for each task were collected. Pair testing (unknown image—unknown map, both at the same scale from the same territory, but without any legend) when evaluating the response speed rate allows to eliminate individual differences given by the respondent’s reading speed and his speed of clicking—the calculations are based only on the difference in both times, i.e., how much the respondent was faster or slower when reading (searching for objects) an image or reading a map.
When selecting sources of materials, the individual images, creating pairs of images and maps, the need to find the best sources for testing under available conditions was taken into account—financially, technically and time-based. Images and maps which are freely accessible on the Internet have been used as the main sources:
  • map server “National Geoportal INSPIRE”;
  • map server “mapy.cz”.
For testing the following materials were used:
  • basic topographic maps, scale 1:10,000, 1:25,000 and 1:50,000;
  • color vertical aerial imagery, resolution 0.5 m.
Orthophotomaps, scale 1:10,000, resolution 0.5 m. For a correct subsequent evaluation of the tasks tested and the verification of the statistical hypotheses, a pairing type was chosen, where the respondents solved the same tasks on two spatially identical sources. The two tested materials were:
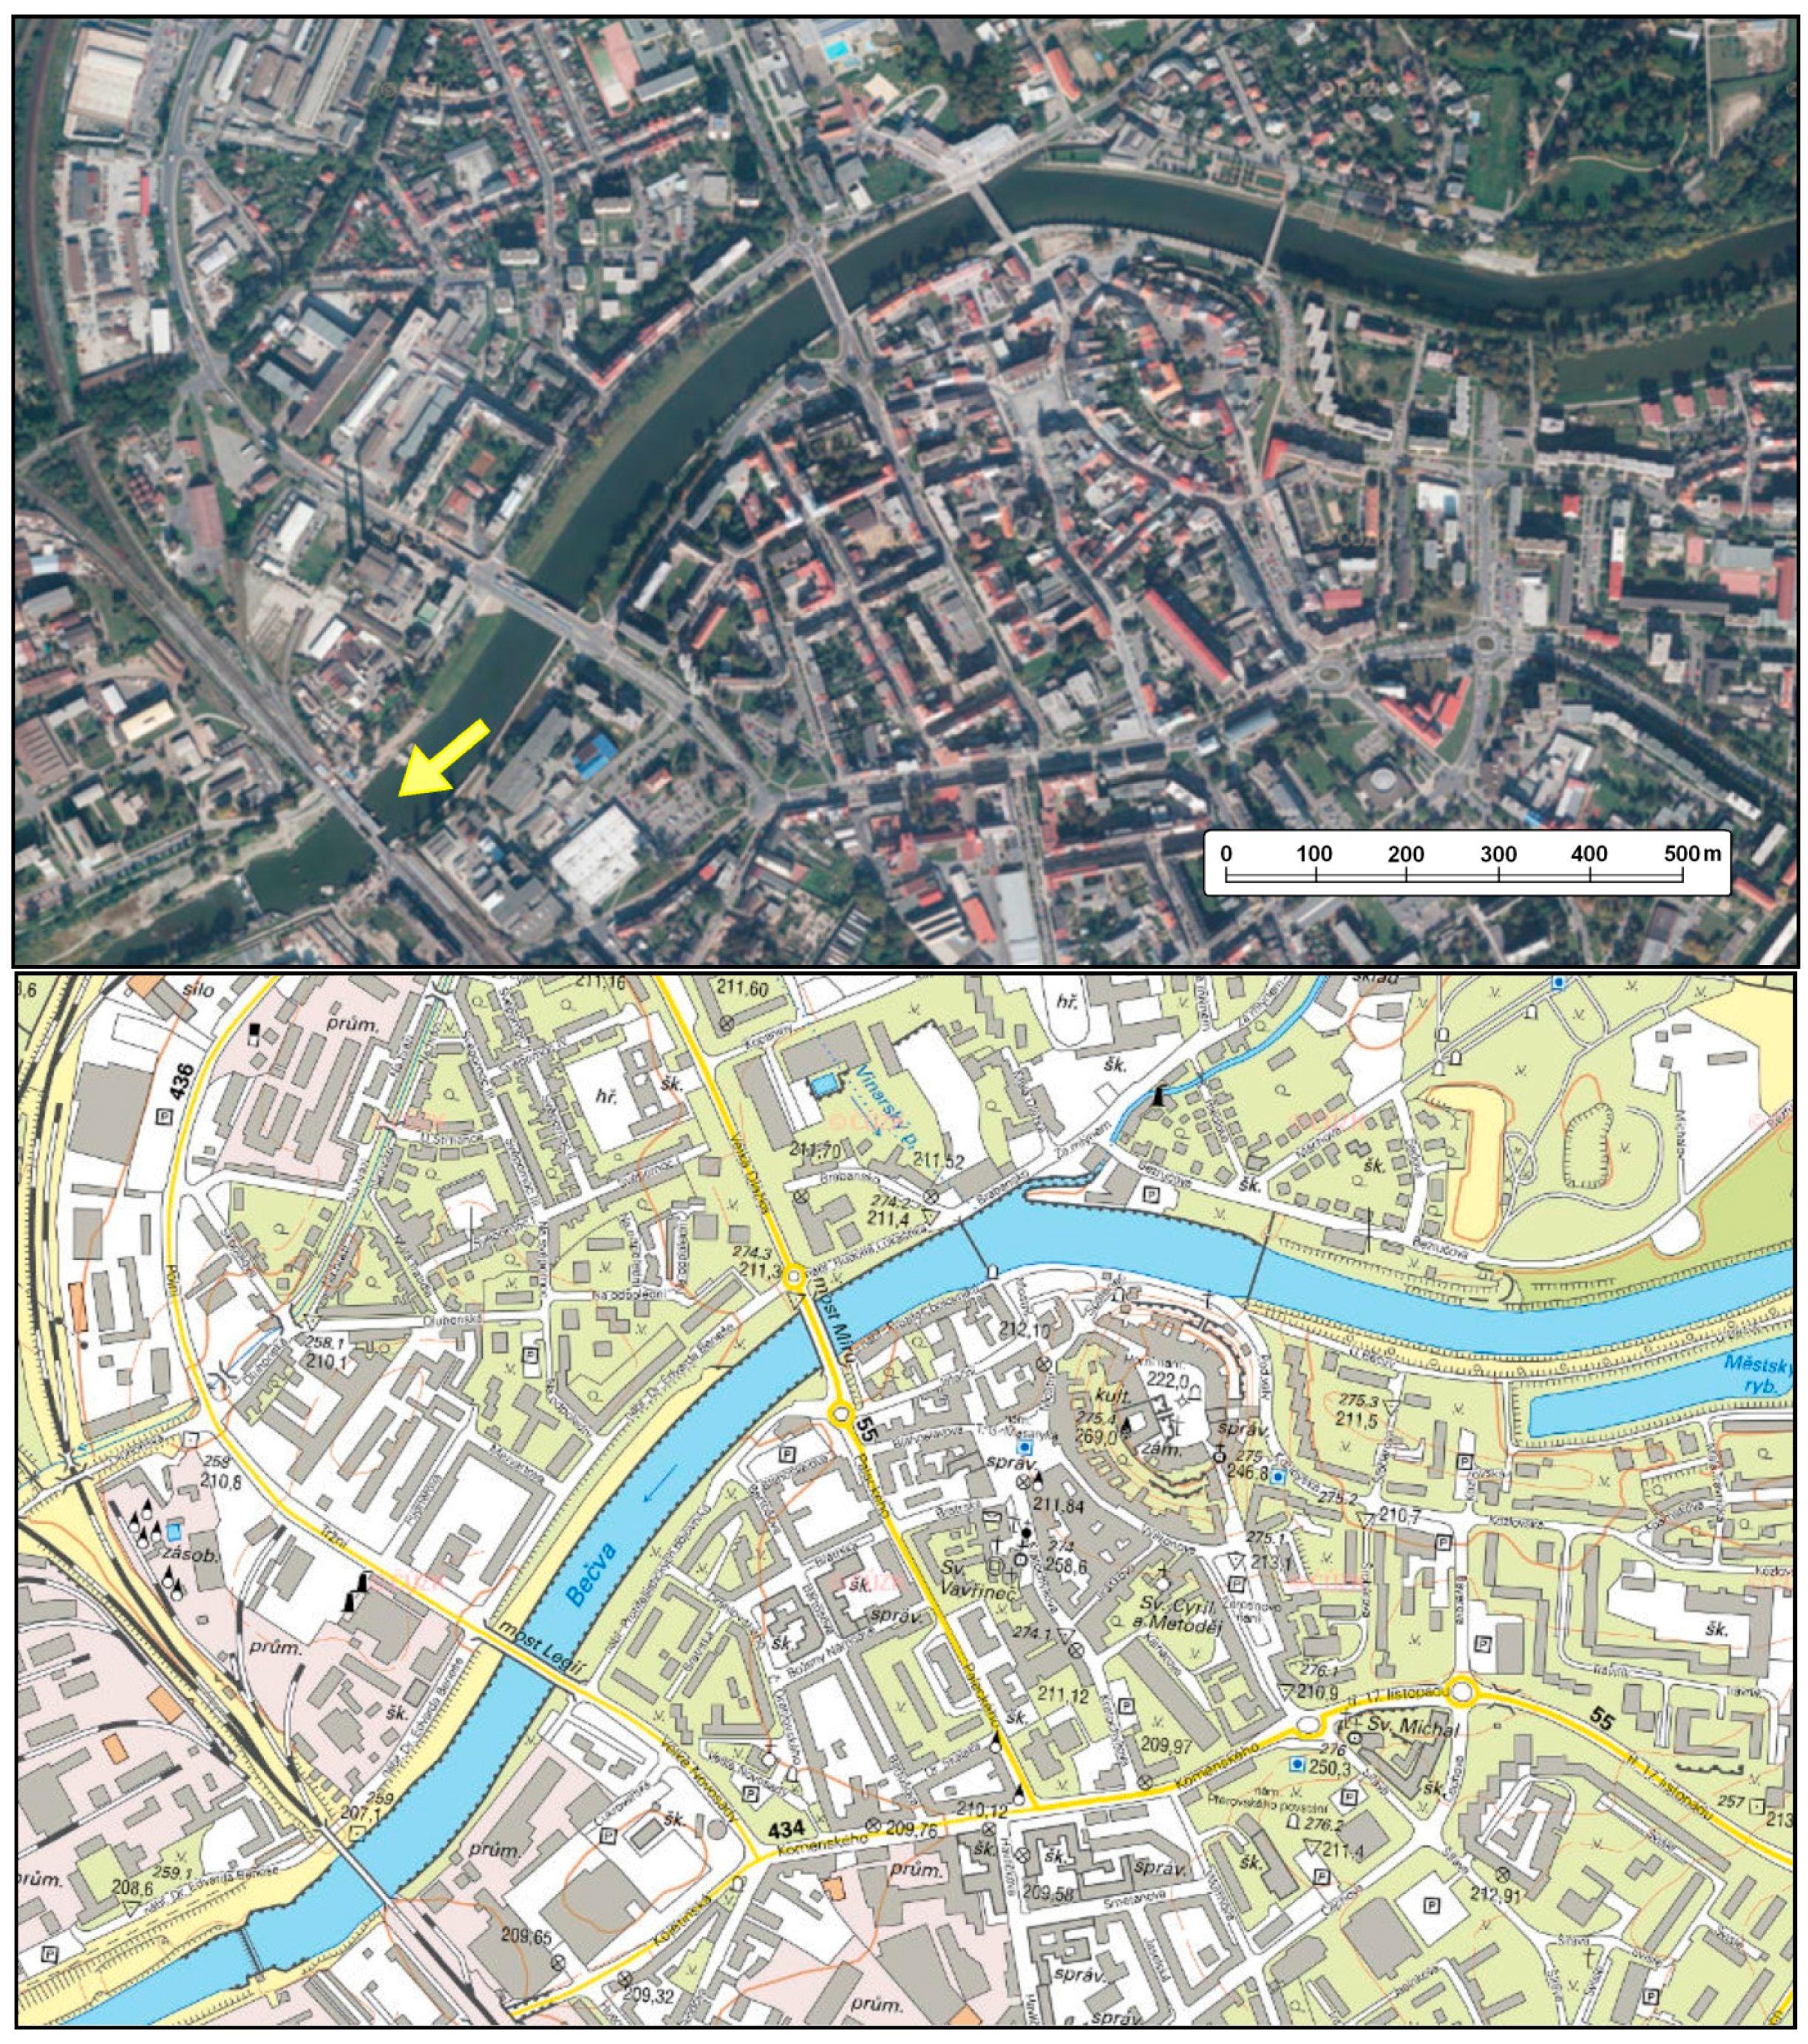
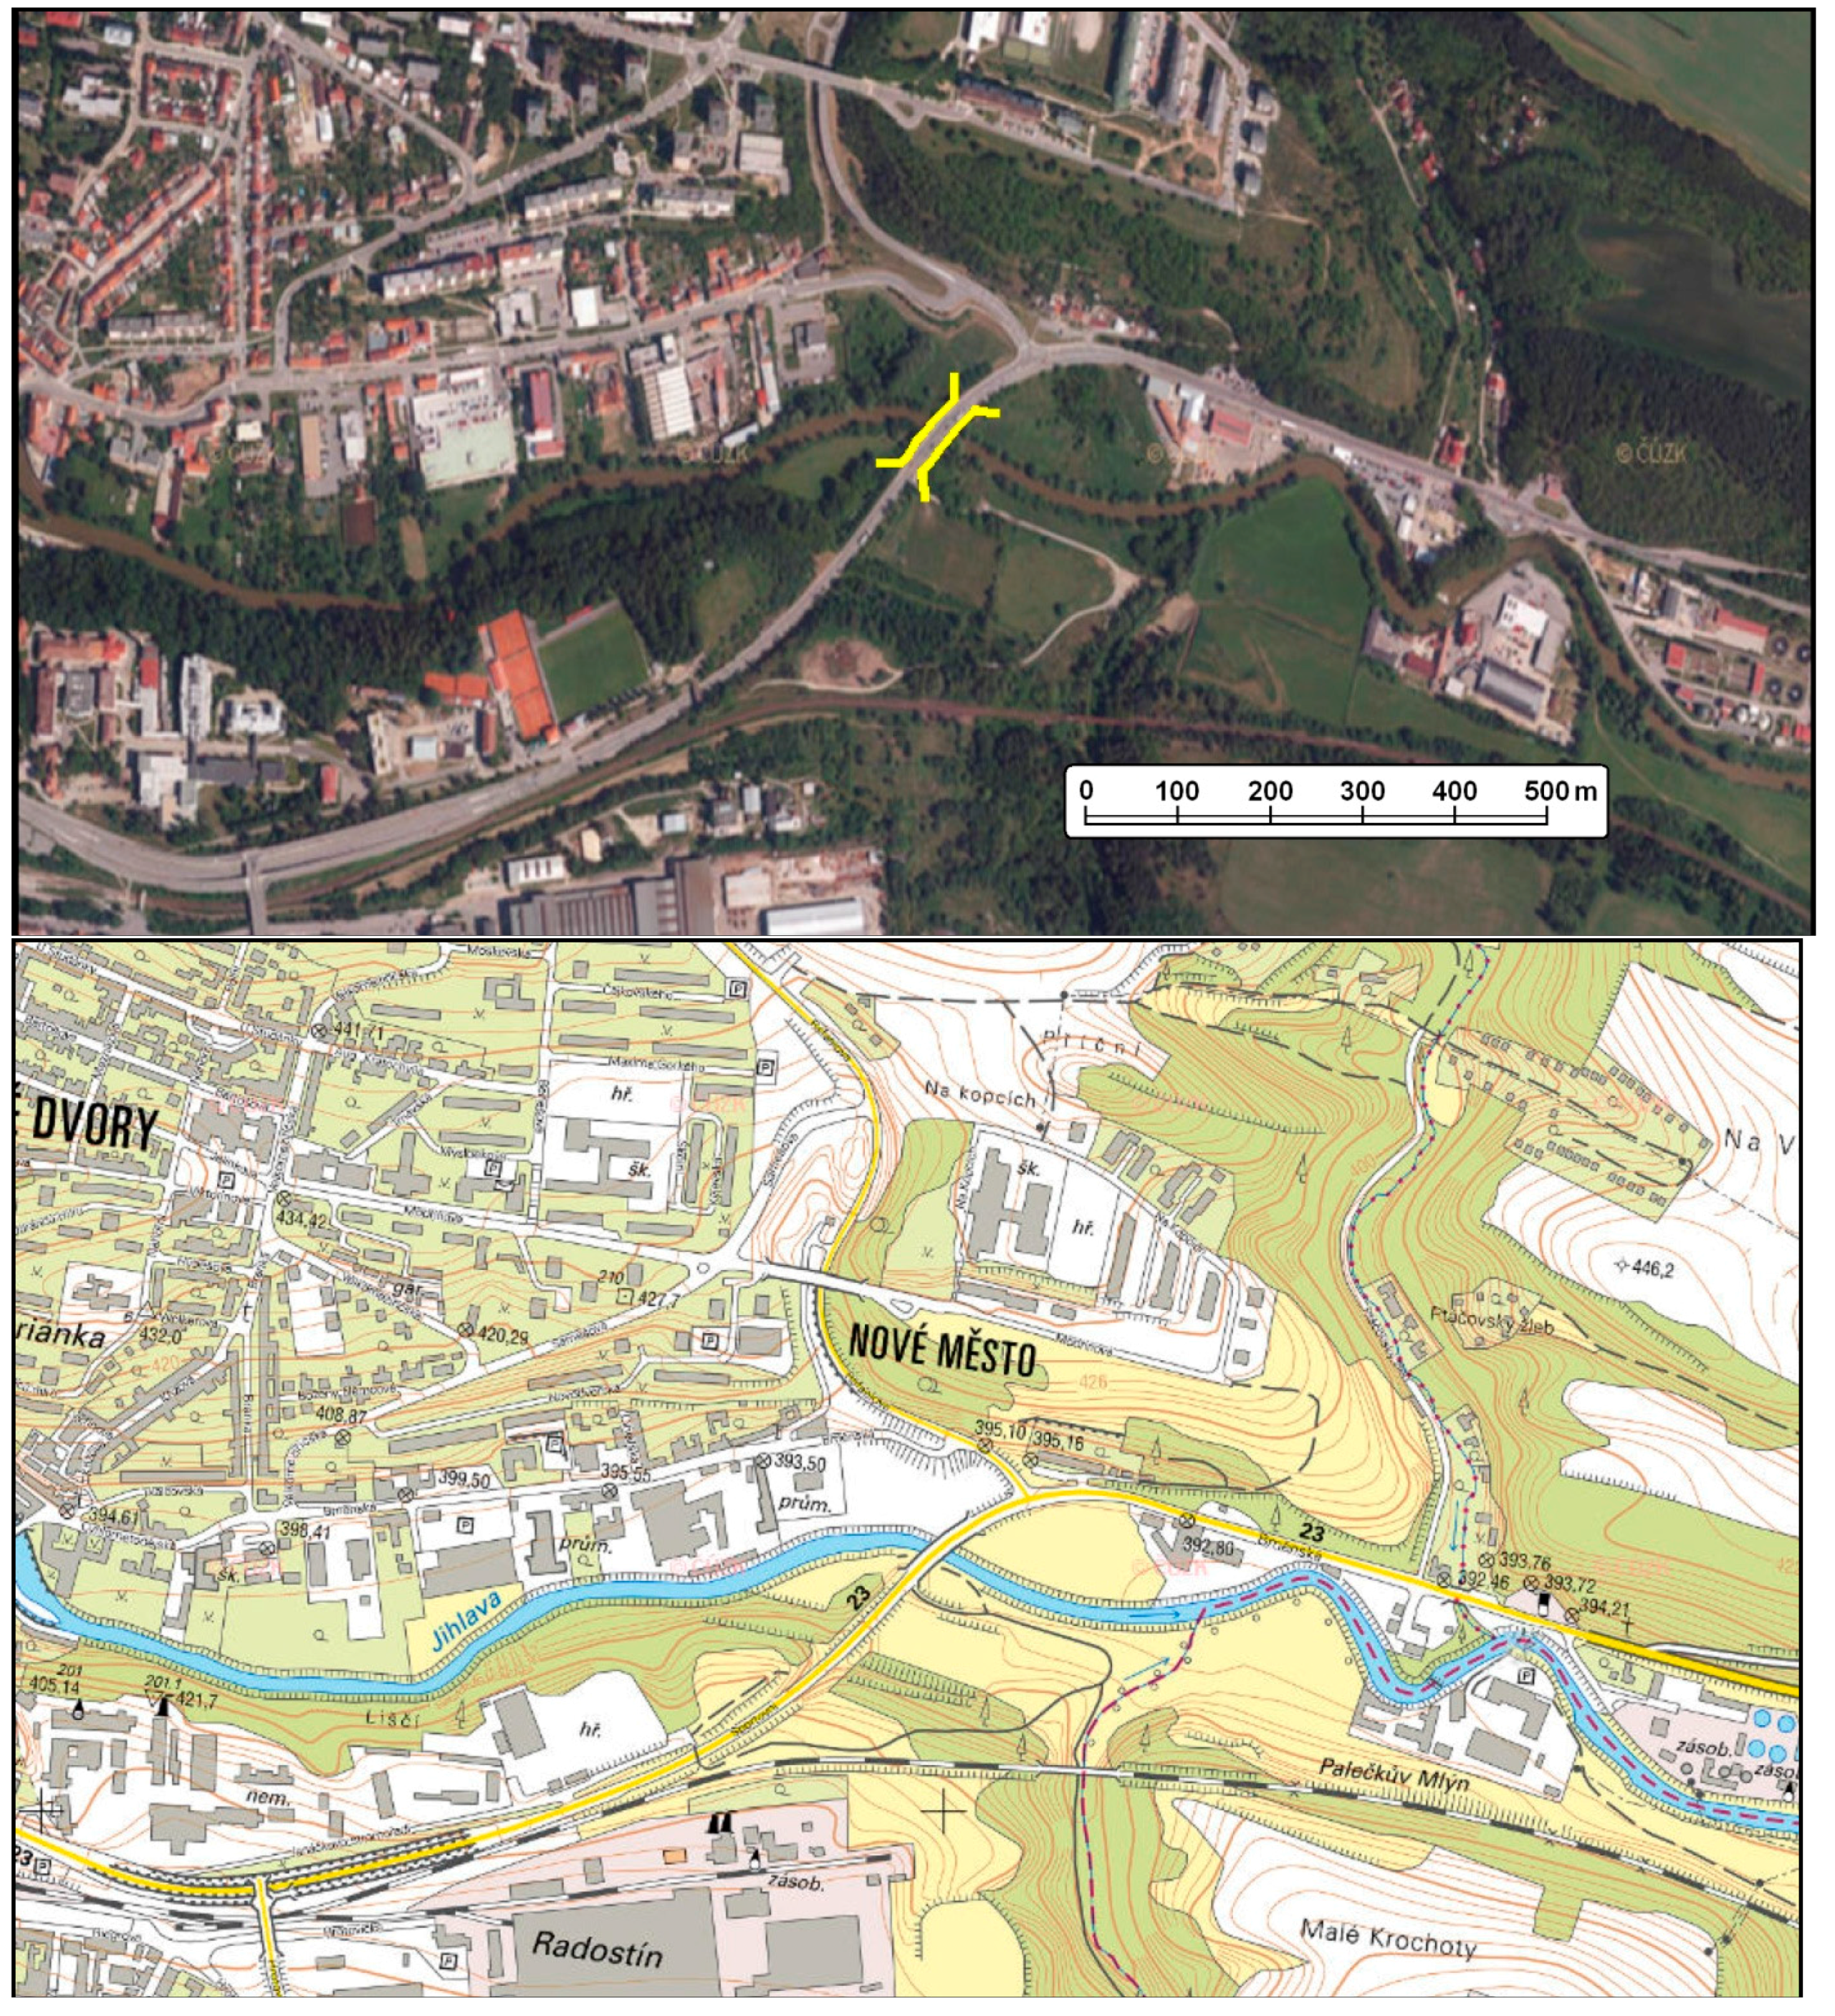
  • vertical aerial image—map (see examples in Section 4.2.);
  • orthophotomap—map.
For the purpose of experimental testing of map sources, MUTEP software was developed in 2008 in collaboration with the Laboratory of Geoinformatics and Cartography at the Institute of Geography at the Faculty of Science of the Masaryk University and the Institute of Psychology at the Faculty of Arts of the Masaryk University. The aim was to examine working with maps, i.e., the cognitive processes associated with it. This testing tool was reworked by Kamil Morong in 2013 into new Hypothesis software for on-line objective testing with higher functionality [31].
The Hypothesis software requires a web browser (various browsers were applied in individual research sites—see above, no different impacts on picture viewing were expected).
It is located on an external server (Figure 1), after a specific test is prepared, it can be referenced by a web address, the test can be completed from anywhere after meeting the conditions, and based on previous testing experience, after checking access restrictions to selected addresses on the internet. The software allows for asynchronous testing of respondents. Respondent’s actions are recorded on-line with the respondent’s index, which then allows a compilation of a particular record of one test.
The data for on-line testing is also continuously stored on an external server (see Figure 1).
The internal programmed test structure in Hypothesis is hierarchically arranged from the basic parts: TEST–SUBTEST–TASK. Writing each task consists of: assigning a task, visualizing the image material, recording the respondent’s solution, evaluating the correctness against an example, recording the time of each act.
Recorded were: date, time of the start of the test, respondent identification, respondent data, time record of each partial operation, results of closed questions—forced choice such as 0, 1 (true, false), open questions—verbal answers.
For the tests, respective pairs of tasks were used for strategic objects important for the feed as corridors or barriers (bridges, roads, river, railway station, airport), a test of color perception (to eliminate respondents with wrong color perception of the data collection procedures), rules for personal classification of respondents using a set of questions to describe the respondent’s characteristics (age, gender, completed studies, employment in disaster management, military field, experience with maps and images, interest in these materials) were prepared.
Out of the possible general tasks in evaluating the images the following ones were used: identification (click, where it is), classification (what—depending on the task—to distinguish different work successfulness with different objects), quantification (How many? If more than one objects are in the image.) and delimitation of the sites or objects (draw an outline).
The parameters of success rate and speed were evaluated in each task. Respondents had to perform following types of tasks (only one of them was bound with relevant pair of image and map):
  • closed answer (forced choice from proposed answers), e.g., the encircled object is: (a) road bridge, or (b) rail bridge),
  • open answer, e.g., two chosen objects are in the picture,
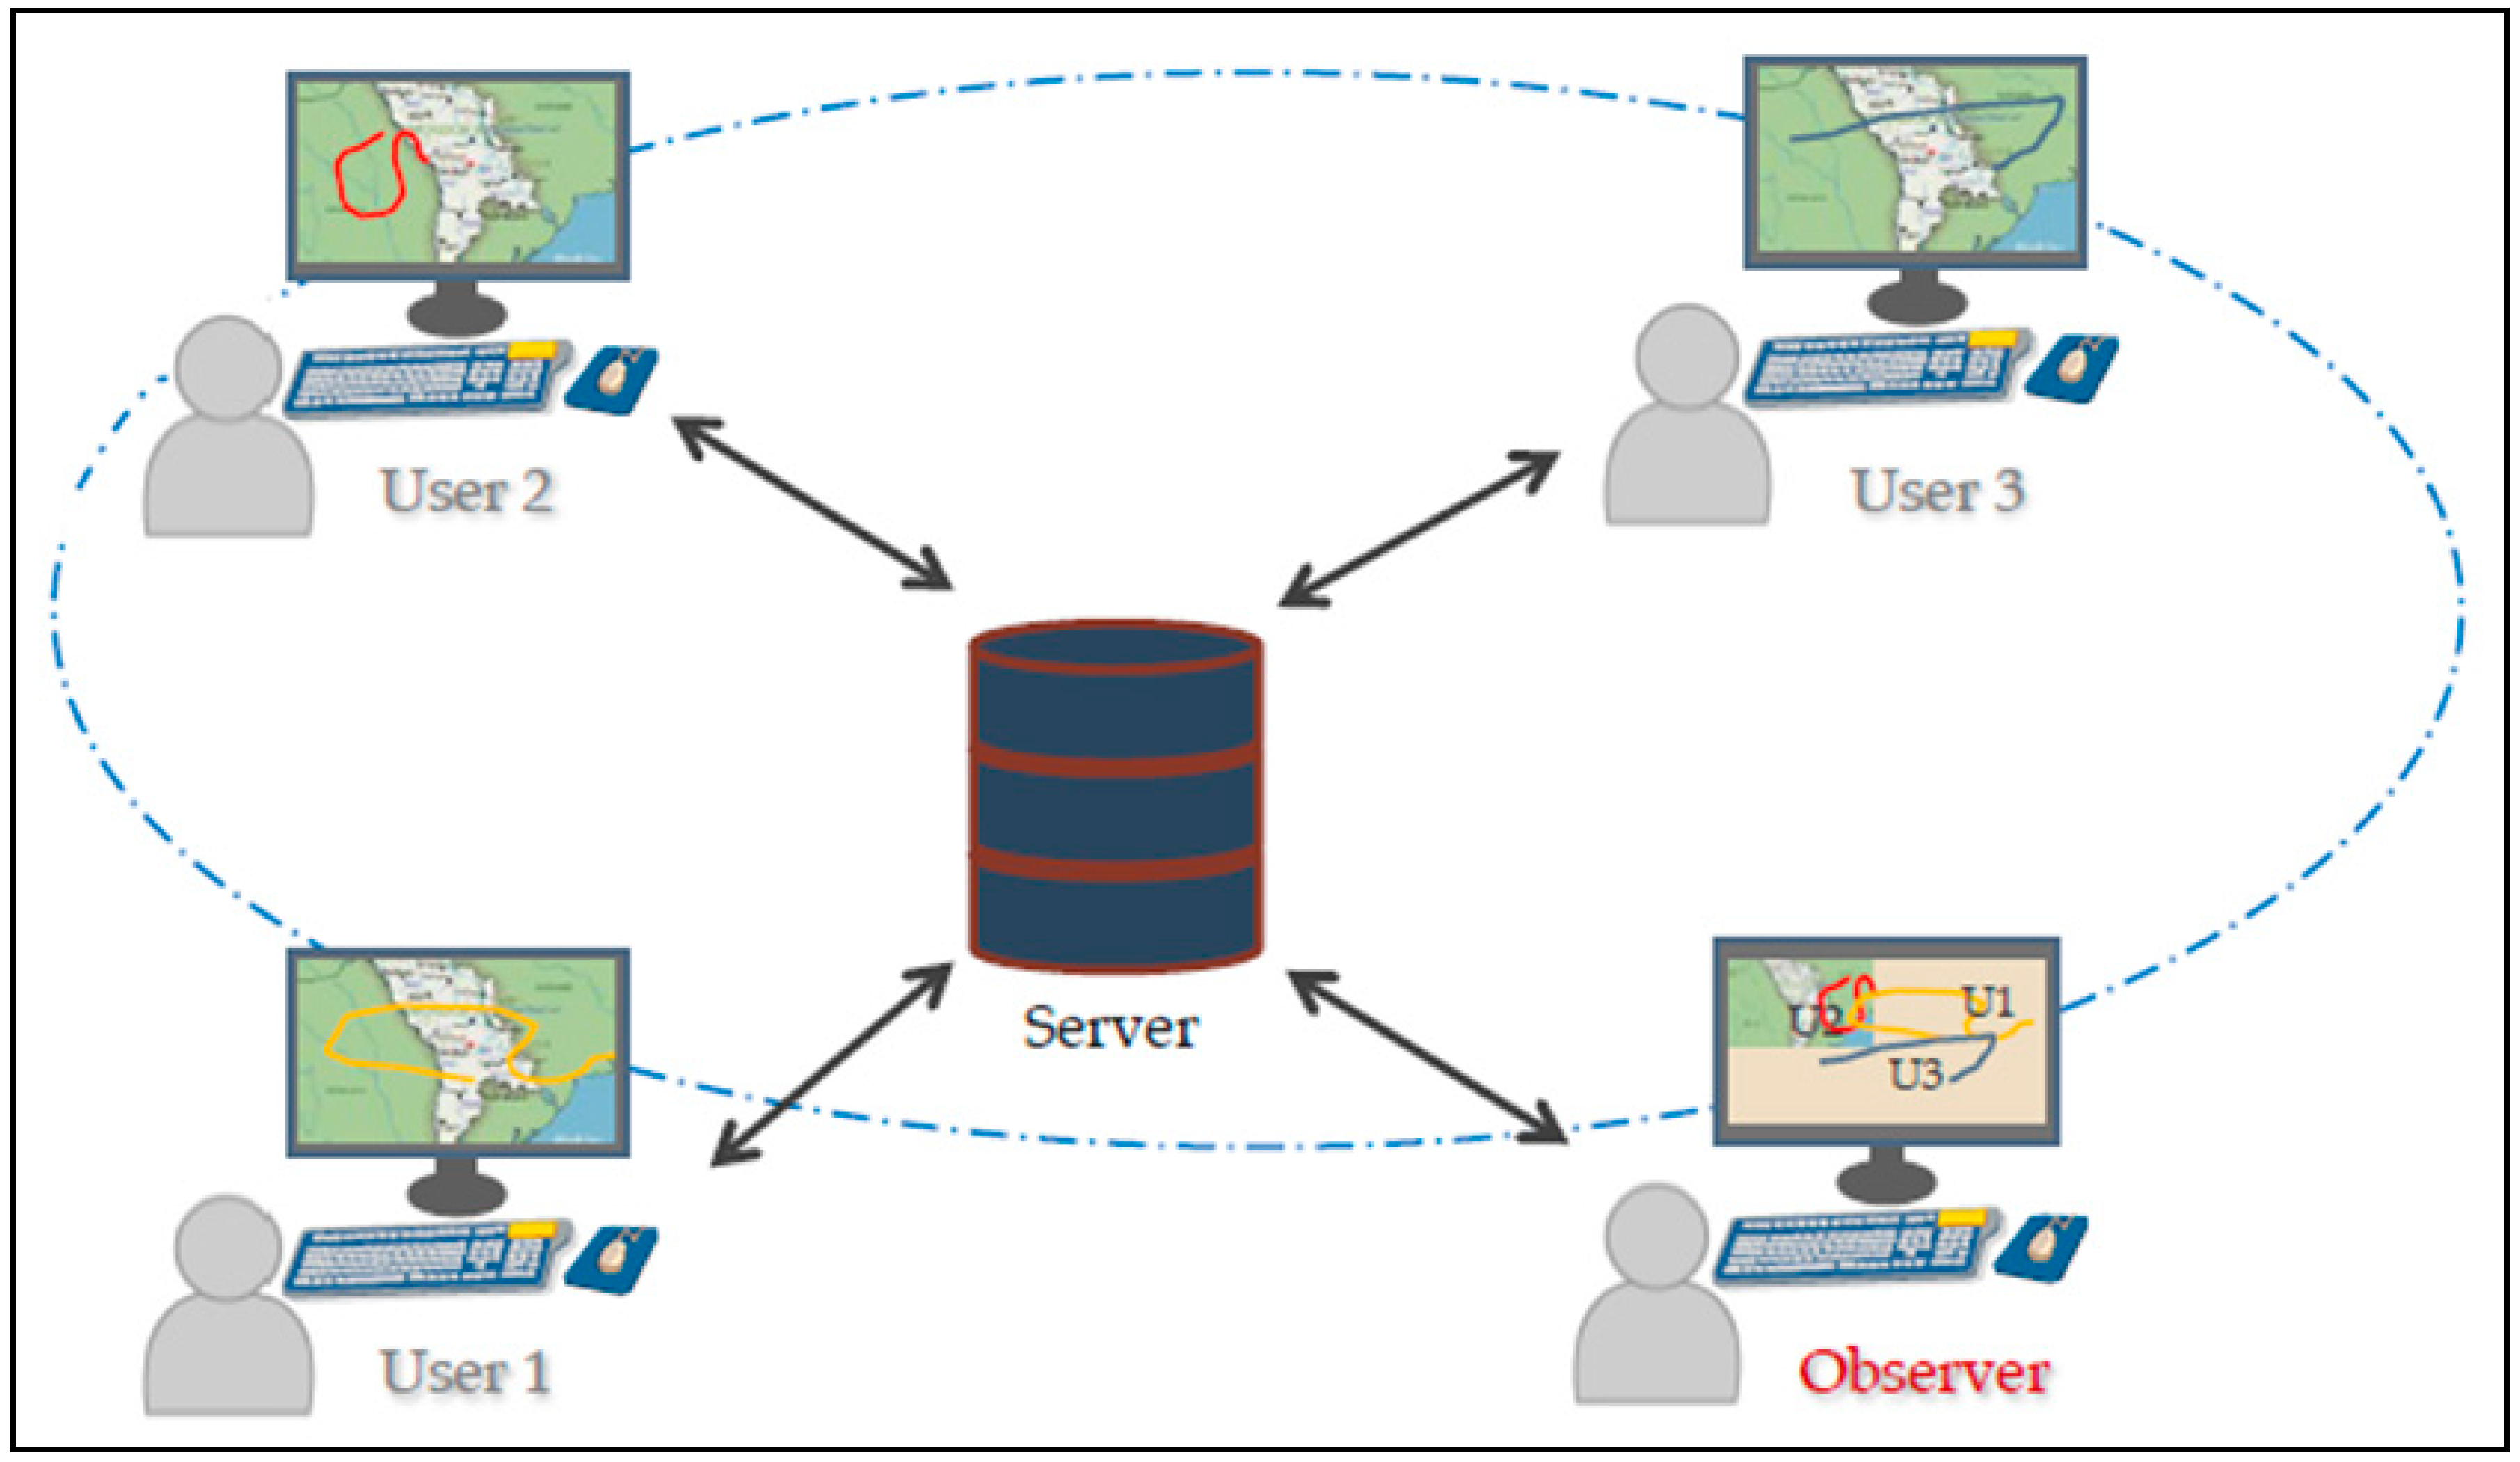
  • identification of an object by clicking, each click equal one objects (from the total known number of objects in the picture),
  • selection from multiple objects in an image, on a map, e.g., many object are encircled, select objects of one class only,
  • shape identification—line, polygon, mark (a click of the mouse on the desired object shape, its contour line, etc.), e.g., click on the object´s outline corners (at least 80% of the outline length must be correct to accept the object identification as correct).
Tasks for the respondent were formulated into testing blocks. Their content and layout is presented in Table 2.
Outputs from 151 respondents who completed the two test types (1—work with images; 2—work with maps) during the time of the research (2014) were taken into the pair testing, which means that totally 302 tests were performed. The selection of respondents was based on a stratified selection, with the aim to provide a group of respondents (or subgroups) to verify hypotheses in pair testing, which can be generally tested also with a smaller group of respondents.
Groups subsequently monitored in the analysis were:
  • the whole group of respondents (151 persons);
  • men (67 persons);
  • women (84 persons);
  • lay people (working outside disaster management, cartography and geography, non-geographic students, bachelor degree students of geography—1st year) (74 persons);
  • specialists (completed university studies in the field of cartography and geography, students of higher years of master and bachelor studies) (77 persons);
  • soldiers (active, in reserve) and University of Defense students, professional soldiers from other workplaces (12 persons, as a part of the specialist group);
  • disaster management personnel (hereafter “crisists”): firefighters, rescuers, police officers, (10 persons, as a part of the specialist group).

4. Results of Aerial Imagery and Map Reading

4.1. Criteria and Objects of Evaluation

Interpretation was evaluated according to two parameters (see Table 3):
  • success (correctness or accuracy) of identification;
  • speed of interpretation.
Objects to be identified were divided into two groups:
  • specific critical objects;
  • specific critical lines.
The aim was to compare the comprehension of an aerial image (vertical, orthophotomap) to a corresponding map of the same territory.
The following working hypotheses were determined for statistical testing (Table 3):
The Section 4.2 provides a description and a more detailed analysis of six selected tasks. In the analysis I have included tasks that were almost identical (identification of railway bridge) or different in the success of the solution on a map and in image.
The analysis includes the following tasks:
  • Identification of a railway bridge;
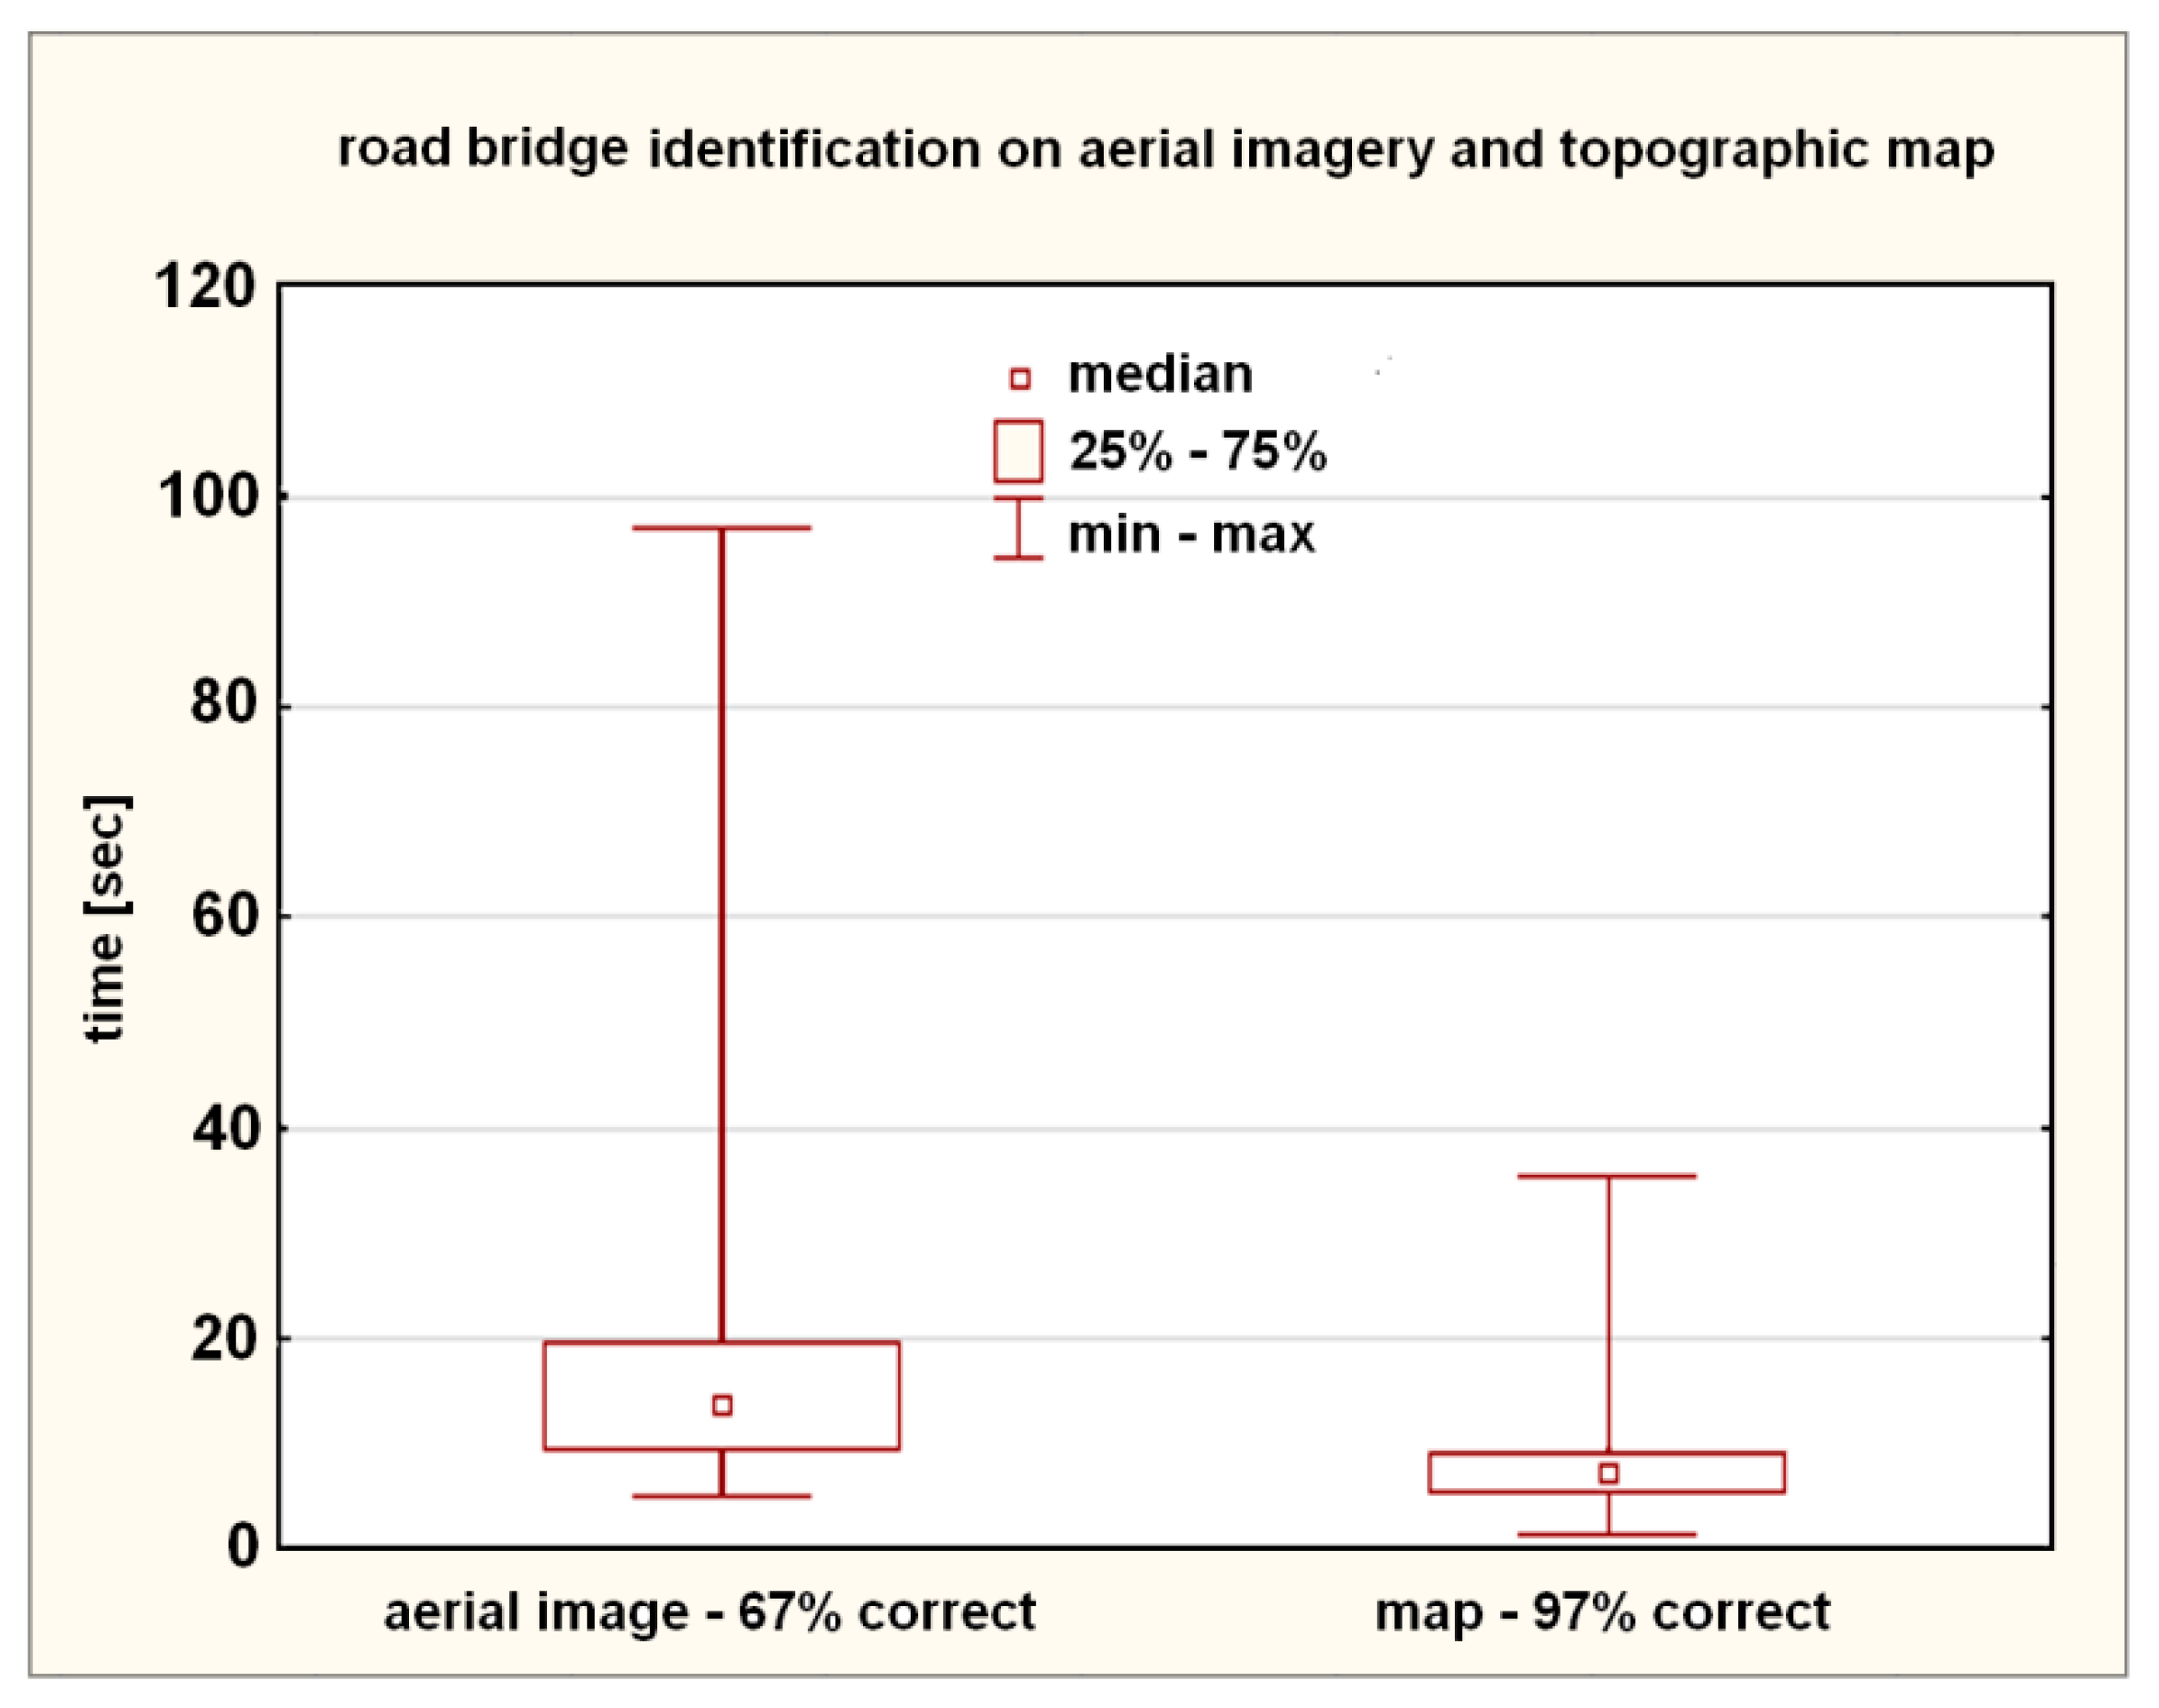
  • Identification of a road bridge;
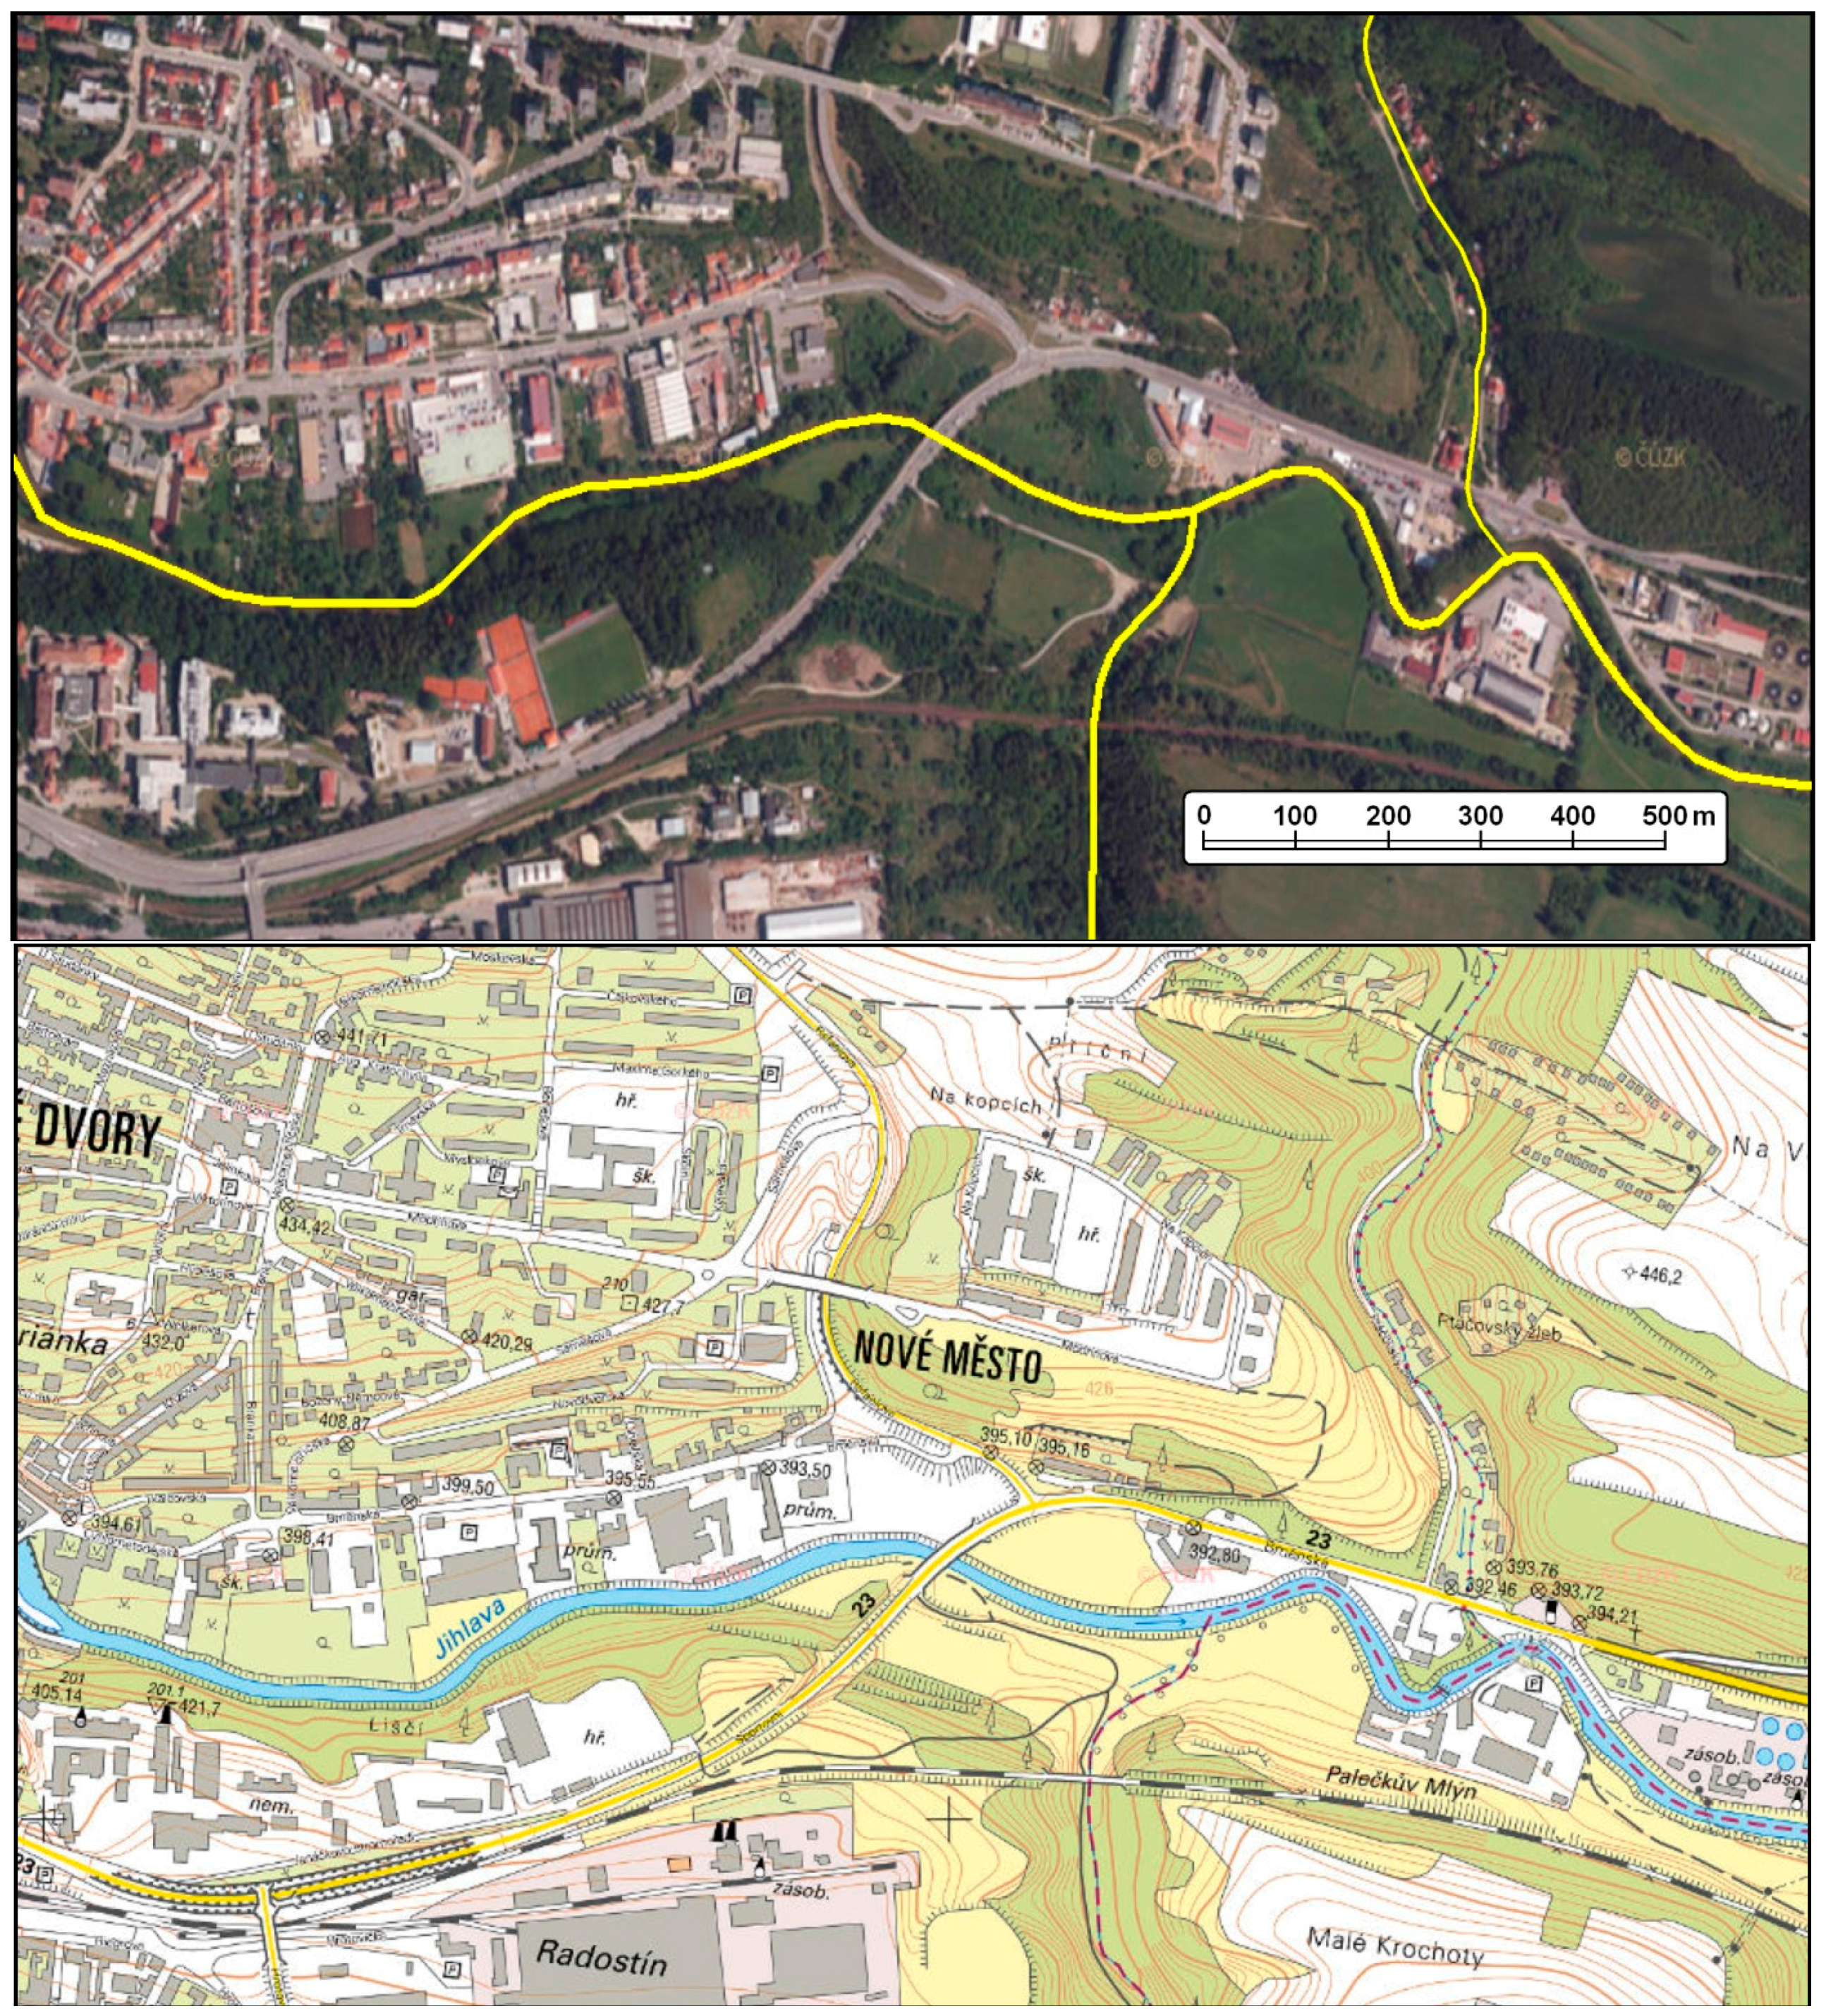
  • Identification of a watercourse;
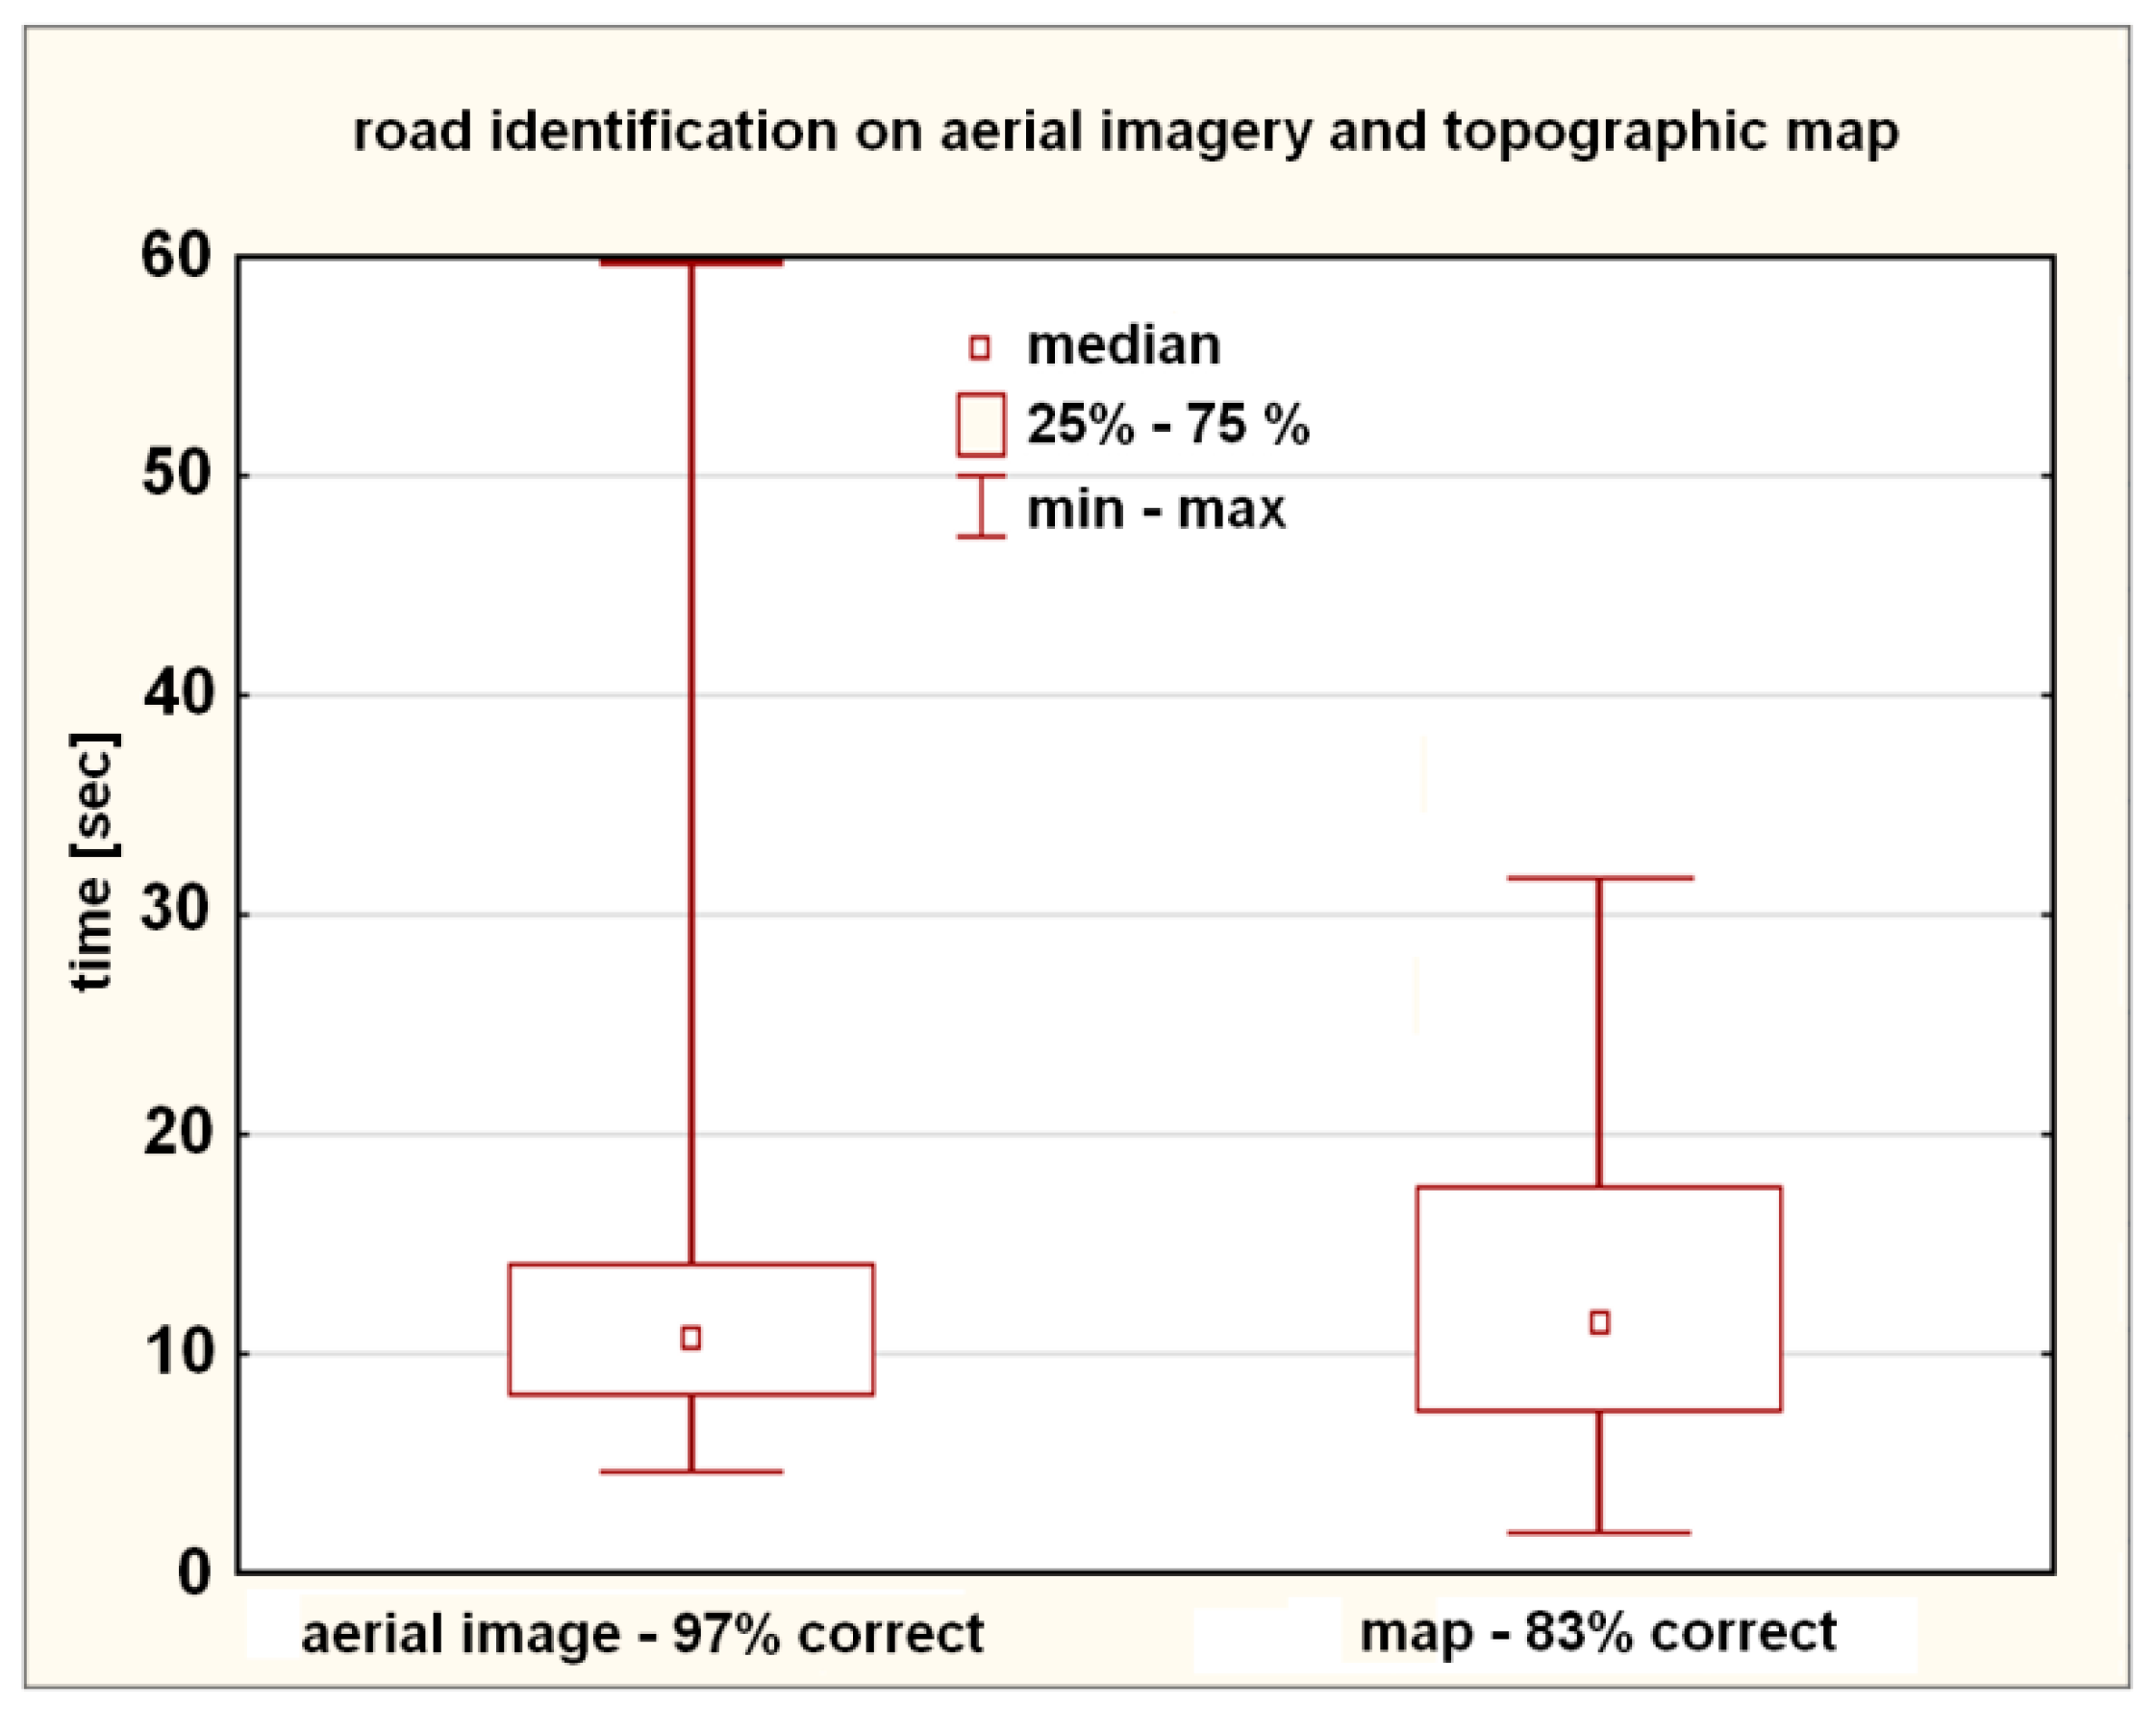
  • Identification of a road;
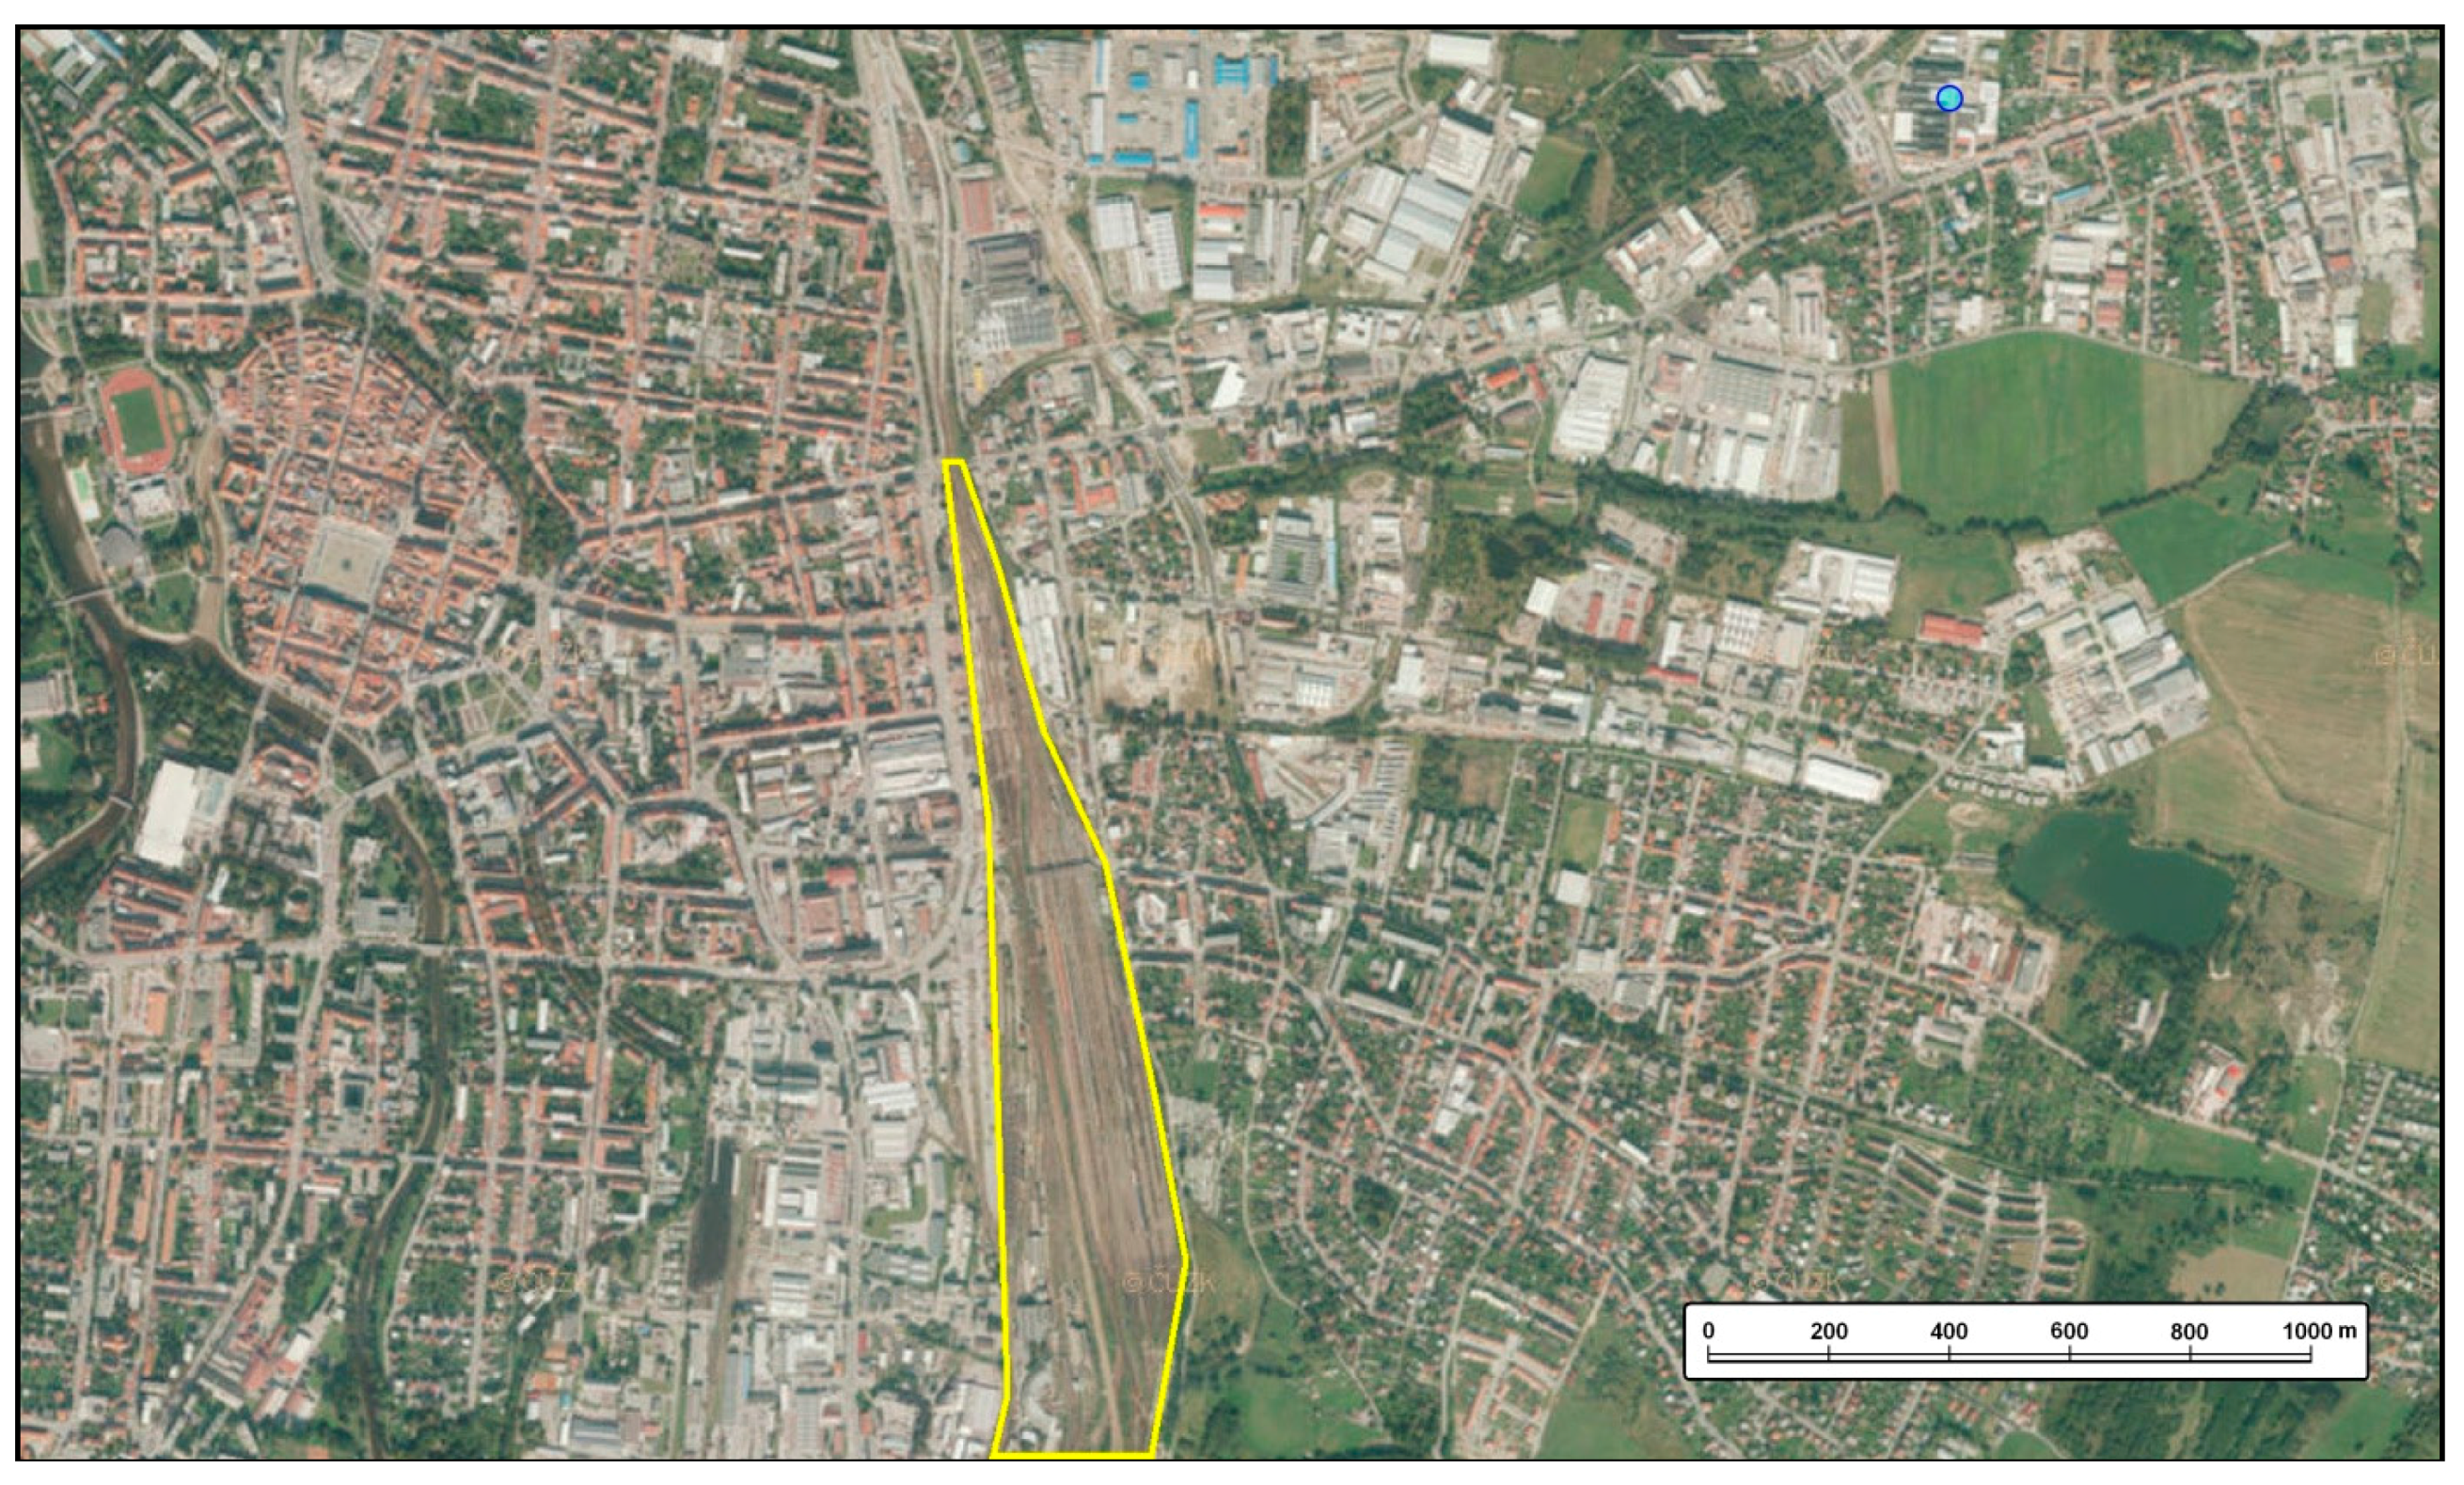
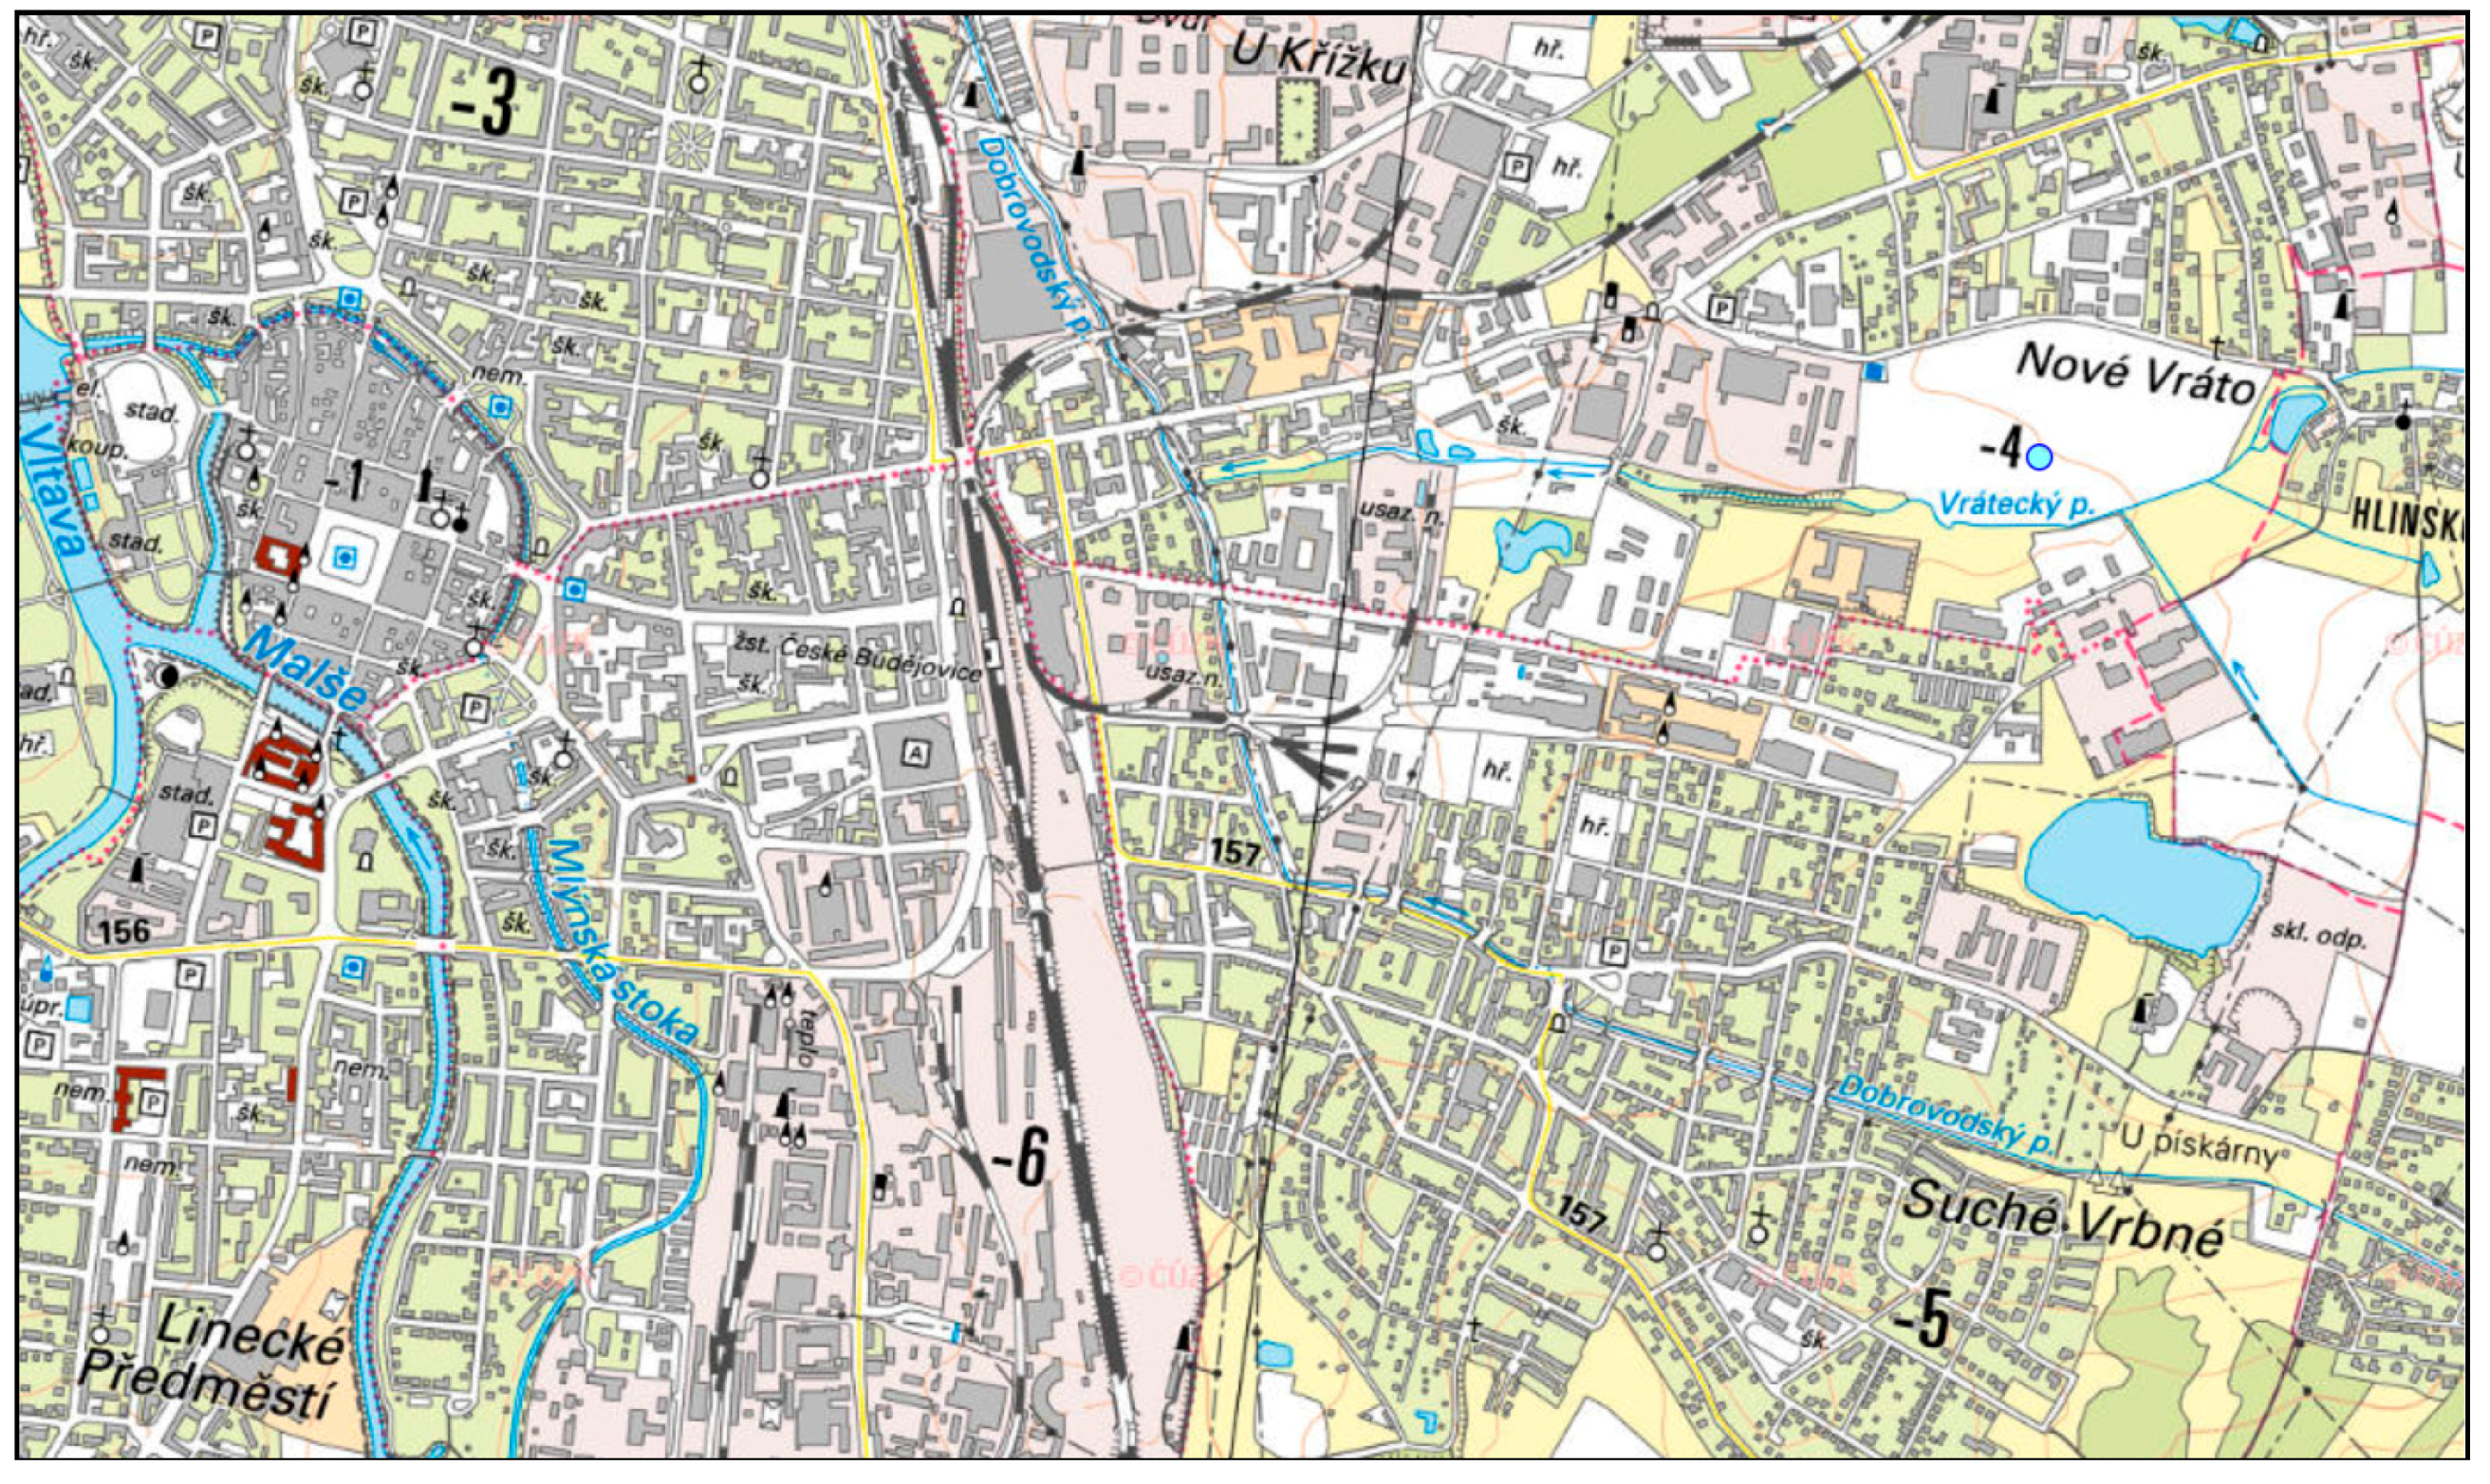
  • Identification of a railway station;
  • Identification of an airport facility.

4.2. Commentary to Statistical Data on Aerial Imagery and Map Reading

Basic descriptive statistical characteristics of the solution parameters are calculated from the data on success rate and speed of response for individual source materials. The percentage of correct answers, average, minimum and maximum time, median, and quartiles were monitored. Table 4 shows the results of the forced choice tasks (selection from the options available). Graphically well-arranged comparison of the solution times is provided in box charts. A detailed analysis of the identification of the Military Airport in Prerov is carried out separately. Selected tasks are commented.
The task of “railway bridge identification” has shown a high degree of match in the success rate and response speed of the respondents (see Table 4). The test image-map pair captures four road bridges and walkways across the river and one railway bridge (see Figure 2). The assumption that the identification of the railway bridge will be significantly faster on a map—the graphical representation of the railway on the map is significant (black-and-white line)—was confirmed. When identifying the railway bridge, the respondents had to consider the overall composition and decide that it was a railway line according to the course of the lines.
The task of “road bridge identification” had a lower success rate with the image (see Table 4). The task was difficult because both a river and a railway track were captured in the picture (Figure 3). Map is clearly distinguishable (a blue line for the river and a white/black line for the track), but they are very similar on the aerial image—the two lines are in brown tones, more or less the same width. The river is more identifiable according to its course—it meanders in the area, so a more experienced respondent can infer that the railroad may appear only as a slightly rounded line. Probably that is the reason why the identification of a road bridge in the picture was less successful. It can be deduced that the similarity of color and shape as basic interpretative characters makes recognition difficult. A clear comparison of the time solution of this task is provided by the box graph in Figure 4.
The task of “identification of a watercourse” was generally the least successful (image: 9.27% and map: 28.48%, see Table 4). The task was to identify the shape of a watercourse line—a creek as a tributary of the Jihlava River in a built-up area of family houses in town Trebic (Figure 5). Identification of the stream on the aerial images is very difficult because it is partly lost between walkways, gardens and roads. The task is much easier on the map—the blue line is a good clue for marking the watercourse. Still, even on the map, the respondents were not accurate enough—to score successfully it was required to depict of 80% of the shape (see Section 3)—to stay in the boundary along the line. Many of the monitored respondents did not find the confluence of the creek and the river when solving the task. This task completes the overall result of the assessment of water areas and streams—the blue color, whether in an area or in a line, makes it significantly easier to recognize these water bodies.
More than 97% of the respondents correctly distinguished a road on the aerial image, 83.44% on the map (see Table 4). Respondents selected from the response choice—a forced choice, i.e., the task was easier both in its assignment itself and in the situation depicted on the aerial image—this captured the road between fields. The task showed excellent traceability of asphalt or other paved paths on aerial image and basically on map as well (Figure 6).
The “railway station identification” result confirmed that the respondents identified this object well (Figure 7) and did not differ much from the railway station identification on the map, which appeared to be easier.
In the “airport compound identification” task, the respondents were asked to write down their identification of a rectangle-marked object on an aerial image and in a map. The premises of the military airport Prerov were marked in the source material. Open type of answer not limiting respondent to a selection from a set of given responses was chosen purposefully. All responses (airport, runway etc.) were included as correct answers. It was easy to identify the airport’s runway in the aerial image (Figure 8). In the map, the runway is depicted as an areal object and an airplane symbol is used to indicate the usage of the area.
The analysis of respondents’ answers brought the expected outcome—the use of the cartographic image tag “airplane” made it sufficiently comprehensible for the respondents to identify the object on the map correctly. Of the 151 responses, 145 stated “airport” while only six responses differed (non-built-up area, industrial area, part of the municipality, military area—no mention of purpose). Image identification brought more heterogeneous response variants, of the 151 responses being 114 correct and 37 different.

4.3. Comparison of Statistical Data Processing Results with Research Hypotheses

The aim of the research was to find out possible differences in the understanding of images for groups with different characteristics—gender or experience. The results which are evaluated here are related to the solutions of all the tasks. In general, these are tasks that have a close relationship to disaster management. The results of partial groups of respondents were tested with the following result (Table 5):
The results were verified at a significance level of 0.05 using the Wilcoxon’s signed-rank test.
Hypothesis testing and tasks analysis has shown that the speed of interpretation of aerial images and maps varies, the objects depicted on them are identified with varying success and speed. The assignments were mostly solved more successfully (respecting the interpretive possibilities of the image) and faster on images than on maps, except for a single but significant exception—water areas and watercourses. It turned out that blue color is a distinctive and experienced interpretation sign for water on the map, so these tasks were dealt with by respondents overall more correctly on maps. The importance of color for object recognition is supported by a number of studies such as [21,22,23,32]. The color of rivers and ponds on aerial images is not blue—it displays the fact, i.e., there are rarely any blue water areas or rivers in the Czech Republic. The summer color of the Czech rivers and ponds is brownish or green. This color-accurate display is difficult for the purpose of identification. Knowing that respondents are quicker and more capable of recognizing the objects observed on aerial images, we can consider the orthophotomap with a base of an aerial image as the localization layer, as being easier lay people to understand.
It was found out that the success rate of the groups of respondents are the same, i.e., women and men identify objects on both aerial images and maps with similar success and so do laymen and experts. Here, it is necessary not to overstate the results in that the tasks were set for laymen. It can be assumed, therefore, that if the tasks were difficult, experience in image identification would become evident. This is partly confirmed by the results of the assessment of disaster management personnel. Soldiers and disaster management personnel differed in the speed of solving special tasks compared to laymen, their solutions were faster.
Finding a match of male and female success in solving map problems differs from some researches, which point to greater success of men [33]. Sikl [34], however, points out that the results of gender comparisons should not be unambiguously interpreted. In a number of studies, the differences in the average result between groups were smaller than the dispersion of results within one gender group [35]. Linn and Petersen [13], and Voyer, Voyer and Bryden [14] show that men achieved slightly better results in tests of solving spatial problems. However, some works of Kempf, Palan, and Laczniak [36], and Johnson and McCoy [37], evaluate the success from another point of view—men are more self-confident, so they are quicker and more resolute in solving tasks than women, who assure and try to solve the given task very carefully.

5. Discussion and Conclusions

The results of the investigation have shown that aerial images are used in disaster management in about 10% of cases (state in 2014 according to own research in the Czech Republic). From a verification of the use of airframes in disaster management, which was conducted by the authors in person or by mail in 2014, it was revealed that aerial images were:
  • used to a limited extent compared to maps for providing a more detailed view of the place of intervention or the current view of the crisis situation;
  • as an intelligible source for the personnel of the Integrated Rescue System—parallel with maps.
Based on the results of the testing and field investigations, it is possible to summarize:
  • people with disaster management experience (soldiers and “crisists”—see Table 5) are quicker in solving tasks on an aerial image;
  • the success rate of solving tasks on an aerial image was the same for men and women, as well as for groups of people with or without experience of disaster management;
  • the advantage for their use in disaster management is their good comprehensibility (better than that of maps) and overall less demand for abstract thinking, which can be lowered in stress;
  • for the purpose of disaster management and fast orientation in a particular location, the aerial image should be supplemented by a clear description and other thematic drawing;
  • the aerial imagery is used in disaster management in the Czech Republic, the use of vertical as well as oblique images will be further expanded.
Among the research respondents, there were people working in disaster management and a number of consultations were held with the staff of the Integrated Rescue System in the Czech Republic. We have agreed on the desirability and necessity for an intelligible localization cartographic base, which can be easily read by people regardless of their age, gender and expertise. The speed and accuracy of reading the necessary information is important in a number of crisis situations. People in disaster management must work with unified and understandable documents. In addition to maps, which are most widely used, aerial image supplemented by the necessary information proves to be useful. In stressful situations, which may have an impact on abstract thinking, aerial image may be a more appropriate material for transmitting information. Pre-research has shown that aerial imagery is well understood even by older children and adolescents. With their growing age, their ability to read a map—the abstract model of reality—grows. There are a number of experts involved in disaster management, which is a very heterogeneous group in their ability to read images and maps. Wider use of aerial images by disaster management will require deeper education of staff, especially of the operating centers, in their correct interpretation.
Aerial imagery is also a suitable localization base and can be used very well as a variant of topographical map—a topographical orthophotomap supplemented by thematic and descriptive information. Soldiers and disaster specialists experienced in work with maps and images could gain a higher speed and reliability of interpretation of these up-to-date and comprehensible material.
However, remote sensing materials should be used with caution. It must be stressed that aerial images have their limited use compared to maps. Maps are models of reality, which can be defined according to the user’s needs, based on the future use of this model. Image is a view of reality. Their properties can be used effectively for the benefit of decision-making in disaster management, as demonstrated by the research carried out with the general public and specialists.
The clarity of aerial images is a great advantage for their use in disaster management. However, on an aerial image there is no description, which is an important guideline for identifying specific objects. For disaster management, orthophotomaps will be a more appropriate material, which will have some of the advantages of both the image and the map.
A real application of aerial imagery and digital topographic maps can be expected in the everyday life in regions subdued to some crisis event (e.g., natural disasters—floods, landslides, earthquake, etc. or social or military conflicts) covered by such data on web map servers. People are equipped with desktop and especially mobile viewers (smart cellular phones) around the world relatively very well. So the access to imagery and maps is much easier. Than a right and operative decision-making is possible. The INSPIRE directive can assure at least an open access to aerial imagery and topographic maps in any place of the EU both for locals and visitors. Development of common data browser with operative access to national web map servers (offering similar data under a standardized list) is necessary. Present navigation map system cover only a part of this requirement.

Acknowledgments

This research has been supported by funding from the project of Masaryk University under the grant agreement No. MUNI/M/0846/2015, which is called “Influence of cartographic visualization methods on the success of solving practical and educational spatial tasks”.

Author Contributions

Hana Svatonova conceived and designed the experiments; Hana Svatonova and Jaromir Kolejka performed the experiments; Hana Svatonova analyzed the data; Hana Svatonova contributed reagents/materials/analysis tools; Hana Svatonova and Jaromir Kolejka wrote the paper.

Conflicts of Interest

The authors declare no conflict of interest. The founding sponsors had no role in the design of the study; in the collection, analyses, or interpretation of data; in the writing of the manuscript, and in the decision to publish the results.

References

  1. Konecny, M.; Brezinová, S.; Lukas, H.; Drapela, M.V.; Kubicek, P.; Talhofer, V.; Reznik, T.; Stachon, Z.; Kolejka, J.; et al. Dynamicka geovizualizace v krizovem managementu, 1st ed.; Masarykova Univerzita: Brno, Czech Republic, 2011; p. 385. [Google Scholar]
  2. Scialfa, C.T. The role of sensory factors in cognitive aging research. Can. J. Exp. Psychol. 2002, 56, 153–163. [Google Scholar] [CrossRef]
  3. Weale, R.A. Retinal illumination and age. Trans. Illum. Eng. Soc. 1961, 26, 95–100. [Google Scholar] [CrossRef]
  4. Blaut, J.M. The mapping abilities of young children: Children can. Ann. Am. Geogr. 1997, 87, 152–158. [Google Scholar] [CrossRef]
  5. Downs, R.M.; Liben, L. The final summation: The defence rests. Ann. Am. Geogr. 1997, 87, 178–180. [Google Scholar] [CrossRef]
  6. Liben, L.S.; Downs, R.M. Canism and cannotianism: A straw child. Ann. Assoc. Am. Geogr. 1997, 87, 159–167. [Google Scholar] [CrossRef]
  7. Spencer, C.; Blades, M.; Morsley, K. The Child in the Physical Environment: The Development of Spatial Knowledge and Cognition; Wiley: New York, NY, USA, 1989. [Google Scholar]
  8. Madden, D.J.; Allen, P.A. Adult age differences in the rate of information extraction during visual search. J. Gerontol. B Psychol. Sci. Soc. Sci. 1991, 46, 124–126. [Google Scholar] [CrossRef]
  9. Davis, E.T.; Fujawa, G.; Shikano, T. Perceptual processing and search efficiency of young and older adults in a simple-feature search task: A staircase approach. J. Gerontol. B Psychol. Sci. Soc. Sci. 2002, 57, 324–337. [Google Scholar] [CrossRef]
  10. Salthouse, T.A.; Somberg, B.L. Isolating the age deficit in speeded performance. J. Gerontol. B Psychol. Sci. Soc. Sci. 1982, 37, 59–63. [Google Scholar] [CrossRef]
  11. Salthouse, T.A. Aging and measures of processing speed. Biol. Psychol. 2000, 54, 35–54. [Google Scholar] [CrossRef]
  12. Baker, D.H.; Graf, E.W. Equivalence of physical and perceived speed in binocular rivalry. J. Vis. 2008, 8, 1–12. [Google Scholar] [CrossRef]
  13. Linn, M.C.; Petersen, A.C. Emergence and characterization of sex differences in spatial ability: A meta-analysis. Child Dev. 1985, 56, 1479–1498. [Google Scholar] [CrossRef]
  14. Voyer, D.; Voyer, S.; Bryden, M.P. Magnitude of sex differences in spatial abilities: A meta-analysis and consideration of critical variables. Psychol. Bull. 1995, 117, 250–270. [Google Scholar] [CrossRef]
  15. Nowaczyk, R.H. Sex-related differences in the color lexicon. Lang. Speech 1982, 25, 257–265. [Google Scholar] [CrossRef]
  16. Pérez-Carpinell, J.; Baldovi, R.; de Fez, M.D.; Castro, J. Color memory matching: Time effect and other factors. Color Res. Appl. 1998, 23, 234–247. [Google Scholar] [CrossRef]
  17. Hund, A.M.; Gill, D.M. What constitutes effective way finding directions: The role of descriptive cues and task demands. J. Environ. Psychol. 2014, 38, 217–224. [Google Scholar] [CrossRef]
  18. Halpern, D.; Crothers, M. The sex of cognition. In Sexual Orientation: Toward Biological Understanding; Ellis, L., Ed.; Praeger: Westport, CT, USA, 1997; pp. 187–197. [Google Scholar]
  19. Galea, L.; Kimura, D. Less skilled readers have less efficient suppression mechanism. Psychol. Sci. 1993, 4, 294–298. [Google Scholar]
  20. Birenbaum, M.; Kelly, A.; Levi-Keren, M. Stimulus features and sex differences in mental rotation test performance. Intelligence 1994, 19, 51–64. [Google Scholar] [CrossRef]
  21. Jenny, B.; Kelso, N.V. Color design for the color vision impaired. Cartogr. Perspect. 2007, 57, 61–67. [Google Scholar] [CrossRef]
  22. Brewer, C.A. Spectral schemes: Controversial color use on maps. Cartogr. Geogr. Inf. Syst. 1997, 24, 203–220. [Google Scholar] [CrossRef]
  23. Olson, J.M.; Brewer, C.A. An evaluation of color selections to accommodate map users with color-vision impairments. Ann. Assoc. Am. Geogr. 1997, 87, 103–134. [Google Scholar] [CrossRef]
  24. Hollingworth, A.; Henderson, J. Object identification is isolated from scene semantic constrain: Evidence from object type and token discrimination. Psychol. Sci. 1999, 10, 319–343. [Google Scholar]
  25. Chun, M. Contextual cueing of visual attention. Trends Cogn. Sci. 2000, 4, 170–178. [Google Scholar] [CrossRef]
  26. Rosch, E. Natural categories. Cogn. Psychol. 1973, 4, 328–350. [Google Scholar] [CrossRef]
  27. Rosch, E.; Mervis, C. Family resemblances: Studies in the internal structure of categories. Cogn. psychol. 1975, 7, 573–605. [Google Scholar] [CrossRef]
  28. Lloyd, R.; Patton, D.; Cammack, R. Basic-level geographic categories. Prof. Geogr. 1996, 48, 181–194. [Google Scholar] [CrossRef]
  29. Dyce, M. Canada between the photograph and the map: Aerial photography, geographical vision and the state. J. Hist. Geogr. 2013, 39, 69–84. [Google Scholar] [CrossRef]
  30. Atkinsonova, R.L.; Atkinson, R.C.; Smith, E.E.; Bem, D.J.; Nolen-Hoeksema, S. Psychologie, 1st ed.; Victoria Publishing: Praha, Czech Republic, 1995; p. 863. [Google Scholar]
  31. Morong, K.; Sasinka, C. Hypothesis—Online software platform for objective experimental testing. In Proceedings of the International Conference Applying Principles of Cognitive Psychology in Practice, Brno, Czech Republic, 15–16 May 2014. [Google Scholar]
  32. Majidi, B.; Patra, J.C.; Zheng, J. Modular interpretation of low altitude aerial images of non-urban environment. Digit. Signal Process. 2014, 26, 127–141. [Google Scholar] [CrossRef]
  33. Chang, K.T.; Antes, J.R. Sex and cultural differences in map reading. Am. Cartogr. 1987, 14, 29–42. [Google Scholar] [CrossRef]
  34. Sikl, R. Zrakove vnimani; Grada Publishing: Praha, Czech Republic, 2012. [Google Scholar]
  35. Kempf, D.S.; Palan, K.M.; Laczniak, R.N. Gender differences in information processing confidence in an advertising context: A preliminary study. Adv. Consum. Res. 1997, 24, 443–449. [Google Scholar]
  36. Mather, G. Foundations of Perception; Psychology Press: Hove, UK, 2006. [Google Scholar]
  37. Johnson, W.; McCoy, N. Self-confidence, self-esteem, and assumptions of sex role in young men and women. Percept. Motor Skill 2000, 90, 751–756. [Google Scholar] [CrossRef]
Figure 1. Parallel and asynchronous testing in Hypothesis [31].
Ijgi 06 00231 g001
Figure 2. Example of the task of railway bridge identification in the test. Town Prerov in aerial photography (top) and topographic map 1:10,000 (bottom). (Source: INSPIRE National Geoportal, downloaded on 10 October 2013).
Ijgi 06 00231 g002
Figure 3. The source aerial photo for the task of identifying a road bridge. Town Trebic in aerial photography (top) and topographic map 1:10,000 (bottom). (Source: INSPIRE National Geoportal, downloaded on 10 October 2013).
Ijgi 06 00231 g003
Figure 4. Distribution of quartiles and minima and maxima from the time values of solving the task of identifying the road bridge.
Ijgi 06 00231 g004
Figure 5. The source aerial image for the task of identifying a river course. Town Trebic in aerial photography (top) and topographic map 1:10,000 (bottom). (Source: INSPIRE National Geoportal, downloaded on 10 October 2013).
Ijgi 06 00231 g005
Figure 6. Distribution of quartile, minima and maxima of time values for solving the task of identifying a road.
Ijgi 06 00231 g006
Figure 7. Preview of the assignment of railway station identification task. Town Ceske Budejovice in aerial photography (top) and topographic map 1:25,000 (bottom). (Source: INSPIRE National Geoportal, 8 February 2014).
Ijgi 06 00231 g007aIjgi 06 00231 g007b
Figure 8. Aerial image for identification of a military airport Prerov. Central Moravia in aerial photography (top) and topographic map 1:50,000 (bottom). (Source: INSPIRE National Geoportal, 8 February 2014).
Ijgi 06 00231 g008aIjgi 06 00231 g008b
Table 1. Overview of research tasks.
Step DesignationData Collection Methodological Steps
ACompare the success in task solution on aerial images and control maps (displaying the same area as the image).
BCompare the speed and success in tasks solutions on control maps.
CAnalyze the success rate and the speed of visual interpretation of the images with respect to respondents’ gender and professional or work experience.
DEvaluate the success in task solution to identify strategically important objects on aerial images.
Table 2. Structure of a testing block.
Part of the TestContentNumber of TasksNumber of Images and MapsType of Result
respondent datarespondent data, gender, age, education, work experience with pictures and maps100number, multiple choice
training tasksintroductory test tasks to get practice in the answering method48(0,1) text, coordinates, marking (mouse click), time
test tasksreal test with aerial images and maps55(0,1) text, coordinates, marking (mouse click), time
Table 3. Hypotheses to aerial image (I) and map (M) interpretation.
CodeHypotheses to Aerial Image and Map InterpretationResultI:M Average Success Rate Ratio
H1The success rate of aerial image interpretation all objects is the same as that of map.Not confirmed97.19:92.38 (%)
H2The speed of aerial image interpretation all objects is the same as that of map.Not confirmed20.569:30.864 (time spent in s/object)
H3The success (accuracy) in identifying the course of a watercourse on aerial images is the same as on maps.Success rate is higher on maps9.27:28.48 (%)
H4The success of interpreting critical objects on aerial images is the same as on maps.Success rate is higher on aerial images82.05:73.84 (%)
H5The speed of interpreting critical objects on aerial images is the same as on maps.Success rate is higher on aerial images119.309:146.511 (time spent in s/object)
Table 4. Statistical results of selected objects identification on aerial images and maps.
Task DescriptionIdentification of Critical Objects in Aerial Imagery and Maps
Railway BridgeRoad BridgeWatercourseRoadRailway Station
Identification of Objects on an Aerial Image and MapI ImageM MapI ImageM MapI ImageM MapI ImageM MapI ImageM Map
Number of correct answers (from possible 151)1461441011461443147126122116
Number of correct answers (%)96.6995.3666.8996.699.2728.4897.3583.4480.7976.82
Average time (s)10.728.5317.138.3356.9437.311831.641944.6311.4119.41
Max. time (s)46.1653.4597.1535.51260.79100.8912.1312.8844.78111.08
Min. time (s)3.363.334.871.128.929.5759.6431.653.030.36
Median (s)9.437.3613.536.9748.1034.794.661.939.2215.51
1. quartile (s)6.785.729.575.3933.2826.2310.7011.506.1110.04
3. quartile (s)13.189.4719.589.2070.3444.758.107.4113.3723.88
Standard deviation5.835.2612.075.0636.1916.2114.1417.527.7914.91
Table 5. Evaluation of groups of respondents in the interpretation of aerial images.
S.n.Hypotheses on the Interpretation of an Aerial Image and a MapHypothesis Validity
1Men and women are equally successful in interpreting aerial images.confirmed
2Men and women are equally fast in interpreting aerial images.confirmed
3Laymen and experts are equally successful in interpreting aerial images.confirmed
4Laymen and experts are equally fast in interpreting aerial images.confirmed
5Soldiers and civilians are equally successful in interpreting aerial images.confirmed
6Soldiers and civilians are equally fast in interpreting aerial images.not confirmed, soldiers are faster
7Crisists and non-crisists are equally successful in interpreting aerial images.confirmed
8Crisists and non-crisists are equally fast in interpreting aerial images.not confirmed, crisists are faster

