Article

Virtual Geographic Simulation of Light Distribution within Three-Dimensional Plant Canopy Models

1
Key Laboratory of Spatial Data Mining & Information Sharing of Ministry of Education, Fuzhou University, Fuzhou 350116, China
2
National Engineering Research Center of Geospatial Information Technology, Fuzhou University, Fuzhou 350116, China
*
Author to whom correspondence should be addressed.
ISPRS Int. J. Geo-Inf. 2017, 6(12), 405; https://0-doi-org.brum.beds.ac.uk/10.3390/ijgi6120405
Submission received: 25 October 2017 / Revised: 9 December 2017 / Accepted: 15 December 2017 / Published: 19 December 2017

Abstract

:
Virtual geographic environments (VGEs) have been regarded as an important new means of simulating, analyzing, and understanding complex geological processes. Plants and light are major components of the geographic environment. Light is a critical factor that affects ecological systems. In this study, we focused on simulating light transmission and distribution within a three-dimensional plant canopy model. A progressive refinement radiosity algorithm was applied to simulate the transmission and distribution of solar light within a detailed, three-dimensional (3D) loquat (Eriobotrya japonica Lindl.) canopy model. The canopy was described in three dimensions, and each organ surface was represented by a set of triangular facets. The form factors in radiosity were calculated using a hemi-cube algorithm. We developed a module for simulating the instantaneous light distribution within a virtual canopy, which was integrated into ParaTree. We simulated the distribution of photosynthetically active radiation (PAR) within a loquat canopy, and calculated the total PAR intercepted at the whole canopy scale, as well as the mean PAR interception per unit leaf area. The ParaTree-integrated radiosity model simulates the uncollided propagation of direct solar and diffuse sky light and the light-scattering effect of foliage. The PAR captured by the whole canopy based on the radiosity is approximately 9.4% greater than that obtained using ray tracing and TURTLE methods. The latter methods do not account for the scattering among leaves in the canopy in the study, and therefore, the difference might be due to the contribution of light scattering in the foliage. The simulation result is close to Myneni’s findings, in which the light scattering within a canopy is less than 10% of the incident PAR. Our method can be employed for visualizing and analyzing the spatial distribution of light within a canopy, and for estimating the PAR interception at the organ and canopy levels. It is useful for designing plant canopy architecture (e.g., fruit trees and plants in urban greening) and planting planning.

1. Introduction

The virtual geographic environment (VGE) aims to provide users with integrated tools to understand the world better, e.g., integrating urban green space typology into a procedural three-dimensional visualization for facilitating collaborative planning among stakeholders of different backgrounds [1]. Simulation is one of four components of a complete virtual geographic environment [2], and it has been regarded as a good approach for developing experiments [3,4]. Simulation has made the deductive process operable in scientific experiments related to research on the real world beyond visualization [4], e.g., for interactively assessing the photovoltaic potential in urban areas [5]. In a VGE workspace, the user conducts computer-aided geographic experiments that correspond to the real world and its physical dimensions [6]. Light is a major ecological factor that influences plant growth and development [7]. The distribution of light within a plant canopy is a valuable research issue that is beneficial to our understanding of light propagation, light distribution, and even for urban green land micro-climates [8,9].
The light distribution within a canopy determines the energy availability for a large number of physiological processes (e.g., photosynthesis and transpiration). However, the effects of light on vegetation dynamics are poorly understood, and are expressed at a quantitative level. This is partly due to a lack of quantitative methods for evaluating light interception by individual plants [10].
Traditionally, the light distribution in a canopy is measured directly with radiation sensors. Field measurements are effective, but they are time-consuming and labor-intensive. Furthermore, it is difficult to obtain data with high spatial and temporal resolution. This method is suitable for shorter trees with a small canopy; hence measuring large, tall trees is laborious. Therefore, this method is not desirable in the present state of science and technology. Thus far, efforts have focused on modeling the radiation transfer within a canopy over time. The radiation transfer model relies on the representation of the canopy and the light transfer theoretical model, e.g., radiosity [11] and Monte Carlo ray tracing [12]. A turbid medium is usually used to describe the canopy [13]. This type of canopy model generally assumes that the leaves are small, and that they are randomly and uniformly distributed throughout the canopy. This model has achieved wide success. To account for the three-dimensional radiation transfer and computational efficiency, there are two popular crown simplification schemes [14]. The first scheme is based on a single ellipsoid or cylinders that represent the crown volume with respect to the location, size, and shape of the foliage, etc. [15,16]. The other scheme employs small cubic volumes as voxels to form a regular lattice that fills the entire tree crown volume [17]. These methods have been widely applied in inverse remote sensing due to the low associated cost of computing [18]. The light interception is then usually computed according to the area index (LAI) and the extinction coefficient [15]. Although these methods have provided good estimations of the total light interception within a canopy, they do not account for the effects of local light intensity and canopy heterogeneity on the light interception, according to a few authors [7,19,20]. The turbid medium describes the canopy structure using a statistical model that is not capable of accurately computing fluxes over individual organs [21]. Therefore, a detailed description of the canopy is required for overlapping foliage [20].
Three-dimensional canopy models can quantitatively and accurately describe the plant topology, geometry and organ position. Plant organs can be represented for each individual 3D unit, and the radiation transmission and interception among the units can be simulated with the Monte Carlo ray tracing model or radiosity algorithms. At present, a number of principles, methods, and tools have been developed for describing the canopy structure, including rule-based modeling [22,23], interactive parametric modeling [24,25,26], image-based 3D modeling [27], and 3D reconstruction based on measured plant structure data [28,29].
The use of radiosity was initially proposed to achieve a realistic scene [11] using computer graphic techniques. This method describes the scattering of light based on the Lambertian law. The model was later adapted to canopies [30,31] and incorporated into a 3D model, which developed into the radiosity–graphics modeling radiation regime (RGM) by Qin and Gerstl [32]. RGM took advantage of radiosity theory and the high accuracy of 3D models with the L-system. The nested radiosity model [21] was developed to simulate the distribution of light within a canopy at the organ level, and was incorporated into the OpenAlea platform [33] to analyze the light interception of herbaceous canopies [10]. Because light scattering within a canopy accounts for less than 10% of the incident photosynthetically active radiation (PAR) [34], several researchers have directly computed the uncollided propagation of direct solar radiation and diffuse sky radiation into the canopy using ray tracing [35,36], the projection Z-buffer algorithm [37], and a virtual camera based on OpenGL [38]. These simplified methods are useful for connecting to a leaf photosynthetic mode to estimate the canopy photosynthesis rates. However, light scattering in plant foliage is important for the photosynthesis of leaves under or within the canopy. The radiosity equation fully accounts for multiple scattering between facet elements, making it well-suited for calculating the radiation within a vegetation canopy [32].
In this paper, we focused on combining existing 3D morphological modeling approaches [25,39] and the radiosity algorithm. Radiosity was used to represent the interactions between the light and organs within a canopy. This research was undertaken with the following three objectives: (1) to construct detailed 3D Muluo loquat (Eriobotrya japonica Lindl.) models; (2) to develop a software prototype to simulate light distribution within a canopy; and (3) to simulate the light distribution within a loquat canopy at the organ scale, or even at small units (facets). The expected results will provide a useful approach for photosynthesis simulation, canopy light interception analysis, and the selection of ideotypes.

2. Materials and Methods

2.1. Measurement of Loquat Canopy Structural Parameters

The loquat architectural parameters were collected from the natural germplasm resources of loquat nurseries in the Fuzhou National Fruit Gene Pool (26°7′ N; 119°20′ E). We selected a 7-year-old Muluo loquat that had never been pruned for the investigation. We measured and statistically analyzed the tree height, crown diameter, length and diameter of the central stem, length and thickness of the central shoot, the length and thickness of the lateral shoot, the location of the lateral shoot with respect to the father shoot, and the lengths and widths of the leaf blades. The number of shoots, the thickness variation along the branches, and the angle distribution range of each level of live branches from the father stem were counted and estimated. The tree height and crown diameter were 2 m and 4.4 m, respectively. The length and diameter of the central stem were 0.57 m and 0.08 m, respectively. The mean length and width of the leaf blade were 0.25 m and 0.11 m, respectively. Approximately 120 shoots were present on the whole tree. The number of leaf blades ranged from 15 to 20 on each shoot. The average leaf area of the leaflet was 63.24 cm2, as measured by hand-held Artec Eva laser scanner. The leaves were primarily distributed along the ends of the shoots. Table 1 presents the canopy structural parameters of the loquat.

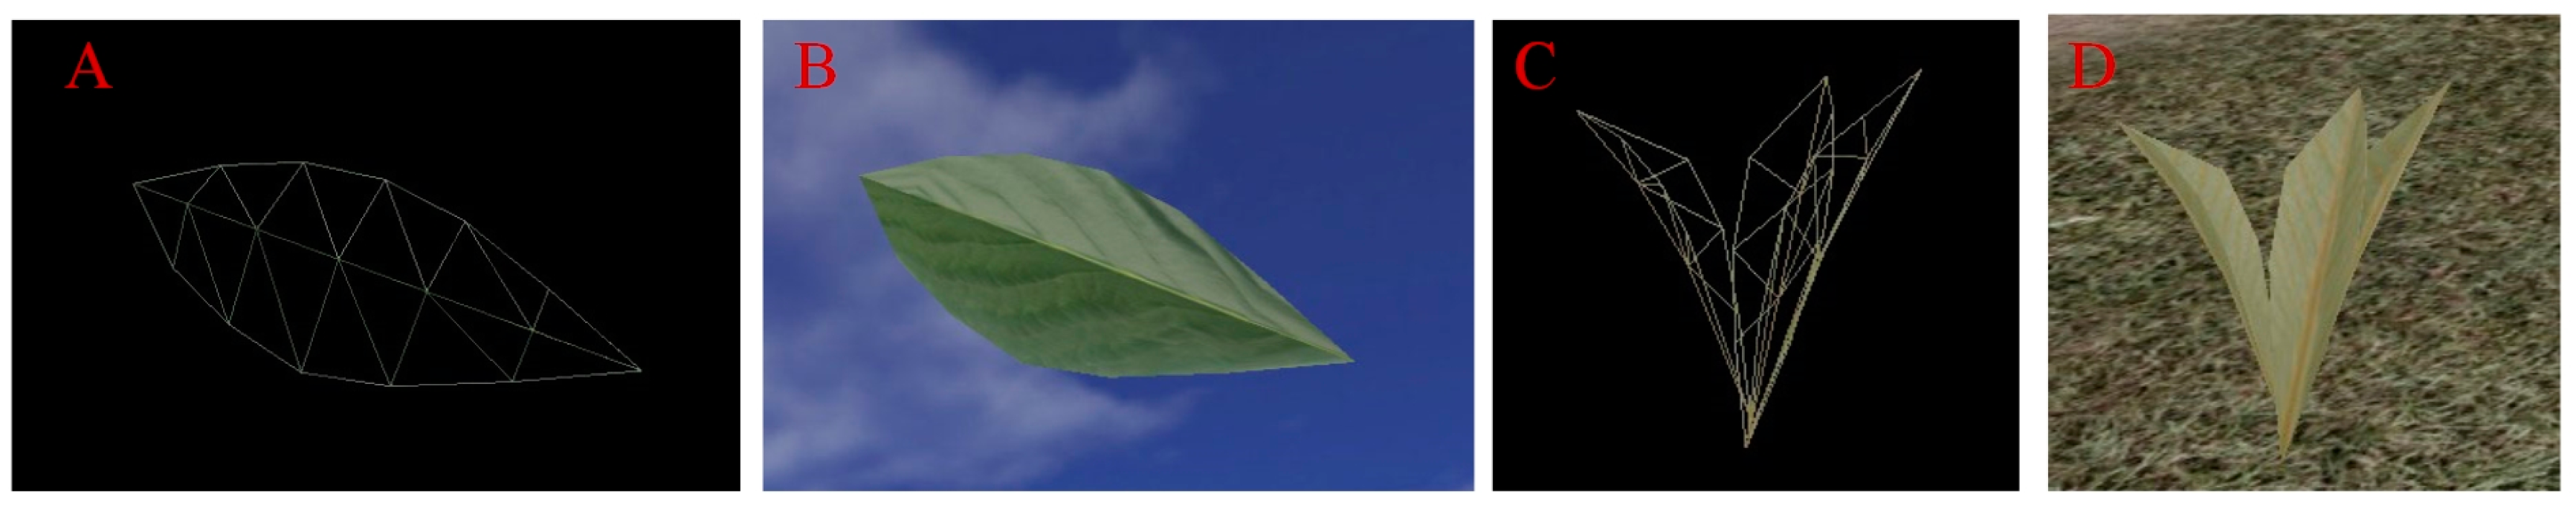
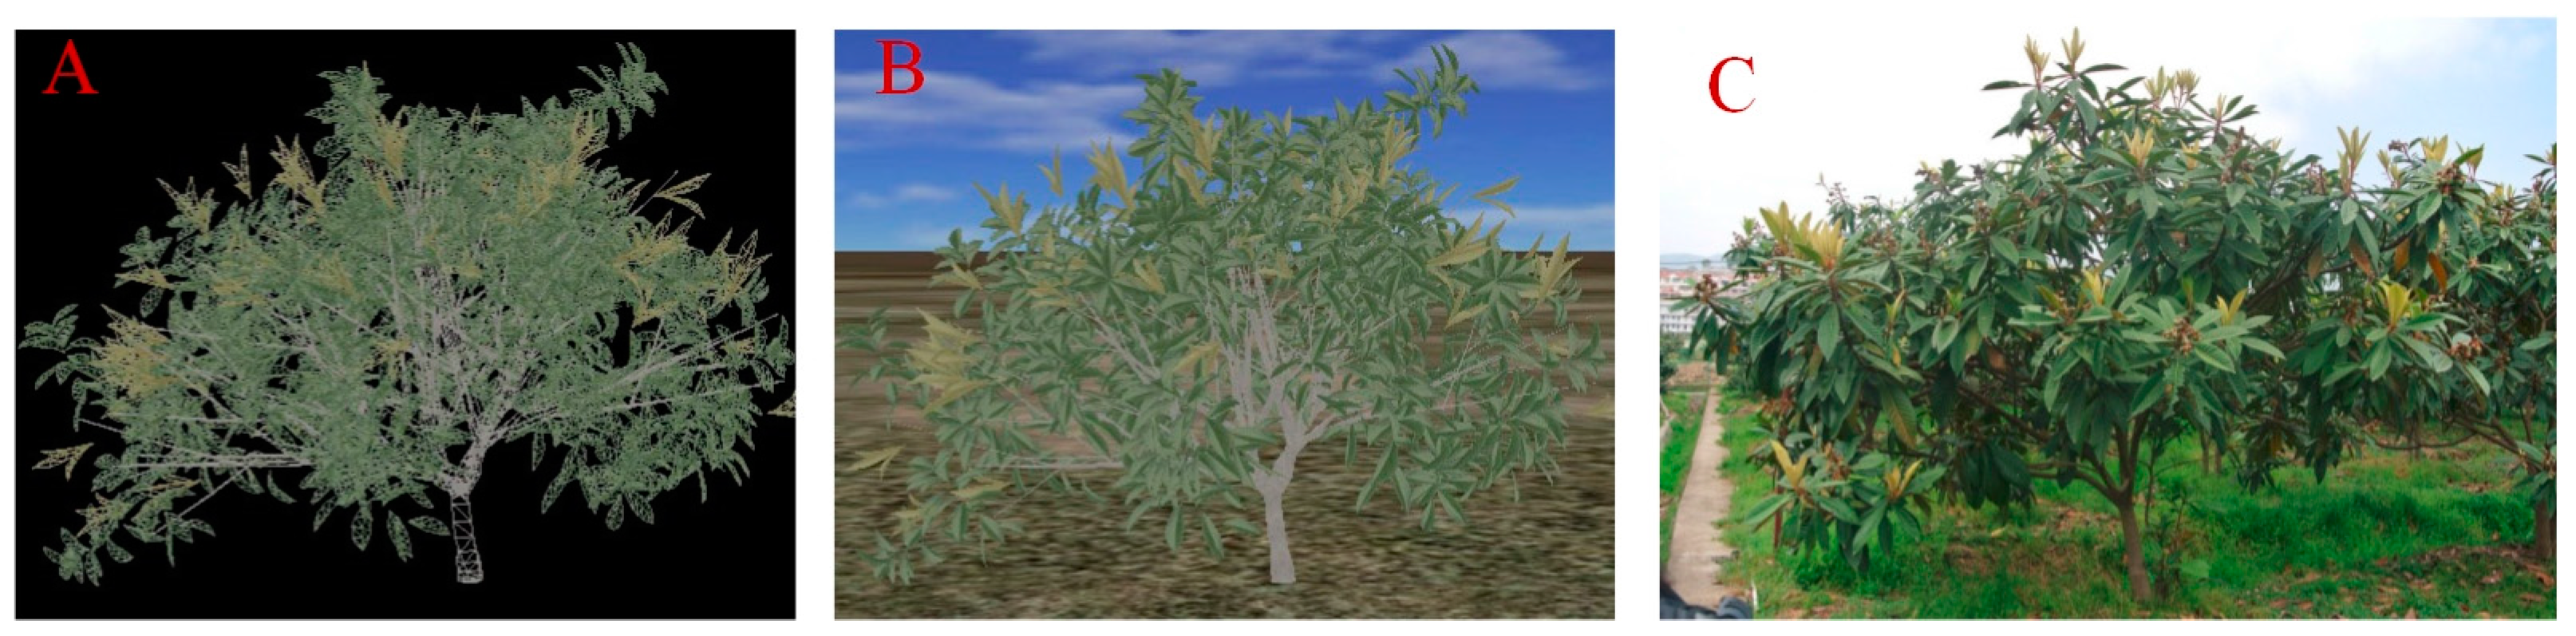
2.2. Three-Dimensional Muluo Loquat Canopy Model Generation

Detailed 3D architectural models provide the foundation for canopy radiation transfer and distribution simulation, and the precision of the 3D model has a direct impact on the accuracy of the radiation simulation [36]. As leaves are the major organs that affect light distribution and absorption, they are described explicitly. We focused on analyzing the light distribution in a Muluo loquat canopy. A 3D canopy model was constructed using the interactive parametric/individual 3D tree modeling tool known as ParaTree [25,39]. The basic element of the 3D canopy is a triangular facet. The process of building a 3D model of a loquat canopy has three key steps. (1) First, a detailed 3D leaf model is built, as shown in Figure 1A,B using 3Ds MAX software. The leaf shape of the Muluo loquat is elliptical, and its mapping was initiated using the NURBS curve surface. Control points were then modified to make the length and width of the leaf close to the actual size, to make the size and shape of the triangular facet even, and to avoid long and narrow triangles, ultimately forming a leaf model. The leaf model is represented in a triangular mesh, in which each leaf blade consists of 20 triangles in the present research. To reduce the computational load, a single 3D leaf model is applied to the entire tree. New shoot tips consist of three leaf blades, as shown in Figure 1C,D. (2) A trunk and branch model is created based on the field investigation mentioned above and using the interactive parametric individual 3D tree modeling tool ParaTree. (3) The leaf blade (leaf cluster) model is connected to the shoots according to their topological relationship and spatial distribution, the texture is mapped, and an entire 3D canopy model with 46,221 triangular facets is generated, as shown in Figure 2. The total leaf area and LAI of the model are 16.8 m2 and 1.7, respectively.

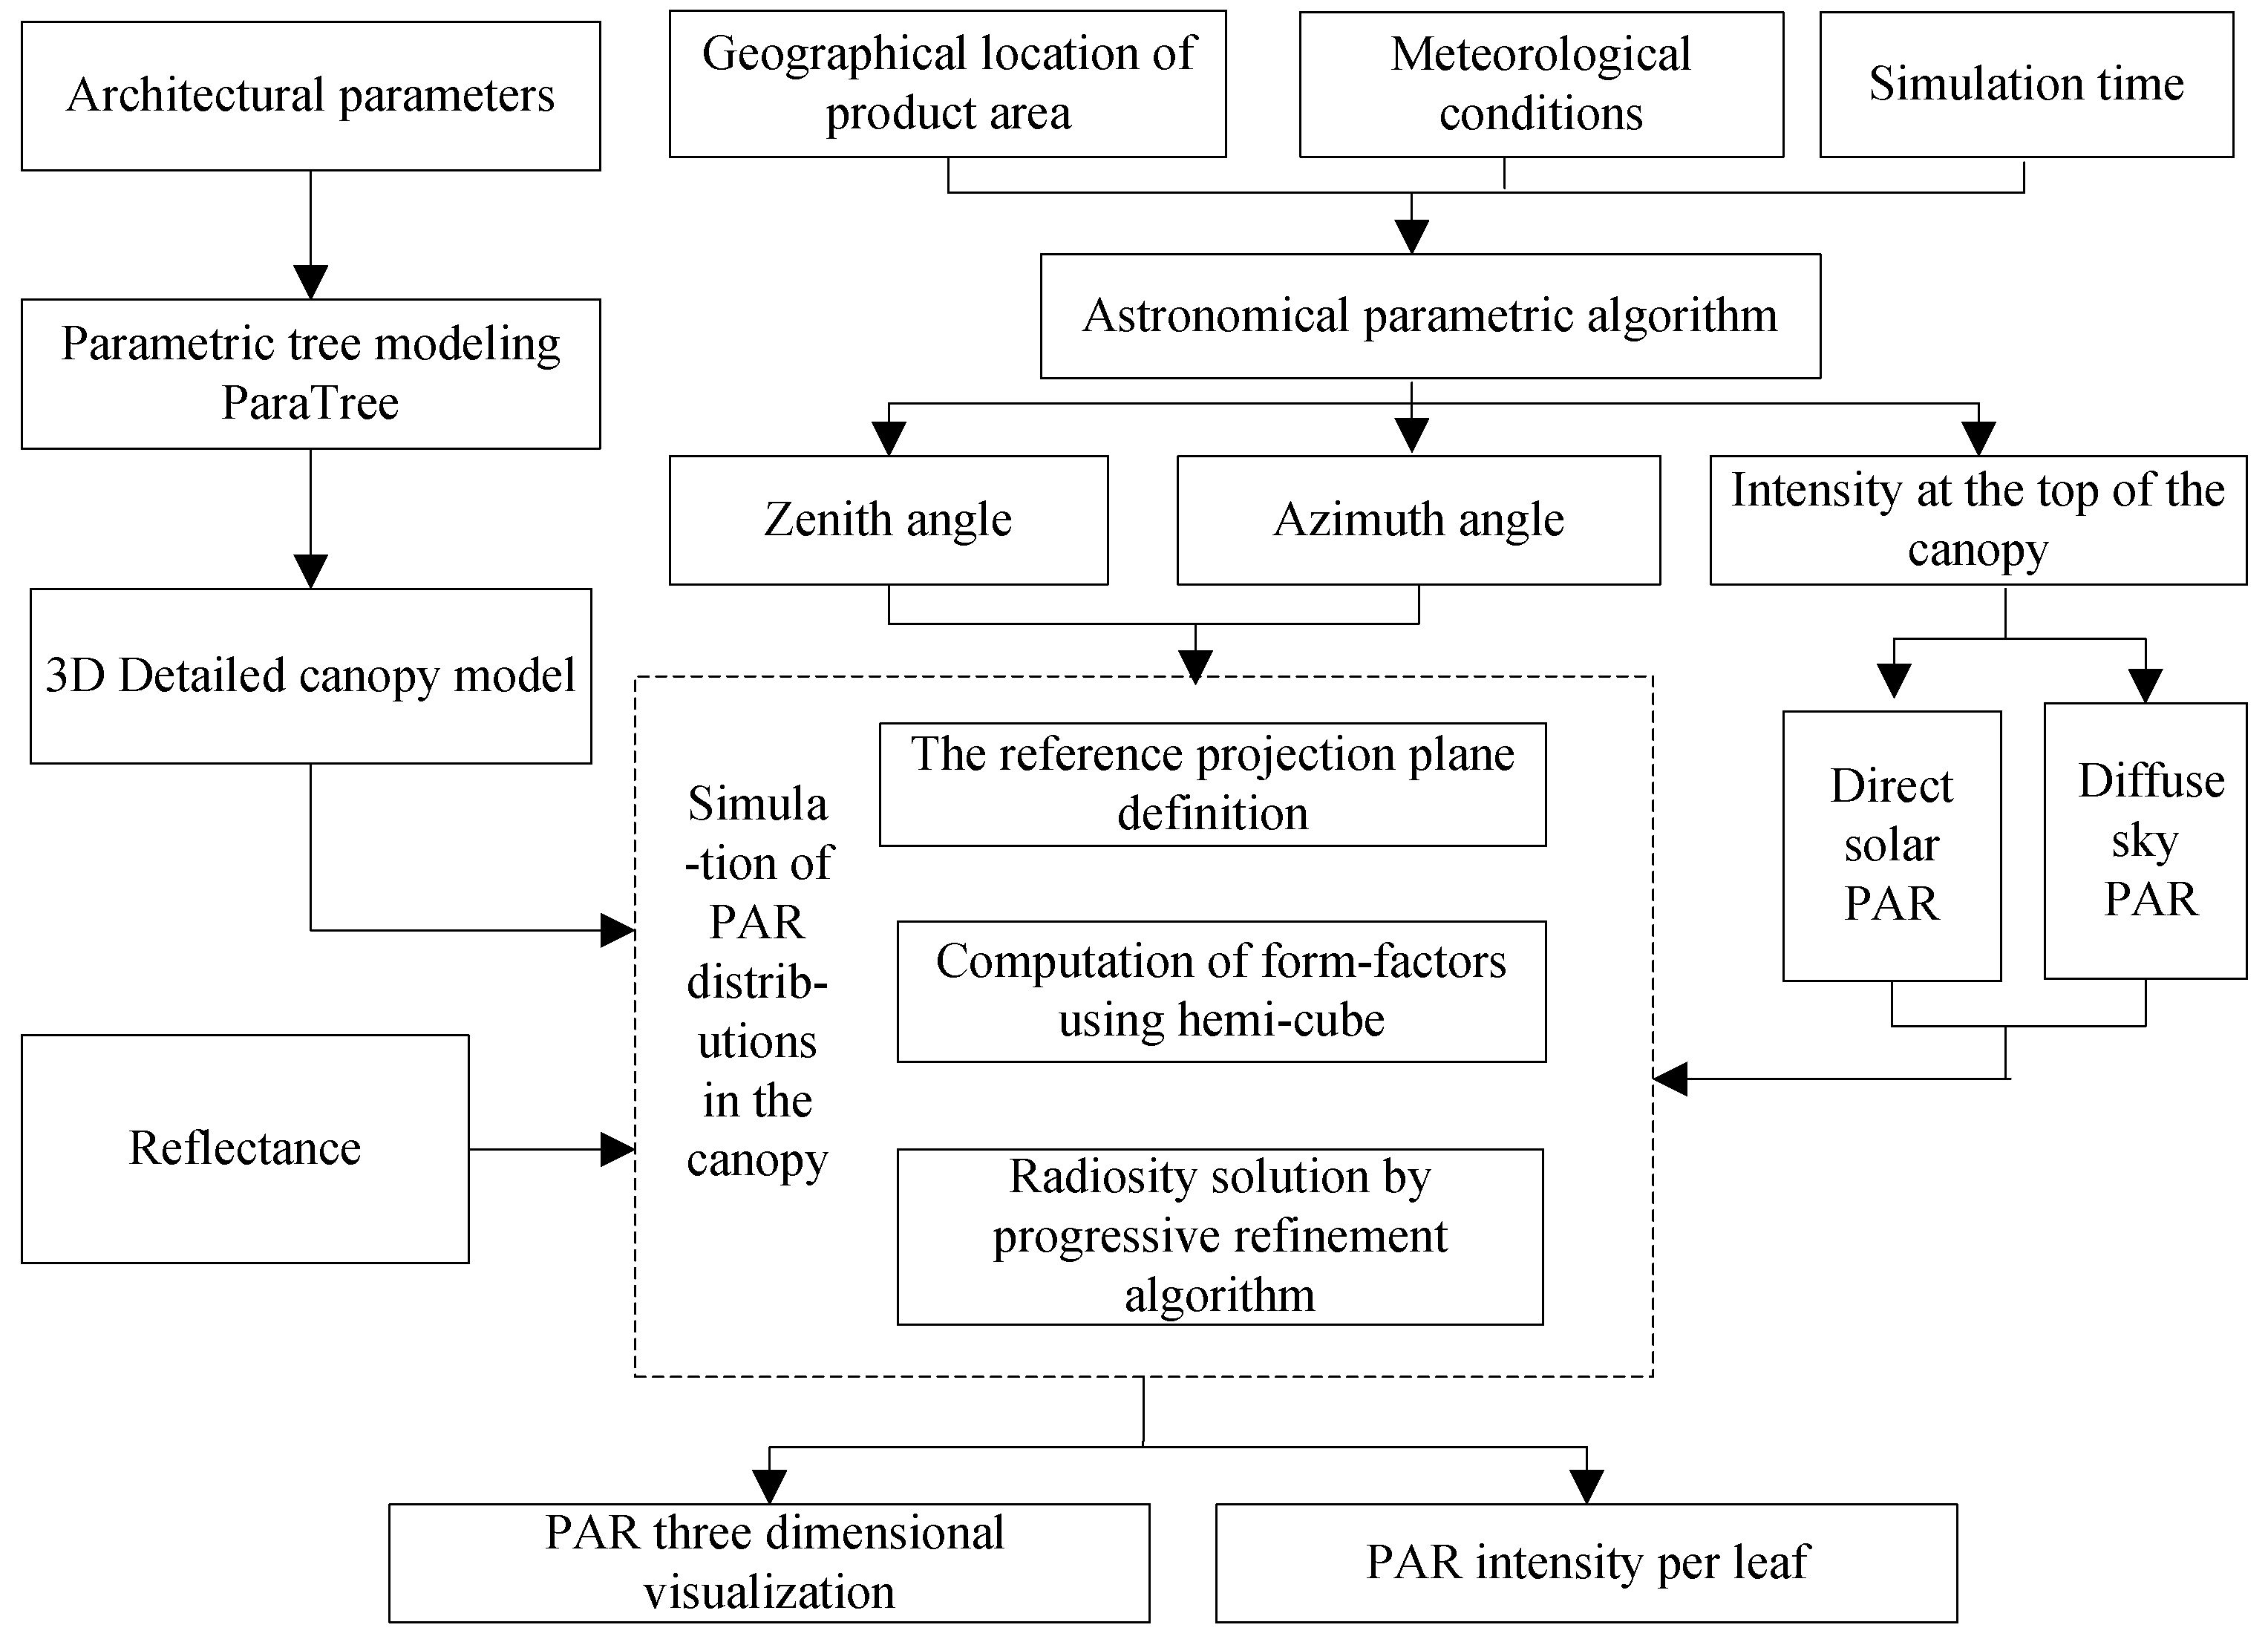
2.3. Radiosity-Based Simulation of the PAR Distribution within a Canopy

2.3.1. Equation for Radiosity

The radiosity equation originated from computer graphics for the purpose of expressing the global illumination of a scene. The radiosity equation describes the interactions of radiation based on the assumption that the surfaces are Lambertian. The diffuse radiation flux at all the surfaces can be computed by considering multiple reflection and transmission processes [11]. The radiosity equation is as follows:
B i = E i + ρ i j = 1 N B j F j i ( i = 1 , 2 , , N )
where Bi is the radiosity of facet i in a scene, namely, the total light energy exiting facet i per unit area per time. Ei is the emittance of facet i; at present, Ei is null for plant leaves but is not null for light sources. ρi is the diffuse reflectivity; N is the number of surfaces in the scene; and Fji is the form factor between surface i and surface j and describes the contribution of each facet j to the radiosity at facet i.

2.3.2. Incorporation of Radiosity into a Three-Dimensional Model

The simulation prototype system for light distribution within a canopy was implemented by integrating the interactive parametric 3D individual tree modeling system ParaTree with radiosity [40] by using VC++ as the language and OpenGL and Visual Studio as the development platform. Furthermore, the system integrated an astronomical parametric algorithm to estimate the light intensity at the top of the canopy, considering the light characteristics with respect to the geographic location, direction, and time, because the light may vary temporally and spatially with the height due to the movement of the sun.
A 3D geometrical model of a Muluo loquat canopy was employed as the computational environment to determine the radiosity. The PAR distribution was simulated within the canopy. The incident radiation primarily comes from direct solar radiation, and diffuse radiation comes from the sky. The photosynthetically active wave band is generally within a range of 400 to 700 nm. Based on data from the literature, we assumed that PAR accounts for 40% of the global solar radiation energy. Figure 3 illustrates the process of radiosity-based light distribution simulation within a canopy. The primary steps are as follows: (1) The zenith and azimuth angles of the sun are calculated using the astronomical parametric algorithm [41] according to the geographical location of the plant (latitude), the day of the year, and the time of day. The intensities of the direct solar PAR and diffuse sky PAR were calculated hourly using the radiation transfer model for the atmosphere [42]. The geometry and light properties could then be identified. (2) Triangles were employed within the 3D canopy, and the form factors were computed using the hemi-cube algorithm. (3) Based on the optical properties, the radiosity equation was solved using a progressive refinement algorithm; the PAR was then estimated for individual leaf units.

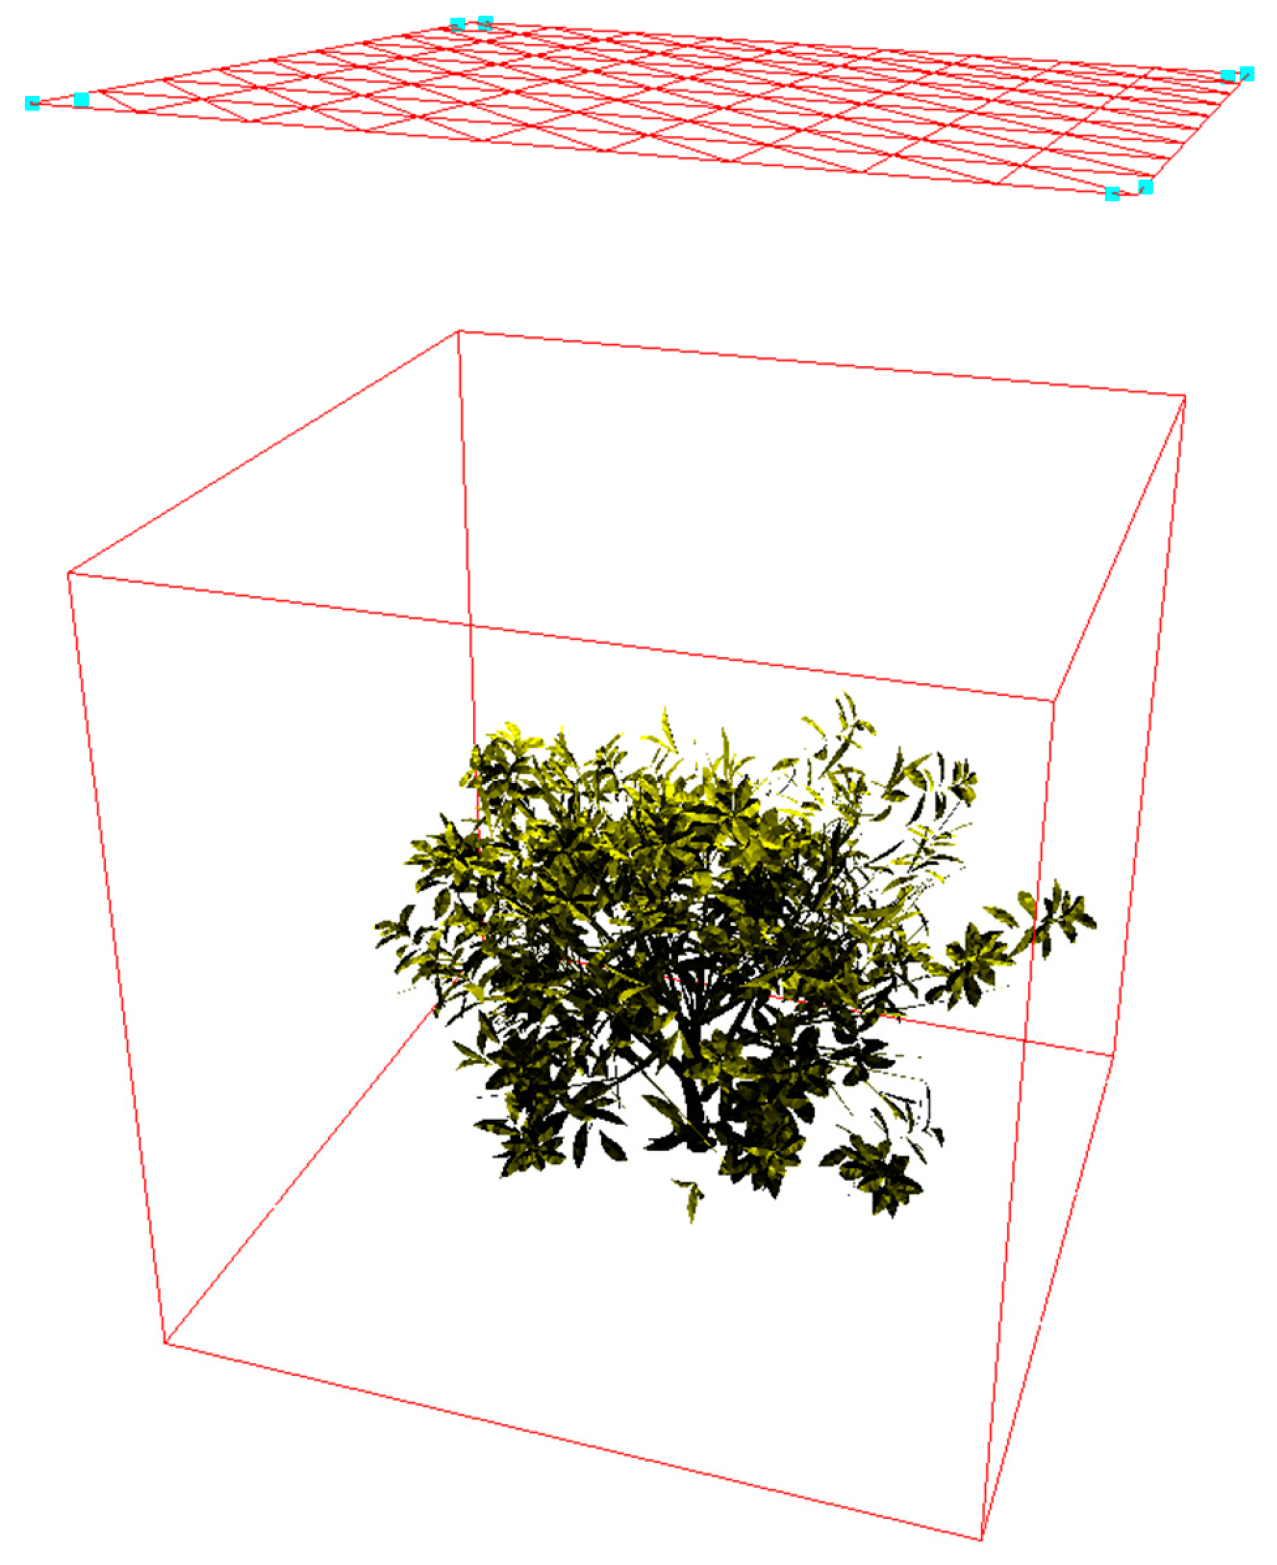
2.3.3. Definition of the Light Source

The efficient sampling of the positions and the direction of incident radiation are key issues [19]. The virtual environment was defined as consisting of the light source and the 3D tree canopy model. Since the incoming radiation is partitioned into direct solar flux and diffuse flux, the light sources include direct solar light and diffuse sky light.
The direct solar light source was described as a reference projection plane located above the canopy that was normalized to the direction of the light [36], and it was discretized into triangles. The normalization of the plane is defined according to the zenith and azimuth angles of the sun, and the reference projection plane is perpendicular to the incident light and must be large enough for rays originating from the plane to illuminate the entire canopy. The plane was first created as an infinite plane at a certain distance from the canopy surface. Figure 4 shows that when the bounding box of the tree model was projected onto this infinite plane, eight vertexes were then projected onto the plane. The minimum parallelogram containing the eight points is regarded as the reference projection plane, i.e., to define the direct solar light source. The plane was divided into a number of identical parallelograms. Each parallelogram was subdivided into two triangles (Figure 4).
The diffuse light source from the sky was described as the sky hemisphere over the canopy. The sampling of the sky hemisphere usually relies on a discretization in solid angle elements, so that the radiance within identical solid elements can be assumed to be constant. Figure 5 shows the continuous sky hemisphere as a finite set of light sources. The hemisphere is large enough to encompass all the canopy elements. The surface of the sky hemisphere was divided into a number of regions with equal solid angle sectors. The hemisphere is partitioned with the reference direction of the meridians and parallels. The light source from the sky was approximately simplified as a number of triangular light sources (Figure 5).

2.3.4. Computation of Form Factors

The hemi-cube algorithm is one of the major methods that is employed for computing the form factors in radiosity [40,43]. The present research integrated this method to simulate the light distribution within a canopy. For each element of the canopy model, its center is regarded as the center of the overhead hemi-cube. The five faces of the hemi-cube are divided into grids with 100 × 100 elements. Each solid angle was defined according to each elemental area of the face and center of the hemi-cube. Each hemi-cube face defines a view volume to define which elements of the environment are visible. The visible elements were projected onto each hemi-cube face, and the approximate form factor of the elements was determined by summing up the area of the grids covered by the projection.

2.3.5. Solving the Radiosity Equation

The radiosity equation is solved on the basis of a progressive refinement algorithm [40,44]. The algorithm process is as follows: (1) The initial exitance of each element in the environment is determined. Only the light source elements have nonzero values for photon flux, and are determined by the intensity of the light source. On the other hand, the values for the tree canopy model are all initialized to zero. (2) The element with the greatest amount of photon flux to the shoot is selected, and the exitance received by every other element in the environment is calculated, adding the value to both unsent exitance and the final exitance. The shaded element values are zero. (3) After the photon flux has been shot to each element, the unsent value is reset to zero. This element can shoot again only after receiving further photon flux from the other elements during subsequent steps. (4) Steps 2 and 3 are repeated until the total amount of photon flux varies by less than a given value.
Figure 6 shows that when a given light source facet shoots a photon flux based on its initial state, only the visible elements in the environment are illuminated, while the rest of the elements in the environment remain shaded. The results change as more light source facets shoot a photon flux and as more environmental elements receive the photon flux. These elements then become a secondary light source, shooting part of the photon flux to other elements.

2.4. Alternative Methods for Simulating the PAR Distribution within a Canopy

Ray tracing and TURTLE [45] algorithms are alternative methods that are useful for a wide variety of radiation transport problems. They were integrated into ParaTree. The former is used for computing the uncollided propagation of direct solar radiation, and the latter is used for computing the diffuse sky radiation into the canopy. The detail implementation can be found in [36]. Based on the ray tracing algorithm, a discrete number of rays were used to simulate the paths of a nearly continuous distribution of photons. The ray starting point, as well as the direction and energy of each ray, determine the triangle of the canopy components that the ray intersects at the shortest distance from the starting point. Once the triangle was found, the ray information was stored in the intersection list and the intersected triangle list. The ray information included the direction, starting location, intensity, and intersections. Thus, the energy (direct solar light) reaching each organ surface (triangle) of the canopy can be recursively calculated. The diffuse sky radiation into the canopy was implemented as follows. For each element surface (triangle) of the canopy model, its center is regarded as the center of the overhead sky hemisphere. The hemisphere was divided into many regions with equal solid angle sectors. If the ray from each region center intersects the projected element (triangle), then the region is shaded by the projected element, and the region is not viewable. Otherwise, the region is viewable. The intensity of a diffuse sky PAR-reaching element can be estimated by taking the viewable rate multiplied by the intensity of the diffuse sky PAR.

3. Results and Discussion

In the case study, all the simulations were performed in Fuzhou (26°7′ N; 119°20′ E) on 21 June 2016, under clear sky conditions. The intensity of the incoming radiation was computed from 6:00 to 18:00 in 13-hourly time steps. Specifically, the radiation intensity was estimated at the top of the canopy. The PAR obtained at the leaf level was estimated hourly during the daytime.

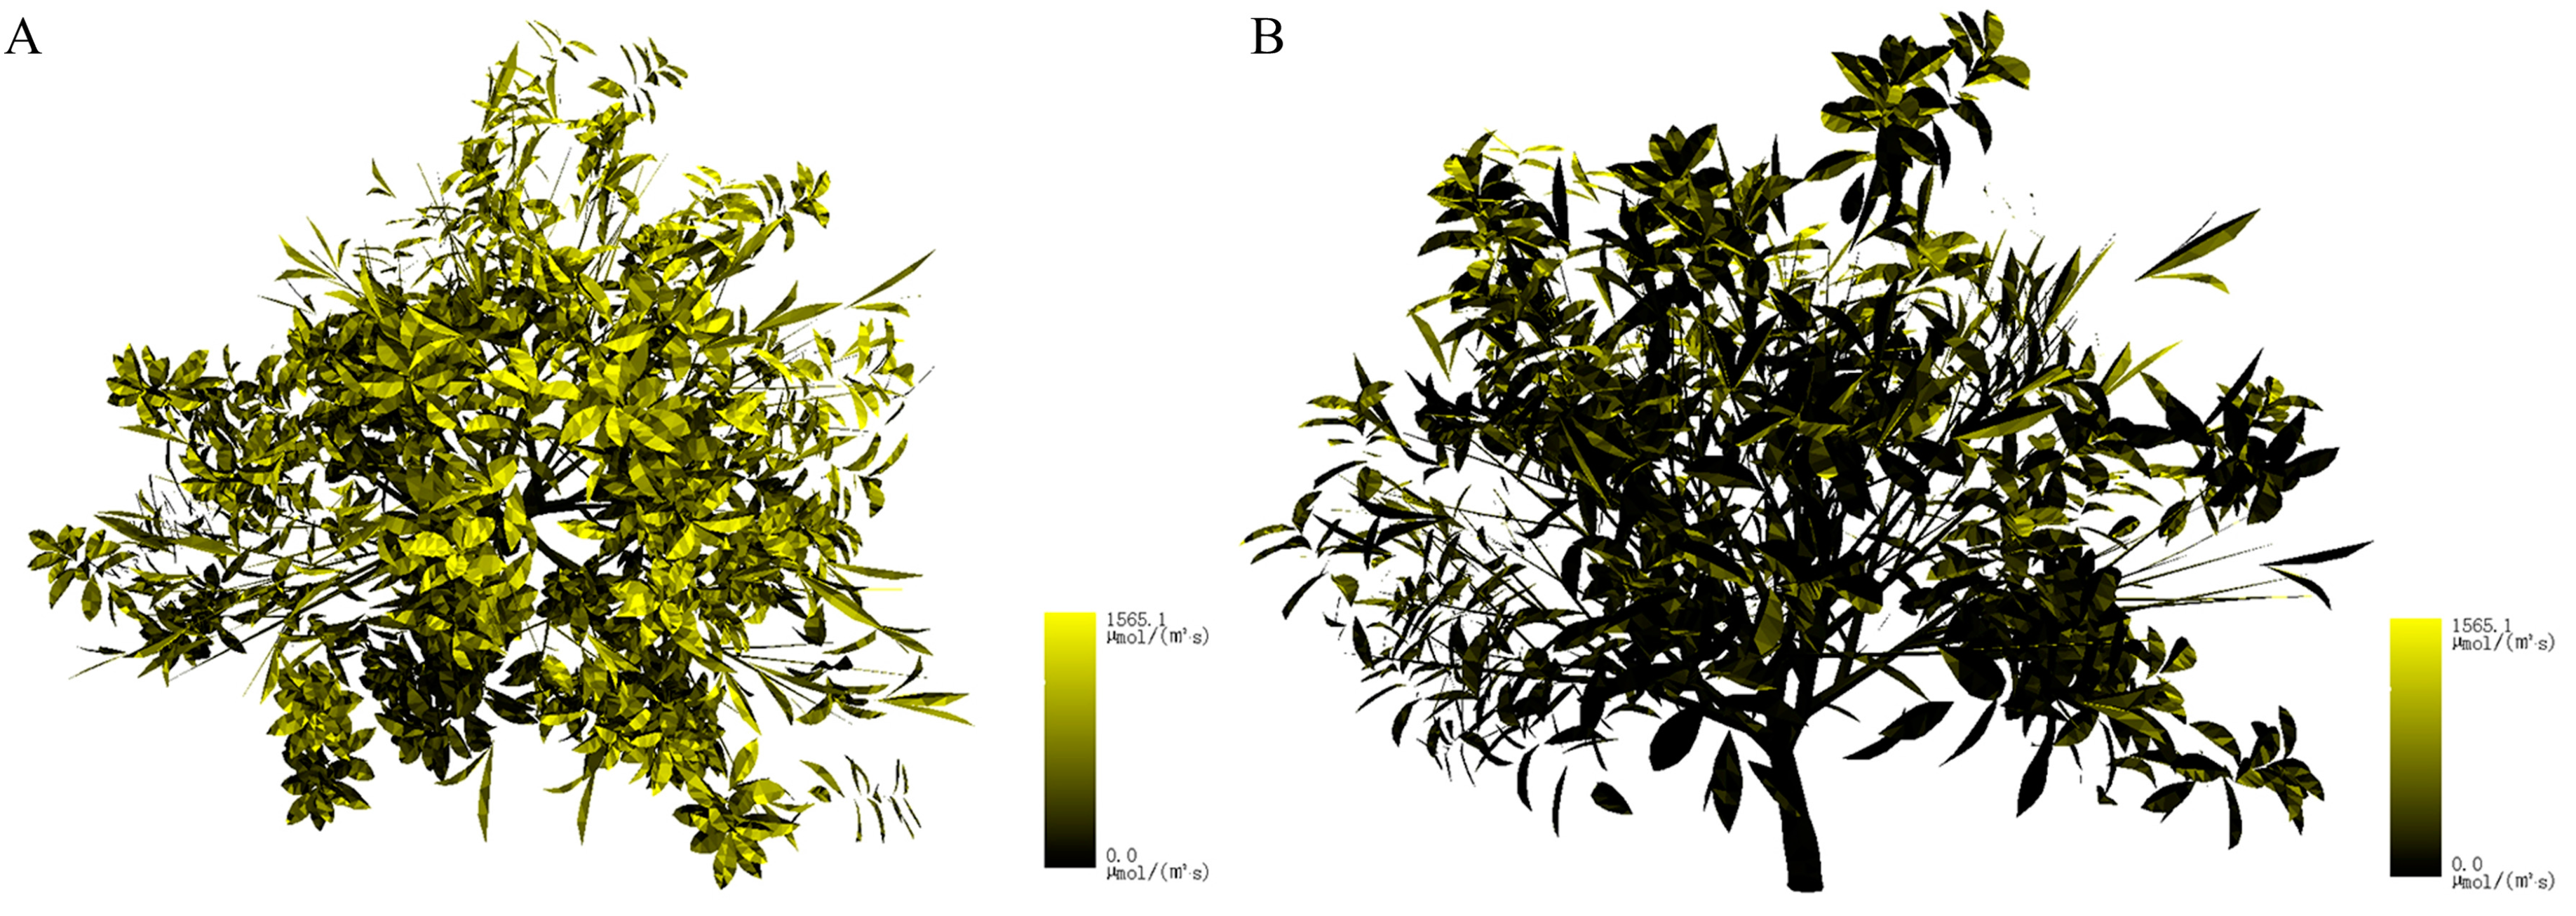
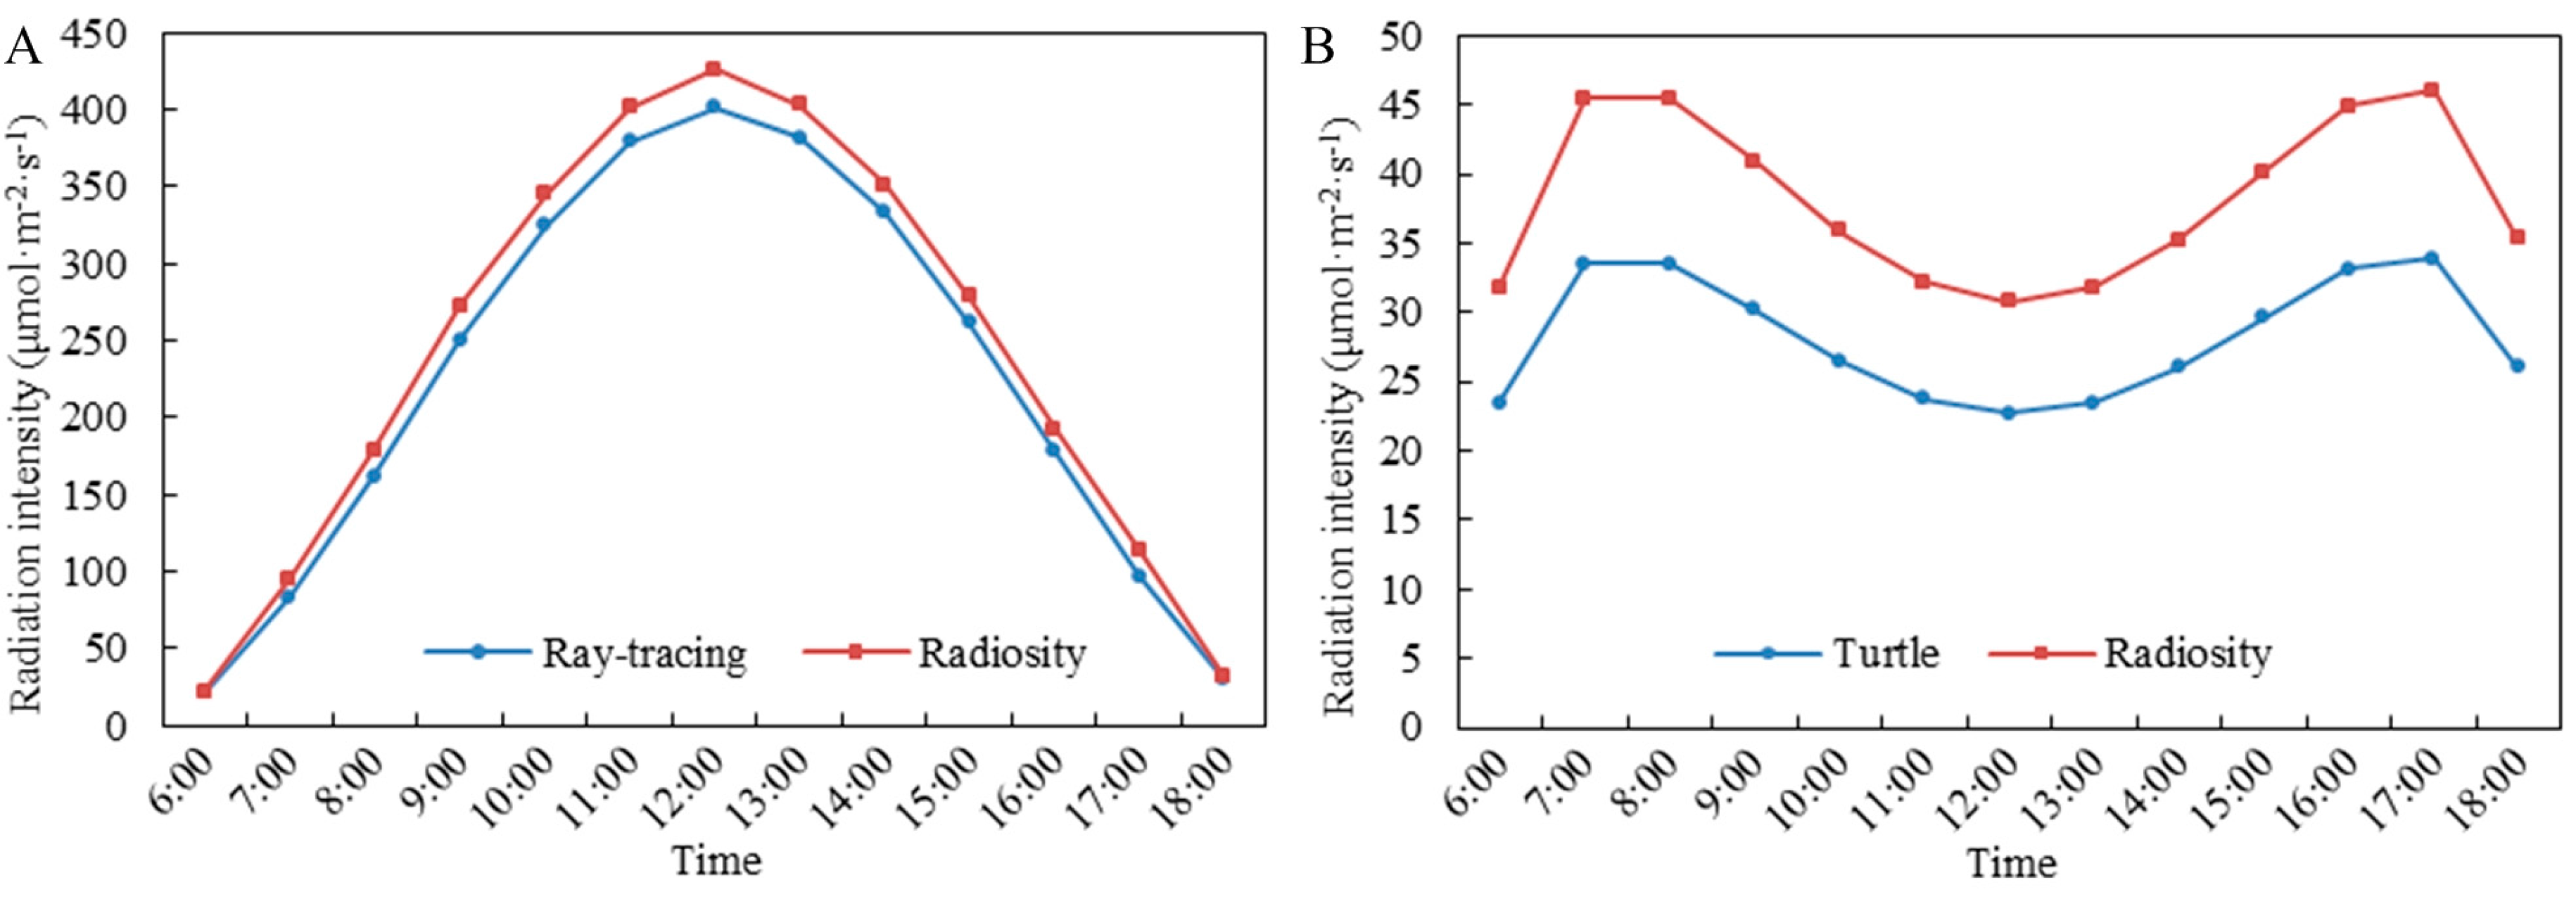
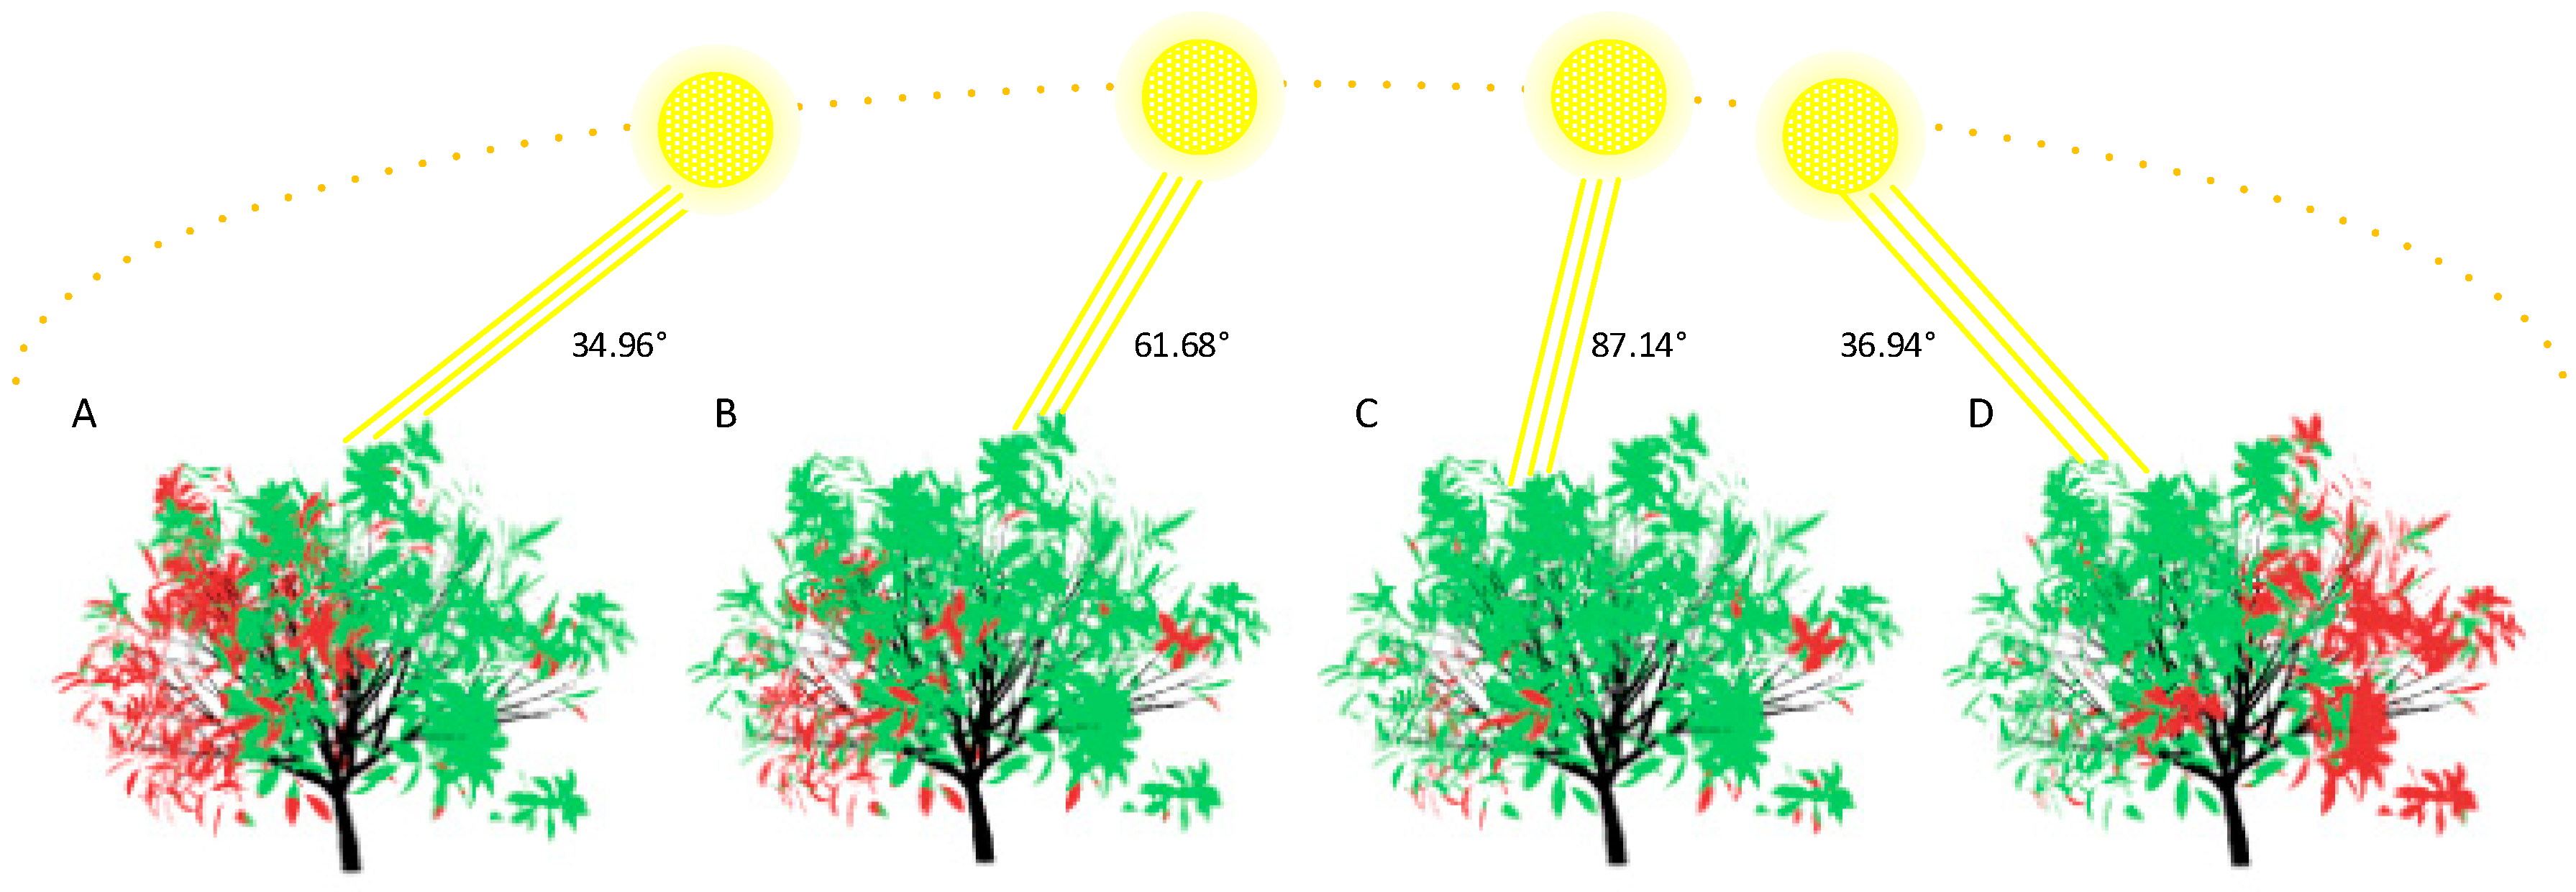
3.1. Spatial Distribution of Direct Solar PAR in the Canopy

Figure 7 presents the 3D spatial distribution of PAR within the loquat canopy, based on the incoming direct solar PAR at 12:00. The false color indicates the amount of received PAR. The daily mean intensity per leaf unit of direct captured solar PAR was 239.33 μmol·m−2·s−1, and the mean amount of direct solar PAR captured by the whole canopy was 4021.52 μmol·s−1 in the daytime. If the solar zenith was larger, then the directions of incoming light sources would be distributed nearly vertically. The amount of irradiation captured by the outer (upper) elements of the top canopy is greater than the amount captured by the inner and lower elements. Due to the overshadowing among the leaves, the direct light fractions transmitted to the foliage increased with the foliage height within the canopy, and with the distance from the center of the canopy.
Table 2 shows the parameters obtained from the simulated results of the two methods. The amount of PAR captured within the canopy as determined by the ray tracing is approximately 6.7% lower than the value based on the hourly radiosity.

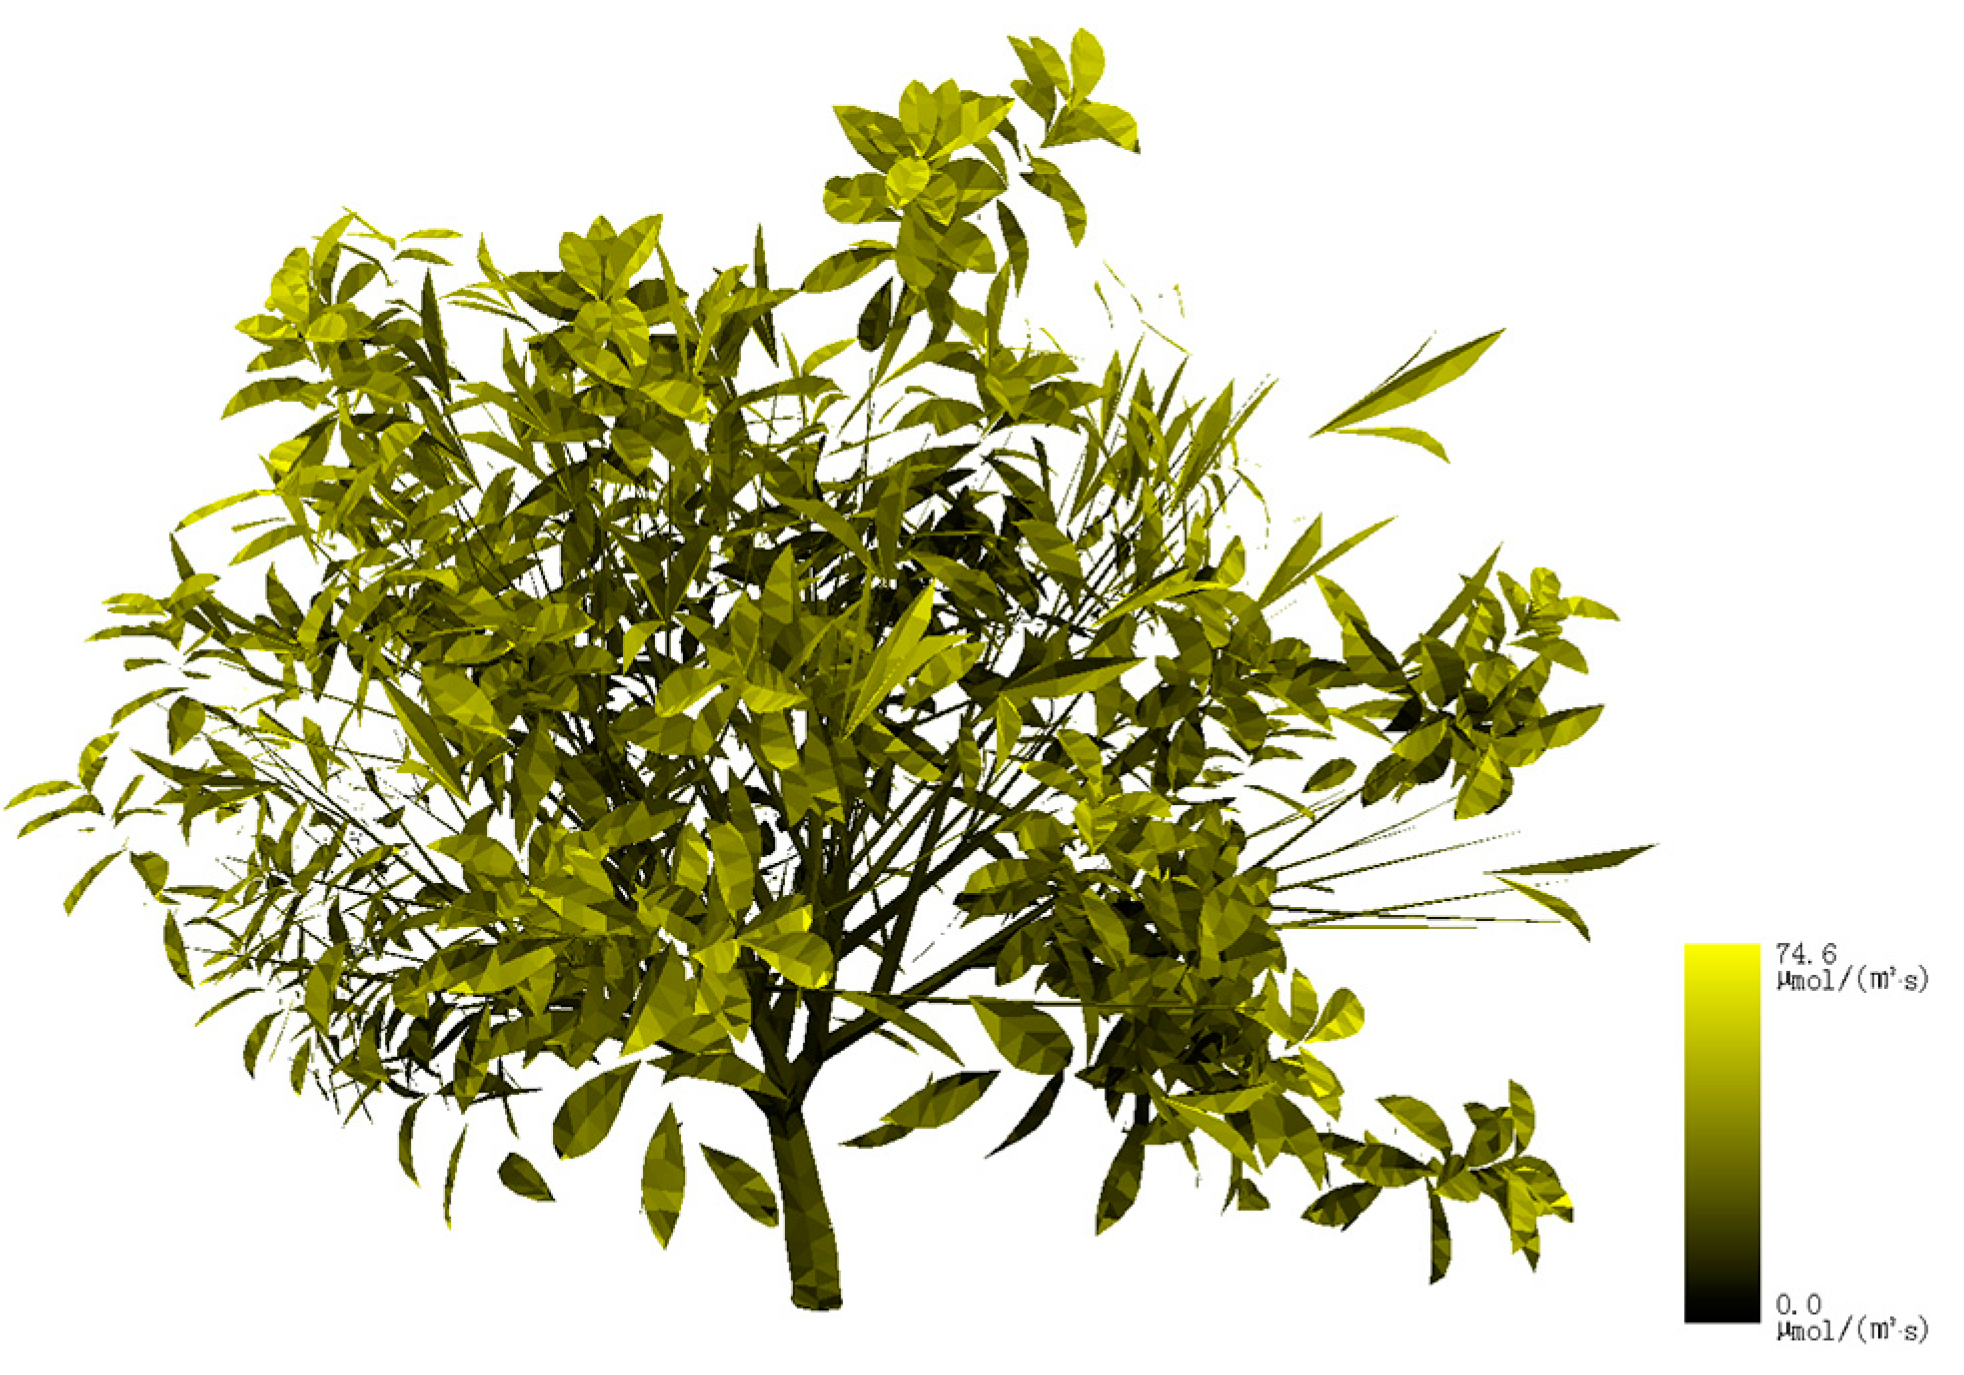
3.2. Spatial Distribution of Diffuse PAR within the Canopy

Figure 8 shows the 3D spatial distribution of diffuse PAR within the loquat canopy at 12:00. The daily mean intensity per leaf unit of diffuse captured PAR was 38.14 μmol·m−2·s−1 in the daytime, while the mean amount of diffuse PAR captured was 640.94 μmol·s−1 by the whole canopy in the daytime. A comparison of Figure 7 and Figure 8 with the legend shows that under clear sky conditions, the amount of direct solar PAR is much greater than the amount of diffuse PAR. However, the distribution of diffuse PAR was more uniform. This difference results from the larger power of incident direct solar radiation and the single-direction incident direct solar light under clear sky conditions, and the fact that the diffuse sky light remains nearly the same all day long because it does not have a privileged direction.
Table 3 shows that the diffuse light energy captured for the loquat based on hourly simulations using radiosity is approximately 26.2% greater than that obtained using the TURTLE methods.
Based on the simulation results for the direct and diffuse PAR within the canopy, which were calculated at hourly time steps, the average total PAR intensity per leaf unit was 277.47 μmol·m−2·s−1 in the daytime. The average PAR captured by the whole canopy was 4662.46 μmol·s−1.
The simulated light distribution is affected by the accuracy of the 3D tree architectural canopy model, the optical properties of plant tissues, and the properties of solar light. Nevertheless, it is difficult to measure the 3D canopy architecture accurately (e.g., the leaf position and leaf inclination) and light distribution. Therefore, validations regarding the 3D canopy radiation transfer simulation results are poor or almost non-existent. The PAR captured by the whole canopy based on radiosity was compared to the results estimated using the ray tracing and TURTLE algorithms [35,36]. Figure 9 shows the difference between the simulation results obtained using the two methods. The two results exhibit a consistent variation trend in the daytime. In this paper, the ray tracing and the TURTLE algorithm did not account for scattering among the leaves in the canopy; therefore, the difference in results may be due to the contribution of light scattering in plant foliage in radiosity. The simulation of direct PAR distribution within the virtual canopy using radiosity is found to be effective. The PAR captured by the whole canopy using radiosity is approximately 9.4% greater than that obtained using the ray tracing and the TURTLE algorithms. This difference is close to the findings in the literature, which show the light scattering within a canopy is less than 10% of the incident PAR [34]. This portion of the irradiation is generally distributed along the inner and lower areas of the canopy, where the leaves are under the light saturation point. For these leaves, an increased PAR would obviously enhance the net photosynthesis rate; thus, multiple scattering in the canopy plays a role in plant growth.

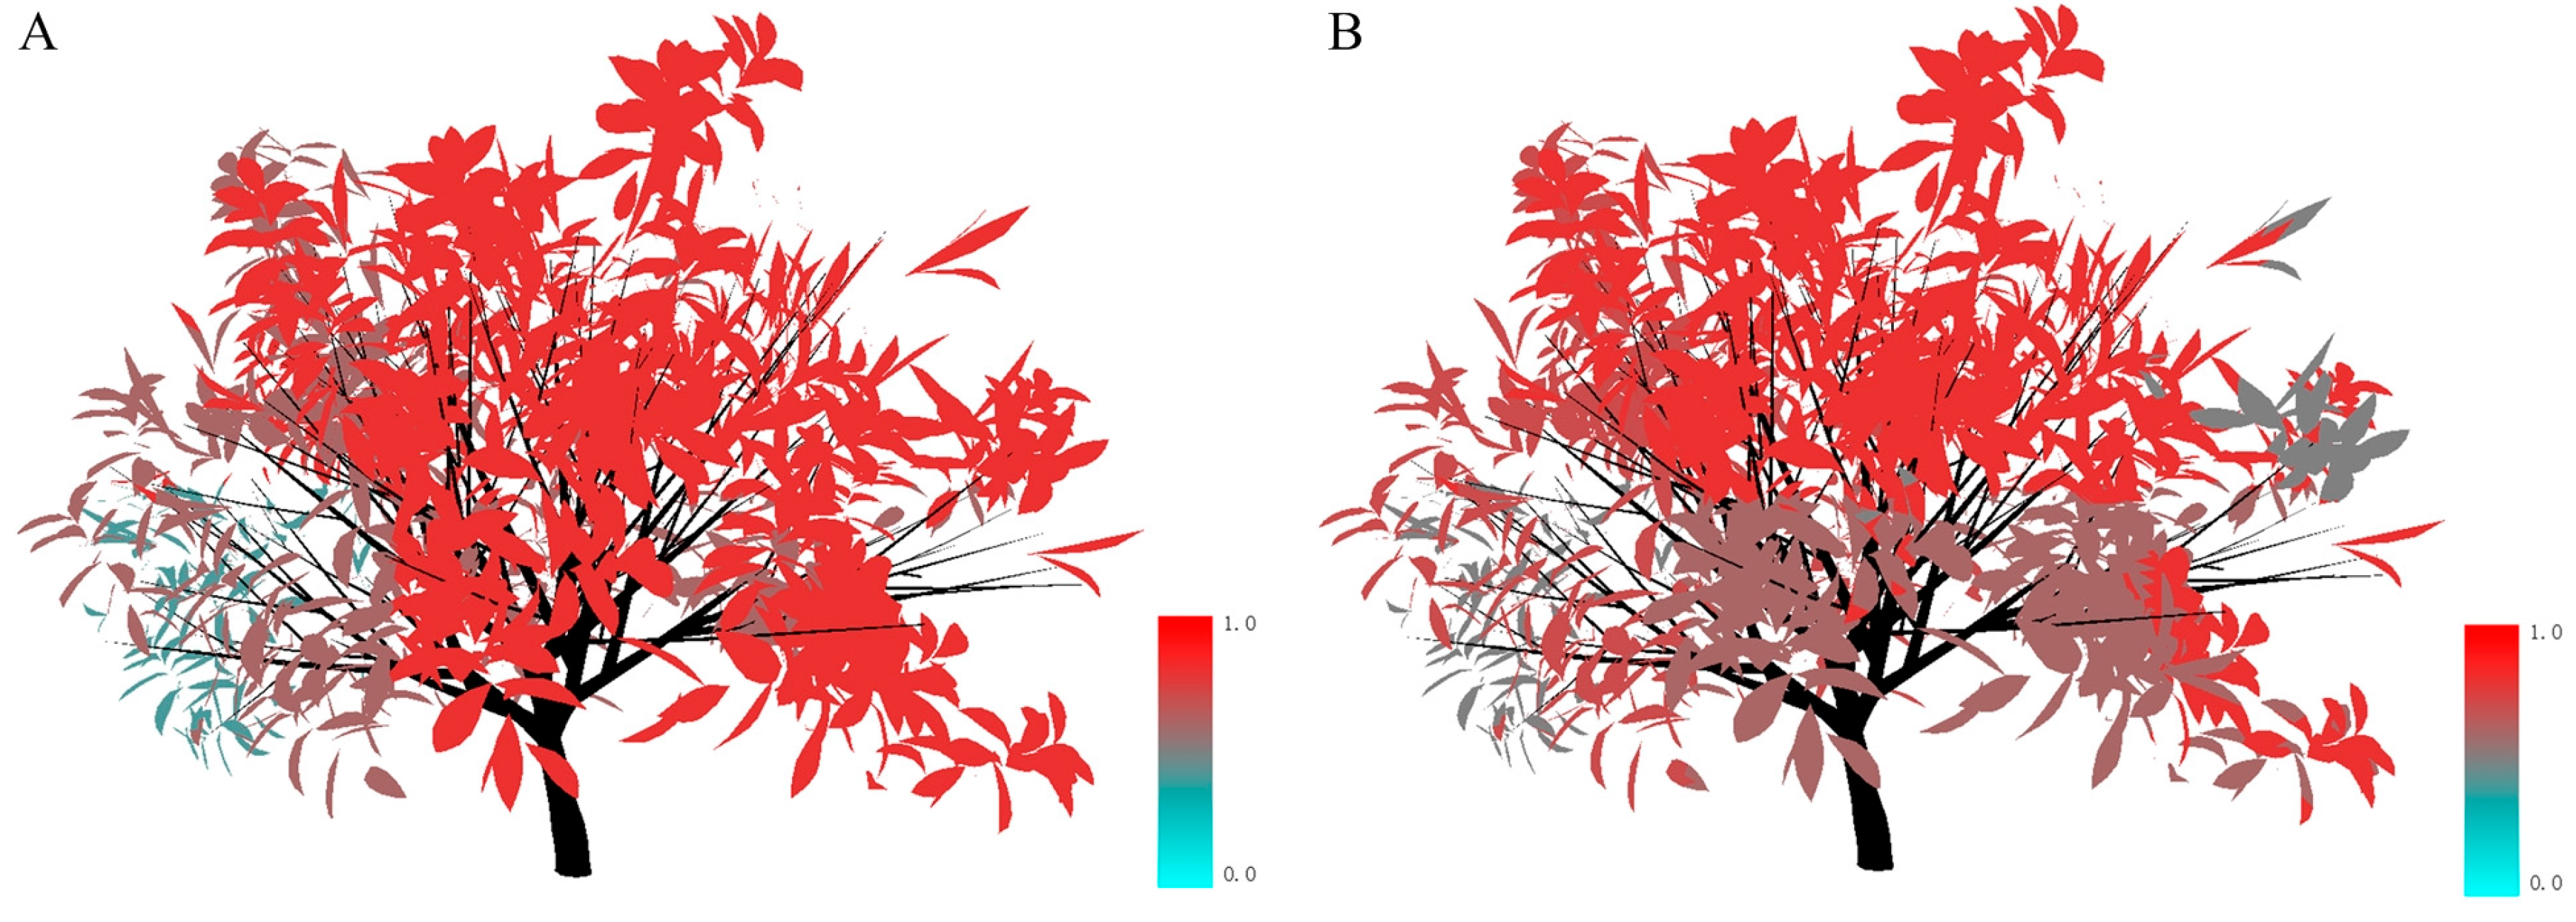
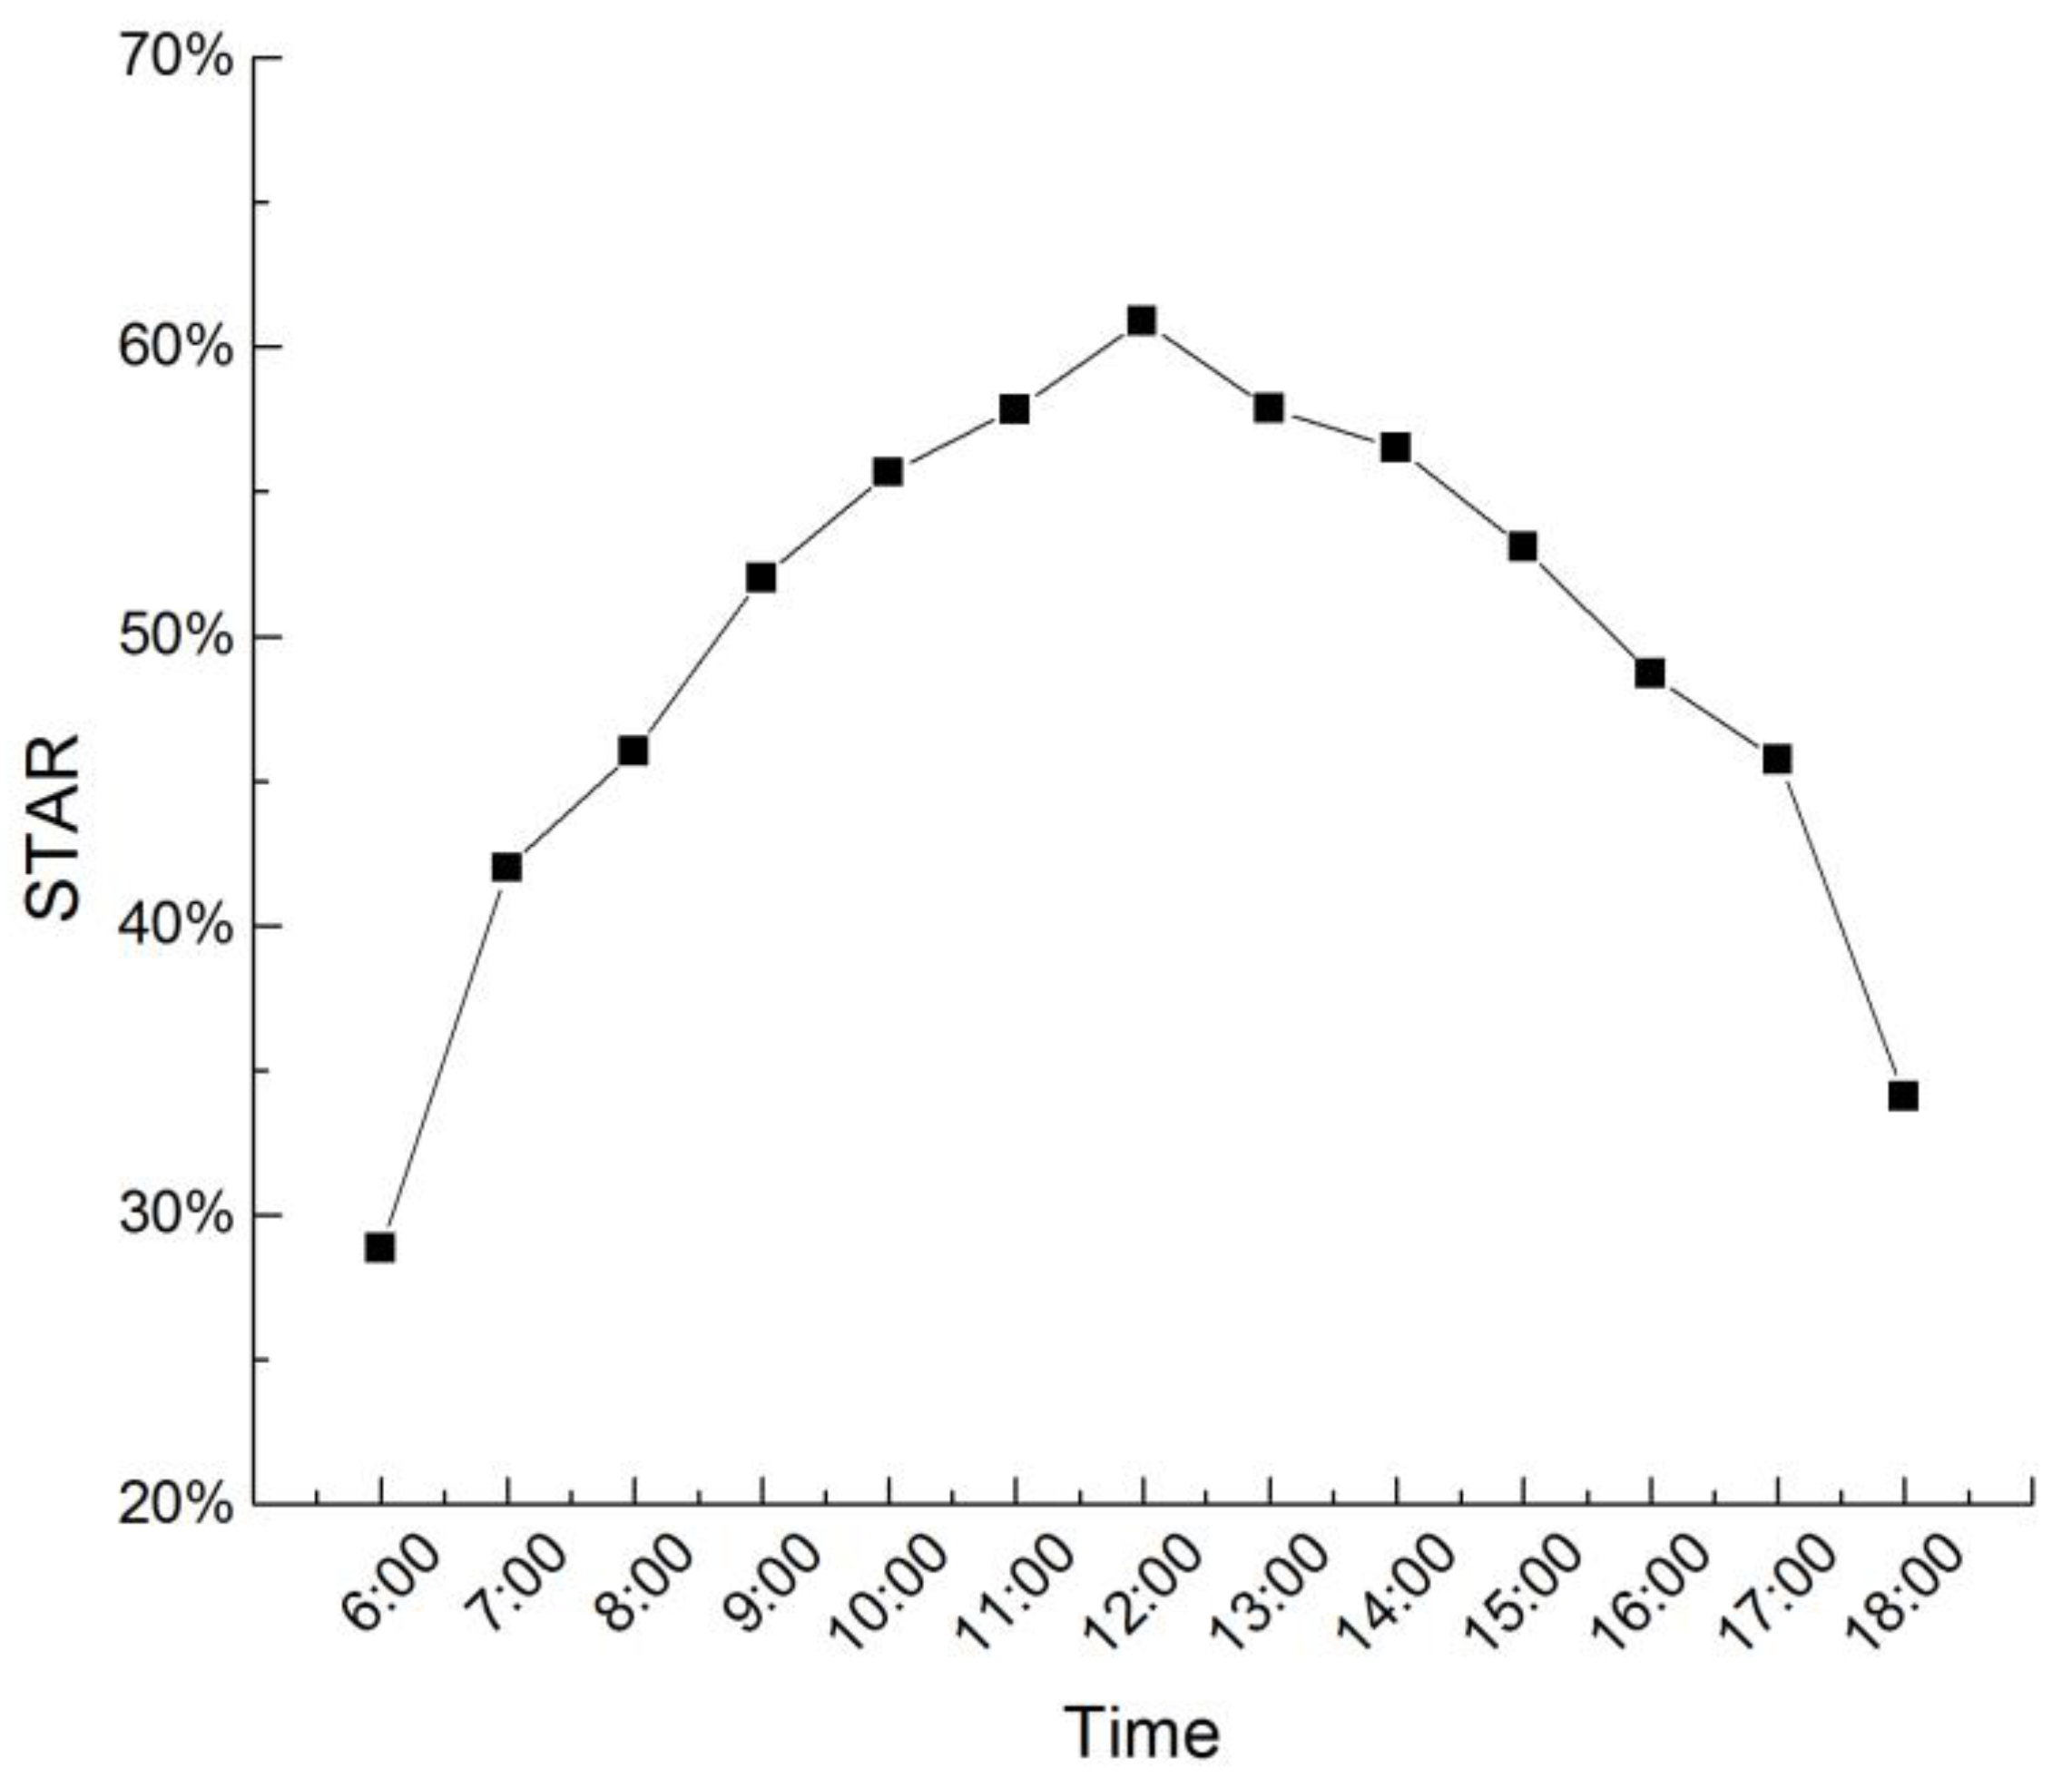
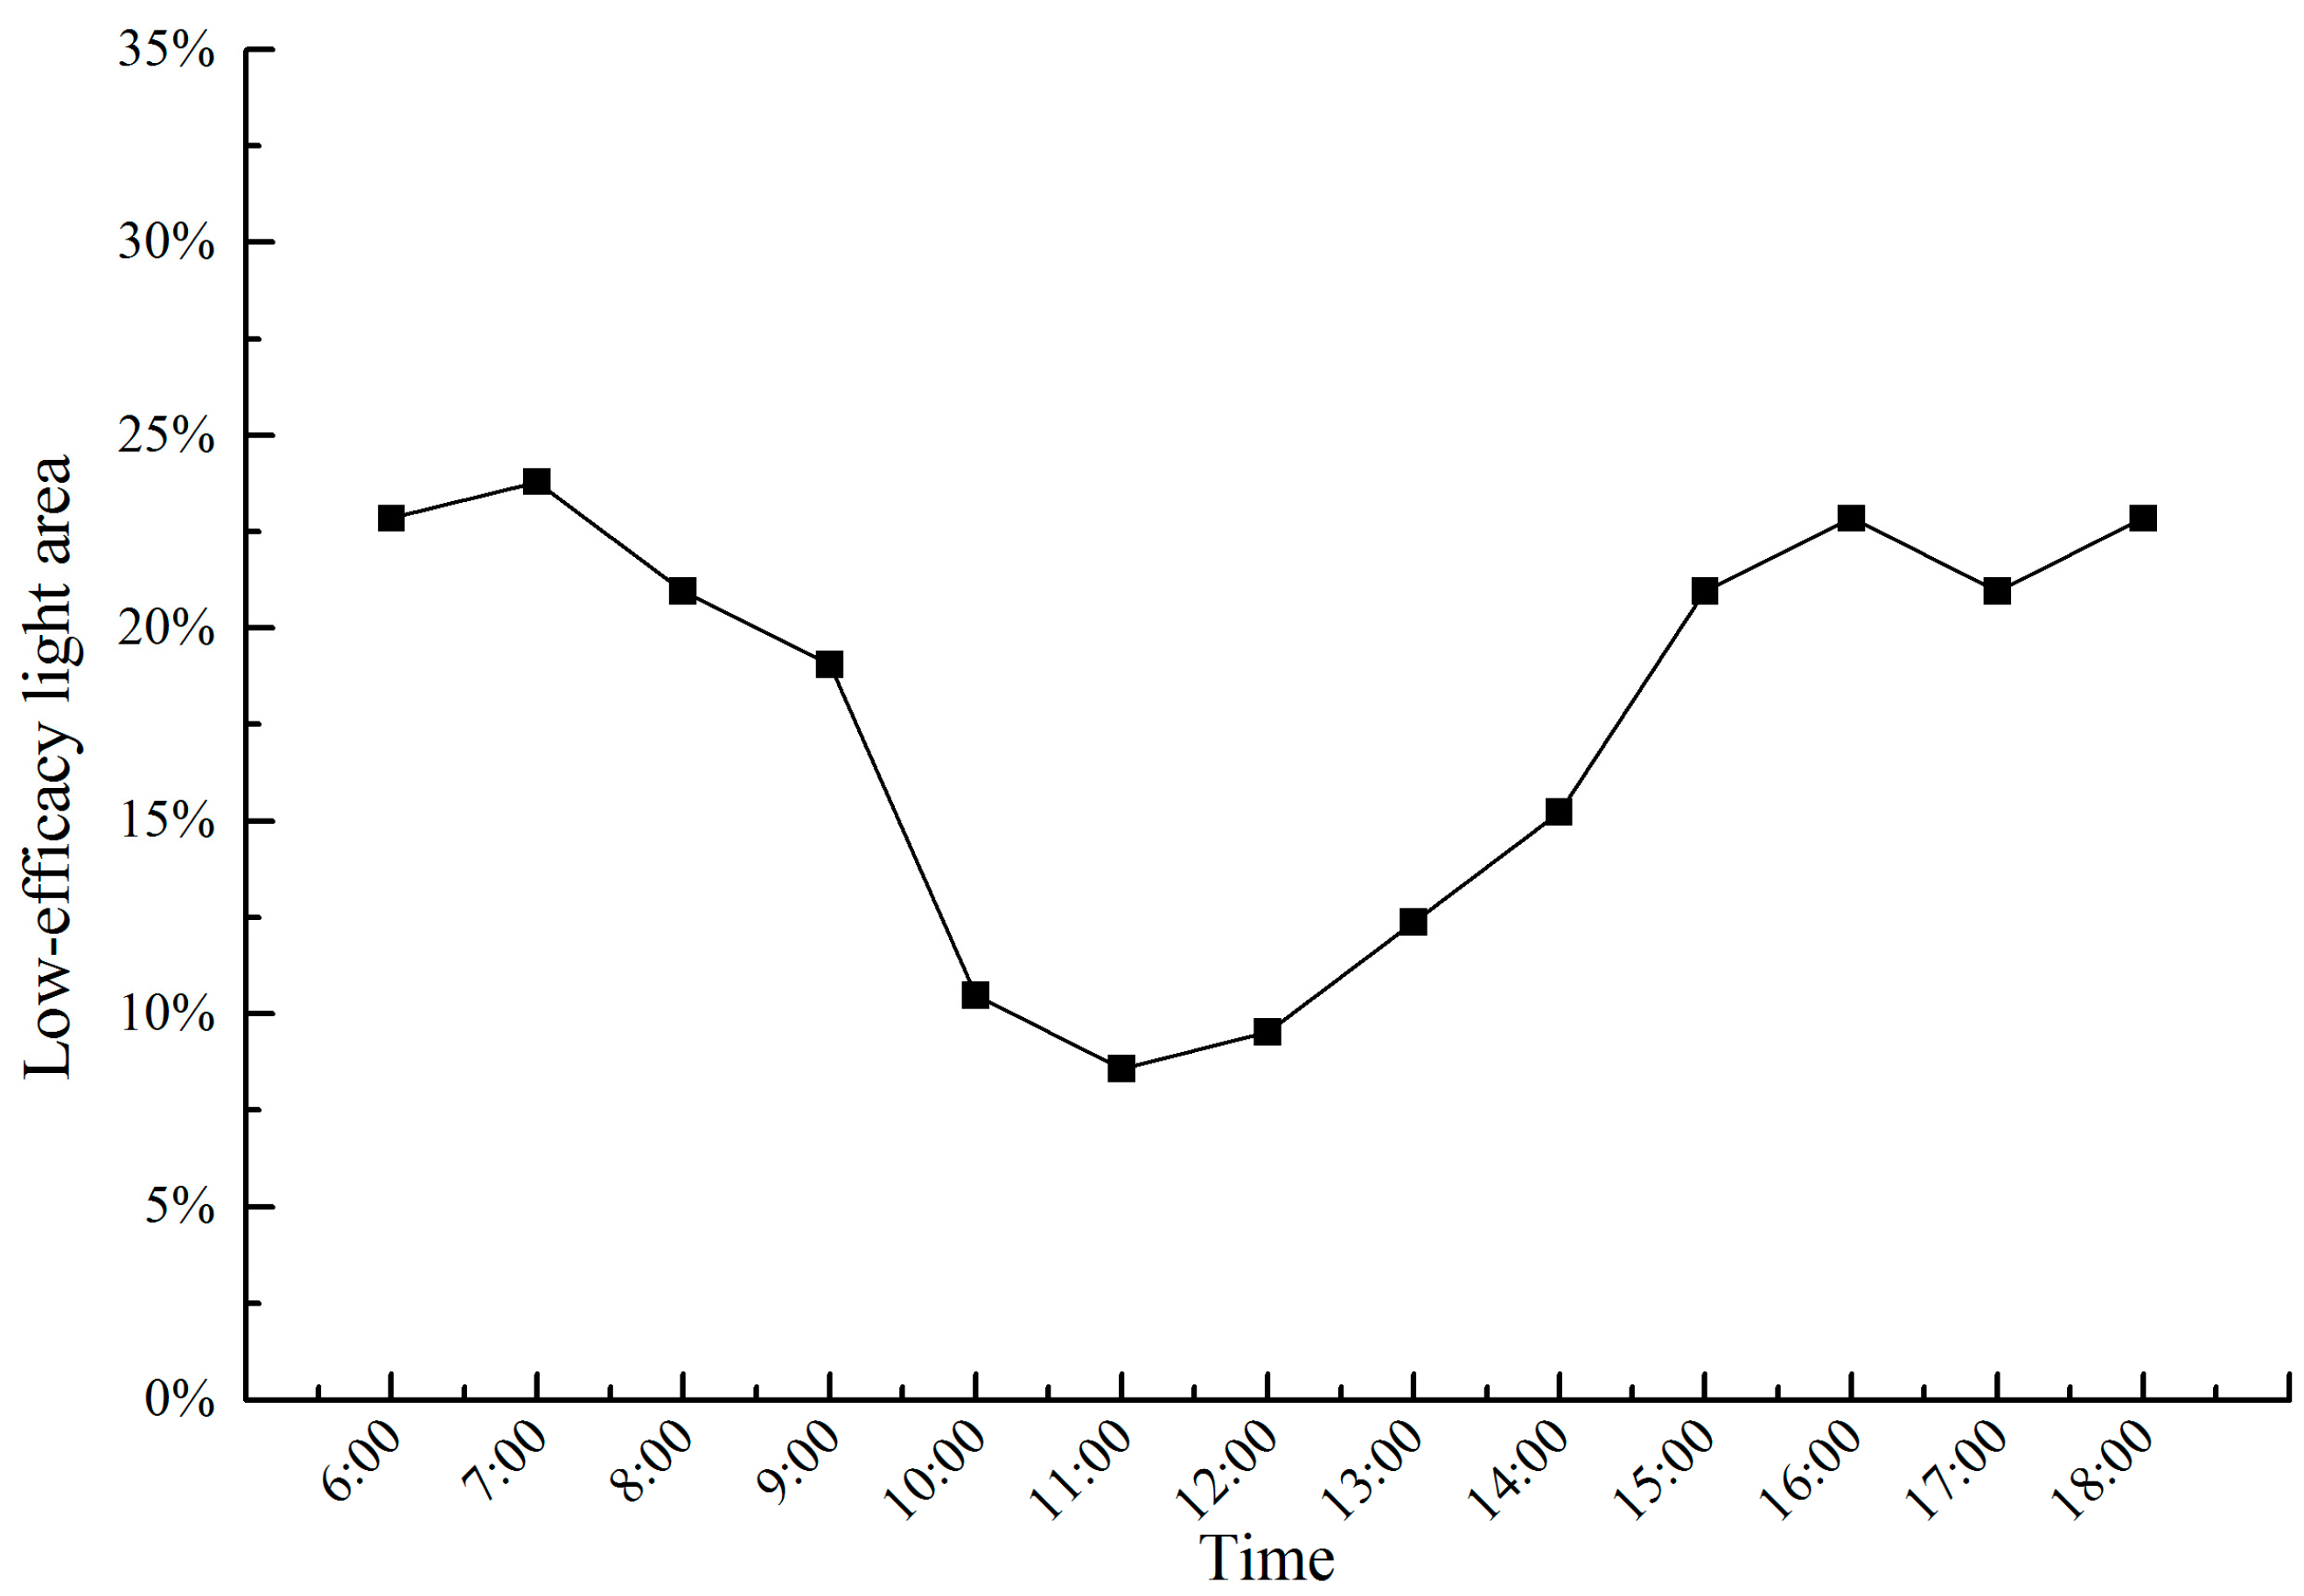
3.3. Light Interception Efficiency

The silhouette area to total area ratio (STAR) was used to analyze the light interception of the canopy. In the present study, the silhouette area refers to the leaf-captured light directly from the light source or the leaf-scattered light, which is different from the definition given in [7]. In previous studies, the silhouette area was defined as the leaf area projected onto a plane that is perpendicular to the projected direction [7]. The STAR value is calculated by comparing the silhouette area to the total leaf area. When only considering the direct solar light, the STAR value of the whole canopy ranged from 0.288 to 0.609 during the daytime, with a daily mean STAR value of 0.492. The model calculated the STAR value distribution within a canopy volume with a horizontal area of 0.5 m × 0.5 m and a height of 0.5 m. The canopy was discretized into sub-volumes, and the mean STAR of each sub-volume was calculated. The size of the sub-volume can be altered based on various requirements. Figure 10 shows the STAR value distribution within the canopy at a certain moment.
As a light interception indicator, the daily mean STAR value was 0.492, which is higher than that of a previous report that demonstrated a range from 0.238 to 0.340 for two-year-old apple trees [7]. This difference is partially due to the inclusion of scattering among leaves in the present study. In the literature, estimations of the silhouette area [7] only considered directional light. Moreover, the architecture of the apple tree and the loquat are different. Figure 11 shows that the maximum STAR value was observed at noon, while the minimum STAR value was observed at dusk or early morning. This finding implies that the canopy has a larger STAR when the zenith angle is lower. This result is similar to the finding in which the STAR of a shoot varies with its orientation relative to the direction of the light [7].
The relative photosynthetically active radiation (RPAR) was used to analyze the light interception of the canopy, which refers to the ratio of the PAR at an area in the canopy to the PAR at the top of the canopy. When the leaf RPAR in the canopy decreased to 30%, these leaves were called low-efficacy light areas in the canopy [46]. Figure 12 shows the distribution of the low-efficacy light area in the canopy at certain moments.
The average low-efficacy light area accounts for 17.73% of the entire canopy during the daytime. As an evaluating indicator of the light distribution within the canopy, a high proportion of the low-efficacy light area in the canopy often means the light distribution within the canopy is uneven. Figure 13 shows that the proportion of the low-efficacy light area accounting for the whole canopy was less than 30% based on the RPAR. According to the statistical data, the proportion of low-efficacy light area accounting for the whole canopy ranged from 8.57% to 22.86% during the daytime.
It is useful to design an ideotype canopy. To provide more detailed guidance for fruit farmers or gardeners regarding the manipulation of tree architecture, the net photosynthesis model should be employed to identify leaves with a negative net productivity (i.e., irradiance below the compensation point). If the maximization of the productive leaf area is the goal, then the pruning strategy should be based on cutting shoots with negative net productivity.

4. Conclusions

The study of virtual geographic experiments involves the reconstruction of simple 3D scenes including a single tree and light source, as well as the simulation of light transmission and distribution within a canopy. In the current study, a quantitative analysis method for determining the light distribution within a canopy was developed based on the individual tree modeling software ParaTree and an integrated radiosity-radiative transport algorithm. A detailed 3D geometrical canopy model was built, which is more similar to the real architecture than the model achieved using the turbid medium-based approach. Each organ was divided into sufficiently small 3D facets; thus, the transmission and interception processes of light were simulated at the facet levels, allowing for direct scaling from organs to canopies without assumptions of local homogeneity. It is possible to accurately estimate the PAR intercepted by leaf elements at various scales, e.g., at the shoot or whole canopy scale. This model enables us to simulate the light distributed to individual organs (facets). The simulation outputs provide critical information for models of photosynthesis. In conjunction with leaf light–photosynthesis response models, the canopy photosynthesis rates can be estimated. Using the loquat as an example, we built detailed models and simulated the PAR distribution within the canopy, analyzing the light interception of the canopy. This portion of the radiation is generally distributed along the inner and lower areas of the canopy, where the leaves are under the light saturation point. For these leaves, an increased PAR would obviously enhance the net photosynthesis rate; thus, multiple scattering in the canopy plays a role in plant growth. Furthermore, the simulation of PAR distribution within a virtual canopy using radiosity is shown to be effective. This model can be used to evaluate light distributions, and to estimate the contribution of light scattering in plant foliage. Therefore, we believe that this model is useful not only for designing an ideotype canopy and manipulating fruit tree architectures, but also for studying other biophysical models (e.g., plants in urban landscapes), and for examining the effect of canopy environment parameters, such as the temperature, within a canopy.

Acknowledgments

This work was supported by a program of the National Science Foundation of China (Grant No. 41471334) and the pilot project of Fujian Province, China (Grant No. 2016Y0058). The authors thank Jiang Jimou from the Pomology Institute, Fujian Academy of Agricultural Sciences, for his help with the structure inventory. We thank the other members of our research group for their help with the system development.

Author Contributions

Liyu Tang conceived and designed the experiments, analyzed the results and wrote the paper; Dan Yin and Shuwei Chen developed the program, constructed the experiments and analyzed the results. Chongcheng Chen conceived and modified the paper. Hongyu Huang and Ding Lin constructed the experiments and modified the paper.

Conflicts of Interest

The authors declare no conflict of interest.

References

  1. Neuenschwander, N.; Hayek, U.W.; Grêt-Regamey, A. Integrating an urban green space typology into procedural 3D visualization for collaborative planning. Comput. Environ. Urban Syst. 2014, 48, 99–110. [Google Scholar] [CrossRef]
  2. Lin, H.; Chen, M.; Lu, G.; Zhu, Q.; Gong, J.; You, X.; Wen, Y.; Xu, B.; Hu, M. Virtual geographic environments (vges): A new generation of geographic analysis tool. Earth-Sci. Rev. 2013, 126, 74–84. [Google Scholar] [CrossRef]
  3. Davis, J.P.; Eisenhardt, K.M.; Bingham, C.B. Developing theory through simulation methods. Acad. Manag. Rev. 2007, 32, 480–499. [Google Scholar] [CrossRef]
  4. Chen, M.; Lin, H.; Kolditz, O.; Chen, C. Developing dynamic virtual geographic environments (vges) for geographic research. Environ. Earth Sci. 2015, 74, 6975–6980. [Google Scholar] [CrossRef]
  5. Liang, J.; Gong, J.; Zhou, J.; Ibrahim, A.N.; Li, M. An open-source 3D solar radiation model integrated with a 3D geographic information system. Environ. Model. Softw. 2015, 64, 94–101. [Google Scholar] [CrossRef]
  6. Lin, H.; Lu, G. Virtual geographic environment: A workspace for computer-aided geographic experiments. Ann. Assoc. Am. Geogr. 2013, 103, 465–482. [Google Scholar] [CrossRef]
  7. Da Silva, D.; Han, L.; Costes, E. Light interception efficiency of apple trees: A multiscale computational study based on mapplet. Ecol. Model. 2014, 290, 45–53. [Google Scholar] [CrossRef]
  8. Morakinyo, T.E.; Yun, F.L. Simulation study on the impact of tree-configuration, planting pattern and wind condition on street-canyon’s micro-climate and thermal comfort. Build. Environ. 2016, 103, 262–275. [Google Scholar] [CrossRef]
  9. Hwang, W.H.; Wiseman, P.E.; Thomas, V.A. Enhancing the energy conservation benefits of shade trees in dense residential developments using an alternative tree placement strategy. Landsc. Urban Plan. 2017, 158, 62–74. [Google Scholar] [CrossRef]
  10. Louarn, G.; Da Silva, D.; Godin, C.; Combes, D. Simple envelope-based reconstruction methods can infer light partitioning among individual plants in sparse and dense herbaceous canopies. Agric. For. Meteorol. 2012, 166, 98–112. [Google Scholar] [CrossRef] [Green Version]
  11. Goral, C.M.; Torrance, K.E.; Greenberg, D.P.; Battaile, B. Modeling the Interaction of Light Between Diffuse Surfaces; ACM SIGGRAPH Computer Graphics; ACM: New York, NY, USA, 1984; pp. 213–222. [Google Scholar]
  12. Ross, J.K.; Marshak, A. Calculation of canopy bidirectional reflectance using the Monte Carlo method. Remote Sens. Environ. 1988, 24, 213–225. [Google Scholar] [CrossRef]
  13. Myneni, R.B. Modeling radiative transfer and photosynthesis in three-dimensional vegetation canopies. Agric. For. Meteorol. 1991, 55, 323–344. [Google Scholar] [CrossRef]
  14. Widlowski, J.-L.; Côté, J.-F.; Béland, M. Abstract tree crowns in 3D radiative transfer models: Impact on simulated open-canopy reflectances. Remote Sens. Environ. 2014, 142, 155–175. [Google Scholar] [CrossRef]
  15. Annandale, J.; Jovanovic, N.; Campbell, G.; Du Sautoy, N.; Lobit, P. Two-dimensional solar radiation interception model for hedgerow fruit trees. Agric. For. Meteorol. 2004, 121, 207–225. [Google Scholar] [CrossRef]
  16. Kolmanič, S.; Guid, N.; Diaci, J. Forestmas—A single tree based secondary succession model employing ellenberg indicator values. Ecol. Model. 2014, 279, 100–113. [Google Scholar] [CrossRef]
  17. Iio, A.; Kakubari, Y.; Mizunaga, H. A three-dimensional light transfer model based on the vertical point-quadrant method and monte-carlo simulation in a fagus crenata forest canopy on mount naeba in japan. Agric. For. Meteorol. 2011, 151, 461–479. [Google Scholar] [CrossRef]
  18. Huang, H.; Qin, W.; Liu, Q. Rapid: A radiosity applicable to porous individual objects for directional reflectance over complex vegetated scenes. Remote Sens. Environ. 2013, 132, 221–237. [Google Scholar] [CrossRef]
  19. Vos, J.; Evers, J.B.; Buck-Sorlin, G.; Andrieu, B.; Chelle, M.; De Visser, P.H. Functional–structural plant modelling: A new versatile tool in crop science. J. Exp. Bot. 2010, 61, 2101–2115. [Google Scholar] [CrossRef] [PubMed] [Green Version]
  20. Barillot, R.; Louarn, G.; Escobar-Gutiérrez, A.J.; Huynh, P.; Combes, D. How good is the turbid medium-based approach for accounting for light partitioning in contrasted grass–legume intercropping systems? Ann. Bot. 2011, 108, 1013–1024. [Google Scholar] [CrossRef] [PubMed]
  21. Chelle, M.; Andrieu, B. The nested radiosity model for the distribution of light within plant canopies. Ecol. Model. 1998, 111, 75–91. [Google Scholar] [CrossRef]
  22. Prusinkiewicz, A.L.P.; Lindenmayer, A.; Hanan, J.S.; Fracchia, F.D.; Fowler, D. The Algorithmic Beauty of Plant; Springer: New York, NY, USA, 1990. [Google Scholar]
  23. De Reffye, P.; Edelin, C.; Françon, J.; Jaeger, M.; Puech, C. Plant models faithful to botanical structure and development. ACM SIGGRAPG Comput. Graph. 1988, 22, 151–158. [Google Scholar] [CrossRef]
  24. Lintermann, B.; Deussen, O. Interactive modeling of plants. IEEE Comput. Graph. Appl. 1999, 19, 56–65. [Google Scholar] [CrossRef]
  25. Lin, D.; Chen, C.; Tang, L.; Zou, J.; Wang, Q. Interactive pruning operation on virtual tree base on color encoding. J. Comput. Aided Des. Comput. Graph. 2011, 11, 1799–1807. [Google Scholar]
  26. Tang, L.; Chen, C.; Huang, H.; Lin, D. An integrated system for 3D tree modeling and growth simulation. Environ. Earth Sci. 2015, 74, 7015–7028. [Google Scholar] [CrossRef]
  27. Quan, L.; Tan, P.; Zeng, G.; Yuan, L.; Wang, J.; Kang, S.B. Image-Based Plant Modeling; ACM Transactions on Graphics (TOG); ACM: New York, NY, USA, 2006; pp. 599–604. [Google Scholar]
  28. Sonohat, G.; Sinoquet, H.; Kulandaivelu, V.; Combes, D.; Lescourret, F. Three-dimensional reconstruction of partially 3D-digitized peach tree canopies. Tree Physiol. 2006, 26, 337–351. [Google Scholar] [CrossRef] [PubMed]
  29. Zhang, X.; Li, H.; Dai, M.; Ma, W.; Quan, L. Data-driven synthetic modeling of trees. IEEE Trans. Vis. Comput. Graph. 2014, 20, 1214–1226. [Google Scholar] [CrossRef] [PubMed]
  30. Borel, C.C.; Gerstl, S.A.; Powers, B.J. The radiosity method in optical remote sensing of structured 3-D surfaces. Remote Sens. Environ. 1991, 36, 13–44. [Google Scholar] [CrossRef]
  31. Soler, C.; Sillion, F.X.; Blaise, F.; Dereffye, P. An efficient instantiation algorithm for simulating radiant energy transfer in plant models. ACM Trans. Graph. (TOG) 2003, 22, 204–233. [Google Scholar] [CrossRef] [Green Version]
  32. Qin, W.; Gerstl, S.A. 3-D scene modeling of semidesert vegetation cover and its radiation regime. Remote Sens. Environ. 2000, 74, 145–162. [Google Scholar] [CrossRef]
  33. Pradal, C.; Dufour-Kowalski, S.; Boudon, F.; Fournier, C.; Godin, C. Openalea: A visual programming and component-based software platform for plant modelling. Funct. Plant Biol. 2008, 35, 751–760. [Google Scholar] [CrossRef]
  34. Myneni, R.B.; Ross, J.; Asrar, G. A review on the theory of photon transport in leaf canopies. Agric. For. Meteorol. 1989, 45, 1–153. [Google Scholar] [CrossRef]
  35. Zou, J.; Lin, Y.; Chen, C.; Tang, L. Modelling the 3D distribution of photosynthetically active radiation of direct solar radiation based on virtual plant canopy. J. Fuzhou Univ. 2011, 39, 838–844. [Google Scholar]
  36. Tang, L.; Hou, C.; Huang, H.; Chen, C.; Zou, J.; Lin, D. Light interception efficiency analysis based on three-dimensional peach canopy models. Ecol. Inform. 2015, 30, 60–67. [Google Scholar] [CrossRef]
  37. Wang, X.; Guo, Y.; Li, B.; Ma, Y. Modelling the three dimensional distribution of direct solar radiation in maize canopy. Acta Ecol. Sin. 2005, 25, 7–12. [Google Scholar]
  38. Ma, Y.; Wen, M.; Li, B.; Wang, X.; Guo, Y. Efficient model for computing the distribution of direct solar radiation in maize canopy at organ level. Trans. CSAE 2007, 23, 151–155. [Google Scholar]
  39. Tang, L.; Chen, C.; Zou, J.; Lin, Y.; Lin, D.; Li, J. Ontoplant: An integrated virtual plant software package for different scale applications. In Proceedings of the 2011 IEEE International Conference on Spatial Data Mining and Geographical Knowledge Services (ICSDM), Fuzhou, China, 29 June–1 July 2011; pp. 308–314. [Google Scholar]
  40. Ashdown, I. Radiosity: A Programmer’s Perspective; John Wiley & Sons, Inc.: New York, NY, USA, 1994. [Google Scholar]
  41. Wang, B. Calculation of astronomical parameters in solar energy. Sol. Energy 1999, 20, 8–10. [Google Scholar]
  42. Liu, B.Y.; Jordan, R.C. The interrelationship and characteristic distribution of direct, diffuse and total solar radiation. Sol. energy 1960, 4, 1–19. [Google Scholar] [CrossRef]
  43. Cohen, M.F.; Greenberg, D.P. The Hemi-Cube: A Radiosity Solution for Complex Environments. In SIGGRAPH ’85 Proceedings of the 12th Annual Conference on Computer Graphics and Interactive Techniques; ACM: New York, NY, USA, 1985; pp. 31–40. [Google Scholar]
  44. Cohen, M.F.; Chen, S.E.; Wallace, J.R.; Greenberg, D.P. A Progressive Refinement Approach to Fast Radiosity Image Generation; ACM SIGGRAPH Computer Graphics; ACM: New York, NY, USA, 1988; pp. 75–84. [Google Scholar]
  45. Dulk, J.A.D. The Interpretation of Remote Sensing, a Feasibility Study. Ph.D. Thesis, Wageningen University & Research, Wageningen, The Netherlands, April 1989. [Google Scholar]
  46. Gao, Z.; Feng, S.; Zhang, X.C.; Cheng, J.J. The simulation of leaf net photosynthtic rates in different radiation in apple canopy. Acta Ecol. Sin. 2012, 32, 1037–1044. [Google Scholar]
Figure 1. Screenshot of the Muluo loquat leaf model. (A) A leaf blade wireframe model; (B) A leaf blade solid model; (C) A cluster leaf wireframe model; (D) A cluster leaf solid model.
Ijgi 06 00405 g001
Figure 2. The 3D Muluo loquat model produced by ParaTree. (A)Wireframe (B) solid and (C) image of a real loquat tree by camera.
Ijgi 06 00405 g002
Figure 3. A schematic of the processing pipeline for a light distribution simulation in a canopy.
Ijgi 06 00405 g003
Figure 4. Schematic diagram for defining the reference projection plane of direct solar light. The eight cyan points on the plane indicate the projection of the octree bounding box onto the plane, and they define the size of the plane.
Ijgi 06 00405 g004
Figure 5. Schematic representation of the diffuse sky light source with a discretized hemisphere over the canopy that consists of a number of triangular facets. The light source consists of rays traveling from the light plane to the canopy.
Ijgi 06 00405 g005
Figure 6. Schematic representation of light distribution variations within a canopy based on the number of light sources and iteration steps. The black triangles represent elements that have not received a photon flux, whereas the bright yellow triangles represent those receiving a photon flux. The brightness corresponds to the irradiation intensity. (A) Ten light facets; (B) fifty light facets; (C) one hundred light facets; and (D) two hundred light facets.
Ijgi 06 00405 g006
Figure 7. Direct solar PAR distribution within the virtual loquat canopy at 12:00 on 21 June 2016. The brightness corresponds to the irradiation intensity. (A) Overhead view and (B) profile view.
Ijgi 06 00405 g007
Figure 8. A screenshot of the diffuse PAR distribution within the virtual loquat canopy at 12:00 on 21 June 2016. The brightness corresponds to the irradiation intensity.
Ijgi 06 00405 g008
Figure 9. (A) Daily variation in the average hourly direct solar PAR intensity captured from the loquat, as simulated using radiosity and ray tracing; (B) The daily variation in the average hourly diffuse PAR intensity captured from loquat, as simulated using the radiosity and the TURTLE algorithm.
Ijgi 06 00405 g009
Figure 10. The STAR value distribution within the virtual loquat canopy on 21 June 2016. Warmer colors denote a higher STAR value, whereas cooler colors denote lower STAR values. (A) 10:00 and (B) 12:00.
Ijgi 06 00405 g010
Figure 11. Daily variation in STAR for the loquat model at the whole canopy level.
Ijgi 06 00405 g011
Figure 12. The distribution of the low-efficacy light area in the virtual loquat canopy on 21 June 2016. The yellow round symbols illustrate the light source, and the yellow lines illustrate the direction of the light. The figure in the diagram illustrates the elevation angle. The area with red leaves denotes the low-efficacy light area, whereas the area with green leaves denotes the active light area. (A) 8:00 (B) 10:00 (C) 12:00 and (D) 16:00.
Ijgi 06 00405 g012
Figure 13. The proportion of the low-efficacy light area to the whole canopy.
Ijgi 06 00405 g013
Table 1. The major structural parameters of a Muluo loquat.
Shoot ClassLength (m)Thickness (m)Number of ShootsAngle (°)
Central shoot0.85–1.060.11–0.124–630–45
Lateral shoot0.51–0.900.092–330–60
Table 2. Comparison of direct solar PAR parameters that were simulated hourly based on radiosity and ray tracing within the loquat canopy.
TimeIntensity of PAR (μmol·m−2·s−1)PAR Captured Per Second by the Whole Canopy (μmol·s−1)
RadiosityRay TracingRadiosityRay Tracing
06:0022.0420.89370.31350.96
07:0095.1483.361598.601400.67
08:00178.46161.542998.722714.37
09:00272.48250.764578.524213.66
10:00345.49325.045805.435461.77
11:00401.50379.036746.556369.01
12:00425.74401.047153.886738.92
13:00403.34382.076777.486420.11
14:00350.84333.225895.215599.30
15:00278.55261.224680.574389.39
16:00192.25178.343230.462996.72
17:00114.0196.911915.801628.49
18:0031.4329.32528.20492.59
mean239.33223.294021.523752.00
Table 3. Comparison of diffuse sky PAR parameters simulated hourly based on radiosity and the TURTLE algorithm within the loquat canopy.
TimeIntensity of PAR (μmol·m−2·s−1)PAR Captured Per Second by the Whole Canopy (μmol·s−1)
RadiosityTURTLERadiosityTURTLE
06:0031.764423.4353533.749393.793
07:0045.444633.5285763.624563.393
08:0045.422833.5123763.257563.122
09:0040.946930.2100688.048507.632
10:0035.908726.4929603.389445.172
11:0032.196523.7542541.011399.152
12:0030.732222.6737516.405380.996
13:0031.819923.4763534.682394.483
14:0035.242426.0013592.192436.912
15:0040.169829.6367674.988497.998
16:0044.906133.1312754.574556.717
17:0045.988633.9298772.765570.137
18:0035.322226.0603593.533437.902
mean38.143528.1417640.940472.878

