Real-Time Location-Based Rendering of Urban Underground Pipelines
by
 ,
,
Wei Li
1,2, 
Yong Han
1,2,*,
Yu Liu
1,2,
Chenrong Zhu
1,2,
Yibin Ren
1,2,
Yanjie Wang
1,2 and
Ge Chen
1,2 1
College of Information Science and Engineering, Ocean University of China, Qingdao 266100, China
2
Laboratory for Regional Oceanography and Numerical Modeling, Qingdao National Laboratory for Marine Science and Technology, Qingdao 266237, China
*
Author to whom correspondence should be addressed.
ISPRS Int. J. Geo-Inf. 2018, 7(1), 32; https://0-doi-org.brum.beds.ac.uk/10.3390/ijgi7010032
Submission received: 29 October 2017
/
Revised: 10 January 2018
/
Accepted: 18 January 2018
/
Published: 21 January 2018
(This article belongs to the Special Issue State-of-the-Art Virtual/Augmented Reality and 3D Modeling Techniques for Virtual Urban Geographic Experiments)
Abstract
:The concealment and complex spatial relationships of urban underground pipelines present challenges in managing them. Recently, augmented reality (AR) has been a hot topic around the world, because it can enhance our perception of reality by overlaying information about the environment and its objects onto the real world. Using AR, underground pipelines can be displayed accurately, intuitively, and in real time. We analyzed the characteristics of AR and their application in underground pipeline management. We mainly focused on the AR pipeline rendering procedure based on the BeiDou Navigation Satellite System (BDS) and simultaneous localization and mapping (SLAM) technology. First, in aiming to improve the spatial accuracy of pipeline rendering, we used differential corrections received from the Ground-Based Augmentation System to compute the precise coordinates of users in real time, which helped us accurately retrieve and draw pipelines near the users, and by scene recognition the accuracy can be further improved. Second, in terms of pipeline rendering, we used Visual-Inertial Odometry (VIO) to track the rendered objects and made some improvements to visual effects, which can provide steady dynamic tracking of pipelines even in relatively markerless environments and outdoors. Finally, we used the occlusion method based on real-time 3D reconstruction to realistically express the immersion effect of underground pipelines. We compared our methods to the existing methods and concluded that the method proposed in this research improves the spatial accuracy of pipeline rendering and the portability of the equipment. Moreover, the updating of our rendering procedure corresponded with the moving of the user’s location, thus we achieved a dynamic rendering of pipelines in the real environment.
1. Introduction
1.1. Background
Urban underground pipelines are known as “urban blood vessels”, consisting of a series of pipelines for water supply, drainage, gas, heat, electricity, communication, television, and industry [1]. Reasonable planning and effective management of underground pipelines guarantee the normal operation of urban functions. Fortunately, the rapid development of Geographic Information System (GIS) technologies, such as network analysis, topology validation, and spatial mapping, provides reliable support for intelligent pipeline management, analysis, and planning [2]. However, with the acceleration of urban construction, an increasing number of pipelines buried underground are forming a concealed and complex spatial network system, which brings new challenges to traditional pipeline management.
As an extension of GIS functions, Virtual Geographic Environments (VGEs) can present representations and visualizations of augmented reality (AR) that are interactive, immersive, and close to nature [3]. Recently, VGE has been applied to various fields, such as simulating and analyzing air pollution [4], collecting real-time dynamic traffic information [5], and measuring noise levels [6]. To perceive and understand the huge body of pipeline data, using a form of VGE to represent it will generate a feeling of actually being there. As one of four subtypes of VGE, expressing the environment gives the opportunity to observe the virtual environment with tools such as helmets and gloves [7]. Simulations made by personal computer based VGEs are unable to provide timely and intuitive references for decision-making. Therefore, it is crucial to develop new methods with new technologies to improve the efficiency of managing underground pipelines.
Through computing a device’s real-time position and posture, AR can update the corresponding image model with the device’s perspective, aiming to combine the virtual world with the real world [8,9,10]. The rise of smartphones has provided favorable conditions for the development of mobile-based VGE, especially in mobile AR. On the one hand, mobile devices such as smartphones, HoloLenses, etc., are more convenient to carry, which makes them suitable as moving carriers of mobile AR systems. On the other hand, the popularity of high-quality mobile devices is growing rapidly, with many sensors such as gyroscopes and accelerometers integrated with stable cameras and powerful central processing units, providing a wealth of hardware to support developing AR software. When it comes to pipeline management, mobile AR is able to display on-site pipeline information vividly, intuitively, and in real time. This provides a new way for us to meet the current challenges in pipeline management.
1.2. Related Work
Some research in recent years has proposed methods of providing “X-ray vision” to see where underground infrastructure lies. For the first time, Roberts et al. [11] combined Real-Time Kinematic (RTK) Global Positioning System (GPS) and an internal navigation system (INS) to allow robust and precise real-time positioning and orientation in an unprepared environment. This data was then used in the AR system to superimpose buried pipes and cables onto the real-world view of a head-mounted display. Schall et al. [12] designed a 3D scene-graph rendering on the client side, referred to as Geography Markup Language (GML), exported from the GIS server. Additionally, they integrated GPS, an inertial measurement unit, and an ultramobile PC into a handheld device to achieve relatively accurate real-time tracking and added some functions such as excavation, labeling, and filtering. They also explained the transcoding process from a GML encoding consisting of context and geometric properties to scene-graph (Open Inventor) visualization data [13]. Chang et al. [14] designed a system that can also work indoors, based on ARToolKit, where pipelines can be displayed on a laptop. They combined GPS and INS to obtain the outdoor position and orientation. Taking into account the accuracy and refresh rate of the GPS, it is more appropriate to adopt markerless tracking based on a visualization with higher outdoor accuracy.
In recent years, with the development of AR, a series of products such as ARToolKit [15] and Vuforia [16] have been derived. The current main solution of AR is based on the marker: users need to paste a certain marker in the AR scene beforehand and obtain the transformation parameters between the marker coordinates and the camera coordinates [17,18]. Even if the position and posture of a mobile phone changes, the phone can maintain stable tracking, keeping the virtual object in the same position in the real world. On the other hand, the software development kit (SDK) [19] provides ordinary programmers with more freedom and flexibility to use their own inspiration to design excellent AR applications, even if they do not understand the algorithm implementation, such as AR red packet, etc. However, most of these SDKs must be based on simple image identification techniques, which cannot apply to complex scenarios.
The inevitable direction of future development is simultaneous localization and mapping (SLAM) [20] technology, which can build a model simulating the real environment through the background process based on panoramic 3D reconstruction. The model is then rendered to a display device after scene-graph fusion of the virtual world and the real world so as to achieve an interaction of the two worlds. Localization and mapping are the key functions of SLAM, which can be divided into two separate threads [21,22,23]. Motion tracking based on MonoSLAM [24] has problems such as extensive calculation, long work time, existing scale ambiguity [21], and difficulty detecting feature points when the device is moving fast. The integration of inertial measurement unit IMU [25] to get six degrees of freedom (6DOF) [26] of the device plays a complementary role in improving its refresh rate and accuracy. For example, Google Tango [27] and the updated ARKit in iOS 11, released in June 2017, utilize the Visual-Inertial Odometry (VIO) [28] method, which combines vision and inertia to gain 6DOF of the mobile device. The difference is that Google Tango achieves 3D reconstruction with hardware, such as a depth camera and a fisheye camera, while optimization based on the ARKit’s algorithms allows most iOS devices to have AR capabilities. Without depth perception, ARKit currently can only detect planes, which means it cannot achieve reconstruction of the environment, like Tango, or complete a complex environment interaction.
1.3. Problems
Aiming to improve the efficiency of managing underground pipelines, based on an analysis of the existing AR underground pipeline systems, we must solve three key problems. The first is how to retrieve and load pipelines near the user accurately and conveniently. Location accuracy determines the effect of pipelines’ real-time loading, and the mobile device draws pipelines within its perspective referring to the user’s location, but it is worth finding a way that does not cause fatigue. The second problem is how to keep track of the model stably and precisely. Some methods are solely based on image registration in computer visualization or GPS positioning. If light changes result in a lack of feature points or a multipath effect occurs, it will not allow development of outdoor underground pipeline systems based on AR. The last problem is how to improve the immersive experience of underground pipelines in real time. Currently, due to the limitations of AR technology, the confusing relation of occlusion gives users the illusion of pipelines floating on the ground.
1.4. Our Idea
As stated before, the application of AR to show underground pipelines can fully reveal its real-time and vivid characteristics. We can get people’s precise real-time locations based on the BeiDou Navigation Satellite System (BDS) [29], which can provide a relatively high-precision positioning service to mobile devices without having to carry large equipment. According to the user’s location, we can transmit pipeline data by the network; the mobile device then renders the pipelines after data conversion. Scene identification based on visualizations can further improve the accuracy of the pipeline position. At the same time, we can make some improvements to pipeline rendering. Feasible methods such as VIO can ensure robustness outdoors and improve the performance in a markerless environment. In addition, we can design some details to make the pipelines vivid, such as the shape of the buried pit, the occlusion of walls, and the texture of the round and smooth junction between the pipeline and the wall. Based on the above analysis, we propose an original method to load the data and render nearby underground pipelines in real time.
To sum up, there are three novel contributions of this research: (1) we designed a method to load pipeline data based on highly precise positioning service and scene recognition, and transformed the plane coordinates and elevation into the data of Unity3D; (2) we adopted the VIO to track camera motion to make pipelines look stable; moreover, we studied the theory of world coordinates in Area Description File (ADF) and VIO, then designed a method to reduce drift; and (3) we applied occlusion building based on the real-time 3D reconstruction to the pipeline rendering and designed a method to extract the mesh of the ground that hides the pipelines, and we designed details of the pipeline.
2. System Design
2.1. Hardware Composition
Our system adopts Google Tango Phab 2, which has a 16 million pixel camera and integrates the fisheye camera to capture its own motion information. The fisheye camera ensures an angle of view wide enough to catch more environmental features, which makes model tracking more stable. The device is also equipped with a depth camera, which can launch and receive infrared structure light. By working with the sensor algorithm, the mobile device can obtain the object’s distance and size. It can also support 3D reconstruction of the surrounding environment [30,31]. Instead of RTK, the handheld differential device is connected to the mobile phone via Bluetooth to calculate the differential corrections received by the phone, which is the same size as a cellphone and can be easily held with one hand.
2.2. Data Design
As shown in Table 1, the raw measured data exported from the GIS server to the client according to the position information mainly includes spatial and attribute data. The spatial data is used to transform the position, angle, scale, and texture of the game object in Unity3D, and the attribute data is used for data retrieval. We transformed the geographic coordinates into world coordinates through seven-parameter coordinate transformation [32]. The field of the material corresponds to the identification of the cached texture map in the system. Finally, we drew pipelines to the mobile device according to the information.
2.3. General Framework
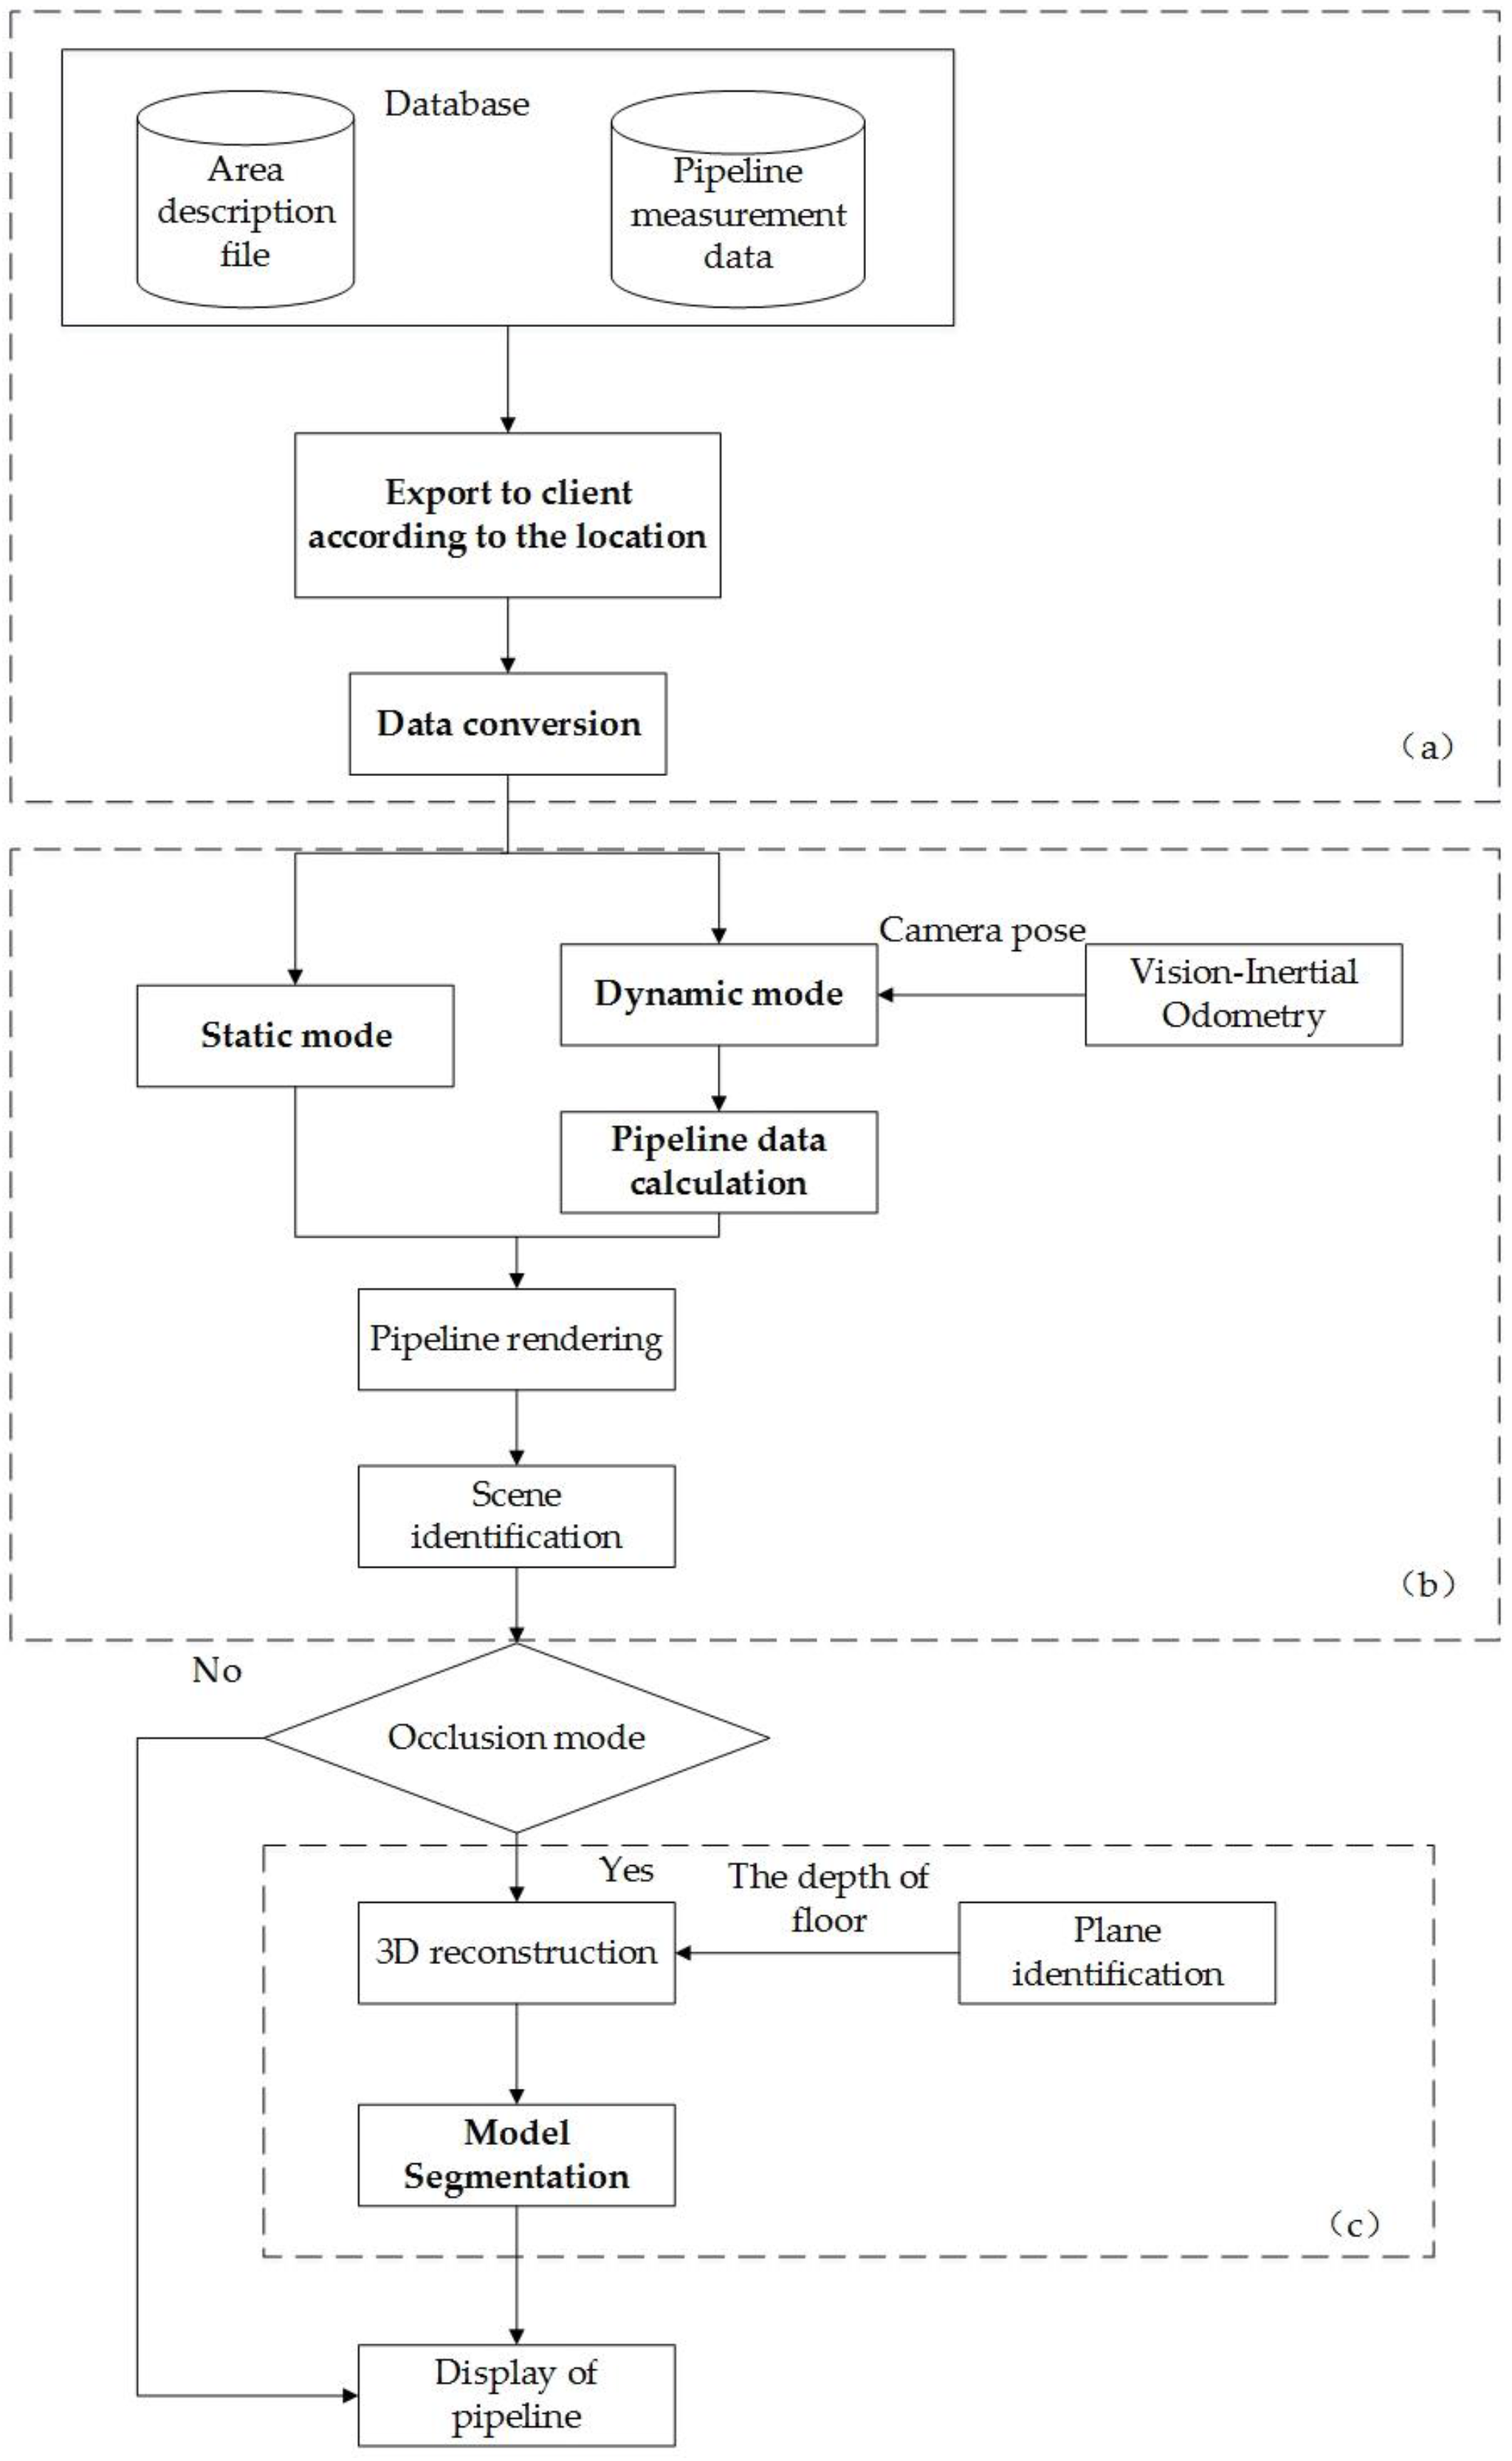
As shown in Figure 1, the real-time detection system of underground pipelines draws nearby underground pipelines based on the user’s location. The specific steps are as follows:
- The mobile device sends the final coordinates calculated from the differential corrections to our data server. According to the user’s location, the server transmits the pipeline data around the people and the corresponding ADF [27] to the mobile phone.
- The mobile phone transforms the latitude and longitude coordinates into the world coordinate data of Unity3D and draws the pipelines. Then it loads the ADF. After identifying the scene, it adjusts the pipeline position.
- In static mode, the mobile device achieves tracking of the model by calculating its own position using the VIO algorithm. In dynamic mode, we complete the dynamic rendering by the camera orientation and position output by the VIO.
- According to the 6DOF of the device, the phone registers the point clouds obtained by the RGB-D sensor to complete the 3D reconstruction of the environment, and the mesh of the ground in the real world is split.
- The system attaches the 3D reconstruction rendered by the transparent occlusion texture to the pipeline model.
3. Methods
3.1. Pipeline Data Loading Based on High Accuracy Differential Positioning and Scene Identification Based on Visualization
As mentioned above, the first problem is how to accurately retrieve and load pipelines near the user. We can obtain location data by the BDS and network transmission without complex and large equipment. The user’s location information is used to complete data retrieval. As shown in Figure 2, the framework for pipeline data loading consists of three steps:
1. Obtaining differential corrections
We need to rely on precise BeiDou real-time positioning based on the Ground-Based Augmentation System [33], which uses the theory of real time differential (RTD) [34], which reaches submeter precision. The phone sends the initial longitude and latitude coordinates to the customized location service in Global Positioning System Fix Data (GGA) format and receives the differential corrections in Radio Technical Commission for Marine services (RTCM) [26] format.
2. Providing differential corrections solutions
The smartphone transmits the differential corrections to the handheld differential device and obtains the user’s precise coordinates via Bluetooth. The solution of the precise coordinates using differential corrections is completed by the differential chip.
3. Loading data
The mobile device transmits the precise coordinate parameters to the data server by HTTP protocol. According to the range of the location, the data server provides the corresponding ADF and pipeline data around the user according to the user’s position, in JavaScript Object Notation format. Then the mobile device downloads the data and transforms it into world coordinates and loads the ADF for the area that has enough visual features such as the roadside, the area around a building, etc.
ADF contains mathematical descriptions of visual environmental features and is analogous to spatial memory based on loop closure [35]. We make ADFs in advance with the application offered by Tango. The origin of the ADF’s coordinates is where we first launch the application, and its angles of axes are the same as the camera orientation when the application is launched. After computing the probability of whether the current image comes from the already perceived scene, the smartphone can localize itself by obtaining the ADF’s coordinate parameters and connect the pipelines to a precise location in the real world by aligning the device’s world coordinates with the ADF’s coordinates.
We made an ADF that recorded visual features of an area five meters long and five meters wide. The memory of the ADF was about 10 mb, considering the network transmission. Taking into account the impact of sunlight on recognition, we made several ADFs for the same area under different light conditions, and users can choose the ADF according to their current light conditions. Therefore, by initializing the ADF, we can ignore the error of satellite positioning. On the other hand, satellite positioning narrows the range of ADF retrieval.
3.2. Spatial Conversion of the Pipeline Coordinates
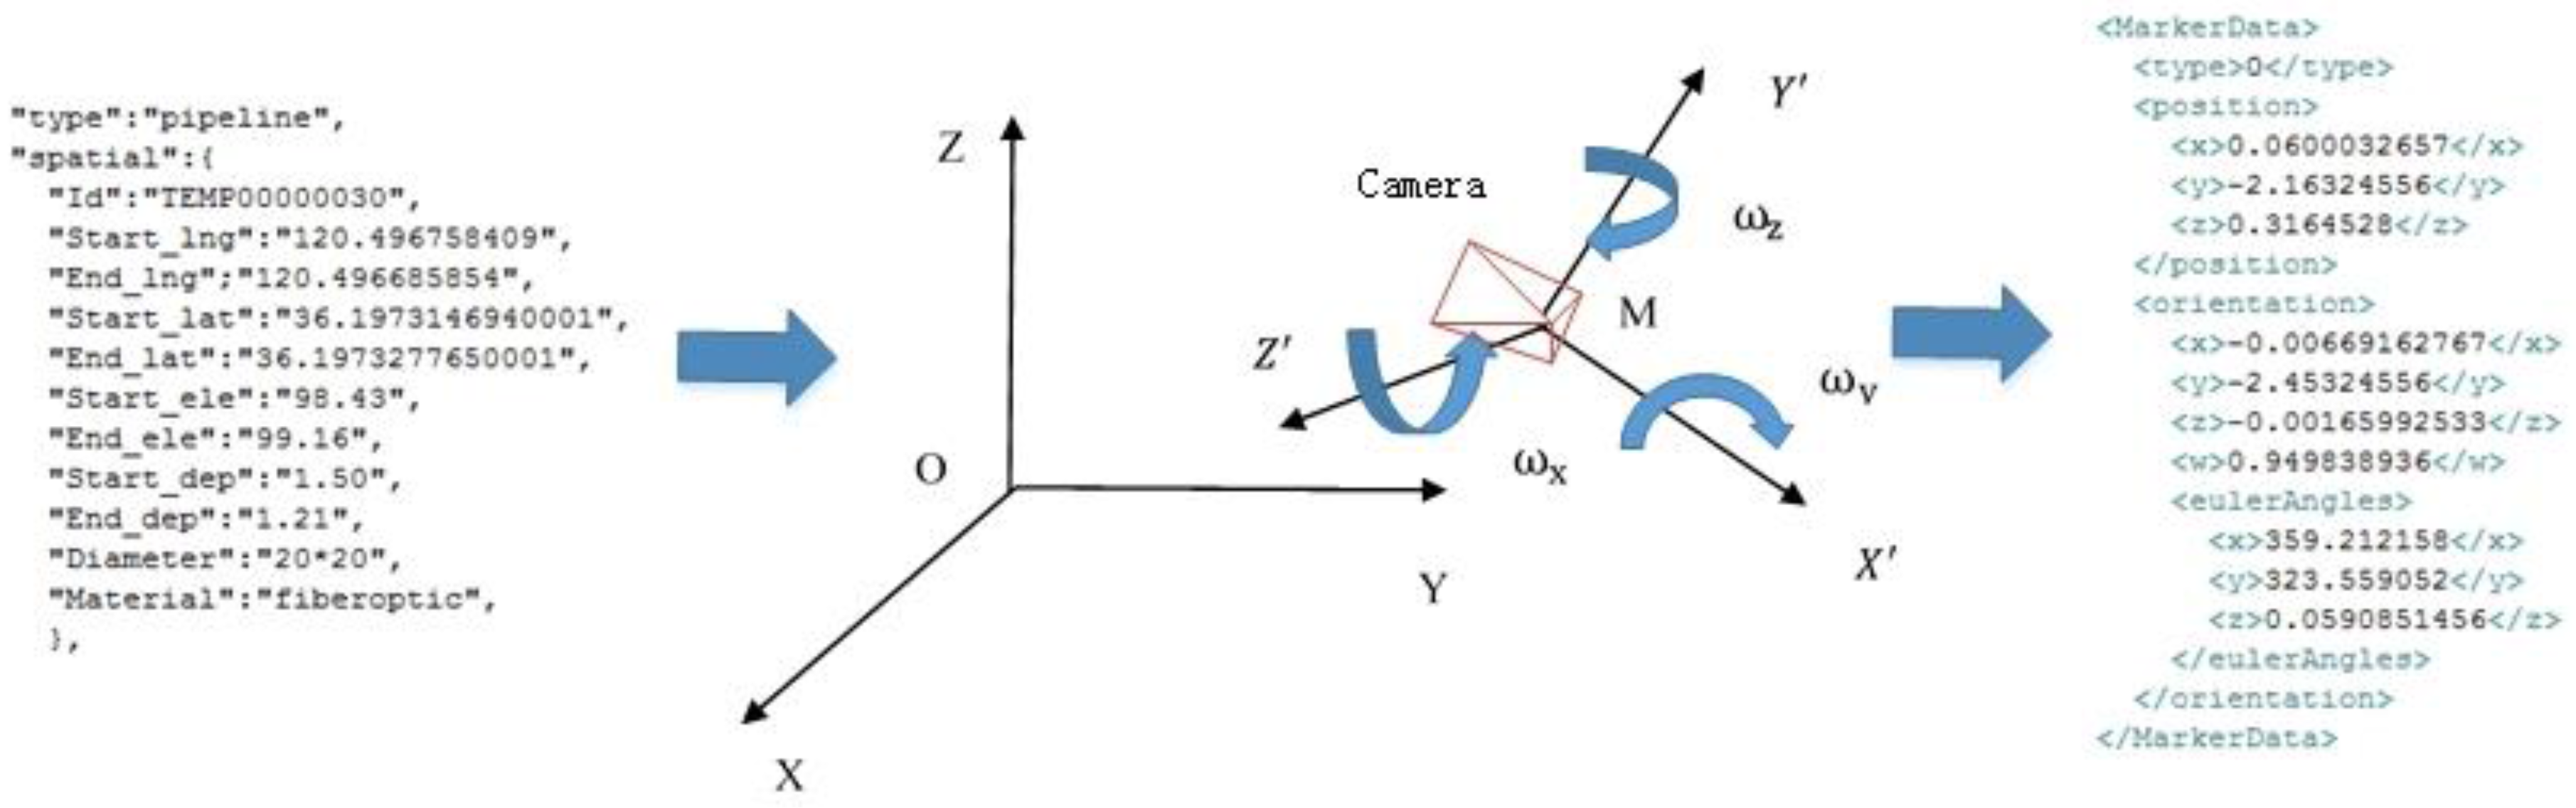
After the data transfer, we need to transform the raw pipeline data with the spatial descriptions of lines received in JavaScript Object Notation format into the rendering data. Designing a method of data management and loading can make it convenient for managers of underground pipelines rather than programmers, making it easy to update pipeline data and change the position of pipelines visually. First we loaded attributes of the pipeline and transformed the latitude and longitude coordinates (B, L, H) into () in the spatial rectangular coordinate system, then transformed () into world coordinate data through seven-parameter coordinate transformation [36].
Figure 3 shows the conversion from the spatial rectangular coordinate system to the world coordinate system. When Tango is initialized, the world coordinate system and the camera coordinate system have the same origin and axes, so the current position and rotation of the camera are (0, 0, 0). We recorded the location M () and the posture parameters (roll, pitch, azimuth) obtained from the direction sensor of the phone, expressed as (). The scale of coordinate transformation from world coordinates to the spatial rectangular coordinate system was m. Assuming that point M was the origin of world coordinates and its coordinate axes were approximately parallel to the coordinate axes of the spatial rectangular coordinate system, the world coordinates can be regarded as local coordinates in the real world. In order to meet the requirements, when we initialize the system for the first time, we should try to keep the vertical direction of the smartphone screen parallel to the north and then transform the pipeline coordinate data in the spatial rectangular coordinate system into world coordinates through seven-parameter coordinate transformation. Equations (1)–(4) show the conversion from () in the spatial rectangular coordinate system to () in world coordinates. After the conversion, we calculated the world coordinates of the pipeline start point () and end point () from the raw data. In the process of Unity3D development, object rendering is determined by the pivot position, rotation, scale, and material of mesh. However, the height anomaly of satellite positioning has an influence on the height of the pipeline coordinates. The user must place the phone horizontally and the depth sensor toward the floor to get the distance between the phone and the floor through point clouds, then the height of the floor and the height of the pipeline can be calculated by the depth under the floor. As shown in Equations (5)–(8), the pivot coordinates (), scale and orientation () of the game object in Unity3D are calculated from the start point coordinates () and end point coordinates () of the pipeline. In this case, the pivot point is equal to the midpoint of the pipeline. The length and diameter determine the three components of the pipeline’s scale in Unity3D.
3.3. Tracking Technology Based on VIO Algorithm
As mentioned above, the second problem is how to keep object tracking stable. Stable object tracking ensures that the virtual model can be updated precisely at any perspective of the mobile device, which results in the visual effect that the virtual model is fixed to a specific position. We adopted the tightly coupled VIO algorithm that combined visualization with inertia to obtain the 6DOF of the mobile device.
In Equation (9), the Sim(3) [37] defines the group of similarity transformations between adjacent frames in three-dimensional space, which consists of three parameters: is a translation, is a rotation, and is a scale between current frame and previous frame.
By extracting the feature points of adjacent frames, which are commonly based on Scale-Invariant Feature Transform (SIFT), Speeded Up Robust Features (SURF), etc., and matching them, we can calculate the 6DOF of the camera. Optimization mainly refers to reducing noise in the SLAM process. The visual odometry (VO) algorithm estimates the motion between the two images. By integrating the acceleration and posture of the device, we can obtain the distance. The previous estimation error accumulates to the motion estimation in the back, which is called drift [38]. The classic VO algorithm has a frame rate of only 10–30 Hz. The feature points are easy to lose when the camera moves fast, and there will be scale ambiguity. The IMU can get the acceleration and posture of the device directly and has a frame rate that reaches 200 Hz, ensuring faster speed and solving the problem of scale ambiguity. IMU overcomes the inherent shortcomings of VO, which makes up for the inherent noise and errors of IMU [39]. Therefore, the VIO has more advantages. Moreover, the fisheye camera ensures that model tracking is stable.
In Figure 4, the camera’s perspective is in a subway station model, which is the same size as reality. Due to the stable tracking of the camera, the position of the virtual model is consistent with reality, and its refresh rate reaches 50 Hz. In order to evaluate the performance for long-distance use, we held the Tango device and walked through a fifty-meter-long corridor, and measured the distance of the corner at the end of the corridor between the screen and the real world; the average distance was about 1.23 m.
We designed a method to reduce drift due to long-distance use of VIO. As described in Section 3.2, when Tango initializes, the world coordinate and camera coordinate systems have the same origin and axes, so the world coordinates initialize. We can reduce drift by regularly clearing the previous estimation of orientation and position.
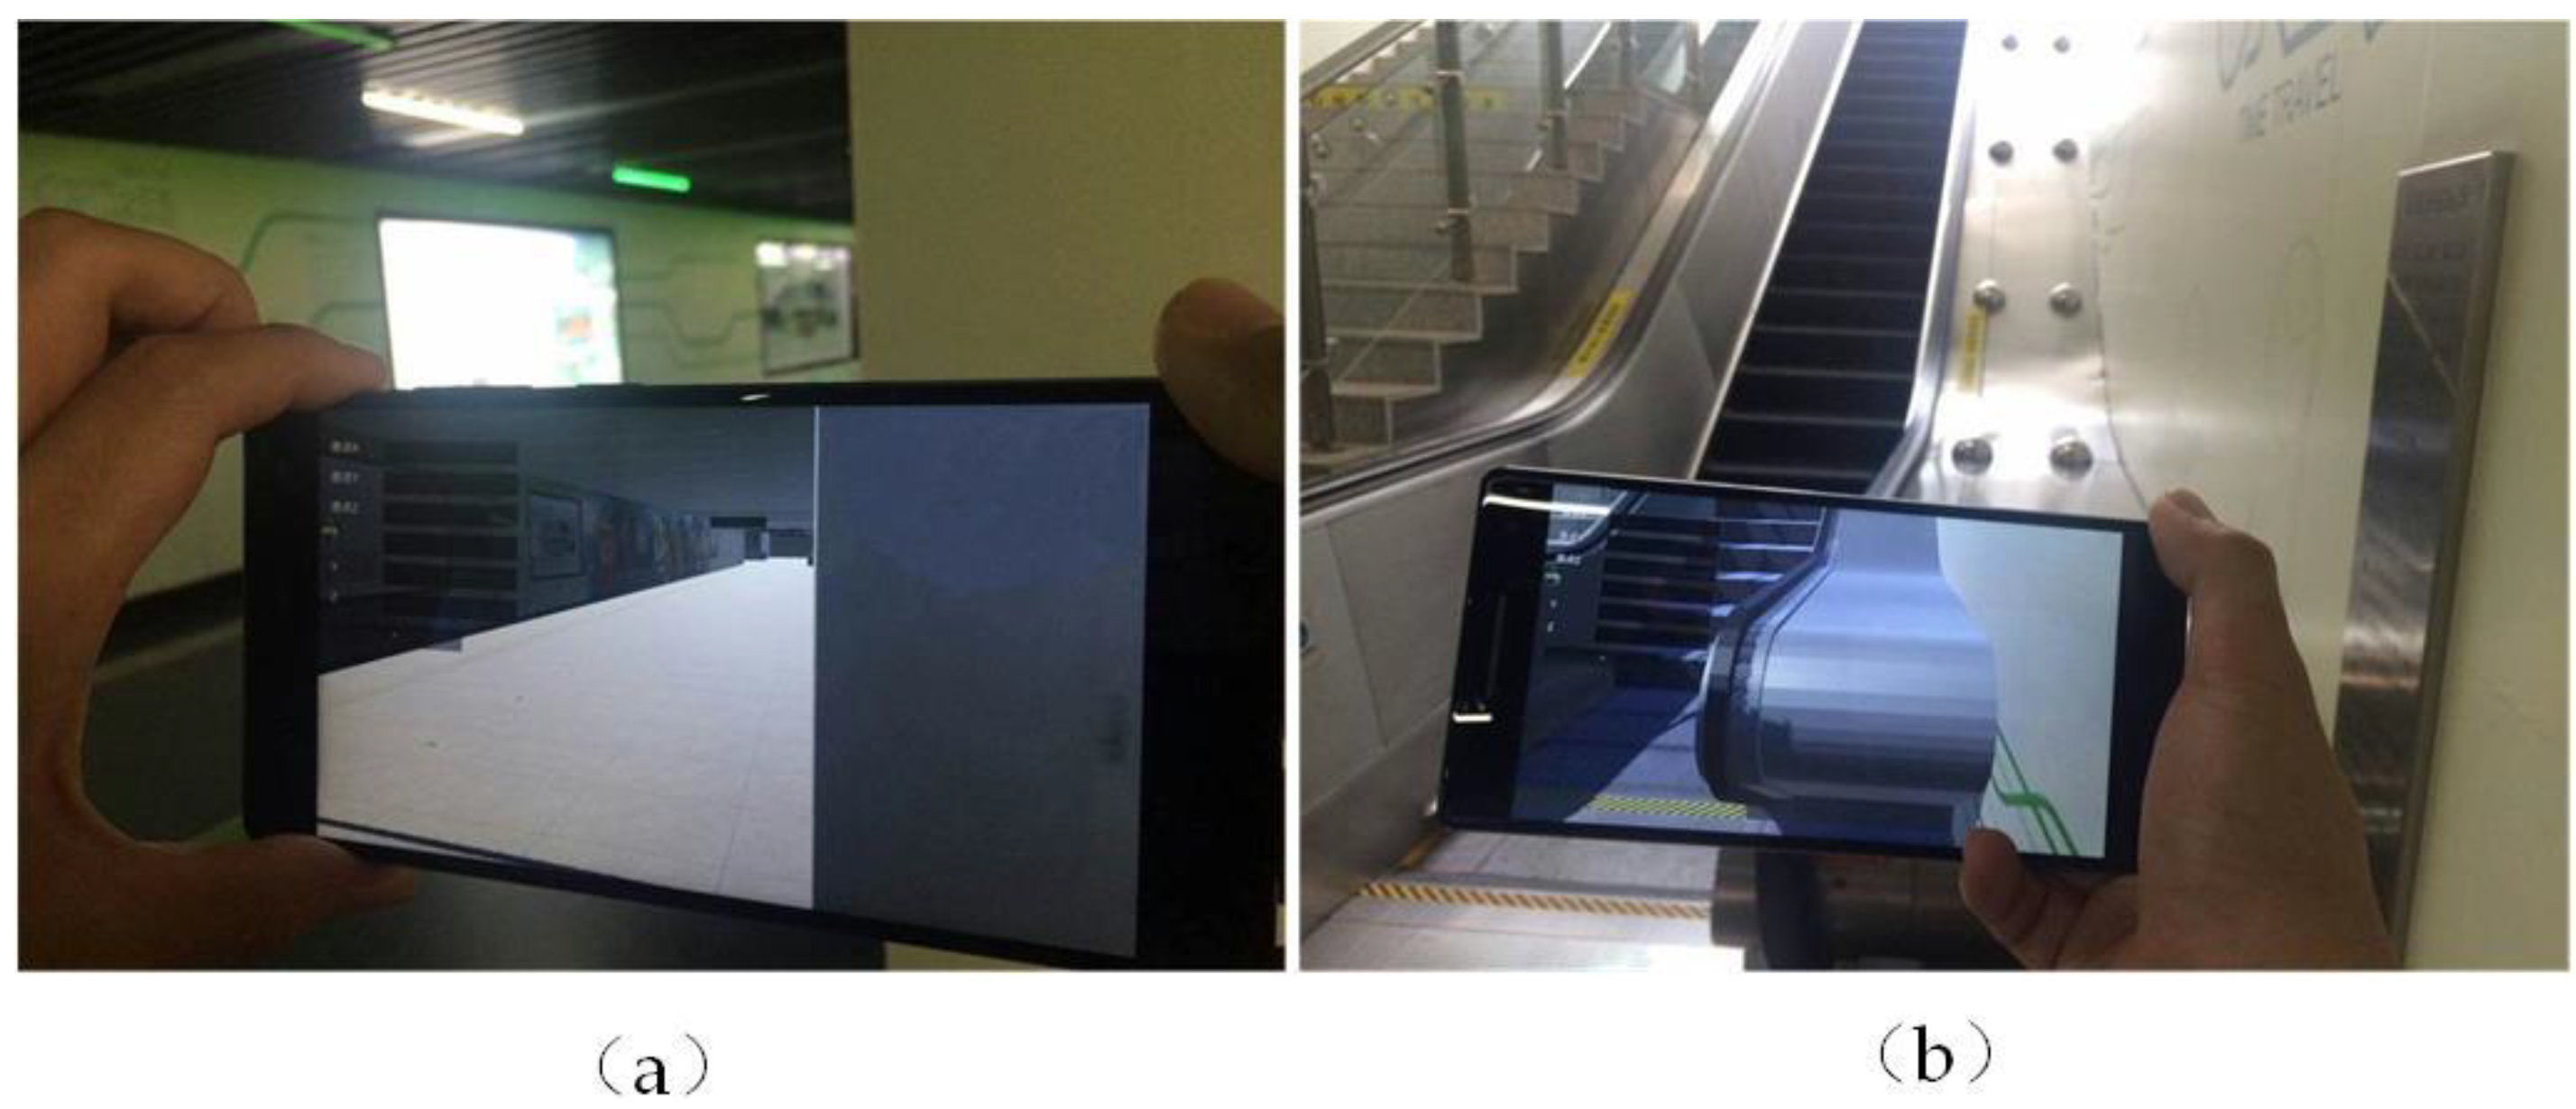
We designed two modes for the rendering of pipeline: static and dynamic mode. Considering that continuous requests for location service can be a burden on the battery, by asking for the service only once, the smartphone can get pipeline data for an area ten meters long and ten meters wide from the server and render the pipelines. Tango initializes and restarts tracking each time the rendering starts, and the world coordinates reinitialize and have a new origin in the real world according to the user’s location instead of using the same origin over a long distance. As shown in Figure 5a, in static mode, the user can watch pipelines in a fixed area from different perspectives. The tracking is accurate enough for people’s observation distance. Figure 5b shows pipelines rendered in dynamic mode; we get the user’s real-time position and orientation in world coordinates through VIO and query the pipeline data near the user in a fixed range from the data we receive. Thus, once the user obtains the data from the server, the following rendering will not be achieved through the network. When the user walks out of the area of pipeline data, the system will remind him or her to ask for service again to initialize the world coordinates. Thus, the pipelines and world coordinates update in correspondence with the moving of the user’s location.
3.4. Pipeline Rendering Based on Occlusion
As mentioned above, the last problem is how to improve the immersive experience of underground pipelines in real time. The ideal situation is that the mobile device builds the model of the environment in real time and judges the occlusion relation by the model’s render queue. Then it makes the reconstruction model transparent and produces the correct and reasonable occlusion effect.
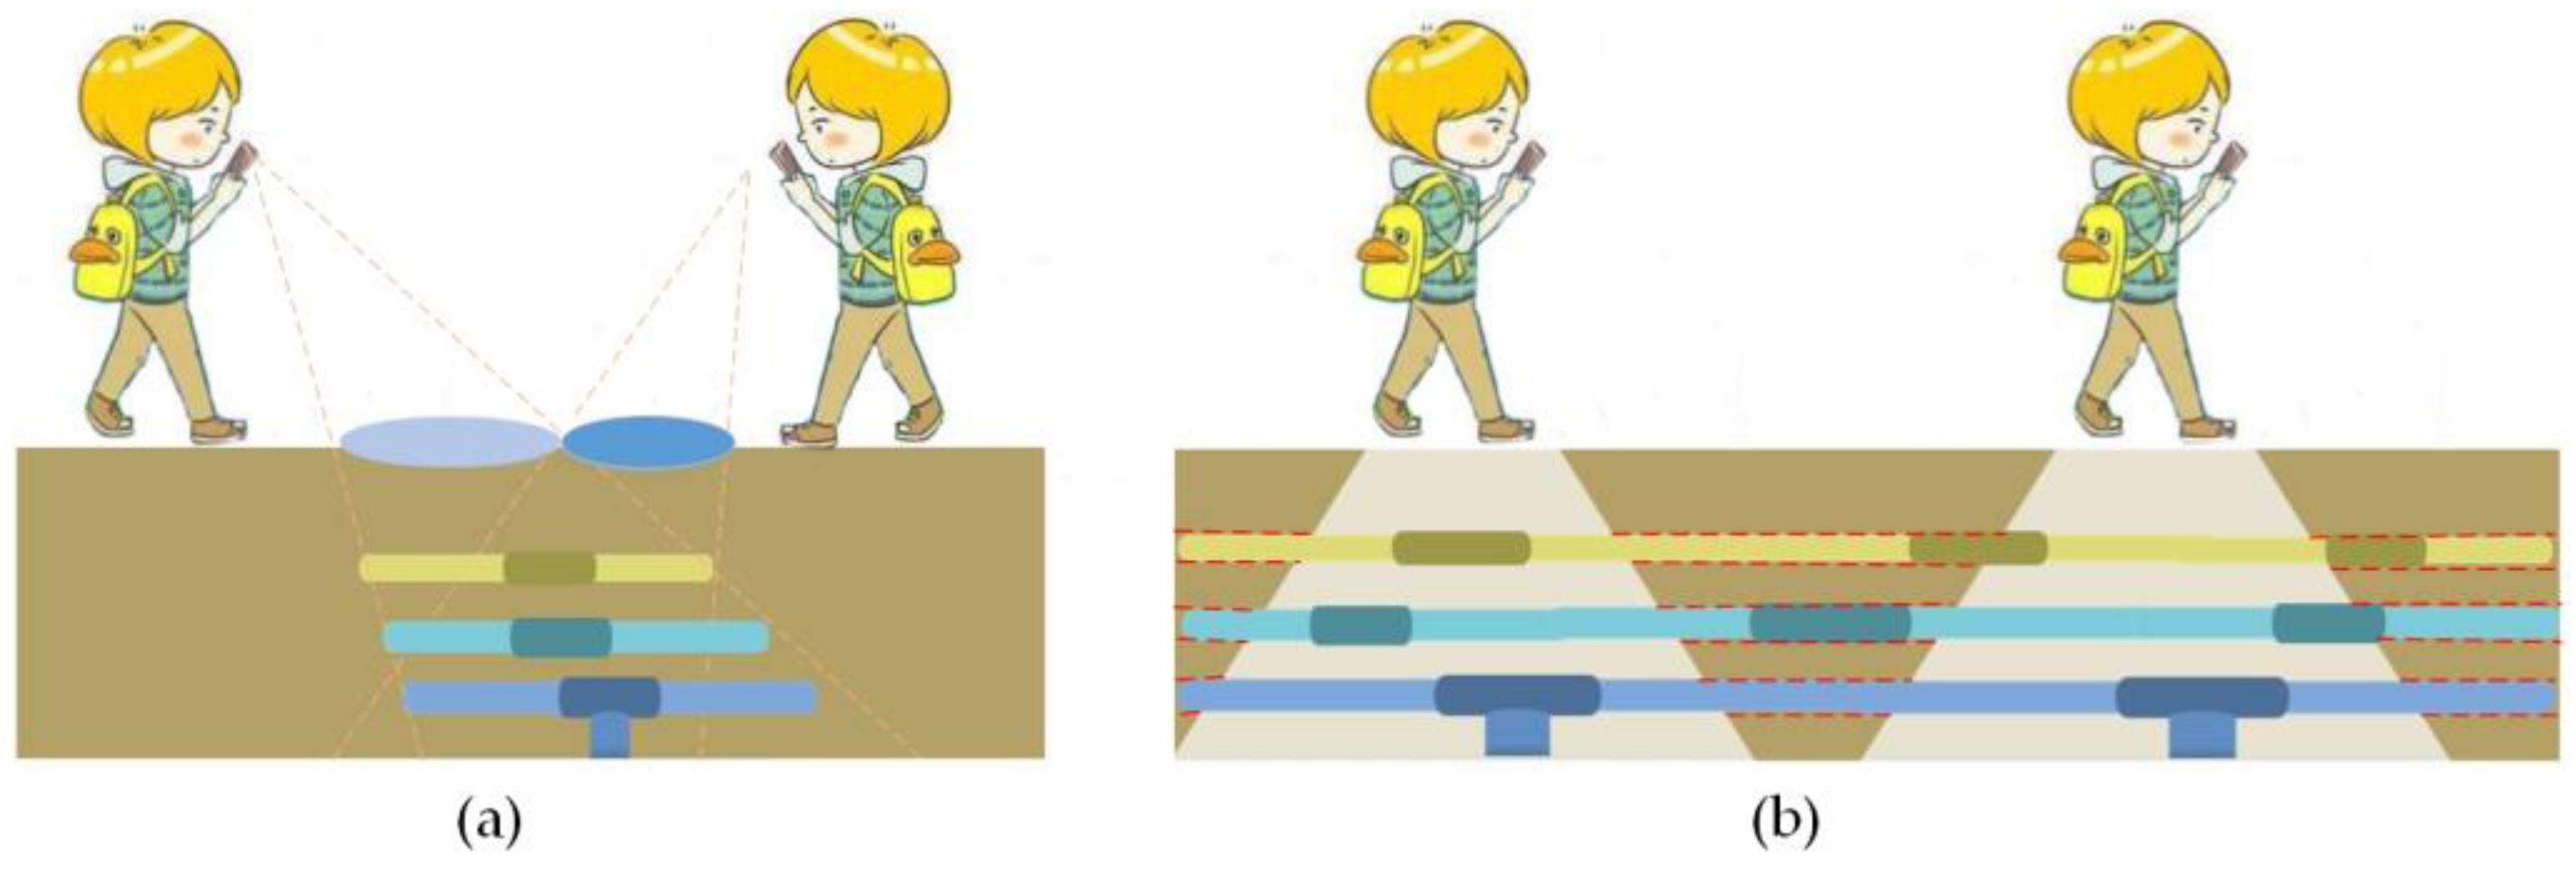
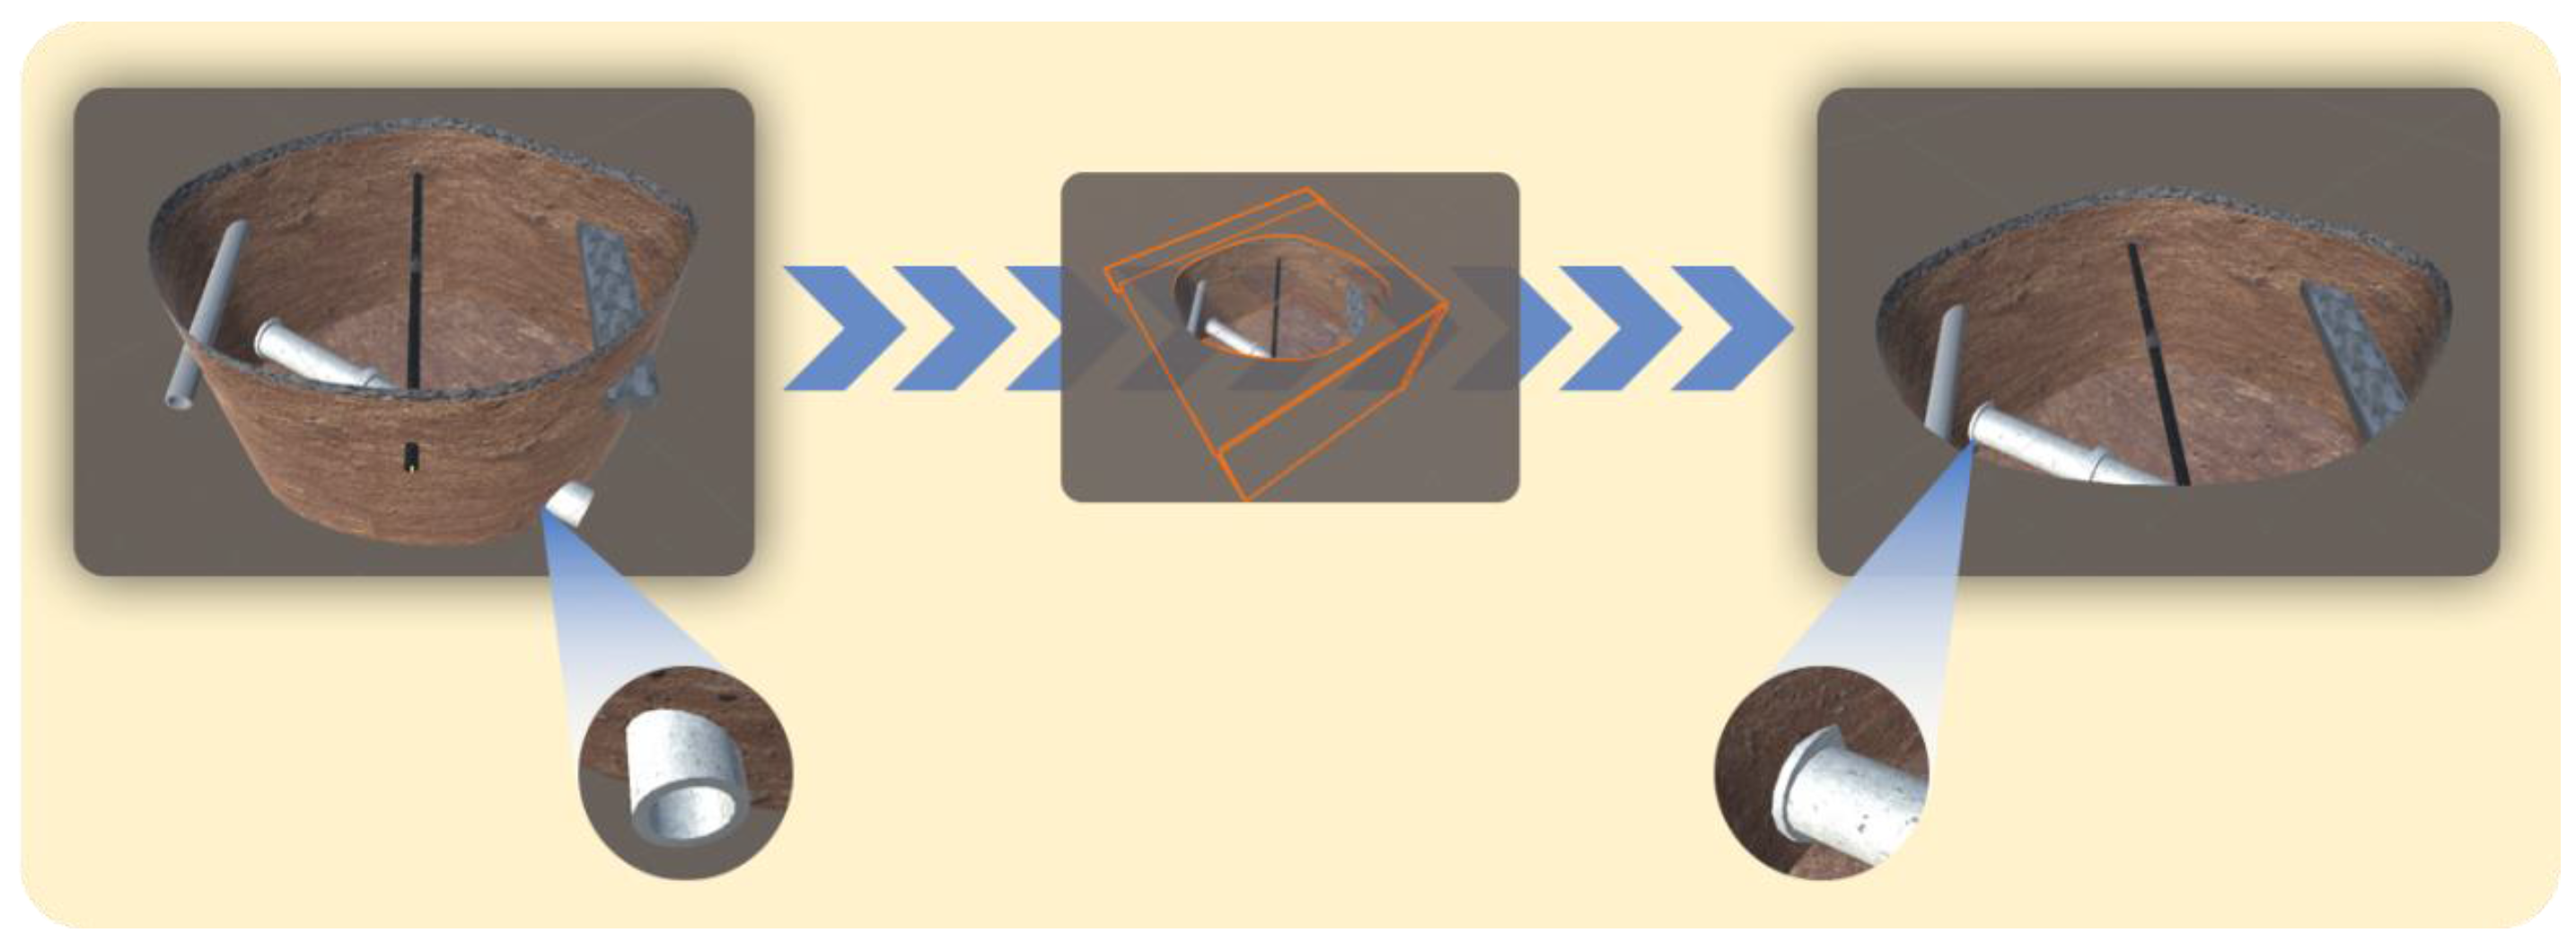
For example, people watch underground pipelines from different perspectives. Parts of the pipelines and walls are hidden by the ground. If all the walls and pipelines are shown, there will be the illusion that the pipelines are floating on the ground. As shown in Figure 6, we designed the shape of the buried pit as an arc instead of a square; the irregular shape made the buried pit look logical and true. In addition, we made the texture the same as the ground at the edge of the wall, which enhanced the layered effect between aboveground and underground. Meanwhile, we used a transparent occlusion covering the surrounding area of the groove to simulate the effect of the ground. Then we hid the part of the inner wall that would be covered by real ground. The occlusion hid the pipelines that stretched out along the wall, which made the junction of the pipeline and the wall seem more natural.
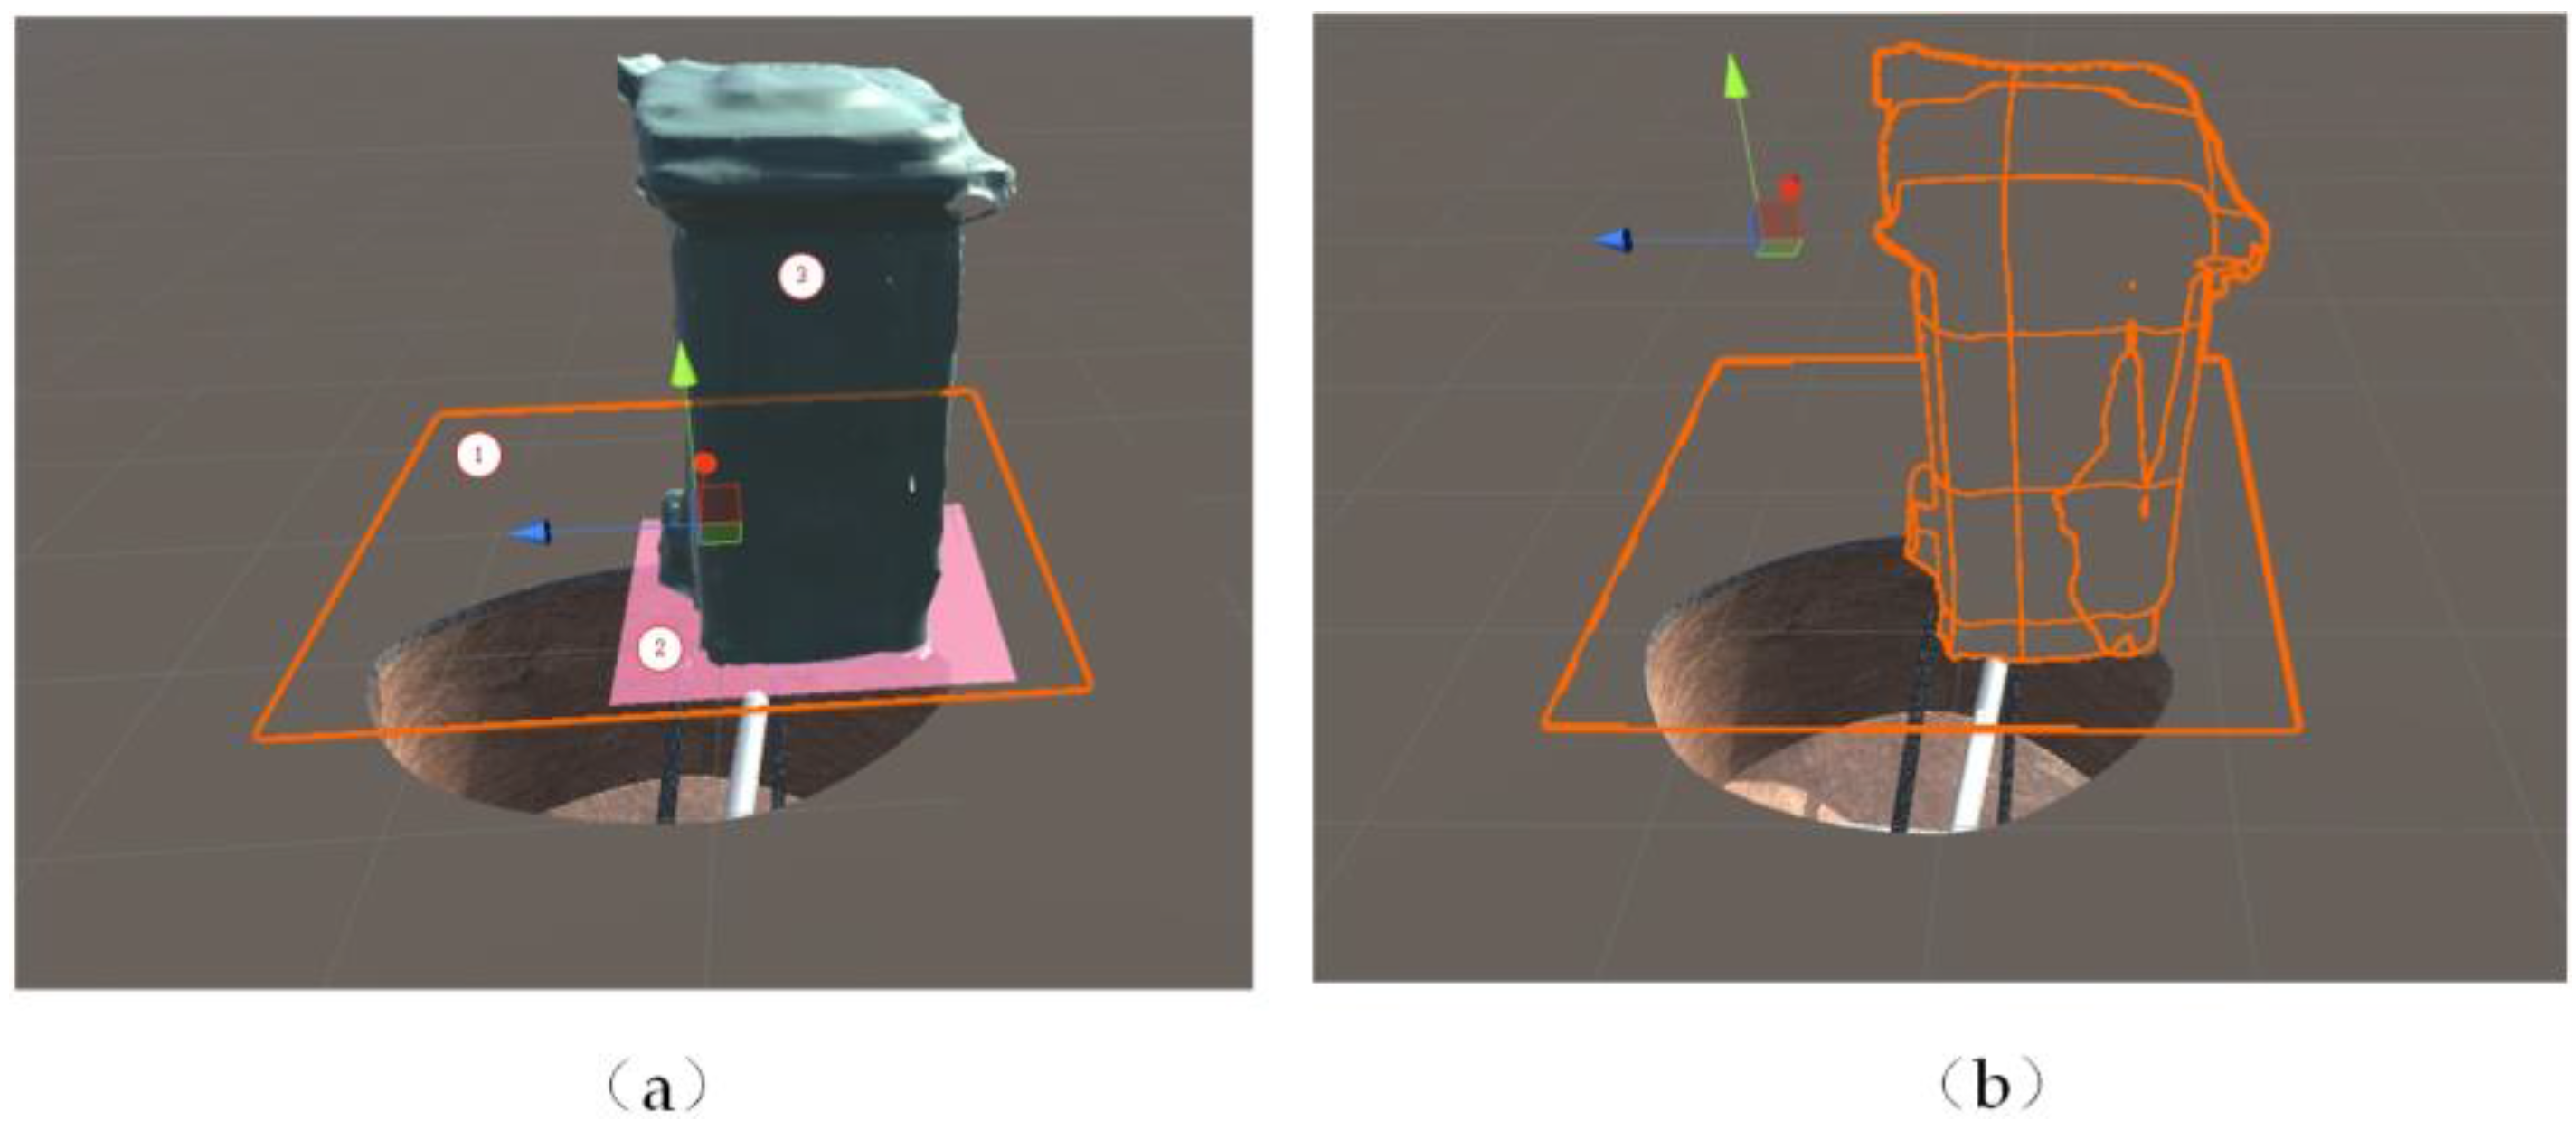
Similarly, if pipelines are rendered on real objects, such as flower beds and dustbins, they will have the illusion that they are floating above the ground. It is more reasonable to make the entities on the real ground hide the pipelines. An RGB-D depth camera that launches and receives infrared structure light provides depth measurements of the surrounding environment [40]. Then the 6DOF output from the VIO is used to complete the registration of point clouds acquired by the camera. Thus, we can obtain models of the entities and place them in the right place. This is not suitable for items with a reflective or black surface. Considering that the 3D reconstruction contains the mesh of the ground that can hide the pipelines, we designed the method to extract the entities from the whole model. As shown in Figure 7, first we had to place the phone horizontally and the depth sensor toward the floor to get the distance between the phone and the floor through point clouds, then ① a virtual transparent plane would be placed on the real floor according to the distance. The ② floor and ③ garbage can in the real world were built as a whole by the 3D reconstruction. ① We raised the plane 0.01 m in order to make it higher than the mesh of ② the floor, highlighted in Figure 7a. As shown in Figure 7b, we applied transparent texture to ①, ②, and ③, then set the rendering queue in the shade to make the plane ① hide the plane ② by the depth, but the pipelines showed. And ③ beyond the plane ① could hide the pipelines by the depth. It would have a better effect to sit on the flat floor. Furthermore, our method does not require precise and detailed textures, so it is less affected by modeling precision and minimizes the workload.
4. Experiments and Discussions
4.1. Spatial Accuracy
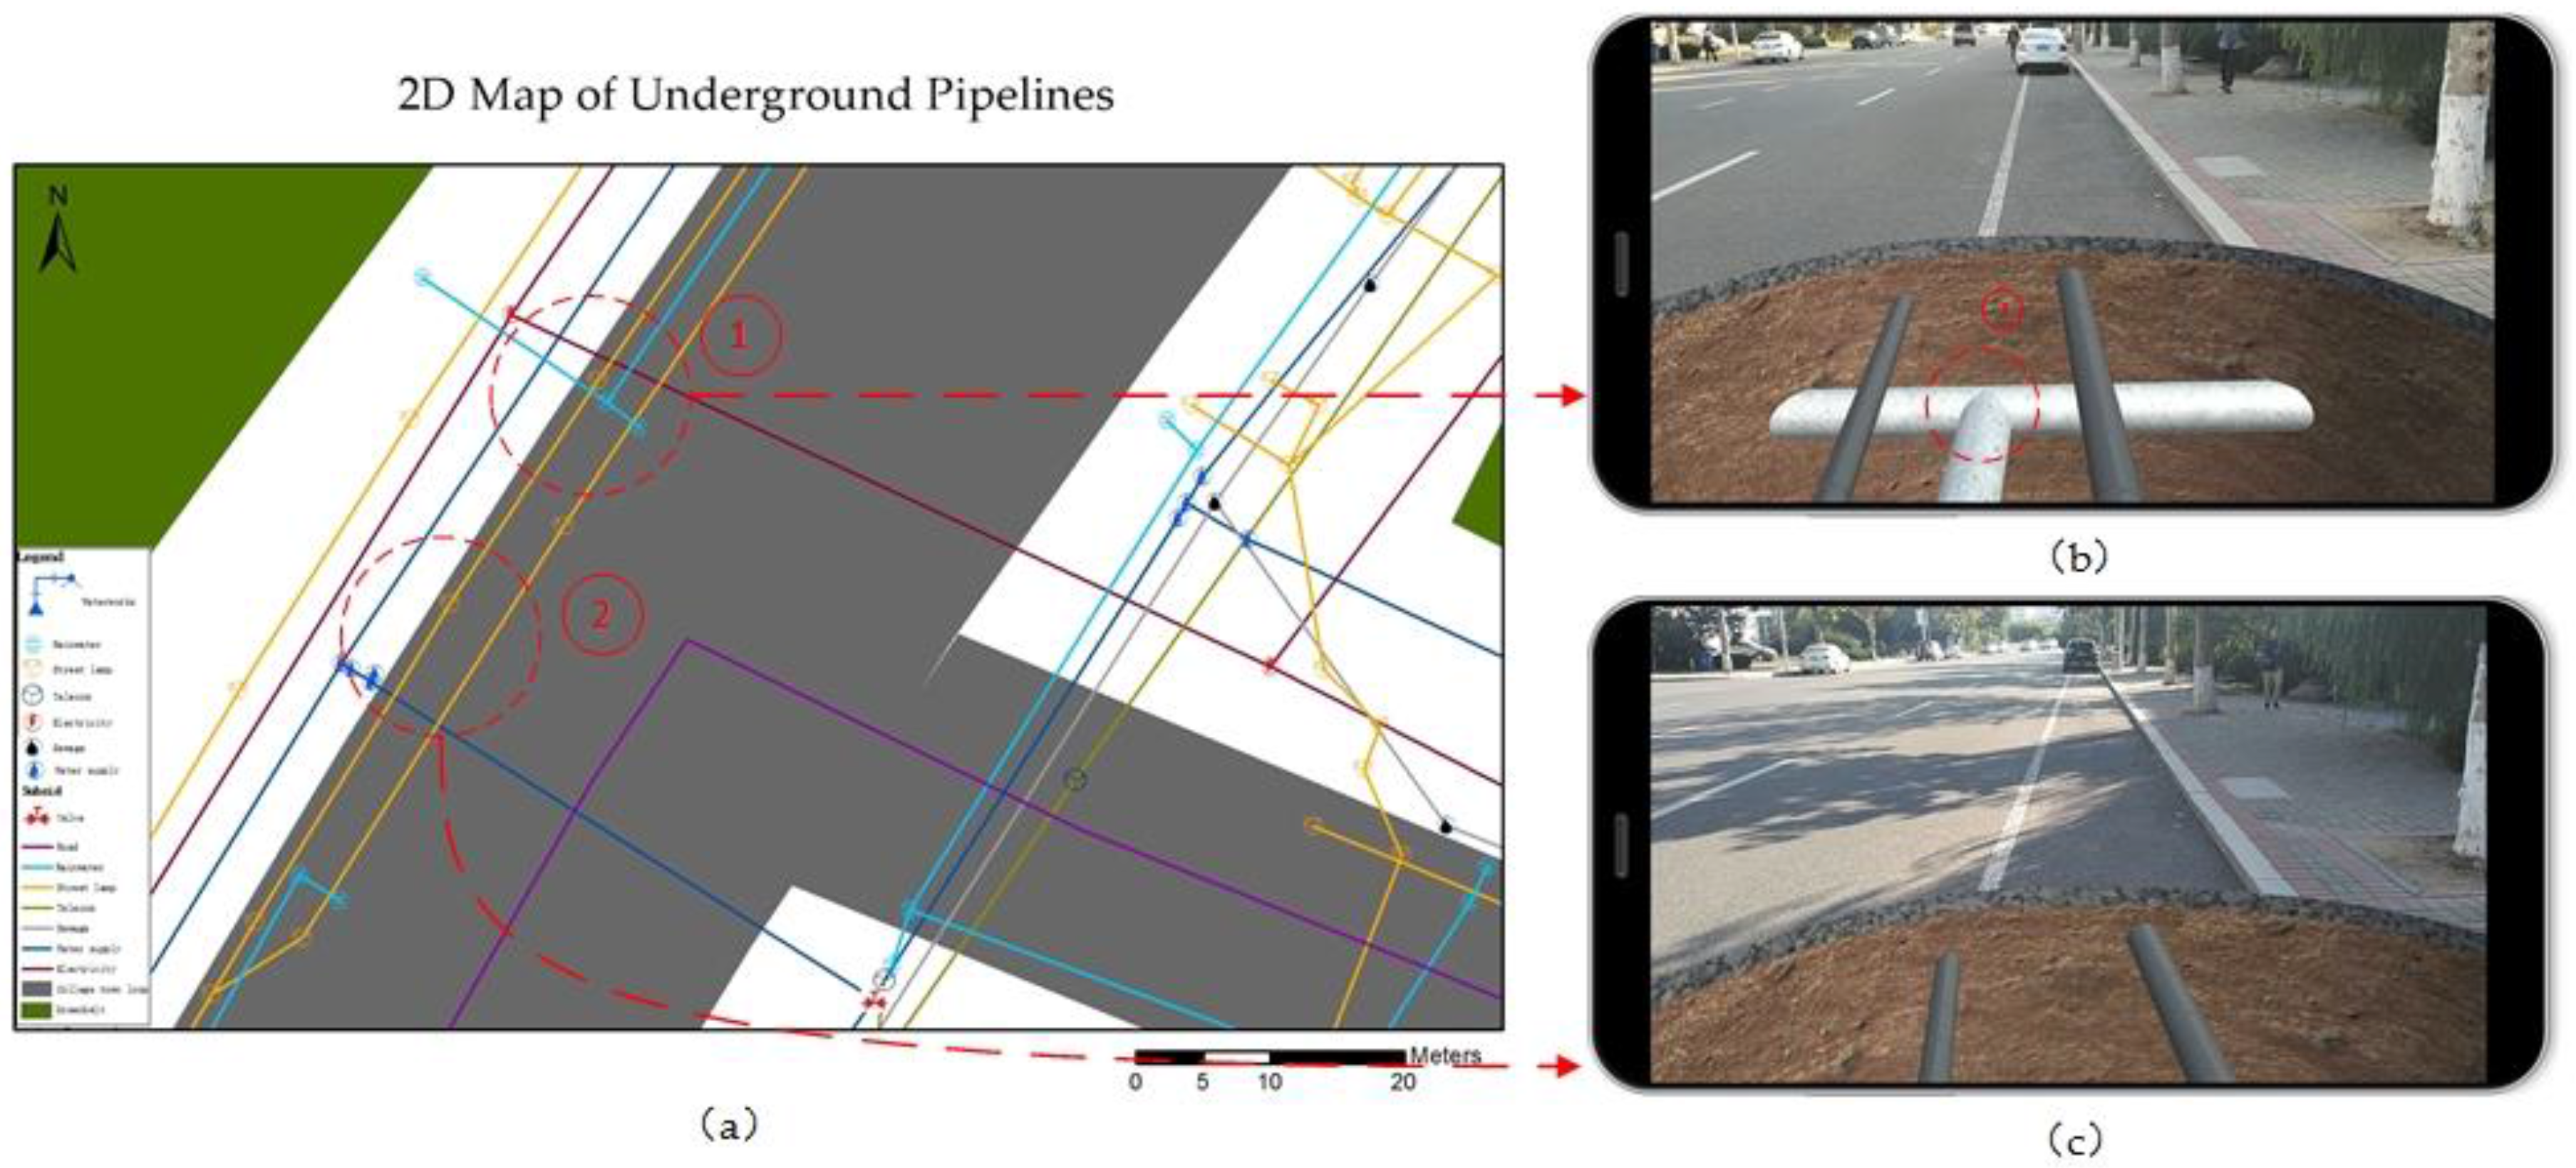
In the first experiment, in order to evaluate the influence of the network RTD and ADF on the accuracy of the pipeline position, we tested our system by calculating the location error in some notable places, such as intersections, school gates, etc. We chose 40 different places to test the spatial accuracy. The handheld differential device worked in dual mode (GPS + BDS). As shown in Figure 8b, we had the actual coordinates of pipeline point ③ in area ①, and marked point ③ on the ground according to the virtual point on the screen of the mobile phone. Assuming that the error of the data measured by the transit can be ignored, we recorded the coordinates of marked point ③ and calculated the mean distance and standard deviation between the actual coordinates and the coordinates of the marked point. As shown in Table 2, the spatial accuracy by RTD reached about 0.613 m; the total error mainly came from the error of GPS positioning and the coordinate transformation. Moreover, using the positioning function of the mobile phone, we found that the mobile device rendered pipelines that were actually located in area ② according to the coordinate data.
We also evaluated the accuracy of ADF and RTD at three specific times: 08:30, 11:30, and 16:30. After the ADF download was complete, we made the camera look at a featured scene. The average success rate was about 0.73. It cost about 1523 ms by mean to identify the scene and initialize the ADF. It performed better in a place with stable light conditions. Then the position of the pipeline adjusted slightly. As shown in Table 2, however, by identifying the scene, drift is reduced and environmental aspects such as sunlight and temperature have an influence on accuracy.
Roberts et al. [11], Schall et al. [12], and Chang et al. [11,12,13,14] proposed visualization of pipelines by tracking based on the combination of RTK GPS and INS, and they had higher location accuracy and relatively poor flexibility and portability. In particular, Schall et al. [13] proposed a method whereby the user could send a query to the Web service to get GML based his location and transcode the GML into visualization data, and accuracy reached 0.3 m by the RTK technology. The user’s position determines the loading of the pipeline data. The high precision of RTK ensures high accuracy of the pipeline location. In our system, the location is further applied to the transformation of pipeline coordinates and the ADF download. The accuracy of the RTD reaches about 0.5 m. Successful initialization of the ADF further increased the location accuracy of the BDS. This indicates that the combination of RTD and visualization could achieve better pipeline location accuracy.
4.2. Tracking Accuracy
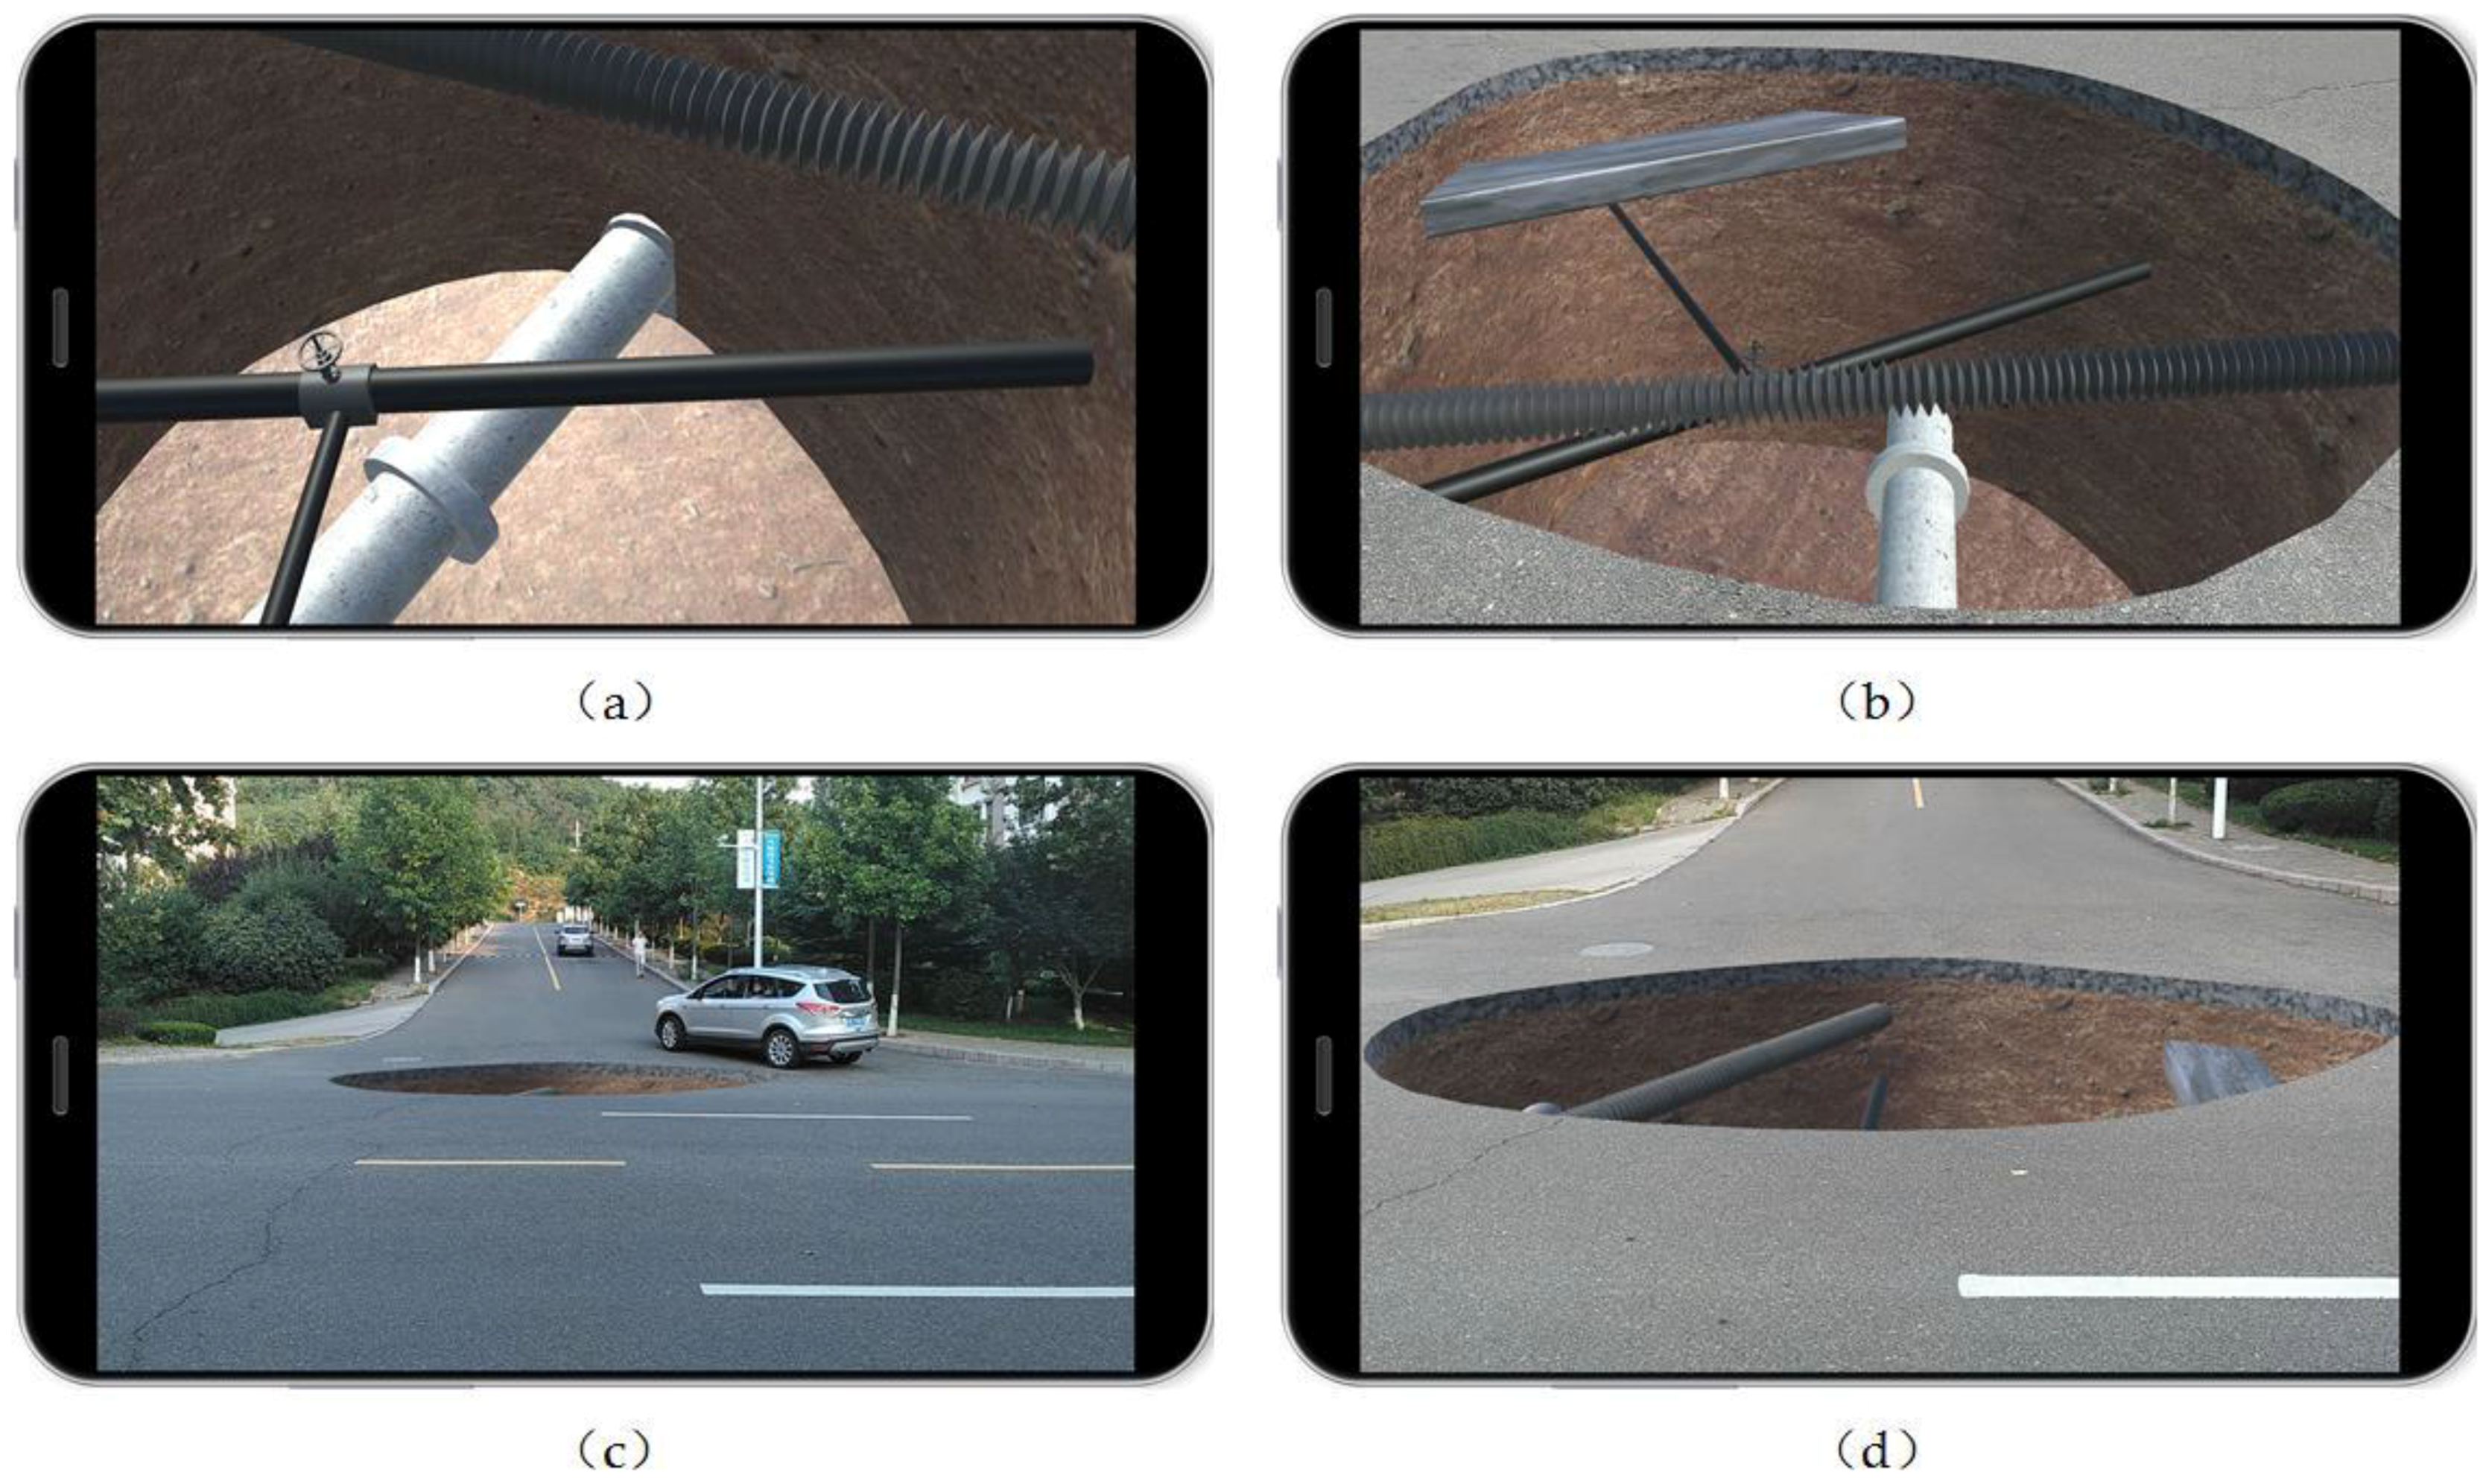
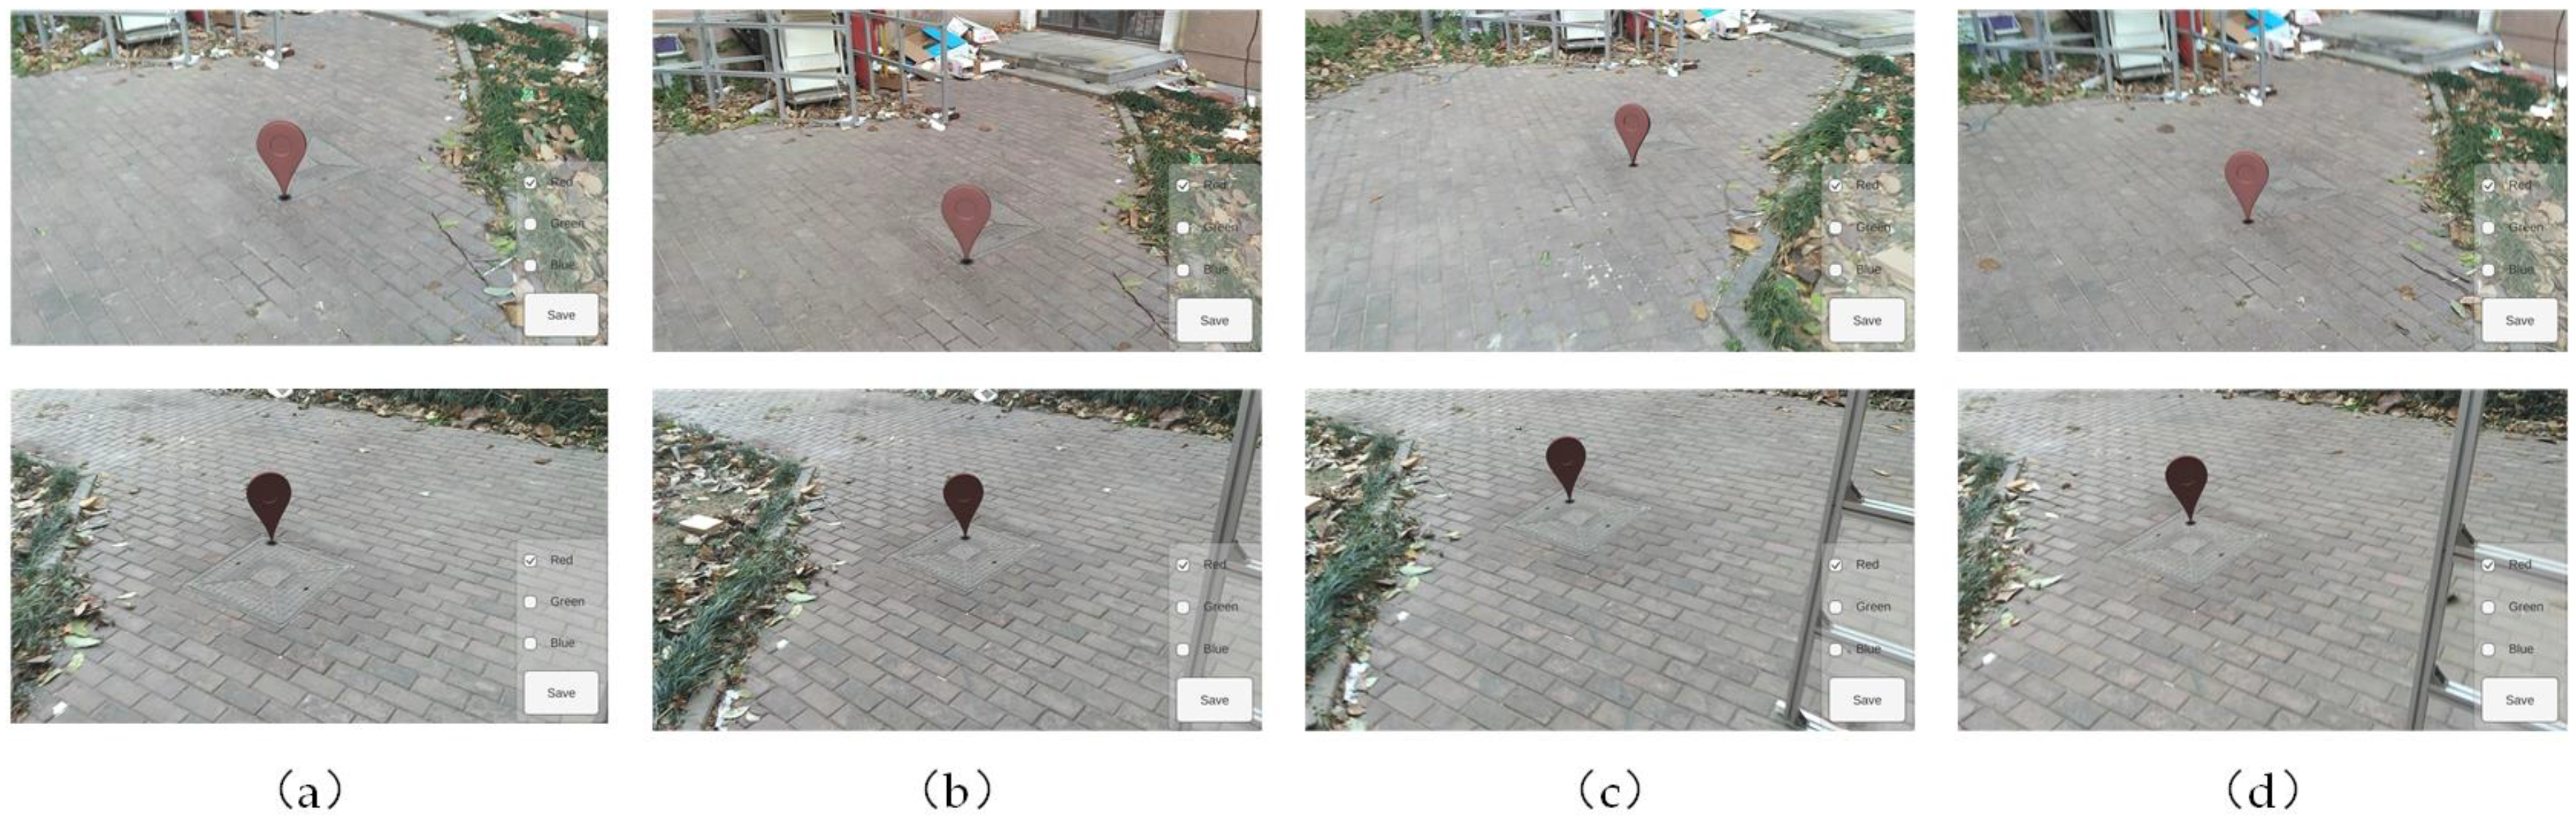
In this experiment, we tested tracking accuracy by observing the translation of virtual objects from different angles at the same time every day. Figure 9 shows four snapshots from when we observed the pipelines at an intersection at Ocean University in China from four different viewpoints. The area of the hole was about 10 m2, and its depth was about 3 m. The position, diameter, depth, and texture of the pipeline were basically consistent with the actual situation. There were drainage pipelines, gas pipelines, and street lamp pipelines. The texture at the edge of the wall was similar to the ground, which made the border between the ground and the buried part look natural. The edge of the hole was at the same height as the floor, enough to show the real vertical relationship between pipelines, thus we did not evaluate the accuracy of elevation.
Furthermore, we evaluated drift quantitatively by placing a striking arrow on the floor and recording the translation of the arrow when people walked in an area five meters long and five meters wide in 13 min from different perspectives 10 times. Every time the experiment finished, we turned off the phone and cooled it down. As shown in Table 3 and Figure 10, we measured the translation according to the location of a particular point between the current time and the original time. The accumulation of drift led to an increase in translation. Working for a long time made Tango overheat and influenced accuracy. It was better to confine the tracking time to 10 min and avoid long-distance tracking.
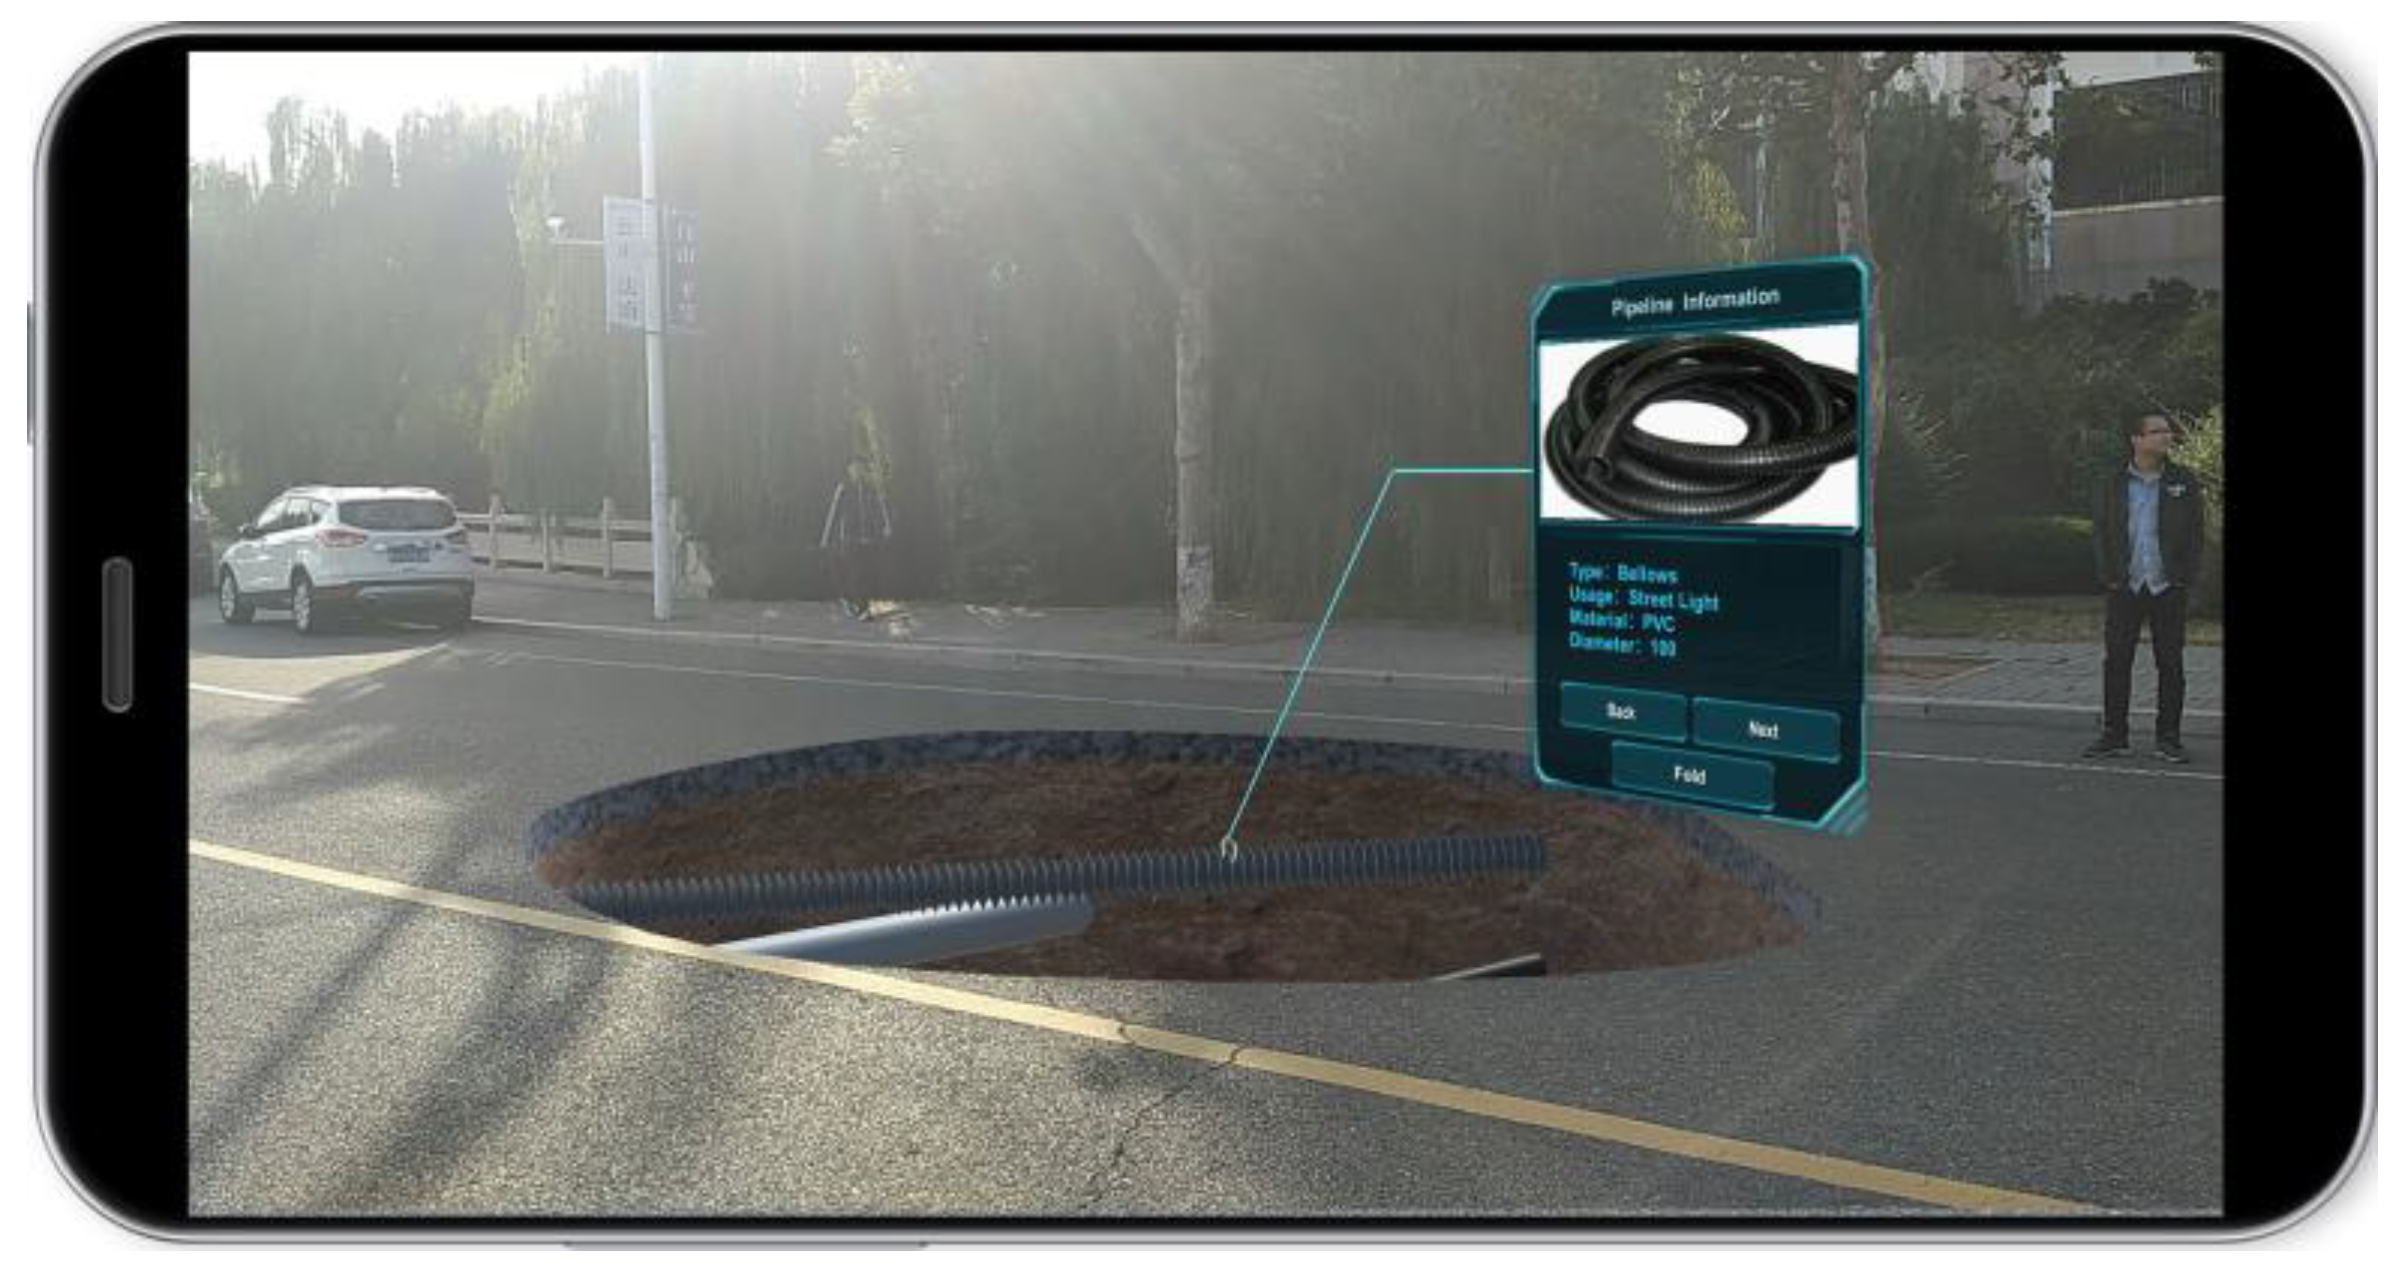
As shown in Figure 11, touching the black pipeline on the screen opened a window showing attribute data such as type, material, usage, etc., received from the server. By stable tracking, the window attached to a fixed position in the real world. We could watch the information from a different perspective. Moreover, we could touch the buttons on the window to achieve basic interaction.
Existing methods, such as [11,12,13,14], adopted GPS and INS to obtain position and orientation, with a low precision and refresh rate. As is known, tracking based on visualization has sub-pixel-level accuracy; the combination of visualization and inertia improves the robustness of outdoor markerless performance. However, when it works for a long time, VIO suffers the accumulation of drift. From the test results, the error is within acceptable range.
4.3. Occlusion Building
In this experiment, we tested occlusion building based on depth perception outdoors under different environmental conditions. Considering that the phone overheats when it does huge computation, we designed a switch to turn the scanning function on and off and stop the scanning after the environmental entity was modeled. It is reasonable to keep the phone a distance of 0.5 to 4 m in front of the entity. We set the resolution of the modeling as 0.03 m to ensure a balance of efficiency and quality, and the system’s refresh rate was around 45 Hz. By walking and changing the viewpoint of the camera, we could enhance the model’s missing details. In Figure 12a, the depth camera got point clouds of the surrounding environment for 3D reconstruction, which was applicable to the static scene. The automotive glass reflected the infrared structure light, and there was no mesh covering the glass. A 3D reconstruction model restored the outline of the car, though there was error in the complex or hidden position; the mesh cover is about 0.013 m above the surface of a real car. In Figure 12b, the texture of the model adopted the transparent occlusion material, which occluded the pipeline and gave the realistic effect that the car covered the pipelines in a vertical direction. Because we were concerned about the 3D reconstruction of the contact position of the entities on the ground instead of the whole body, the contact positions of things on the ground were enough to achieve the occlusion. In short, it is reasonable to use occlusion by 3D reconstruction of the surrounding environment to enhance the feeling of pipelines being sunk in the ground.
Roberts et al. [11] and Chang et al. [14] displayed wide-ranging underground infrastructure that appeared to float on the street. In order to provide a plausible interpretation of depth, Schall et al. [12] designed a cubic hole in the ground for the placement of pipeline. Additionally, we changed the shape of the hole and applied materials from the real world to the underground infrastructure. Furthermore, we utilized depth perception to accomplish 3D reconstruction of real-world entities and made the spatial relationship clear. In this way, we made a scene-graph fusion of virtual pipelines and real ground. The results show that our efforts achieved a more vivid and real portrayal of underground infrastructure.
5. Conclusions
In this research, aiming to solve new challenges in underground pipeline management, we leveraged the power of AR technologies and proposed a rendering procedure for pipeline management. A mobile-based VGE system has been developed to reproduce real physical pipelines and provide spatial decision support capabilities. First, in order to improve location accuracy, we adopted precise positioning based on the BDS to obtain the user’s coordinates. Then we transformed the raw data into attributes in Unity3D through seven-parameter coordinate transformation and rendered the pipelines. The successful initialization of ADF further improved location accuracy. Second, in order to achieve stable object tracking, we adopted Google Tango to achieve the VIO algorithm, which improved the robustness and authenticity of the outdoor pipeline rendering. To improve the immersive experience of underground pipelines in real time, we applied occlusion based on the depth perception of the pipeline rendering and designed pipeline details.
We tested our rendering procedure outdoors, and discuss the improvement over existing methods quantitatively in terms of spatial accuracy, tracking accuracy, and the effect of occlusion. Through these experiments, we reached three conclusions: (1) Compared with the RTK GPS, the RTD BDS obviously reduces the physical burden and makes development of the mobile phone convenient, though it has relatively lower accuracy. Through the integration of scene recognition, it can provide high-precision positioning accuracy. (2) Compared with the GPS-INS tracking technology that is usually adopted outdoors, the VIO achieved higher robustness in markerless environments and had relatively high tracking accuracy. However, over time there still exists an obvious drift; by making the VIO initialize, we can control the error. (3) Occlusion modeling based on depth perception and some detail changes achieved a clearer spatial relationship.
We give full play to the advantages of VGE that can simulate spatial phenomenon whose occurrence is difficult for people to perceive directly. Therefore, we chose AR technology to show pipelines on the site and in a timely manner in the expression environment. The VGE emphasizes multidimensional perception and interaction beyond reality and closer to true nature [7]. Our work aims to express the position and appearance of underground pipelines closer to true nature; we also designed some necessary windows that go beyond reality for interaction. The results show that VGE is an ideal form for representing underground pipelines that matches the nature of human cognition.
However, we have to reduce the resolution to ensure a stable refresh rate. This method still requires further optimization, because real-time 3D reconstruction has a relatively large workload. Strong outdoor light may affect the success rate of scene identification. Temperature also has a certain influence on IMU, which has an impact on tracking precision. All these aspects will be considered in our future work.
Acknowledgments
This work is supported by the Primary Research and Development Plan of Shandong Province (Grant No. 2017CXGC0608), Qingdao major projects of independent innovation (No. 16-7-1-1-zdzx-xx), Qingdao source innovation program (No. 17-1-1-6-jch), and the Fundamental Research Funds for the Central Universities (No. 201762005).
Author Contributions
Wei Li designed and implemented the method, wrote the paper. We Li and Chenrong Zhu did the experiments. Yong Han conducted the experiments and helped Wei Li to analyze experimental results. Ge Chen, Yu Liu and Yibin Ren read and modified the paper. Yanjie Wang drew the result figures of the experiments.
Conflicts of Interest
The authors declare no conflict of interest.
References
- Shi, L.; Liu, Z.; Fu, J.; Yan, S. Research on the utility tunnel location technology based on ZigBee communication network. C e Ca 2017, 42, 167–171. [Google Scholar]
- Qingquan, L.I. Research on 3D Visualization of Underground Pipeline; Editorial Board of Geomatics & Information Science of Wuhan University: Wuhan, China, 2003. [Google Scholar]
- Lu, G. Geographic analysis-oriented Virtual Geographic Environment: Framework, structure and functions. Sci. China Earth Sci. 2011, 54, 733–743. [Google Scholar] [CrossRef]
- Lin, H.; Lu, G. Virtual Geographic Environment: A Workspace for Computer-Aided Geographic Experiments. Ann. Assoc. Am. Geogr. 2013, 103, 465–482. [Google Scholar] [CrossRef]
- Lv, Z.; Li, X.; Hu, J.; Yin, L.; Zhang, B.; Feng, S. Virtual geographic environment based coach passenger flow forecasting. In Proceedings of the IEEE International Conference on Computational Intelligence and Virtual Environments for Measurement Systems and Applications, Shenzhen, China, 12–14 June 2015; pp. 1–6. [Google Scholar]
- Che, W.; Lin, H.; Hu, M.; Lin, T. Reality-virtuality fusional avatar-based noise measurement and visualization in online virtual geographic environment. Ann. Gis 2014, 20, 109–115. [Google Scholar] [CrossRef]
- Hui, L.; Huang, F.; Xuejun, L.U.; Mingyuan, H.U.; Bingli, X.U. Preliminary study on virtual geographic environment cognition and representation. J. Remote Sens. 2010, 14, 822–838. [Google Scholar]
- Azuma, R.; Baillot, Y.; Behringer, R.; Feiner, S.; Julier, S.; MacIntyre, B. Recent Advances in Augmented Reality. IEEE Comput. Graph. 2001, 21, 34–47. [Google Scholar] [CrossRef]
- Feiner, S.; Macintyre, B.; Hollerer, T.; Webster, A. A Touring Machine: Prototyping 3D Mobile Augmented Reality Systems for Exploring the Urban Environment. Pers. Technol. 1997, 1, 208–217. [Google Scholar] [CrossRef]
- Sutherland, I.E. A head-mounted three dimensional display. In Proceedings of the Fall Joint Computer Conference, San Francisco, CA, USA, 9–11 December 1968; pp. 757–764. [Google Scholar]
- Roberts, G.W.; Evans, A.; Dodson, A. The Use of Augmented Reality, GPS and INS for Subsurface Data Visualisation. In Proceedings of the FIG XXII International Congress, Washington, DC, USA, 19–26 April 2002; pp. 1–12. [Google Scholar]
- Schall, G.; Mendez, E.; Kruijff, E.; Veas, E.; Junghanns, S.; Reitinger, B.; Schmalstieg, D. Handheld Augmented Reality for underground infrastructure visualization. Pers. Ubiquitous Comput. 2009, 13, 281–291. [Google Scholar] [CrossRef]
- Schall, G.; Schöning, J.; Paelke, V.; Gartner, G. A survey on augmented maps and environments. Adv. Web-Based GIS Mapp. Serv. Appl. 2011, 9, 207. [Google Scholar]
- Yong, C.; Xue, L.M. Research on Constructing Outdoor Augmented Reality System Based on Improved ARToolKit. J. Syst. Simul. 2009, 21, 2273–2276. [Google Scholar]
- Wagner, D.; Schmalstieg, D. ARToolkit on PocketPC platform. In Proceedings of the 2003 IEEE International Augmented Reality Toolkit Workshop, Tokyo, Japan, 7 October 2003; pp. 14–15. [Google Scholar]
- Cushnan, D.; El Habbak, H. Developing AR Games for iOS and Android; Packt Publishing Ltd.: Birmingham, UK, 2013. [Google Scholar]
- Kato, H.; Billinghurst, M. Marker Tracking and HMD Calibration for a Video-Based Augmented Reality Conferencing System. In Proceedings of the IEEE and ACM International Workshop on Augmented Reality, San Francisco, CA, USA, 20–21 October 2002; p. 85. [Google Scholar]
- Siltanen, S. Theory and Applications of Marker Based Augmented Reality; VTT: Espoo, Finland, 2012; pp. 45–50. [Google Scholar]
- Amin, D.; Govilkar, S. Comparative Study of Augmented Reality Sdk’s. Int. J. Comput. Sci. Appl. 2015, 5, 11–26. [Google Scholar] [CrossRef]
- Davison, A.J. Real-Time Simultaneous Localisation and Mapping with a Single Camera. In Proceedings of the IEEE International Conference on Computer Vision, Nice, France, 13–16 October 2003; p. 1403. [Google Scholar]
- Engel, J.; Schöps, T.; Cremers, D. LSD-SLAM: Large-Scale Direct Monocular SLAM; Springer International Publishing: Berlin, Germany, 2014; pp. 834–849. [Google Scholar]
- Durrant-Whyte, H.; Bailey, T. Simultaneous Localization and Mapping: Part I. IEEE Robot. Autom. Mag. 2006, 13, 99–110. [Google Scholar] [CrossRef]
- Bailey, T.; DurrantWhyte, H. Simultaneous localisation and mapping (slam) part 2: State of the art. IEEE Robot. Autom. Mag. 2006, 13, 108–117. [Google Scholar] [CrossRef]
- Davison, A.J.; Reid, I.D.; Molton, N.D.; Stasse, O. MonoSLAM: Real-Time Single Camera SLAM. IEEE Trans. Pattern Anal. Mach. Intell. 2007, 29, 1052–1067. [Google Scholar] [CrossRef] [PubMed] [Green Version]
- Jones, E.S.; Soatto, S. Visual-inertial navigation, mapping and localization: A scalable real-time causal approach. Int. J. Robot. Res. 2011, 30, 407–430. [Google Scholar] [CrossRef]
- Leutenegger, S.; Lynen, S.; Bosse, M.; Siegwart, R.; Furgale, P. Keyframe-based visual-inertial odometry using nonlinear optimization. Int. J. Robot. Res. 2015, 34, 314–334. [Google Scholar] [CrossRef]
- Marder-Eppstein, E. Project Tango; ACM SIGGRAPH 2016 Real-Time Live: Anaheim, CA, USA, 2016; p. 40. [Google Scholar]
- Li, M.; Mourikis, A.I. High-precision, consistent EKF-based visual–inertial odometry. Int. J. Robot. Res. 2013, 32, 690–711. [Google Scholar] [CrossRef]
- Li, M.; Qu, L.; Zhao, Q.; Guo, J.; Su, X.; Li, X. Precise point positioning with the BeiDou navigation satellite system. Sensors 2014, 14, 927–943. [Google Scholar] [CrossRef] [PubMed]
- Klingensmith, M.; Dryanovski, I.; Srinivasa, S.; Xiao, J. Chisel: Real Time Large Scale 3D Reconstruction Onboard a Mobile Device using Spatially Hashed Signed Distance Fields. Robot. Sci. Syst. 2015, 4. [Google Scholar]
- Schops, T.; Sattler, T.; Hane, C.; Pollefeys, M. 3D Modeling on the Go: Interactive 3D Reconstruction of Large-Scale Scenes on Mobile Devices. In Proceedings of the International Conference on 3d Vision, Lyon, France, 19–22 October 2015; pp. 291–299. [Google Scholar]
- Jili, Y. Rigorous Formula for Direct Calculating Parameter in 3D Transformation. Bull. Surv. Mapp. 2006, 5, 57–60. [Google Scholar]
- Lee, J.; Jung, S.; Pullen, S. Enhancements of Long Term Ionospheric Anomaly Monitoring for the Ground-Based Augmentation System. Proc. Int. Tech. Meet. Inst. Navig. 2011, 8034, 930–941. [Google Scholar]
- Yunck, T.P.; Bertiger, W.I.; Lichten, S.M.; Mannucci, A.J.; Muellerschoen, R.J.; Wu, S.C. Robust Real-Time Wide-Area Differential GPS Navigation. U.S. Patent 5,828,336, 27 October 1998. [Google Scholar]
- Angeli, A.; Filliat, D.; Doncieux, S.; Meyer, J. Fast and Incremental Method for Loop-Closure Detection Using Bags of Visual Words. IEEE Trans. Robot. 2008, 24, 1027–1037. [Google Scholar] [CrossRef] [Green Version]
- Wang, L.; Shaojie, N.I.; Wang, F. Development and Application of GPS Ground-based Augmentation System. Gnss World China 2014, 39, 26–29. [Google Scholar]
- Salas, M.; Latif, Y.; Reid, I.D.; Montiel, J.M.M. Trajectory Alignment and Evaluation in SLAM: Horn’s Method vs Alignment on the Manifold. Available online: http://webdiis.unizar.es/~msalasg/docs/rss15.pdf (accessed on 18 January 2018).
- Scaramuzza, D.; Fraundorfer, F. Visual Odometry: Part I: The First 30 Years and Fundamentals. IEEE Robot. Autom. Mag. 2011, 18, 80–92. [Google Scholar] [CrossRef]
- Hesch, J.A.; Kottas, D.G.; Bowman, S.L.; Roumeliotis, S.I. Camera-IMU-based localization: Observability analysis and consistency improvement. Int. J. Robot. Res. 2014, 33, 182–201. [Google Scholar] [CrossRef]
- Newcombe, R.A.; Izadi, S.; Hilliges, O.; Molyneaux, D.; Kim, D.; Davison, A.J.; Kohi, P.; Shotton, J.; Hodges, S.; Fitzgibbon, A. KinectFusion: Real-time dense surface mapping and tracking. In Proceedings of the IEEE International Symposium on Mixed and Augmented Reality, Basel, Switzerland, 26–29 October 2012; pp. 127–136. [Google Scholar]
Figure 1.
Architecture of the system with solutions for the three problems we proposed: (a) location-based data transmission, (b) tracking based on the Visual-Inertial Odometry (VIO), and (c) occlusion built by the 3D reconstruction.
Figure 1.
Architecture of the system with solutions for the three problems we proposed: (a) location-based data transmission, (b) tracking based on the Visual-Inertial Odometry (VIO), and (c) occlusion built by the 3D reconstruction.

Figure 2.
The procedures of pipeline loading: (a) obtaining differential corrections, (b) providing differential corrections solutions, and (c) loading data.
Figure 2.
The procedures of pipeline loading: (a) obtaining differential corrections, (b) providing differential corrections solutions, and (c) loading data.

Figure 3.
Coordinate conversion from spatial rectangular coordinate system to world coordinates.

Figure 4.
Camera tracking in a virtual subway station (a) at the corner, (b) near the elevator.

Figure 5.
Ways pipelines are rendered: (a) in static mode, (b) in dynamic mode.

Figure 6.
Occlusion for pipelines and walls.

Figure 7.
The procedure of occlusion building: (a) the mesh component, (b) the visual effort of occlusion.
Figure 7.
The procedure of occlusion building: (a) the mesh component, (b) the visual effort of occlusion.

Figure 8.
Test of pipeline position: (a) 2D map of underground pipelines; (b) the correct pipeline position; (c) the wrong pipeline position.
Figure 8.
Test of pipeline position: (a) 2D map of underground pipelines; (b) the correct pipeline position; (c) the wrong pipeline position.

Figure 9.
Underground pipelines in a road: (a) on the top of the pipelines; (b) at the edge of the hole; (c) far away from the hole; (d) the whole area of the pipelines.
Figure 9.
Underground pipelines in a road: (a) on the top of the pipelines; (b) at the edge of the hole; (c) far away from the hole; (d) the whole area of the pipelines.

Figure 10.
Positions of arrows at different times and two different angles: (a) at the 1st min; (b) at the 5th min; (c) at the 9th min; (d) at the 13th min.
Figure 10.
Positions of arrows at different times and two different angles: (a) at the 1st min; (b) at the 5th min; (c) at the 9th min; (d) at the 13th min.

Figure 11.
Display of the pipeline information.

Figure 12.
Underground pipeline based on 3D reconstruction occlusion: (a) the 3D reconstruction of the environment; (b) effect of transparent occlusion material treatment.
Figure 12.
Underground pipeline based on 3D reconstruction occlusion: (a) the 3D reconstruction of the environment; (b) effect of transparent occlusion material treatment.


Table 1.
Structure of pipeline spatial data.
| Field | Type | Mean |
|---|---|---|
| Id | int | Pipeline number |
| Start_lng | float | Start point longitude |
| End_lng | float | End point longitude |
| Start_lat | float | Start point latitude |
| End_lat | float | End point latitude |
| Start_ele | float | Start point elevation |
| End_ele | float | End point elevation |
| Start_dep | float | Start point depth |
| End_dep | float | End point depth |
| Diameter | float | Pipeline diameter |
| Material | varchar | Pipeline material |
Table 2.
Standard deviation of the pipeline position.
| Method | Mean (m) | Standard Deviation (m) |
|---|---|---|
| RTD (BDS + GPS) | 0.613 | 0.054 |
| RTD + ADF | 0.127 | 0.074 |
Table 3.
Translation of pipelines in 13 min.
| Time (min) | Translation (m) |
|---|---|
| 1 | 0.022 ± 0.013 |
| 5 | 0.044 ± 0.017 |
| 9 | 0.090 ± 0.021 |
| 13 | 0.123 ± 0.020 |
© 2018 by the authors. Licensee MDPI, Basel, Switzerland. This article is an open access article distributed under the terms and conditions of the Creative Commons Attribution (CC BY) license (http://creativecommons.org/licenses/by/4.0/).
Share and Cite
MDPI and ACS Style
Li, W.; Han, Y.; Liu, Y.; Zhu, C.; Ren, Y.; Wang, Y.; Chen, G. Real-Time Location-Based Rendering of Urban Underground Pipelines. ISPRS Int. J. Geo-Inf. 2018, 7, 32. https://0-doi-org.brum.beds.ac.uk/10.3390/ijgi7010032
AMA Style
Li W, Han Y, Liu Y, Zhu C, Ren Y, Wang Y, Chen G. Real-Time Location-Based Rendering of Urban Underground Pipelines. ISPRS International Journal of Geo-Information. 2018; 7(1):32. https://0-doi-org.brum.beds.ac.uk/10.3390/ijgi7010032
Chicago/Turabian StyleLi, Wei, Yong Han, Yu Liu, Chenrong Zhu, Yibin Ren, Yanjie Wang, and Ge Chen. 2018. "Real-Time Location-Based Rendering of Urban Underground Pipelines" ISPRS International Journal of Geo-Information 7, no. 1: 32. https://0-doi-org.brum.beds.ac.uk/10.3390/ijgi7010032
Note that from the first issue of 2016, this journal uses article numbers instead of page numbers. See further details here.