1. Introduction
Members of the general public have for centuries made substantial contributions to science. The inputs range greatly and include the observations of environmental features by an individual and the processing of vast datasets by teams of citizens working in parallel in subjects ranging from astronomy to zoology. Technological developments such as the internet have greatly facilitated the recent strong rise in citizen science activity [
1]. Additional technological advances, such as those that have allowed inexpensive and location-aware devices to become commonplace, have been associated with a substantial increase in citizen science activity within geography for which spatial data sets are important. This type of activity has been described in a variety of ways including neogeography, volunteered geographic information, user-generated content, and crowdsourcing [
2]. The latter term will be used in this article. Crowdsourcing has become a popular means of acquiring geographic information. Indeed, the rise of the citizen sensor and growth of volunteered geographic information has revolutionised aspects of contemporary geoinformatics and mapping [
3,
4,
5,
6]. The power of the crowd has been harnessed in a wide range of mapping applications such as building damage mapping to aid post-disaster humanitarian aid [
7,
8] through scientific studies of the Earth [
9] to the provision of complete open mapping at local to global scales such as OpenStreetMap [
10]. Crowdsourcing has greatly changed mapping practice and also allows information that was otherwise impossible or at least impractical to obtain by other means to be acquired. One growth area in geoinformatics has been crowdsourcing as a source of ground reference data on land cover to inform analyses of satellite remote sensing imagery [
11]. This is an important and growing application area, with citizens having the potential to provide the ground reference data that are needed to fully exploit the potential of remote sensing as a source of information on land cover.
A major problem with the volunteered geographic information (VGI) on land cover provided by the citizen community is that it can be of variable and typically unknown quality, resulting in concern over data accuracy and fitness for purpose [
12,
13,
14,
15]. The volunteers providing the data may, for example, vary greatly in their skill and ability to provide accurate class labels. Some contributors may simply be enthusiastic but unskilled while others, and quite commonly so [
16], may actually have considerable relevant expertise [
17,
18]. Nonetheless, the power of the crowd is such that its combined wisdom helps generate a final high quality crowdsourced product.
The collective view of the crowd can be obtained in a variety of ways. Commonly, a simple democratic voting procedure is used to bring together the individual inputs from the volunteers and determine a single crowdsourced view. As such, it is common to find that a consensus or ensemble approach to labelling is used with crowdsourced data [
14,
15]. In these approaches, the contributions from each volunteer are often equally weighted. While ensemble approaches often appear to work well there are still concerns on the variation in quality of data acquired by citizens [
19]. This is apparent in relation to performance relative to other citizens, but also within an individual’s own set of contributions as performance might vary within given task. For example, in labelling-based tasks, a volunteer may be able to accurately label a sub-set of the classes but not the rest and so contribute quite differently to another volunteer with a different skill-set. A common concern is that a basic ensemble approach weights each contributor’s inputs equally even though the volunteers may be of very different ability. This can give rise to a range of potential problems. For example, one volunteer, who may have considerable relevant expertise, may correctly label a case but this lone voice could be lost among the contradictory labelling provided by less informed members of the crowd who may be very numerous. As such, the composition of the crowd is important [
17] and there may be a desire to weight contributions unequally to avoid problems of mob rule.
A variety of ways to facilitate effective use of VGI have been proposed. It is, for example, possible for trusted contributors to act as gatekeepers or to check the credibility of a contribution in relation to its known geographic context [
20]. These various approaches to try and assure the quality of VGI are, however, not a panacea. It would, for example, be perfectly possible for a gatekeeper acting in good faith to be a barrier to the provision of accurate information from a new but presently untrusted contributor who actually has more skill and knowledge than the gatekeeper. Other means to try and enhance the quality of VGI have included the acquisition of information on the confidence of labelling. For example, volunteers may be asked when labelling cases to indicate for each one their confidence in the class allocation made [
18]. This might then allow cases labelled with considerable uncertainty to be filtered out so that only cases labelled with high confidence are used. However, this type of approach has problems. Volunteers may have inflated views on their ability and in some instances, for example, ignorant people will still confidently label cases [
21]. An enhancement of this basic method could be based on the surprisingly popular approach that focuses on labelling that is more popular than predicted [
22]. Variations in volunteer performance would still be expected. If, however, this variation could be quantified then it may be possible to use this information to enhance analyses. For example, information on the performance of volunteers in terms of their ability to label cases obtained from the data may be used to enhance the accuracy of land cover maps [
23]. Estimates of volunteer performance could also be used to weight simple voting procedures, perhaps acting to amplify the contributions from volunteers deemed skilled while down-weighting or even ignoring contributions from volunteers deemed to be inaccurate data sources. Thus, it would be possible to recognise that contributions vary in value and seek to weight them unequally within an ensemble approach. In previous work, it was shown that it is possible to characterise the quality of volunteers in terms of the accuracy of their labelling for each class using only the contributed data [
24,
25]. Here, the aim is to go beyond the characterisation of the quality of the volunteered data and show how this information, and other information inferred from the contributed data, may be used to enhance the final crowdsourced label that may be applied to VGI.
The key aim of this paper is to explore some simple scenarios for enhancing the accuracy of crowdsourced data on land cover obtained via visual interpretation of satellite sensor images provided via an internet based collaborative project. The paper seeks to show that useful information to inform an ensemble classification that employs a weighted voting strategy can be inferred from the volunteered data and this can be used to increase the overall accuracy of the ensemble classification.
2. Data
The data used comprised land cover class labels obtained from a group of volunteers for a set of 299 satellite sensor images of locations selected randomly over the global land mass. These data were acquired via an open call for data collection through the Geo-Wiki project [
26,
27] and were used in earlier research [
24,
25]. The data are available for downloading from the PANGAEA repository as documented in [
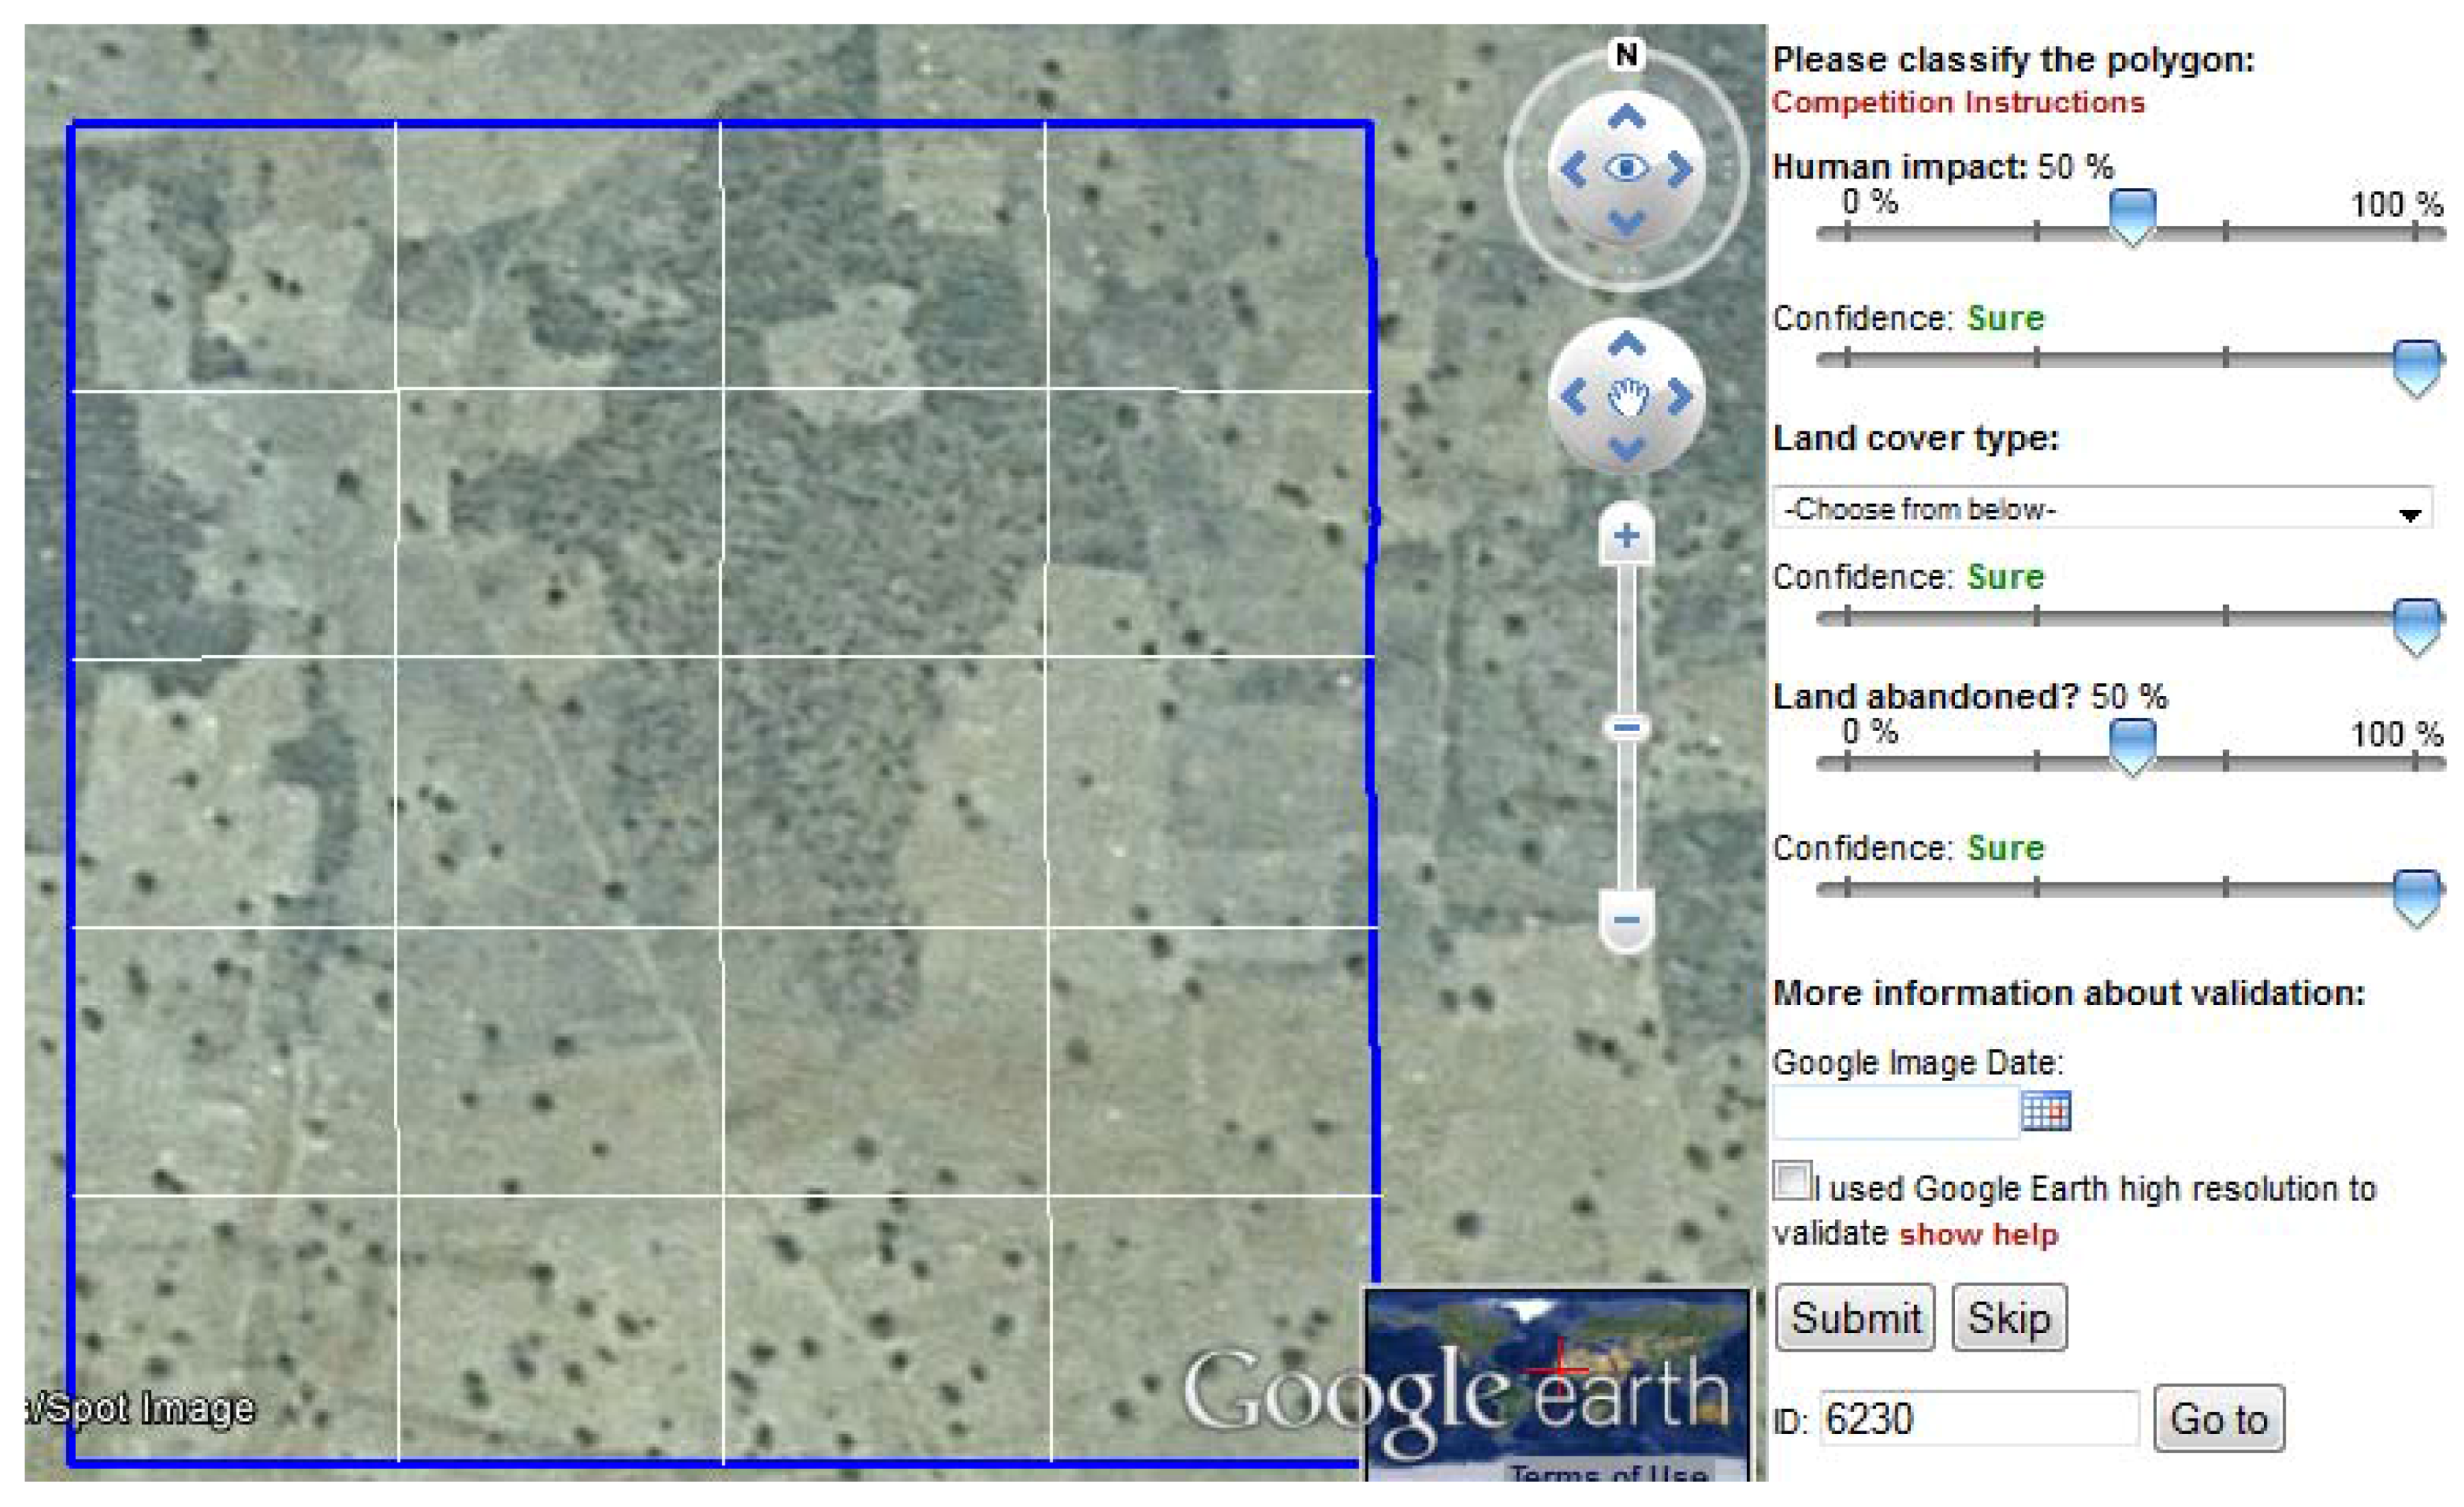
28]. Each volunteer was invited to view the series of satellite sensor images and assign each a land cover label from a defined list of 10 classes: tree cover, shrub cover, herbaceous vegetation/grassland, cultivated and managed, mosaic of cultivated and managed/natural vegetation, regularly flooded/wetland, urban/built-up, snow and ice, barren, and open water. The volunteers were aided in this task by a brief on-line tutorial and no constraints were put upon contribution. An example of the interface used to collect the data is shown in
Figure 1.
In total, 65 volunteers contributed to the project but their contributions varied greatly in completeness. The amount of images labelled spanned the full spectrum possible, with one volunteer labelling a single image while a few labelled all 299; the average number of images labelled by a volunteer was approximately 110 images. Here, attention is focused on the labels provided by the 10 volunteers who labelled most if not all of the 299 images; these 10 volunteers labelled at least 289 images each. Consequently, this group of volunteers annotated broadly the same set of images reducing the potential for problems such as optimistic bias in their labelling that could occur by skipping the complex to label cases and focusing on only the easier images. The focus on a relatively small group of volunteers is also in keeping with suggestions in the literature [
15,
25] as well as a means of balancing the competing pressures of seeking multiple annotations but wishing to label many cases [
29].
Although a key focus of this article is on information obtained directly from the crowdsourced data without any independent reference data set, a reference data set was formed to help demonstrate and confirm the approach used. Thus, a reference data set was generated simply to confirm the value of the approaches to be adopted, ensuring that the results and interpretations are credible. Three of the 10 selected contributors were experts who also revisited the entire set of 299 images to derive a ground reference data set after discussion amongst themselves informed by their own set of labellings. Although this reference data set is unlikely to be perfect and represent a true gold standard reference which can lead to misestimation [
30] it is, however, of a type that is common in major mapping programmes (e.g., [
31]). These ground reference data were used to assess the accuracy of the labelling generated from the data contributed by the remaining seven volunteers. This approach reduced the potential for complications caused by missing data and meant that for most of the 299 images, a set of seven class labels were defined. Each label was treated here as a vote for the relevant class and used in simple ensemble methods to obtain a single crowdsourced land cover class label for each image. To maintain anonymity these seven volunteers were labelled A–G.
3. Methods
The work focuses on four scenarios. The first scenario is a benchmark test of the value of the crowd. In this, the accuracy with which individual volunteers classified the images is compared to the accuracy of the classification obtained from the volunteers as a whole using a basic majority voting approach to label each image from the set of labels generated for it by the seven volunteers. Here, accuracy was measured relative to the reference data set generated from the three expert contributors and expressed as the percentage of correctly allocated cases.
All additional analyses sought to use information inferred from the data contributed by the volunteers to weight the voting procedure. Here, the weighting focused on the skill of the volunteers in terms of their ability to label each class and on the relative abundance of the classes in the data set. Information on both of the latter variables was inferred from the results of a latent class analysis of the volunteered data.
The latent class analysis uses the observed data contributed by the volunteers to provide information on an unobserved or latent variable which in this case is the actual land cover. A standard latent class model to describe the relationship between the observed and latent variables was used and can be written as
where
is a vector representing the complete set of responses obtained from the
V volunteers (1 <
v <
V) contributing data for the case
i,
C is the number of classes, and
x the latent variable [
32,
33]. Assuming that the model is found to fit with the observed data, the parameters of this model provide the information to inform weighted voting approaches. Specifically, the
parameters of the model represent the conditional probabilities of class membership. Thus, for example, these model parameters indicate the conditional probability that a case allocated a class label by a volunteer is actually a member of that class; in the geoinformatics community, this probability is often referred to as the producer’s accuracy for the specified class. Critically, for each volunteer, it is possible to obtain a conditional probability of class membership for each class, indicating the volunteer’s skill in labelling each class. The average conditional probability calculated over all classes was also used as a measure of the volunteer’s overall skill. In addition, the other latent class model parameter,
, indicates the prevalence or abundance of the classes. A feature to note here is that the information on both volunteer skill and class abundance is inferred from only the contributed data.
The information on per-class producer’s accuracy for each class and each volunteer could be used to weight the contributions from the volunteers. Of the many ways to approach this task, in Scenario 2 any label (i.e., vote) for a class from a volunteer whose accuracy in labelling of that class was estimated to be substantially less than the maximum accuracy observed for that class was deleted. Here, the focus was on instances for which there was a very large difference in the accuracy relative to that observed for the most accurate volunteer. The approach was implemented here by ignoring the label provided by a volunteer if that volunteer’s estimated accuracy for that specific class, rounded to a whole number, was more than 30% less than the highest estimated accuracy for that class associated with another volunteer. This, in effect, was seeking to determine if removing votes from volunteers known to be inaccurate on a specific class would help the overall labelling task. Note that while the labels for a class may be ignored, the other class labels provided by a volunteer would still be used, it is only the labels for class(es) on which the volunteer’s performance was viewed as insufficiently high that are removed.
In Scenario 3, the entire contribution from a volunteer with low overall accuracy, expressed as the mean of the producer’s accuracy estimated over all classes, were down-weighted to zero by their removal. In essence this was seeking to explore the effect of ‘silencing’ an inaccurate contributor. Here, this was undertaken twice: the contributions from the volunteer deemed least accurate were removed (Scenario 3a) and the contributions from the two volunteers deemed least accurate were removed (Scenario 3b).
The measure of overall accuracy used in Scenario 3 weights each class equally but accounts for variations in class abundance could further enhance the analysis. This approach would, for example, reduce the effect of poor performance on classes that are rare and so have little impact on the overall proportion of cases correctly classified. Given this context, Scenario 4 sought to extend the analysis one step further and weight the per-class producer’s accuracy values estimated for the volunteers by class abundance information estimated from the latent class model. Here, the contributions from the most inaccurate contributor were again removed. In addition, the research sought to explore the effect of magnifying the input of the most accurate contributor, here achieved by duplicating their contributions, effectively making a vote count twice. This weighting is relatively arbitrary and different results could be expected at other settings. In total three different approaches were explored: the magnification of the contributions of most accurate contributor (Scenario 4a), the magnification of the contributions from the most accurate contributor and the removal of the data from the least accurate contributor (Scenario 4b) and the removal of the contributions from least accurate contributor (Scenario 4c).
The overall accuracy of a crowdsourced set of class labels was expressed as the percentage of cases whose labelling agreed with that in the reference data set. The statistical significance of differences in overall accuracy was calculated using the McNemar test. The latter focuses on the discordant cases, the cases which were allocated correctly in only one of the pair of classifications compared. The test is based on the normal curve deviate, z, and the null hypothesis of no significant difference is rejected if the value of z obtained is greater than the critical value of |1.96|; the sign is important for a hypothesis with a directional component for which the critical value of z at the 95% level of confidence is 1.645.
4. Results and Discussion
A reference data set, to be used purely for illustrative purposes and ensure credibility of the results, was obtained from the three expert contributors who allocated labels after reaching a consensus. The labelling from these contributors showed moderate levels of pairwise agreement (with 66.6–69.9% pairwise agreement; kappa coefficients varied from 0.55–0.61) and final class allocations were made after discussion amongst the experts informed by their own initial labelling. It was apparent that the classes varied greatly in abundance. Two classes (regularly flooded/wetland and snow and ice) were determined to be absent in the reference data set, although some cases were sometimes incorrectly labelled as belonging to these classes.
The accuracy with which each volunteer classified the set of satellite sensor images is highlighted in
Table 1. The accuracy of the classifications from each and every volunteer was less than that obtained by combining their contributions with a simple majority vote approach. The most accurate individual, for example, provided a set of labels with an overall accuracy of 73.91% while the ensemble classification obtained via the use of the majority vote procedure applied to the volunteered data had an accuracy of 76.58%. This result confirms the oft-stated view that the crowd can be more accurate than the individuals in it.
Although the simple majority voting approach provided a basic ensemble approach to classification that was more accurate than its component parts, the testing of the three other scenarios sought to explore the possibility to raise the accuracy of the crowdsourced labelling further by weighting the contributions from the volunteers, notably by their skill or accuracy inferred from the latent class analysis.
The estimates of producer’s accuracy obtained from the latent class analysis for each volunteer with regard to each class (
Table 1) highlight that volunteers vary greatly in their skill and ability to label the imagery. In addition to the variation between volunteers there was variation in the accuracy of classes within the set of data contributed by the volunteers. For example, it was evident that an individual could be very highly accurate with regard to one class but inaccurate with another. For example, Volunteer A had estimated accuracy values of 100% and 54.87% for the tree cover and mosaic classes. In relation to the latter, note also that Volunteer D’s estimated accuracy values were almost the direct opposite with 62.60% and 97.75% for the tree cover and mosaic classes, respectively. In addition, it was evident that a volunteer with generally low accuracy could still be highly accurate on a specific class. This was evident for Volunteer G who was only highly accurate on one class: cultivated and managed, which also was a relatively abundant class.
In Scenario 2, the vote for a class by a volunteer was removed if that volunteer was highly inaccurate in the labelling of that specific class in comparison to the other volunteers. The effect of removing the votes for a class from a volunteer deemed to be unskilled for the labelling of that class increased the accuracy of the overall ensemble approach using the majority voting procedure to 78.26%.
An alternative approach to using the estimated information on volunteer labelling accuracy is to remove all contributions from volunteers adjudged to provide labels of low or insufficient accuracy. This was explored in Scenario 3. It was evident in Scenario 3a that by dropping the entire set of contributions of the least accurate volunteer (Volunteer G, with a mean producer’s accuracy of 36.12%) the accuracy of the ensemble classification could increase to 77.92%. Moreover, the largest ensemble accuracy observed in Scenario 3, 79.59%, was obtained in Scenario 3b when the contributions from the two least accurate volunteers (Volunteers F and G) were ignored. It was also evident that the accuracy of the contributions by these two volunteers were noticeably less accurate than from the other volunteers (
Table 1).
In addition to information on the accuracy with which each volunteer can classify the classes, the latent class model also indicates the prevalence or abundance of the classes. This information on class abundance inferred from the analysis was used to adjust the estimates of overall volunteer accuracy, here expressed as the average producer’s accuracy. The weighted overall accuracy values (
Table 1) revealed that one volunteer (Volunteer C) was noticeably more accurate and one noticeably less accurate (Volunteer F) than the remaining set; note that after weighting for class abundance Volunteer F rather than G is associated with the lowest labelling accuracy. Increasing the weight of the accurate volunteer by duplicating their contributions (i.e., giving each vote a weight of two) increased accuracy. For example, increasing the vote for the most accurate volunteer in Scenario 4a raised the accuracy of the ensemble from the benchmark value of 76.58% to 78.59%. Furthermore, ignoring the labels from the least accurate volunteer in addition further increased accuracy to 79.59% in Scenario 4b. However, it was also apparent that a more accurate ensemble could be achieved in Scenario 4c by solely removing the contributions of the least accurate volunteer, which yielded an ensemble classification with an accuracy of 80.60%. It should be noted that at the 95% level of confidence, this latter ensemble classification was also significantly more accurate than that achieved by increasing the weighting for the most accurate volunteer (
z = 4.31) and by additionally ignoring the least accurate volunteer’s data (
z = 3.90). The ensemble classification arising through the removal of the contributions from the least accurate volunteer (Scenario 4c) was also the most accurate of all classifications reported in the study and significantly different at the 95% level of confidence to the benchmark classification based on the standard majority voting rule (
z = 5.54).
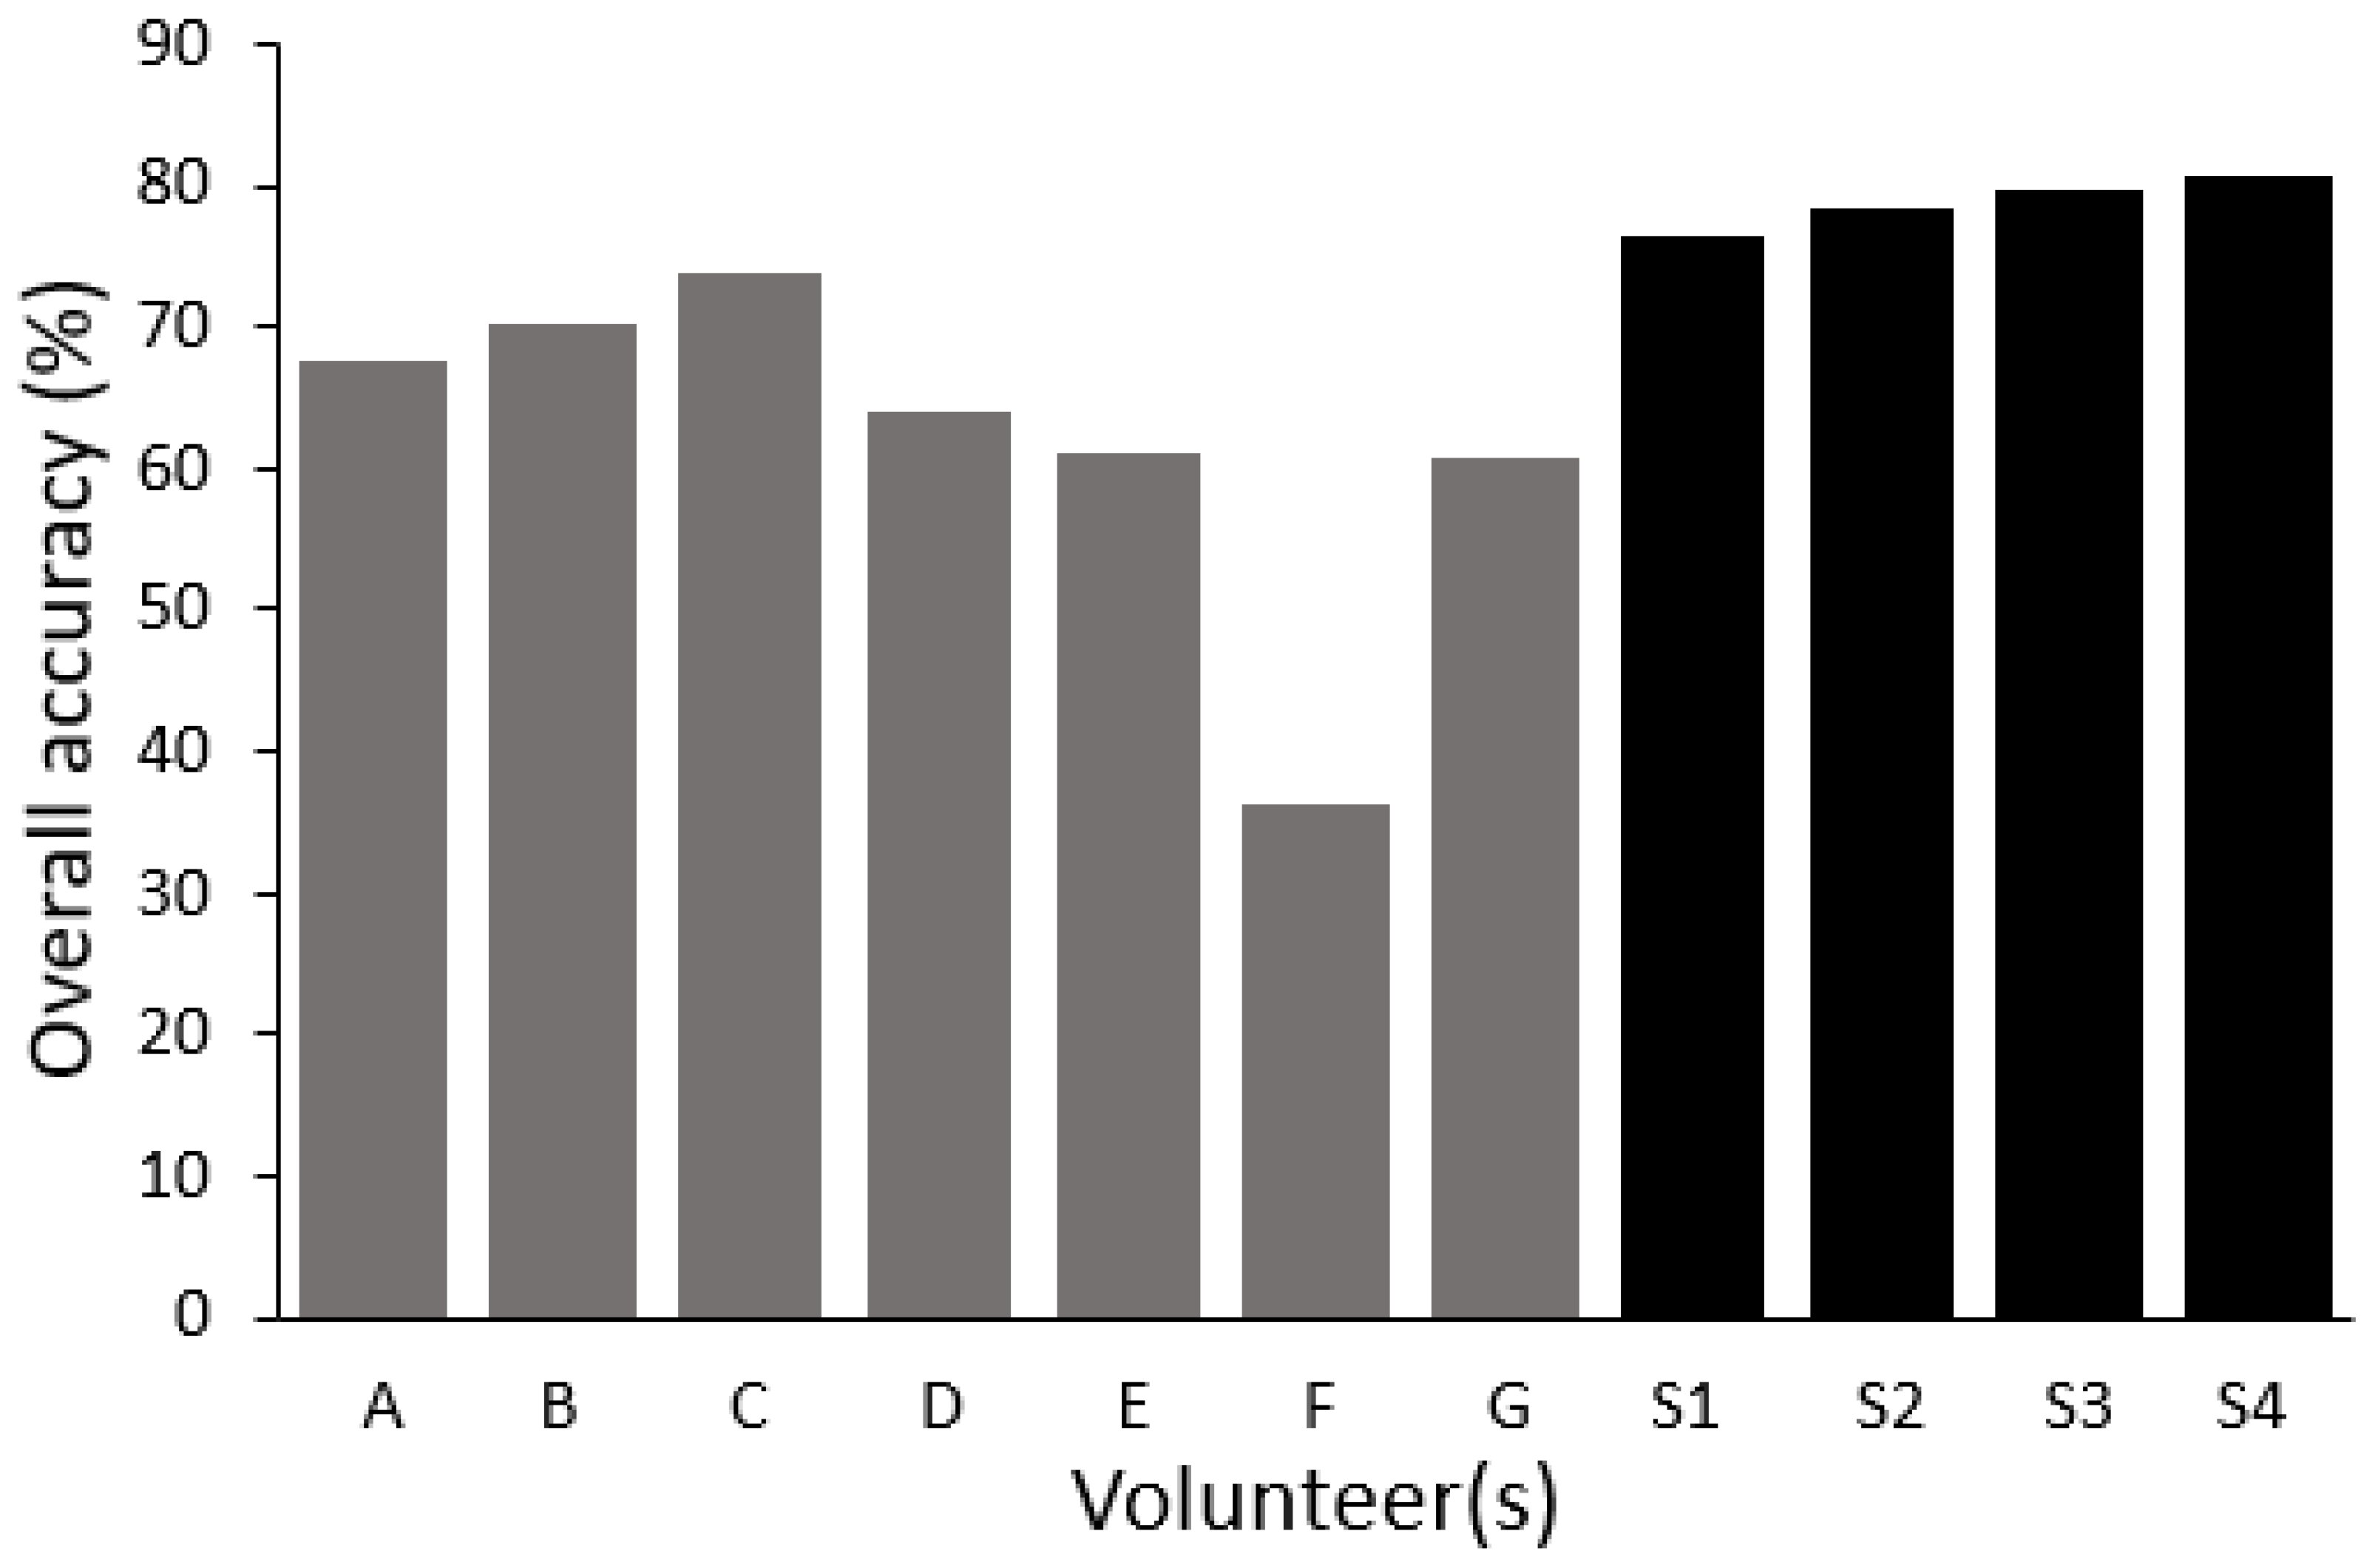
The ability to increase the accuracy of the crowdsourced labelling by weighting the voting process is highlighted in
Figure 2 which shows the overall accuracy of classifications relative to the reference data for individuals and from each of the four scenarios for ensemble classification discussed. Additional summary data for each of the classifications arising from the scenarios reported is provided in
Table 2 and the full confusion matrix provided for the classifications arising from the basic ensemble (
Table 3) and Scenario 4c (
Table 4).
Figure 2 highlights that each ensemble approach yielded a classification that was more accurate than that arising from the individual contributors alone. It also highlights that the relative accuracy of the classifications weighted by class abundance obtained from the individuals inferred from the latent class analysis (
Table 1) corresponds with the actual accuracy assessed relative to the reference data (
Figure 2). In particular, the relatively low accuracy of the labelling provided by Volunteer F is evident and it is the removal of these data in Scenario 4c that resulted in the largest, and statistically significant, increase in accuracy over the benchmark classification of Scenario 1. From earlier research [
25], the accuracy with which the data contributed by each of the volunteers may be characterised could increase if the number of volunteers also increased, paving the way for further refinement of the analysis.
The results, especially from Scenario 4c, show that, for the data set used, the removal of inaccurate data is of more value than the enhancement or amplification of more accurate data sources. It should be noted that this latter issue may reflect the composition of the volunteers used in this study. Given that all seven volunteers had contributed labels for virtually all of the images, it may be that these people have a high level of motivation which could be used as a proxy variable to indicate high skill sets so it was the removal of the occasional anomalously poor inputs that was important rather than efforts to amplify good quality contributions. Had the set of volunteers been of more mixed ability, notably if made up of a large number of true amateurs, then less expertise might be present and different trends may have been observed. Similarly, it should be noted that the results may, of course, be specific to the data set used and the information inferred could be used in other ways (e.g., to inform labelling in tie-break situations by allocating to the class indicated by the relatively more accurate labellers).
Finally, it should be stressed that the information on volunteer skill and class abundance to weight the voting procedure were all inferred from the contributed data alone. In many applications there may be little or no reference data available to allow a standard assessment of the accuracy of labelling and comparison of classifications such as that provided by
Figure 2. Critically, however, all of the information contained in
Table 1 was obtained from the set of contributed crowdsourced labels only; this includes the information on class size which was obtained from the latent class model. Thus, the information on per-class and overall classification accuracy needed to enhance the voting method is inferred entirely from just the contributed data; the reference data were only used in this study to provide supporting evidence that the approaches discussed actually did impact on accuracy. The quality of the crowd-sourced estimates may also increase if data from additional volunteers are available [
25]. As well as providing an intrinsic approach to the assessment of contributed data quality, the approach has additional advantages. Since only the contributed data are required, there is, therefore, no need to use a proportion of the crowdsourced data to measure the variables directly, perhaps via some dedicated ground based research or use of additional experts. There is also no use of external auxiliary information. Further enhancements could be made by expressing skill in different ways; the measure of accuracy used may not always be ideal and other approaches could be used to focus more directly on the objectives of a specific study (e.g., weighting by unequal costs of errors). Critically, however, this article has gone beyond earlier work to show that the quality of contributed data can be estimated from the data alone to demonstrate how crowdsourced labelling can be enhanced via simple weighted voting methods without any additional data.

 ,
, 


