Using Spatial Semantics and Interactions to Identify Urban Functional Regions

1
State Key Laboratory of Information Engineering in Surveying, Mapping and Remote Sensing, Wuhan University, 129 Luoyu Road, Wuhan 430079, China
2
Collaborative Innovation Center of Geospatial Technology, 129 Luoyu Road, Wuhan 430079, China
*
Author to whom correspondence should be addressed.
ISPRS Int. J. Geo-Inf. 2018, 7(4), 130; https://0-doi-org.brum.beds.ac.uk/10.3390/ijgi7040130
Submission received: 9 February 2018
/
Revised: 14 March 2018
/
Accepted: 22 March 2018
/
Published: 23 March 2018
(This article belongs to the Special Issue Place-Based Research in GIScience and Geoinformatics)
Abstract
:The spatial structures of cities have changed dramatically with rapid socio-economic development in ways that are not well understood. To support urban structural analysis and rational planning, we propose a framework to identify urban functional regions and quantitatively explore the intensity of the interactions between them, thus increasing the understanding of urban structures. A method for the identification of functional regions via spatial semantics is proposed, which involves two steps: (1) the study area is classified into three types of functional regions using taxi origin/destination (O/D) flows; and (2) the spatial semantics for the three types of functional regions are demonstrated based on point-of-interest (POI) categories. To validate the existence of urban functional regions, we explored the intensity of interactions quantitatively between them. A case study using POI data and taxi trajectory data from Beijing validates the proposed framework. The results show that the proposed framework can be used to identify urban functional regions and promotes an enhanced understanding of urban structures.
1. Introduction
Urban functional regions are closely related to the travel patterns of urban residents [1]. In China, urbanization is occurring at an unprecedented rate, which is similar to the majority of the developing world. Internal urban spaces are gradually forming functional regions, such as commercial districts, residential districts and industrial districts. Furthermore, identifying functional regions and understanding their spatial interactions are fundamental for formulating scientific urban planning and governmental management [2,3,4]. In urban studies, spatial interaction can be represented by the connections between two functional regions and can be quantified using flows of goods, people or capital. In general, accurate identification of the spatial distribution of functional regions is a prerequisite for the analysis of interactions between functional regions. The traditional way of identifying functional regions relies on urban land use maps or resident trip information collected through travel surveys [1,5]. As a result, accuracy is limited by subjective factors [6]. For example, Kwan [7] implemented a space-time prism concept in GIS to measure individual accessibility using household travel survey data. Although these traditional travel survey data have contributed significantly to classical urban structure studies, they are labor-intensive, time consuming and error-prone, thus limiting the usefulness of related studies [8].
With the rapid development of location-aware devices, voluminous human mobility data, such as taxi GPS trajectory data, are becoming readily available. Taxi trajectory data have been used to understand urban structures and human movements, contributing to the body of research on the social functions of urban regions [9,10,11,12]. In terms of the identification of functional regions, Qi et al. [11] established a relationship between taxi GPS data and the social function of regions after a qualitative analysis. In recent years, spatial interaction patterns between functional regions have been examined and analyzed. The quantity of taxi flows can be used to represent the interaction intensities between functional regions [13]. Taking O/D flows (Origin/Destination pairs) into consideration, recent work has incorporated both spatial structures and spatial interactions. A notable work was conducted by Liu [4], which incorporated spatial interaction patterns into land use using an unsupervised method and improved the land use classification. However, although taxi trajectory studies have made great improvements over traditional methods for the identification of urban functional regions [14], the lack of spatial semantics for the identification of functional regions and quantitative analysis of their interactions has created a bottleneck for improvements in the accuracy of identifying functional regions.
In this paper, we present a framework to identify urban functional regions by incorporating spatial semantics and interactions. The main contributions of this study include two aspects. First, a method for the identification of functional regions is proposed, in which taxi O/D flows and POI data are integrated and used for inferences related to spatial semantics. Second, the interaction intensities between functional regions are explored quantitatively to reveal the underlying associations between human activity and urban structure. The results show that the proposed framework can be used to identify urban functional regions and promotes an enhanced understanding of urban structures.
The remainder of this paper is organized as follows. Section 2 reviews related work. Section 3 introduces the method for identifying functional regions. Section 4 presents a case study to explore the spatial distribution and interactions of functional regions. In Section 5, the paper concludes with a brief summary and a discussion of limitations.
2. Related Work
In recent studies, urban structures have been examined using spatial interactions, which refer to the link between two functional regions and can be quantified based on taxi O/D flows. Taxi O/D flows contain geographical and temporal components and encode information about urban movements. Thus, a trip is associated with O/D locations and times. Taxi O/D flows between functional regions, such as business districts and residential areas, have been used to measure the interaction intensities between functional regions within a city [4]. Due to the complexity of spatial interactions, studies have been conducted on effectively visualizing spatial interactions between functional regions and illustrating meaningful sub-regions [15,16]. Zhong et al. [17] explored network science methods to identify the spatial structure of city hubs, centers and borders, which were key elements in understanding the interactions between urban functional regions. In other studies, community detection methods [18], such as non-negative matrix factorization (NMF), were widely adopted to describe urban functional regions according to interaction intensities. NMF has been extensively used in data mining to extract constructive representations over a set of extracted travel components from the non-negative matrix [19,20]. For example, Mahrsi et al. [21] proposed an approach that used NMF to aggregate individual trip chains into weekly passenger profiles, each containing the number of trips a given passenger made over 1-h periods for each day of the week. By employing NMF and optimization methods, Peng et al. [12] found that travel flows can be approximated by a linear combination of three travel patterns. However, to the best of our knowledge, the quantitative analysis of spatial interactions between functional regions have been rarely explored by the aforementioned studies.
In the era of Web 2.0, increasing amounts of data on point-of-interest (POI) are becoming available online. The different types of POI can be located in urban functional regions to support human activities. POI data provide information about urban functional zones, which is based on human cognition with spatial, temporal and semantic granularity [22,23,24,25]. POI data often describe the physical location and attribute information of places, such as residential buildings, leisure parks, commercial points and public services. For instance, Long and Shen [26] established the Discovering Zones of different Functions (DZoF) model based on smart card data (SCD) and used POIs to identify different functional zones and understand their spatial structures. Researchers were also interested in discovering the spatial semantic characteristics of POI categories for identification of functional regions. Yuan et al. [2] implemented a topic-based model with large functional blocks to reveal urban functional regions in Beijing based on taxi trajectory and POI data. Hobel et al. [27] implemented a semantic region growing algorithm based on the density of POIs to extract places, such as well-known shopping areas. In their model, the shopping areas were identified and compared for similarity using four features, including the number of restaurants, shops, banks and ATMs as well as tourist facilities. In another study, McKenzie et al. [28] constructed thematic signatures for POI data through a topic model, which revealed that these types of places vary regionally. Their findings showed that the resolution of the thematic topics had an influence on the differentiation of place types. However, only a few studies have investigated POI data as the judgment of urban functional regions with consideration of spatial interaction.
In summary, POI data and taxi trajectory data can be applied in evaluating and analyzing urban functional regions from the perspective of urban planning. The spatial distribution and geographic knowledge of POI categories can be employed as spatial semantics to annotate functional regions [24,29]. However, few studies have simultaneously considered both spatial semantics and spatial interactions to identify urban functional regions. Moreover, spatial interactions should be processed quantitatively to improve the identification of urban functional regions. In this study, we present a framework to identify urban functional regions by incorporating spatial semantics and interactions.
3. Methodology
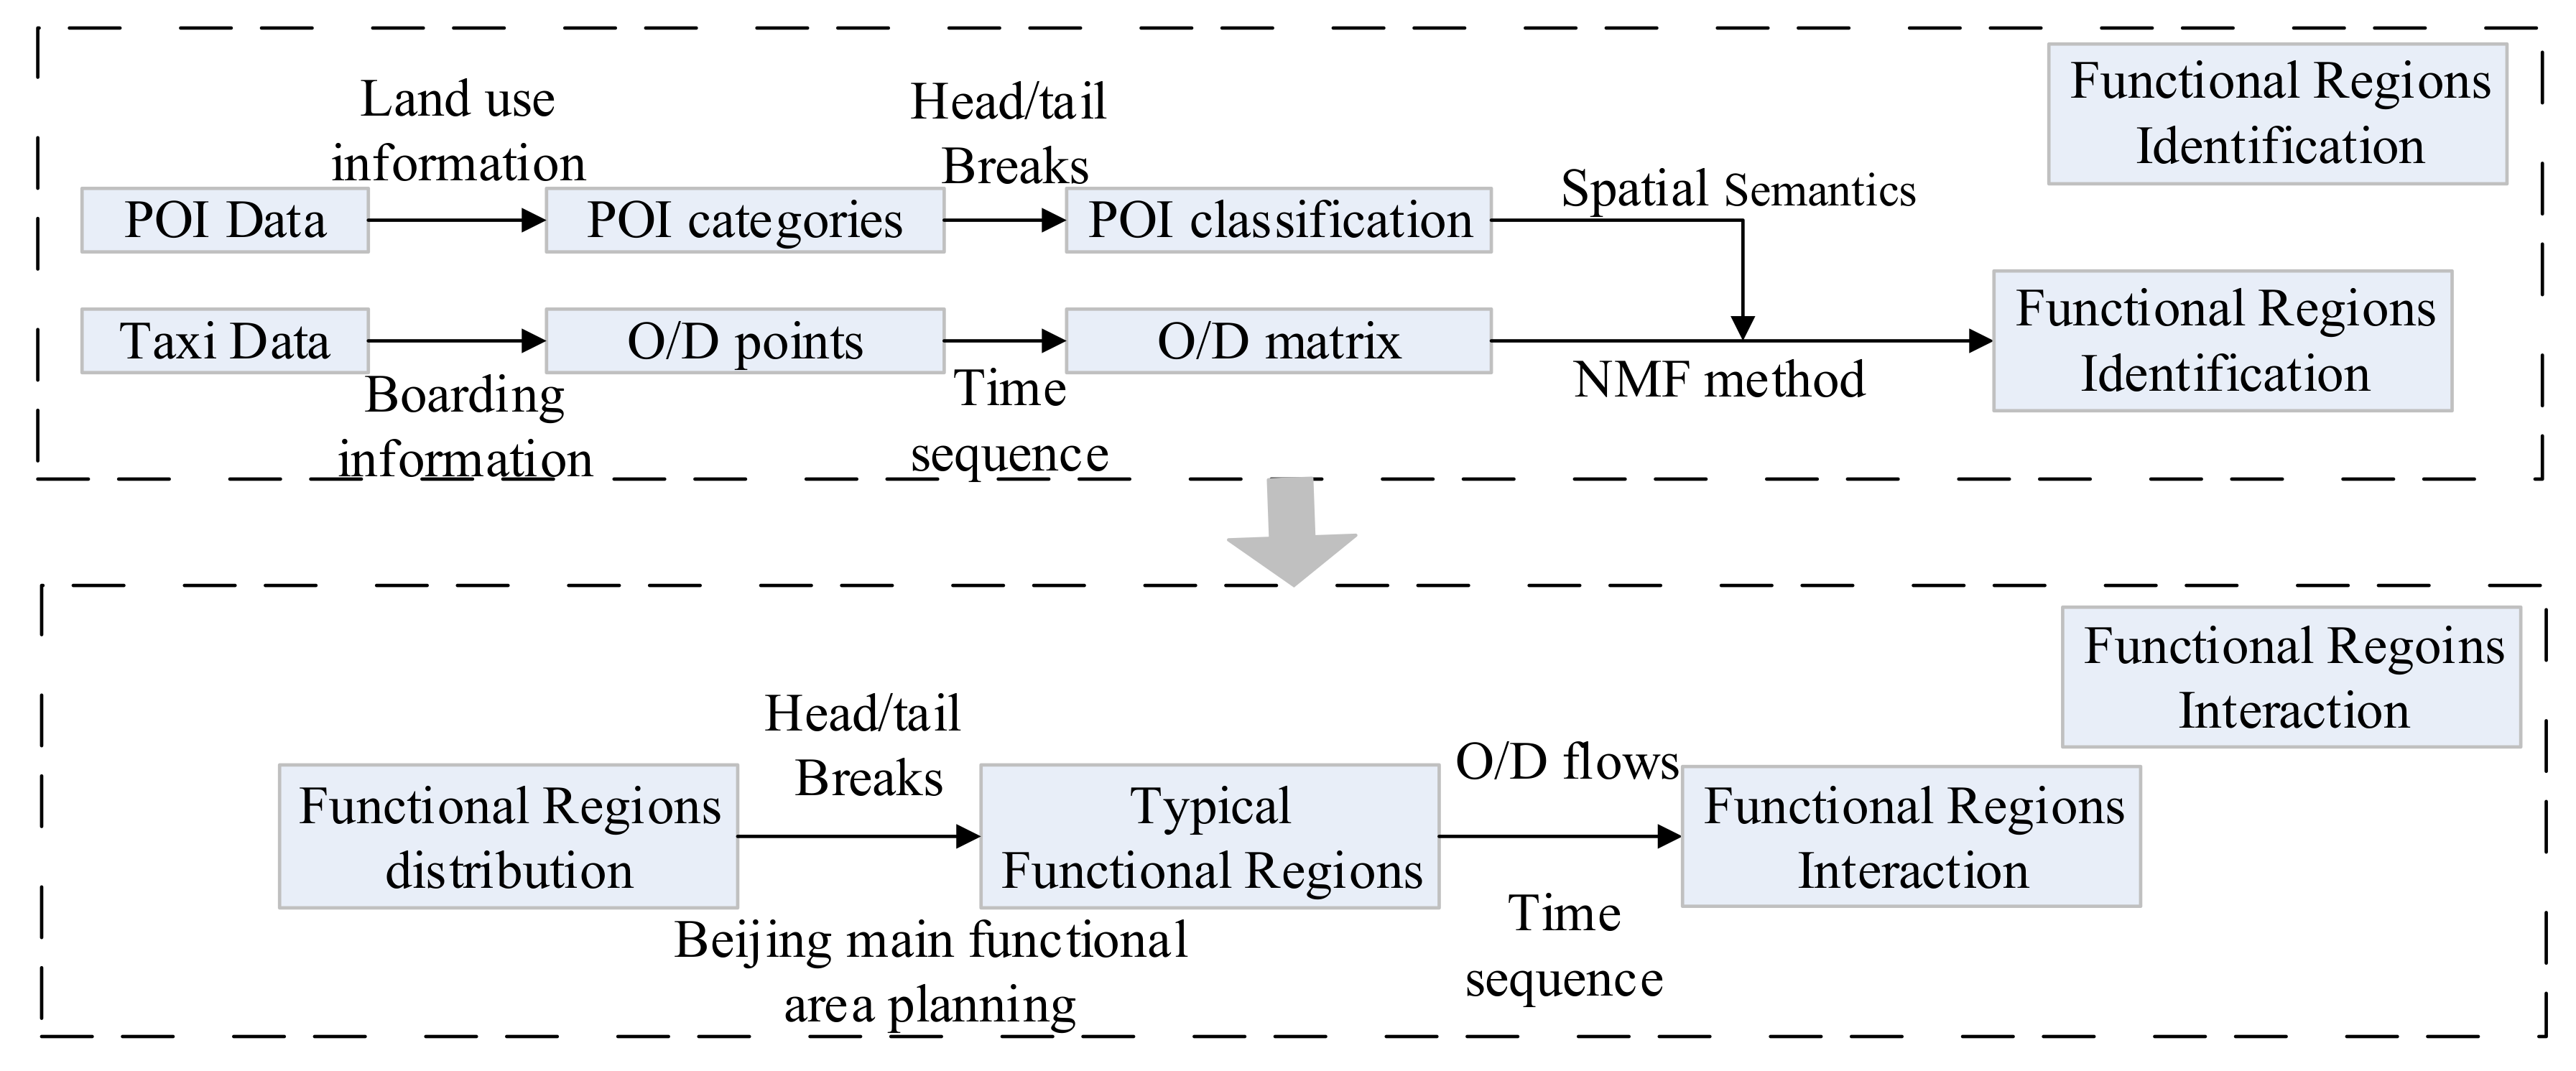
The flowchart of the proposed framework is illustrated in Figure 1. The purpose of our study is to use spatial semantics and interactions to identify functional regions based on POI data and taxi trajectory data. In this study, we apply two steps to identify urban functional areas. First, a method for the identification of functional regions via spatial semantics is proposed based on POI data and taxi trajectory data. Second, to further reveal the urban functional regions from the perspective of connections, we quantitatively explore the interaction intensity between functional regions using spatiotemporal analysis.
3.1. Identification of Functional Regions
As shown in Figure 1, the functional regions identification method proceeded in two stages: (1) the grids of the study area were classified to three types based on taxi O/D flows; and (2) the urban functional regions, which consist of the grids, were identified by annotating their semantic functions using POI categories.
3.1.1. Inferring Types of Urban Functions
In general, people take taxis from the same location at different times with possibly different purposes. We calculated the travel O/D flows based on passenger boarding information directly from the taxi trajectory data. By constructing the O/D matrix, the grids of the study area were classified to three types using NMF to indicate urban functional regions correlated with O/D flows.
Traditionally, 500 m or a walking time of less than 6 min is used in the travel activity of people [30]. As a result, a 1 × 1 km2 grid is adopted as the basic functional region unit. We selected a M × M km2 region as the study area, with the area then discretized into M2 1 × 1 km2 grids. Travel flows are extracted from the massive taxi trajectory data, with each trip simplified as a vector:
where x and y denote the location coordinates; to is the time of a pick-up event; and td is the time of a drop-off event. Each trip is represented by an O/D flow. The total of N of O/D flows extracted from the raw data is as follows:
where So is the origin point set and Sd is the destination point set, with one-to-one correspondence between So and Sd. These O/D flows provide information about mobility and urban dynamics, which forms a representative sample of intra-urban movement.
Subsequently, we defined (i, j) to index all the grids in the ith row and jth column, where i = 1, …, M and j = 1, …, M. For the grid (i, j), the numbers of O/D points for every one-hour interval of a day can be represented by a 1 × 24 vector Vij. We can define a set of 1 × 24 vectors containing a normalized number of O/D points along time as H1, H2, H3, …, Hk, which represents one type of urban function. For example, vector V11 represents the O/D points in grid (1, 1) and we obtain the following:
where W11 is a row vector containing K coefficients for the linear combination. Taking all of the grids into account, the patterns can be written as:
Since the elements of V represent the number of O/D points, all the entries of W and H must be non-negative. When K is determined, the NMF will identify the statistically significant regularities in the data [12]. Based on the taxi O/D matrix, we can ascertain K types of urban functions for all the grids, which indicates the urban functional regions that are correlated with the taxi O/D flows.
3.1.2. Spatial Semantics of Functional Regions
Previous researches indicated that POI data can be effectively applied to illustrate functional regions [28]. We allocated the POI points of each category into grids, before aggregating the number of POI points for the spatial semantics of functional regions.
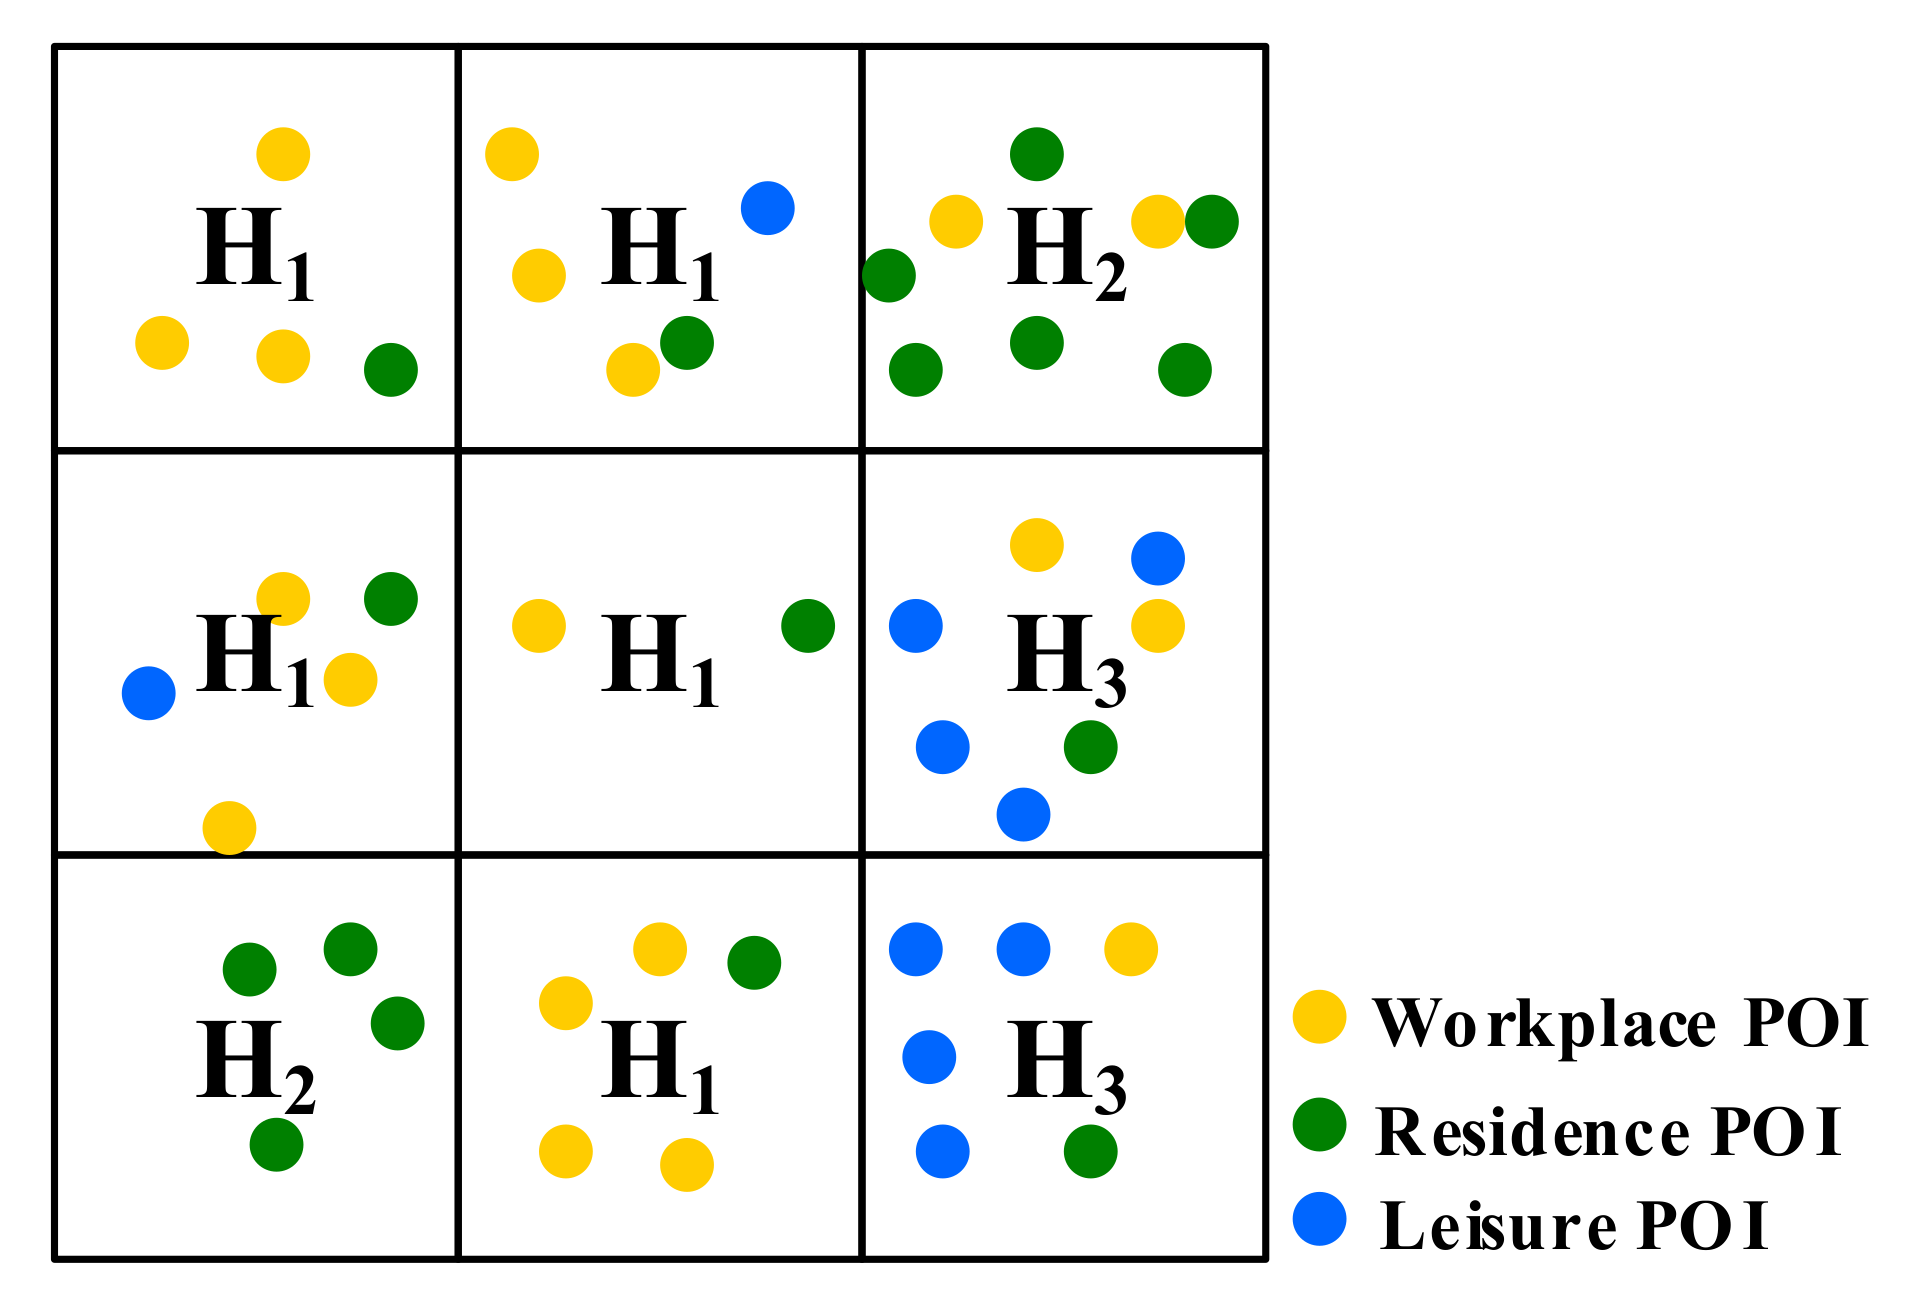
Assuming that all of the POI categories are known and given by C1, C2, C3, …, CN, we can calculate the point density of each category of POI for all M2 grids. For example, in Figure 2, H1, H2 and H3 represent the three types of functional regions in the study area, while CW, CR, and CL represent three POI categories: 19 Workspace POI, 17 Residence POI and 10 Leisure POI. Each grid is designated as a type of urban function, which results in five grids in H1, two grids in H2 and two grids in H3. After this, we calculated the point density of the POI categories of CW, CR and CL for the H1, H2 and H3.
Taking POI CW as an example, the point densities of POI CW for the H1, H2 and H3 are 2.8 (14 points/5 km2), 1.0 (2 points/2 km2) and 1.5 (3 points/2 km2), respectively. This result indicates that POI CW dominates H1. Thus, the spatial semantic for H1 is the workspace. In the same way, the spatial semantics for H2 and H3 are residence and leisure, respectively (Table 1).
3.2. Interactions of Functional Regions
The distribution of functional regions within a city is not spatially independent. For instance, a business region is usually located around a large residential region in order to meet people’s daily needs [9]. People usually travel to business regions in the morning from their home. Thus, it is reasonable to claim that the interaction dynamics between functional regions are different, with these interactions able to reveal the urban functional regions from the perspective of connections. Based on the identification of functional regions by spatial semantics, we explored the interaction intensities of functional regions via spatiotemporal analysis using taxi O/D flows. The process involves two steps:
- Temporal distribution of O/D flows in functional regions. After extracting the O/D points from the taxi trajectory data, for each 1 × 1 km2 grid Gij, we introduce inpoint_Gij and outpoint_Gij to represent the total amount of O/D points allocated to the grid Gij during a day:As shown in Equations (6) and (7), inpoint_Gij and outpoint_Gij refer to the volume of O/D points in each grid Gij during a particular time interval t (for example, i = 1 denotes a one-hour interval of a day).
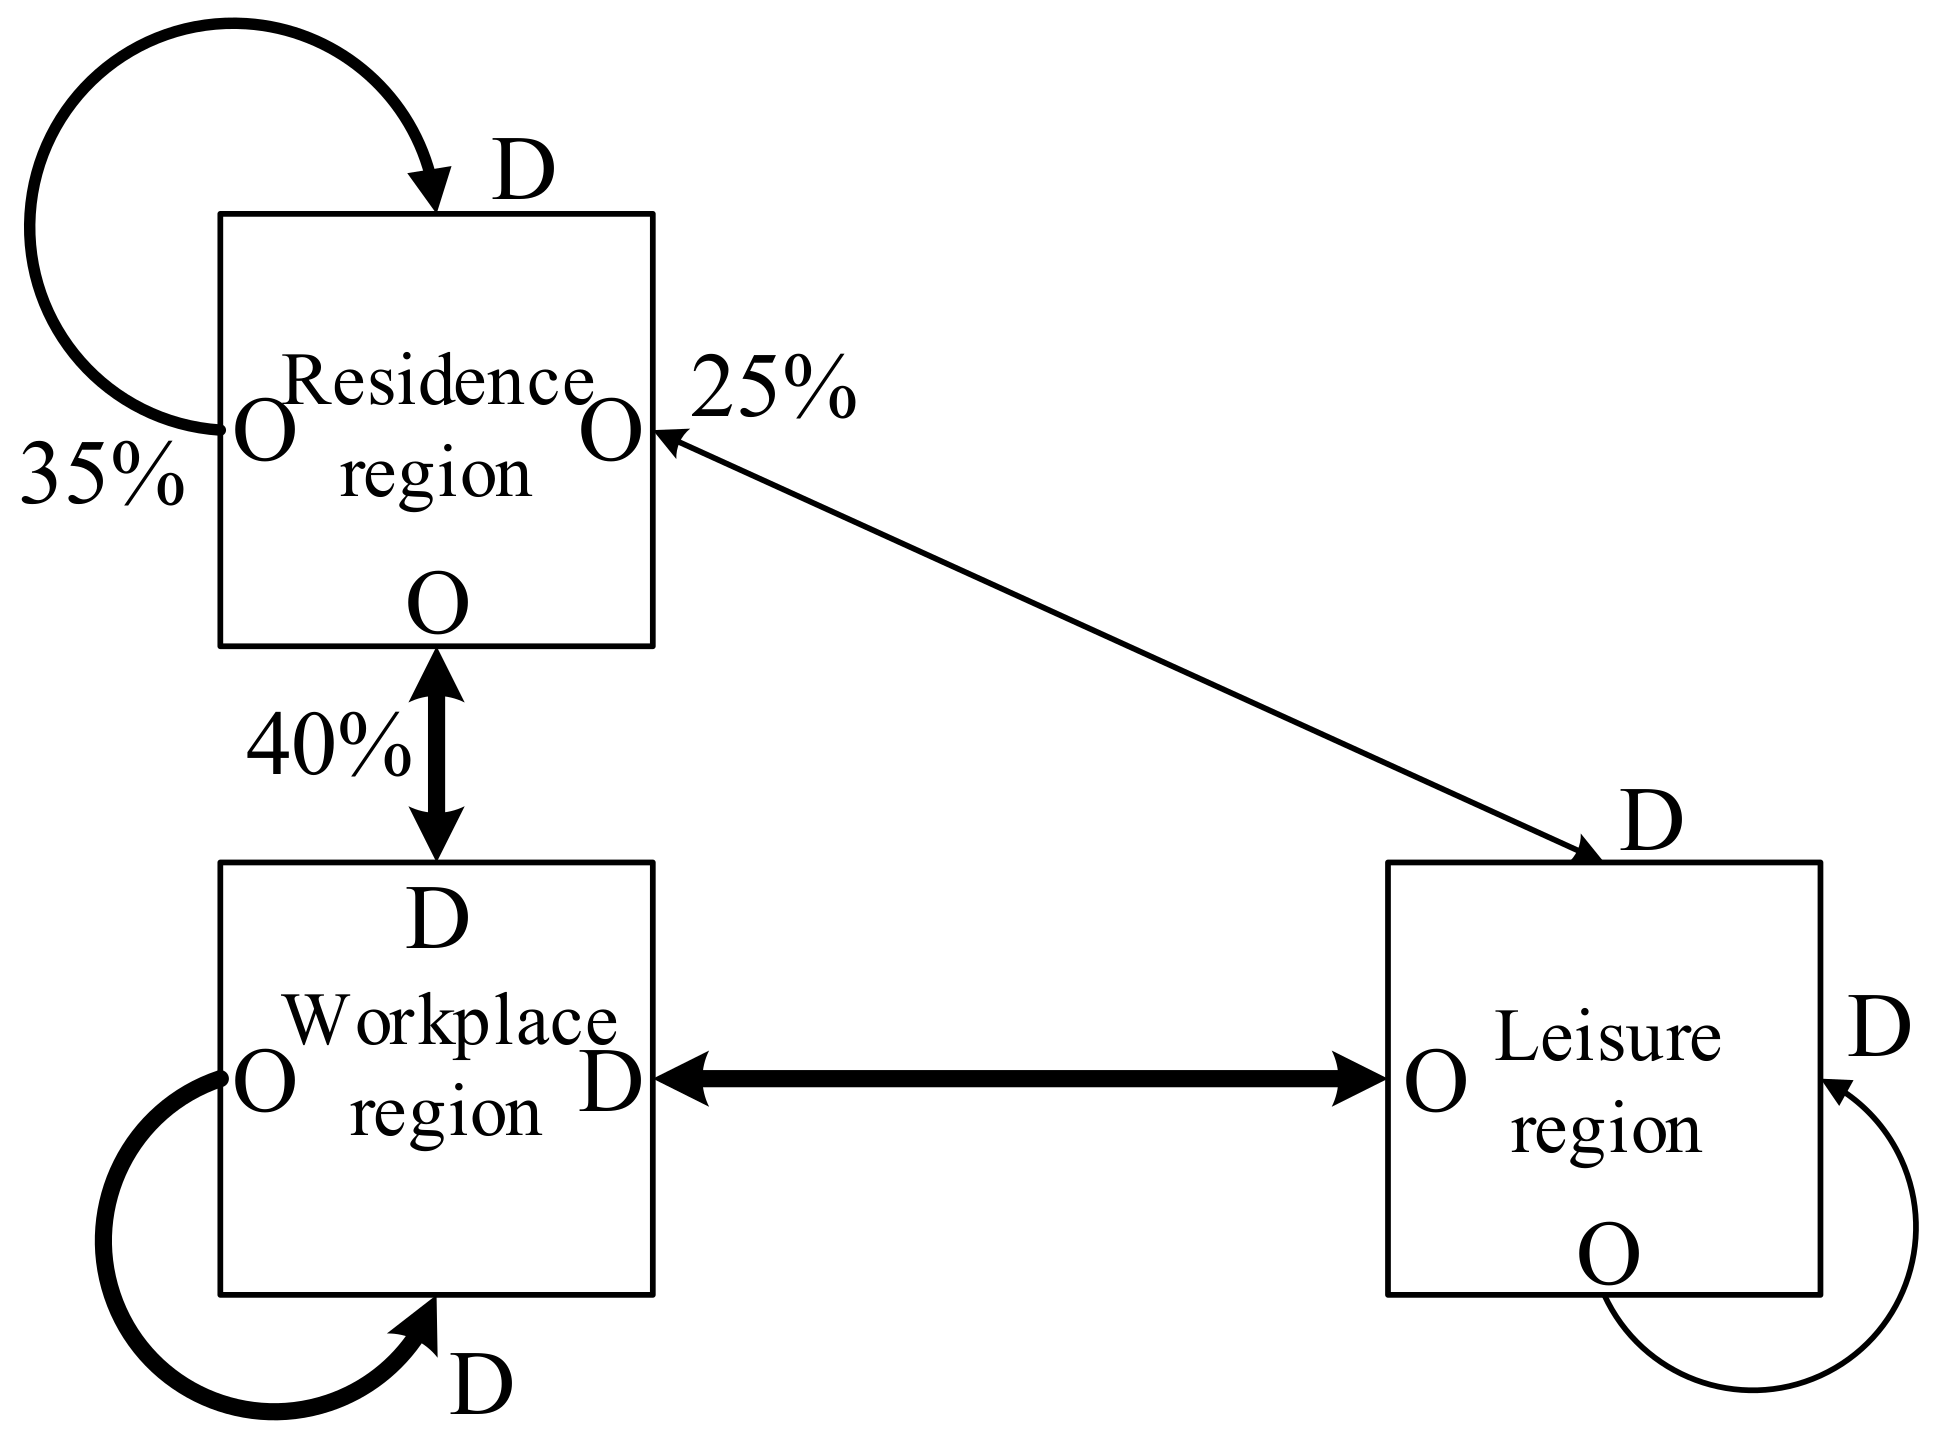
- Quantitative analysis of the interactions between functional regions. Figure 3 shows an illustration of the interactions between functional regions based on taxi O/D flows. The direction of the arrow indicates people’s different destinations. The length of the line indicates the distance between the functional regions, while the line thickness suggests the number of O/D flows between two functional regions.
We assumed that there are three functional regions: a residence region, a workplace region and a leisure region. According to Equations (6) and (7), we can acquire O/D flows of these three regions: inpoint_GR/outpoint_GR, inpoint_Gw/outpoint_Gw and inpoint_GL/outpoint_GL. For example, when people take taxis in the residence region in a particular time period (e.g., t = 12), they have three destinations to choose. In general, closer regions have stronger interactions [31]. As shown in Figure 3, 40% of people’s destinations are the workplace regions. A total of 25% of people travel to the leisure region, while the rest travel within the residence region. As a result, the interaction intensities between functional regions can be represented by taxi O/D flows.
4. Case Study
4.1. Data Description
4.1.1. Overview of Study Area
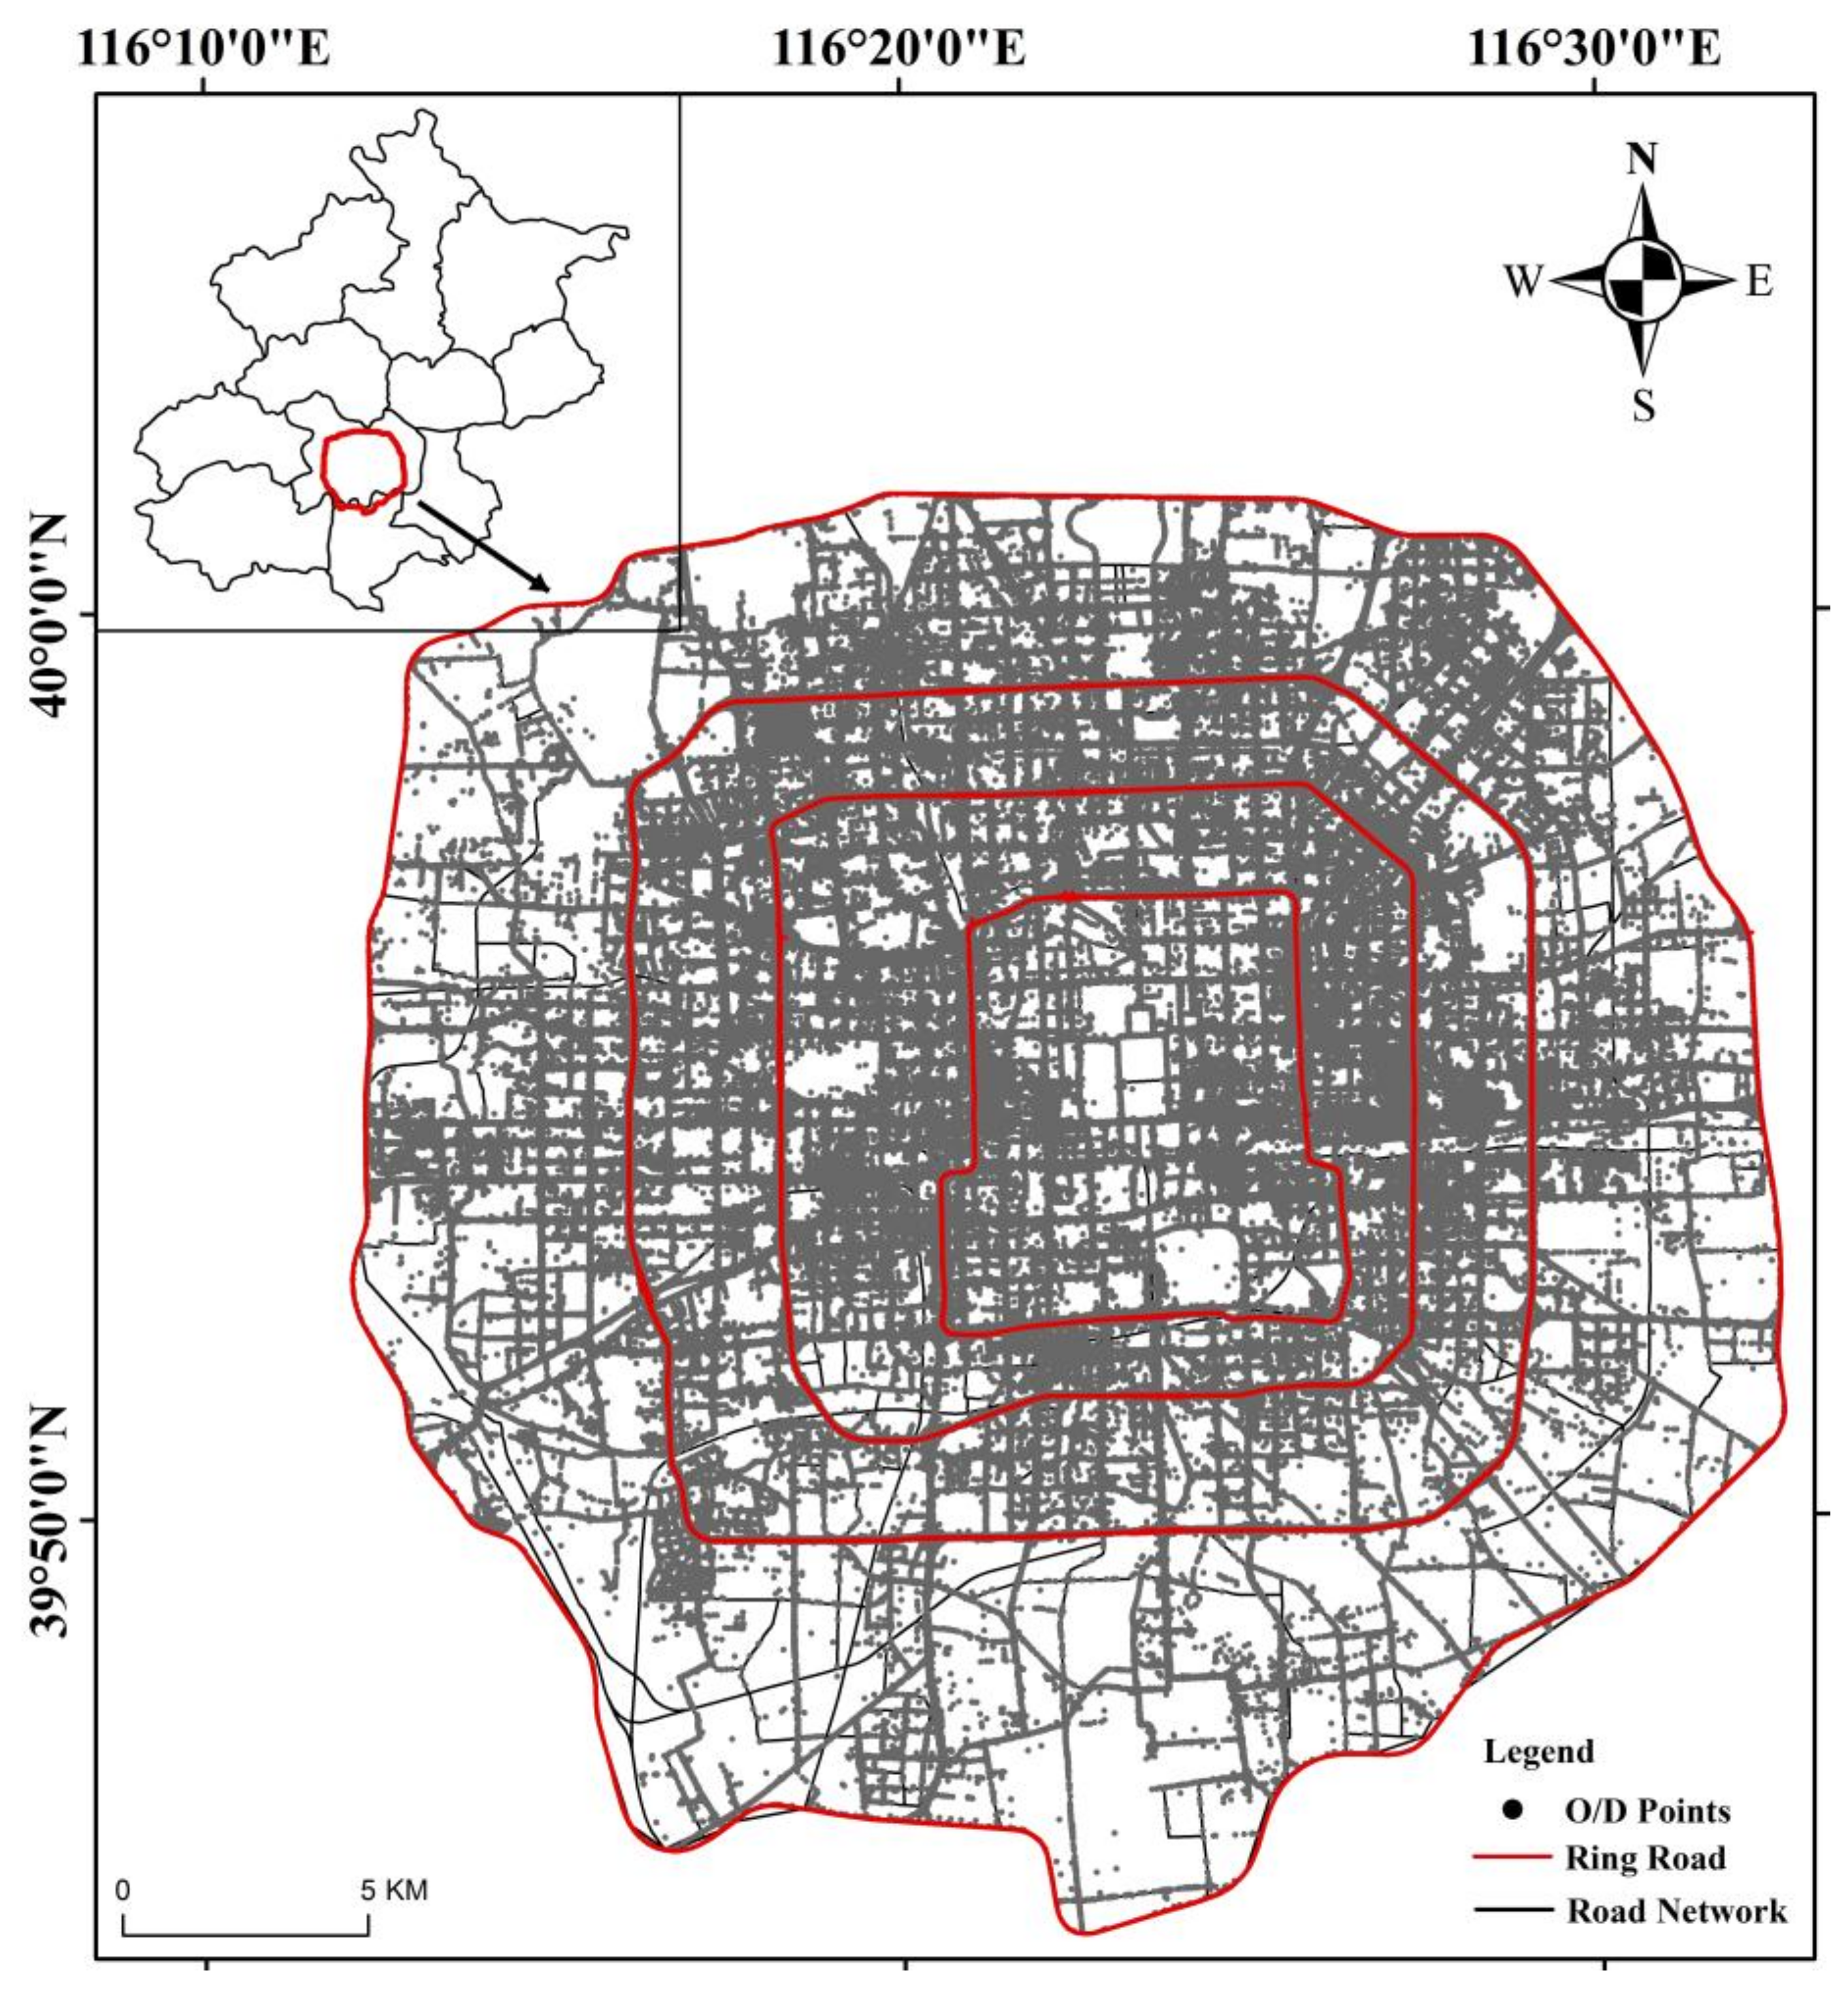
Taking Beijing as an example, we selected a 30 × 30 km2 rectangular region based on the urban region of Beijing inside the 5th Ring Road. The study area was discretized into 725 1 × 1 km2 grids (the other 175 grids, which are located outside the 5th Ring Road, were excluded) as the basic unit.
4.1.2. Taxi Trajectory Data
The taxi trajectory data included the ID, time, longitude, latitude, altitude, direction, speed and other information, including the passenger boarding information. This research used a massive dataset of approximately 4000 taxis tracked for thirty consecutive days (from 1 November to 30 November 2012) in Beijing, China. The raw taxi trajectory data recorded each taxi’s information at approximately every 10 s with a positional accuracy of about ±10 m. We cleaned all of the trajectory data by removing invalid points, which were due to data recording or transfer errors.
The passenger boarding information from the raw taxi trajectory data was coded as 0 and 1 that represented empty and occupied, respectively. We identified the locations where passengers were picked up (origin) and dropped off (destination) by state transitions from 0 to 1 and from 1 to 0, forming a completed trip. Figure 4 demonstrated the spatial distribution of pick-up and drop-off points for all taxis over thirty days in the study area, where the trips by taxis were concentrated in the urban region inside the 4th Ring Road of Beijing.
4.1.3. POI Data
The POI data used in this paper were obtained from the Gaode Map (http://www.gaode.com) from 2012, which is one of the most popular online map service providers in China. Using coordinate correction and address matching, we collected a total of 1,065,421 POIs in Beijing, with 641,984 POIs falling within the study area. The POI data included the coordinates, address, tag, category and administrative region.
The raw POI classifications included nineteen categories, which were confused and redundant. According to the “Code for Urban Land Use Classes and Standards of Planning Construction Land” [32], we reduced the raw POI data into six categories: residence; administrative and public services; commercial facilities; industrial locations; roads and transportation; and green space and squares. These new POI data categories were summarized in Table 2.
4.2. Identification Of Functional Regions
In this section, we applied the functional regions identification method to obtain the spatial distribution of urban functional regions using spatial semantics based on taxi trajectory data and POI data. According to the “Beijing main functional area planning” (See http://zhengwu.beijing.gov.cn/ghxx/qtgh/t1240927.htm), the main urban functions of the study area included the following: residential areas, science and education areas, commercial areas, financial areas, etc.
Taxi O/D flows interact with urban functional regions, which can reflect the urban structures [33]. For example, Gong et al. [9] revealed that taxi trip purposes are closely associated with various urban functional regions: business and commercial areas, residential areas and transportation. According to our methodology, the taxi O/D flows can be expressed as K travel patterns in terms of the time series based on the NMF method. Therefore, the final step is to determine K, which is the number of the urban functions. According to Lee’s algorithm [34], NMF begins with random initial conditions. In our experiments, we found that when K = 2, the study area cannot be divided into functional regions. When K > 3, the parts of divisions were too fragmented. When K = 3, the results were more stable and the divisions of regions were approximately consistent with the actual distribution of urban functional regions.
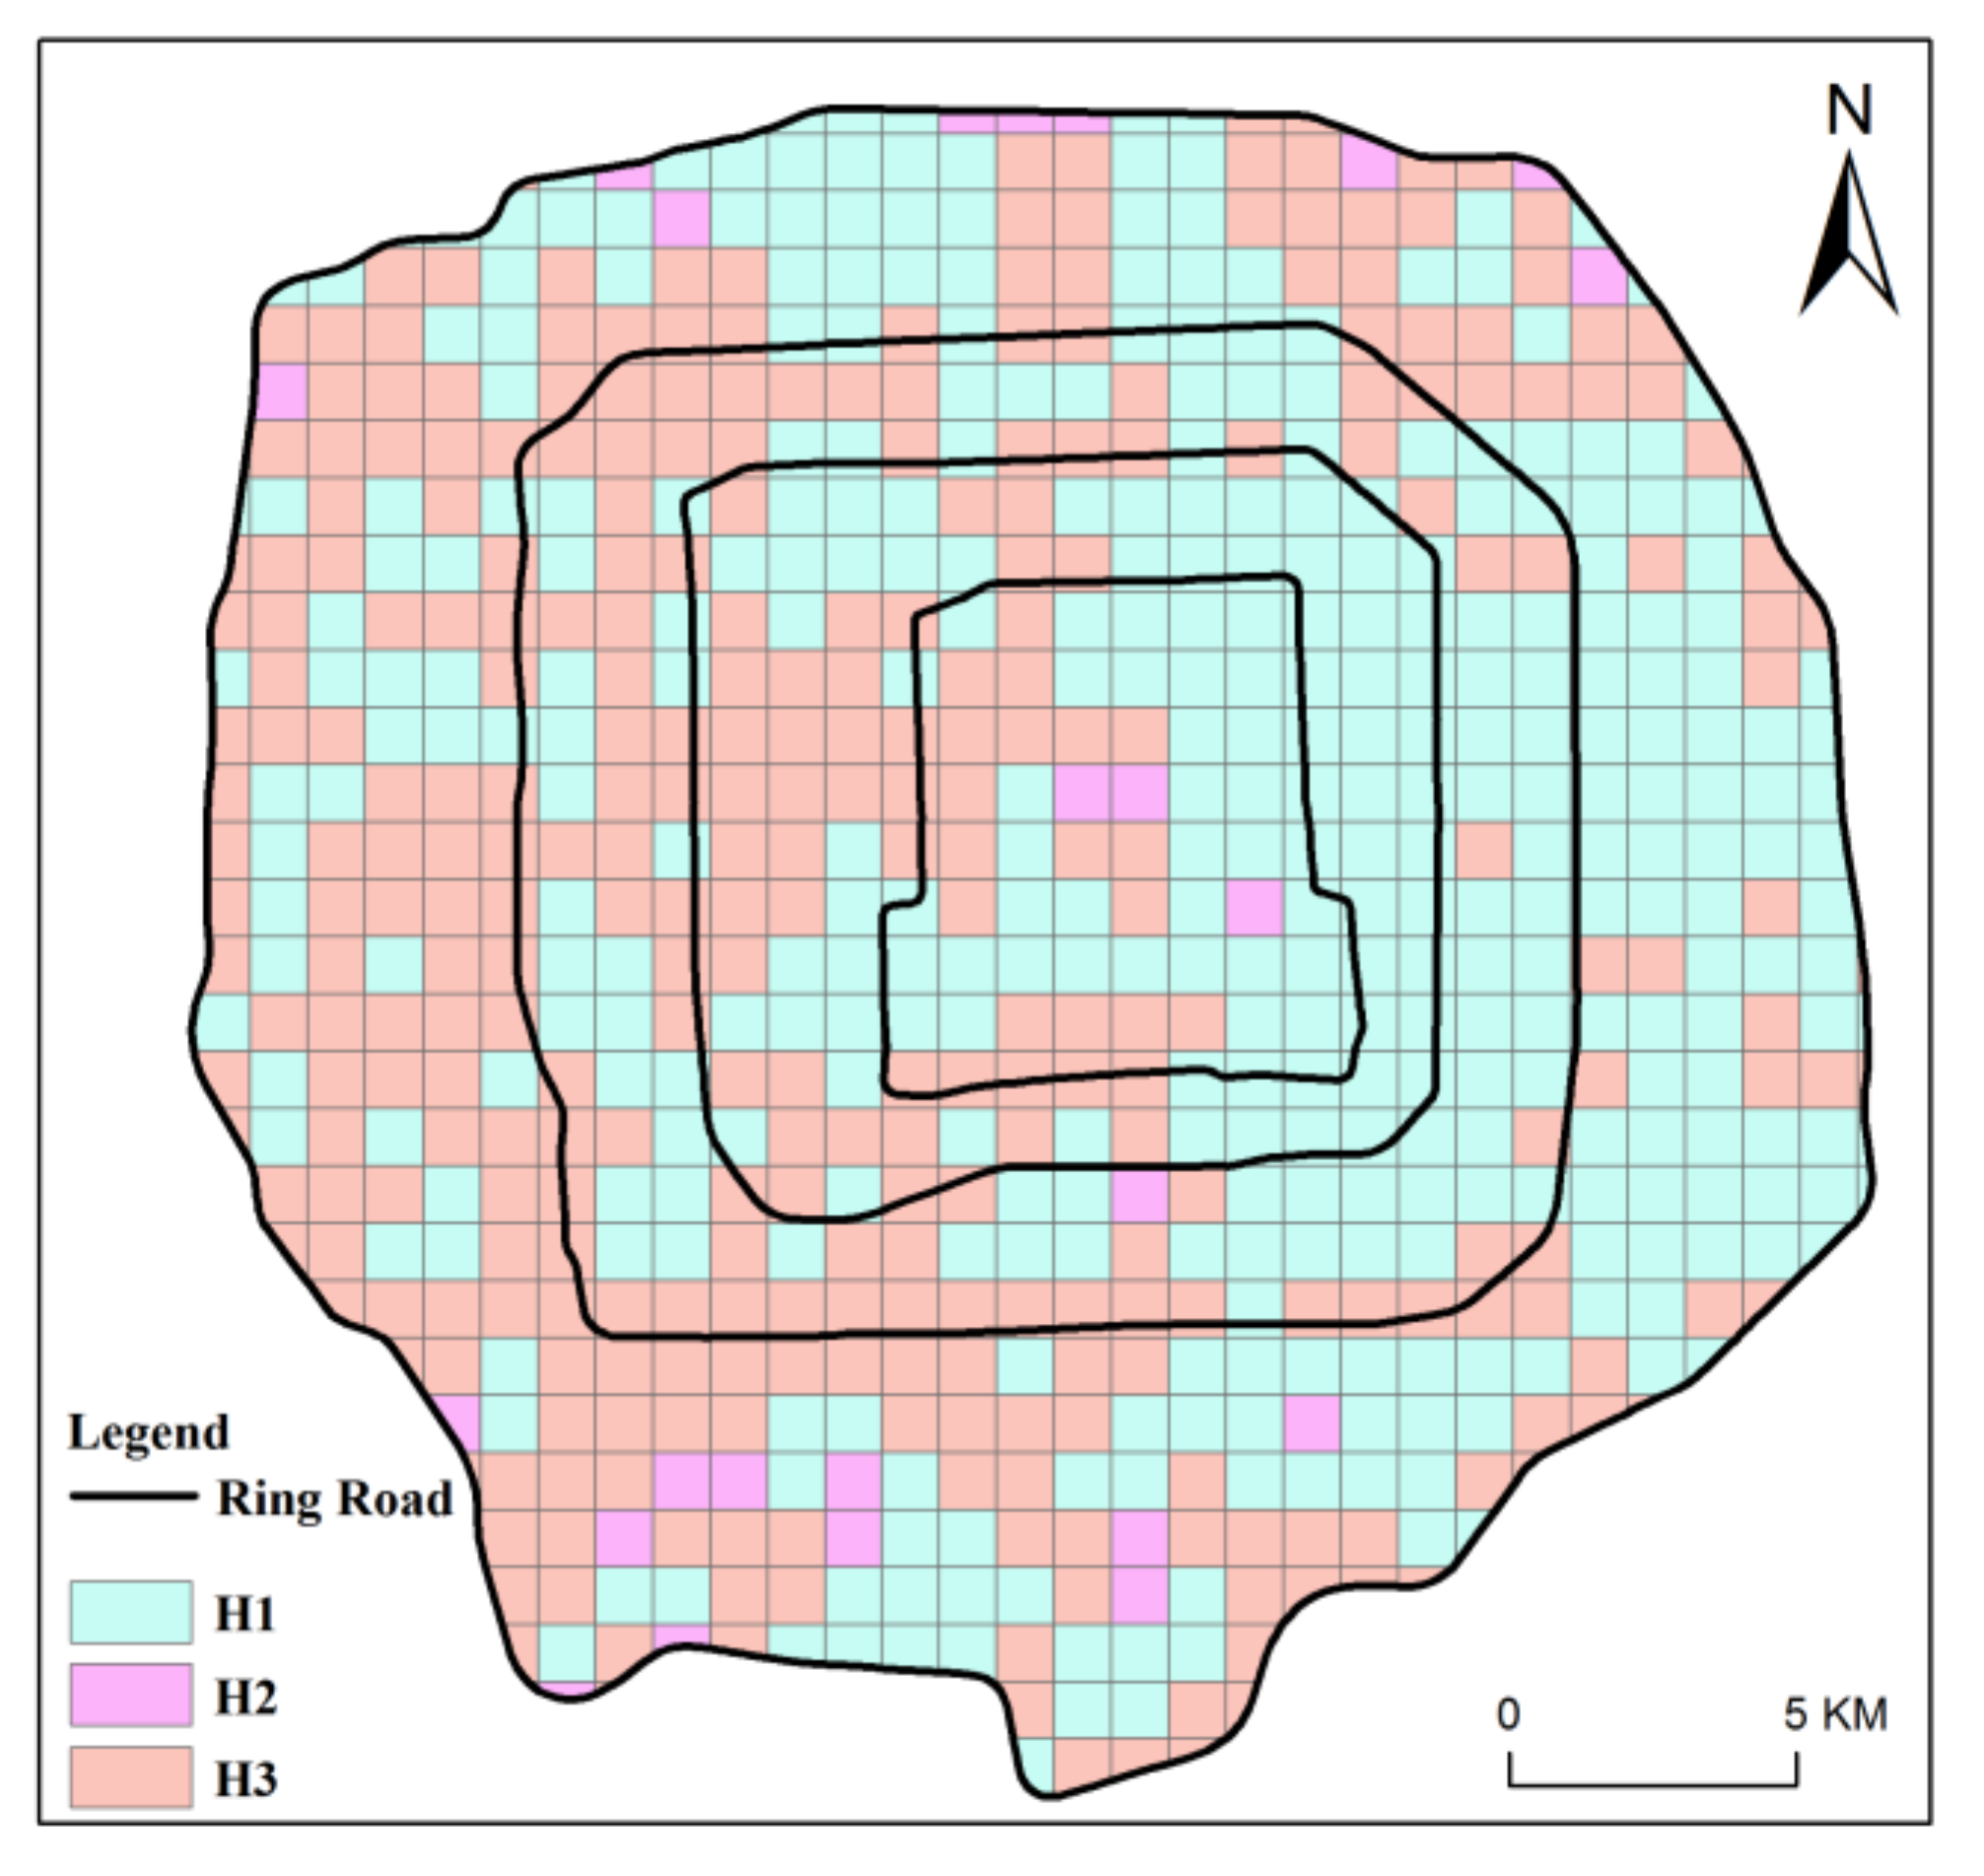
When K = 3 in Equation (5), we ascertained the three types of functional regions. As shown in Figure 5, there were 370 (51%) H1 grids, 23 (3%) H2 grids and 332 (46%) H3 grids. The point densities for different POI categories are shown in Table 3.
Based on the point densities of POI categories, the spatial semantics of H1, H2 and H3 can be obtained. As shown in Table 4, the workplace POI (51.6%, including industrial, administration and public service, commercial facilities and transportation) dominated H1; green space and square POI (47.8%) dominated H2; and residence (44.9%) dominated H3. Consequently, the urban regions that consist of H1, H2 and H3 grids are mixed functional regions dominated by Workplace, Leisure and Residence functions, respectively.
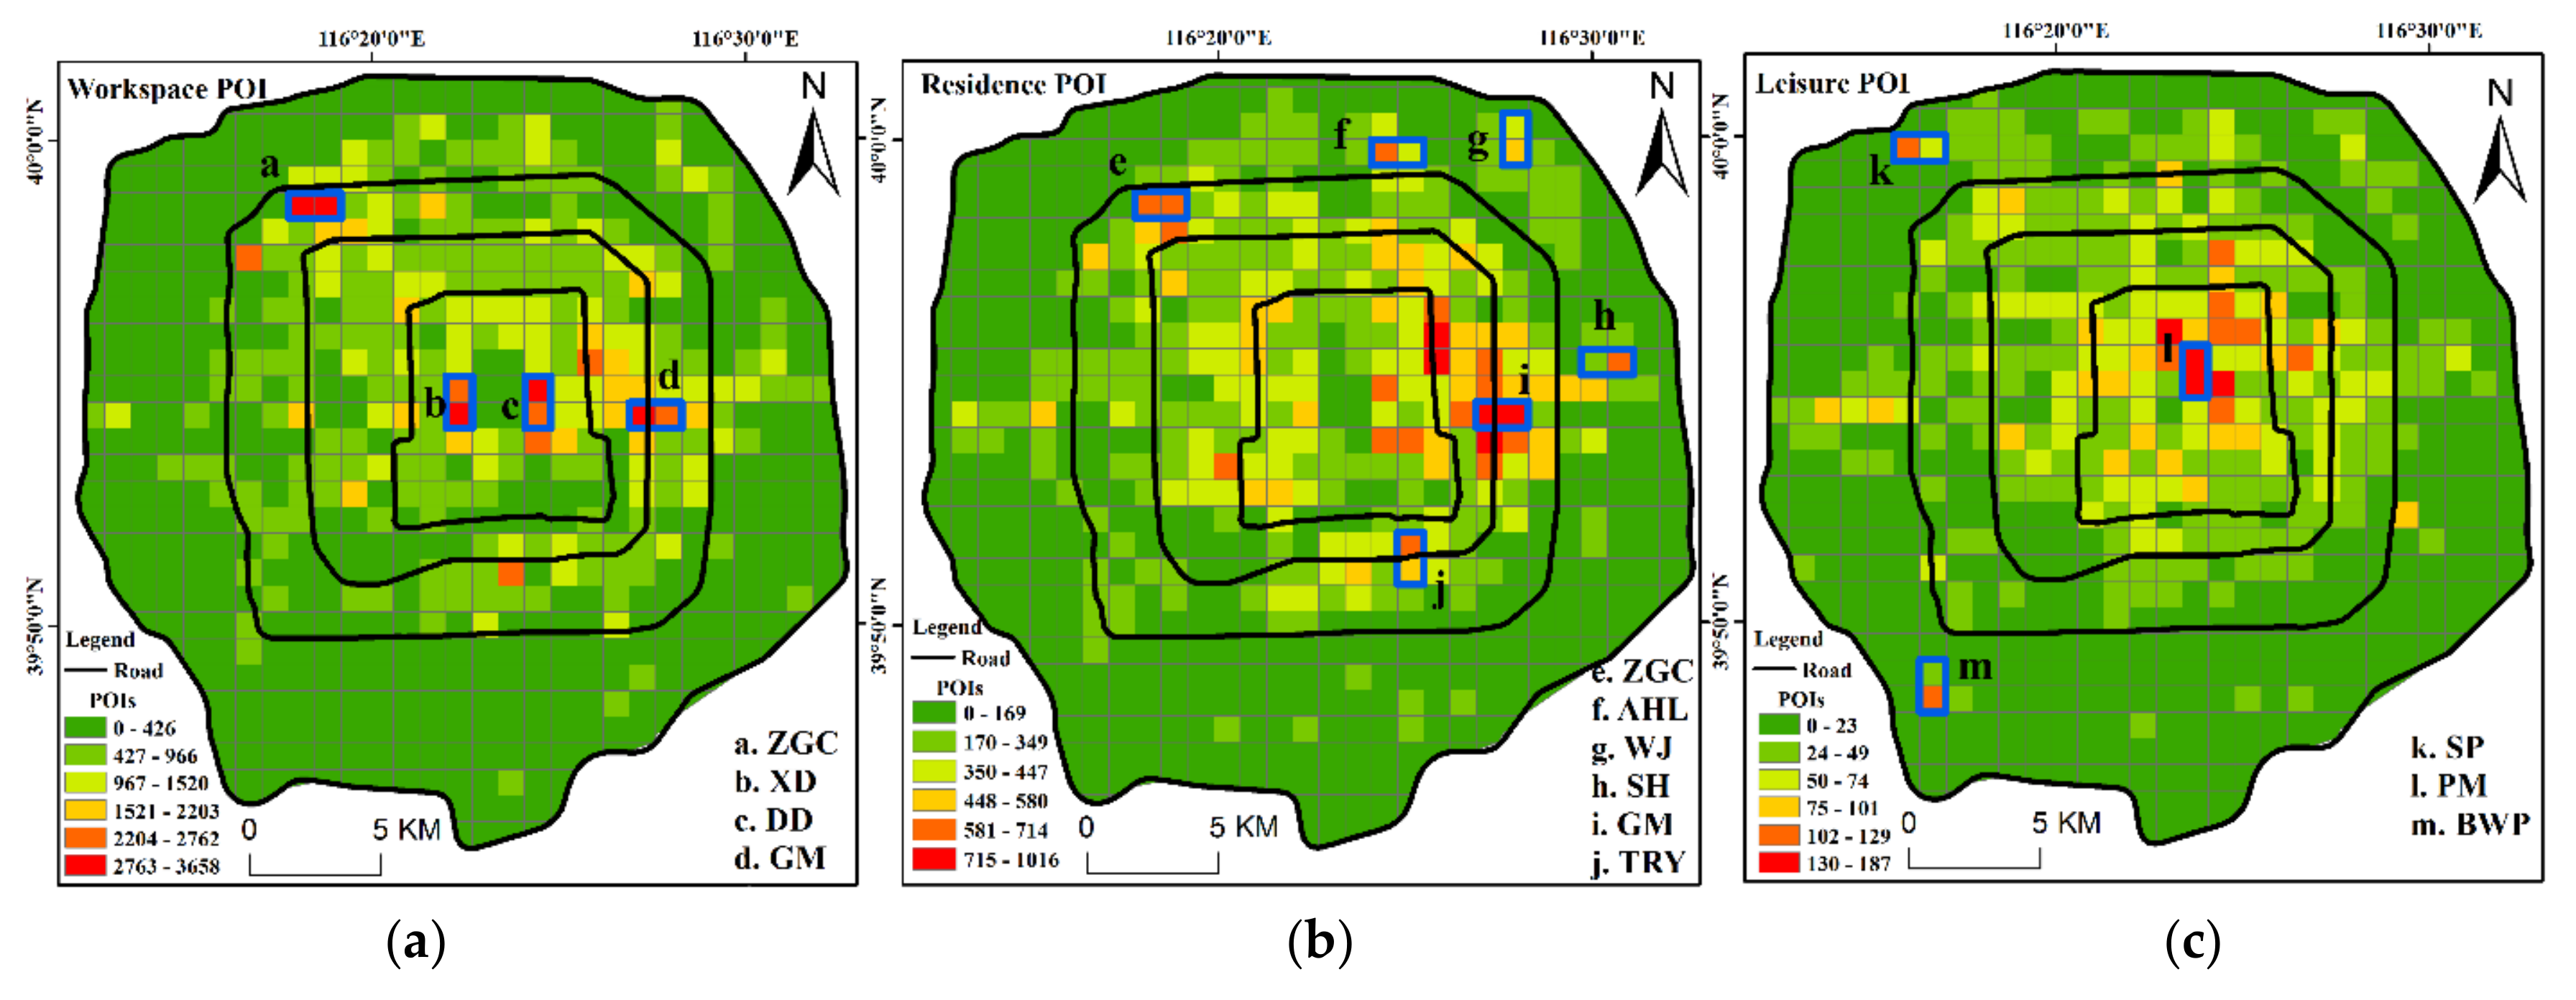
After identifying functional regions using spatial semantics, we visualized the spatial distribution of functional regions by applying head/tail breaks [27]. As shown in Figure 6, the Workspace POI characterized four commercial centre districts of Beijing: ZhongGuanCun (ZGC), XiDan (XD), DongDan (DD) and GuoMao (GM). Additionally, five residential areas, including AnHuiLi (AHL), WangJing (WJ), YanDongYuan (YDY), SiHui (SH) and TongRenYuan (TRY), were characterized by residential POIs. The three famous scenic spots of Beijing, which are the Summer Palace (SP), the Palace Museum (PM) and Beijing World Park (BWP), can be identified by Leisure POIs. As a result, we identified the functional regions by inferring the spatial distribution of H1 (Workplace), H2 (Leisure) and H3 (Residence).
4.3. Exploiting Functional Regions’ Interactions
In this section, we quantitatively explored the interaction intensities between functional regions using spatiotemporal analyses. Spatial interactions between functional regions can help us to understand the spatial structure of a city and plan an efficient spatial configuration [2]. Considering this fact, we selected the workplace districts of ZGC, XD and GM as well as the Residence district WJ of Beijing as typical functional regions in the study area. Subsequently, we analysed the spatiotemporal patterns of interaction intensities among the four typical functional regions using taxi O/D flows.
4.3.1. Spatial Distribution of Functional Regions’ Interactions
The spatial distribution of functional regions’ interactions can be reflected by trip length distributions. The taxi O/D points within the four typical functional regions of ZGC, XD, GM and WJ were calculated, before the hotspot maps were generated using kernel density estimation (KDE). For example, the taxi O/D points of ZGC include both O points (the origin points of people, who get off at ZGC) and D points (the destinations of people, who get on at ZGC). Figure 7 shows the intensities and ranges of interactions among the four functional regions based on taxi O/D point density.
In general, the interactions of the four functional regions exhibited spatial differences. WJ was a residential-oriented district and the attraction of the taxi O/D points was weak on its own. GM and ZGC had strong attractions to WJ. The two business-oriented districts, XD and GM, attracted taxi O/D points between each other. The hotspots distributions of XD and GM were similar and concentrated in the commercial centre within the 3rd Ring Road. GM attracted more taxi O/D points than XD, with highest value of the KDE for XD being about half that of GM.
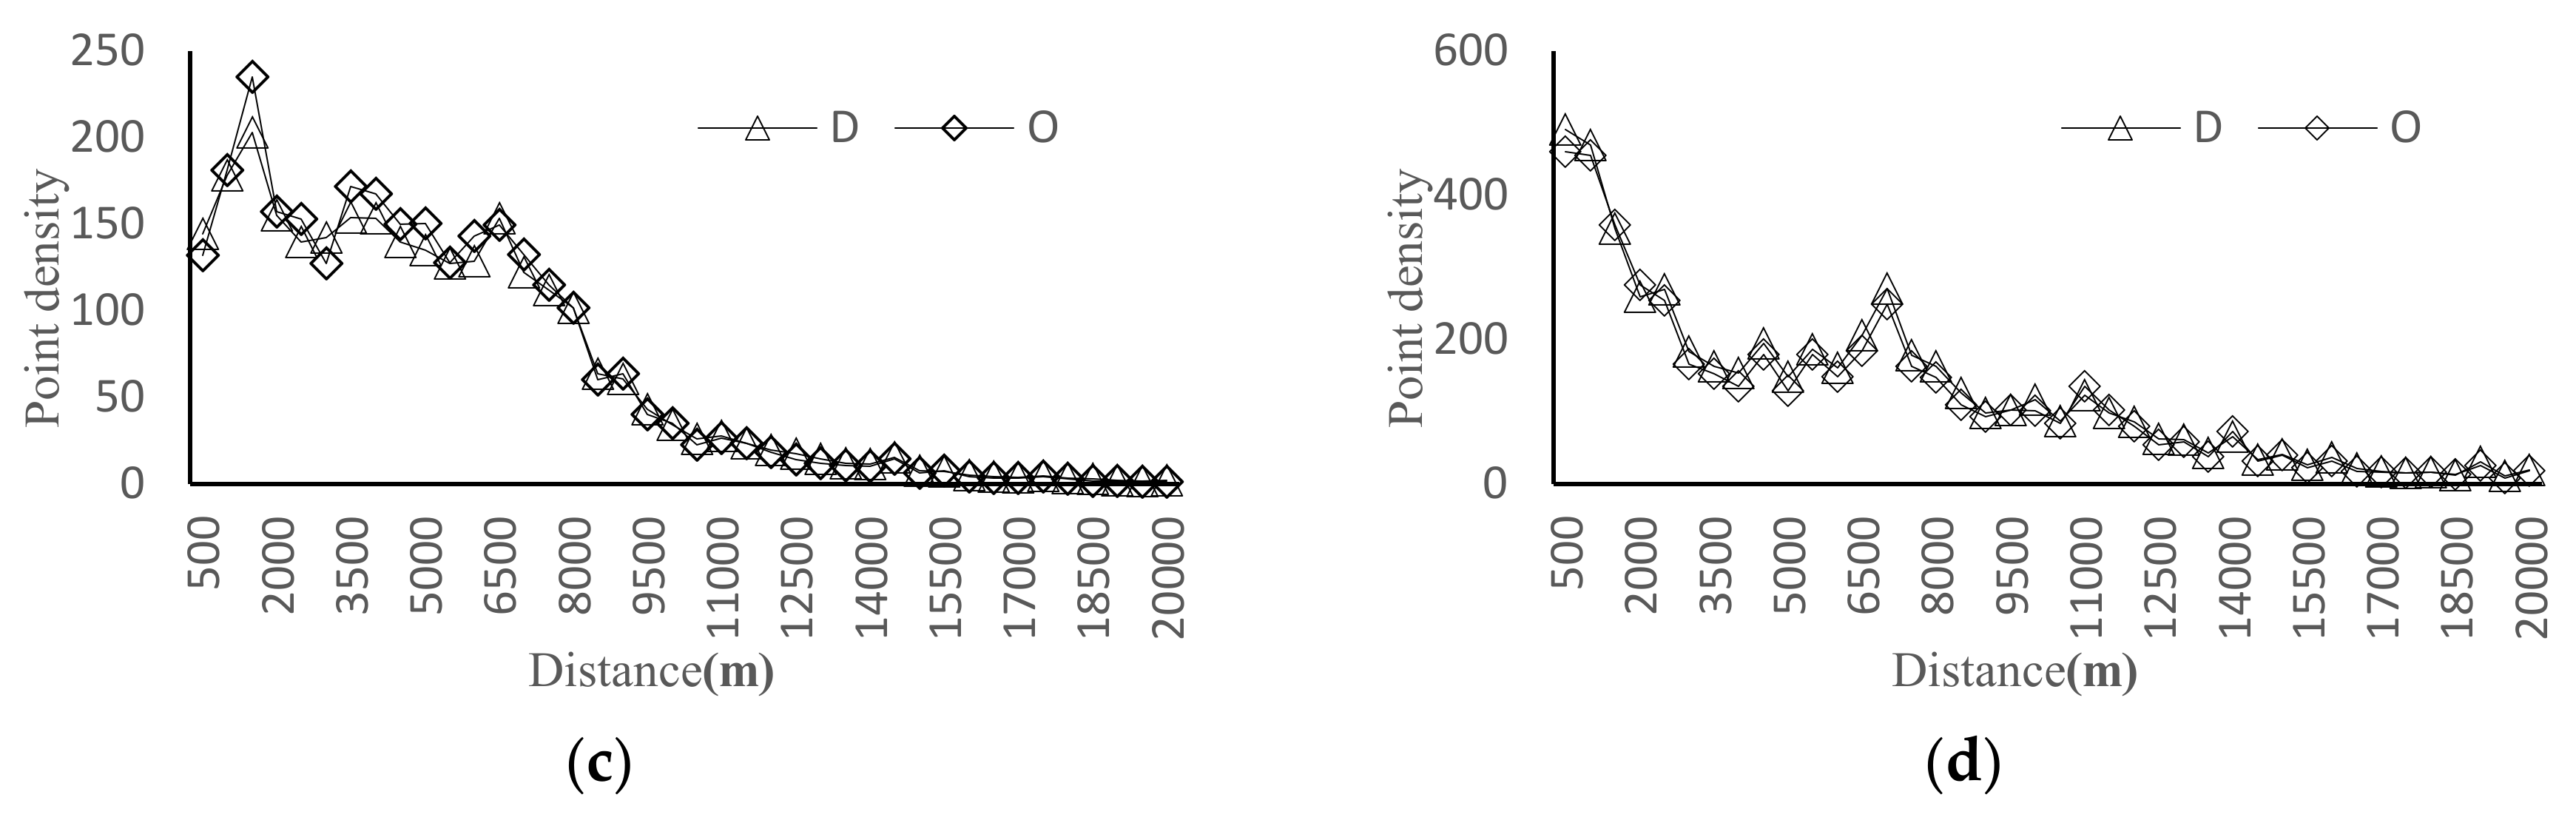
To further explore the trip length distributions in the functional regions, we used the four functional regions as the centre, before 500-m intervals were designed to generate concentric circular buffers within the study area. The calculation of the number of taxi O/D points located in each buffer area revealed the spatial distribution of the traffic attraction of the four functional regions. As shown in Figure 8, the curve of the taxi O/D point density, created by the attraction of three business-oriented functional regions, gradually decays within a 15-km distance. This finding is consistent with people’s psychologically affordable travel time and the spatial distance when they take taxi trips.
4.3.2. Temporal Features of Functional Regions’ Interactions
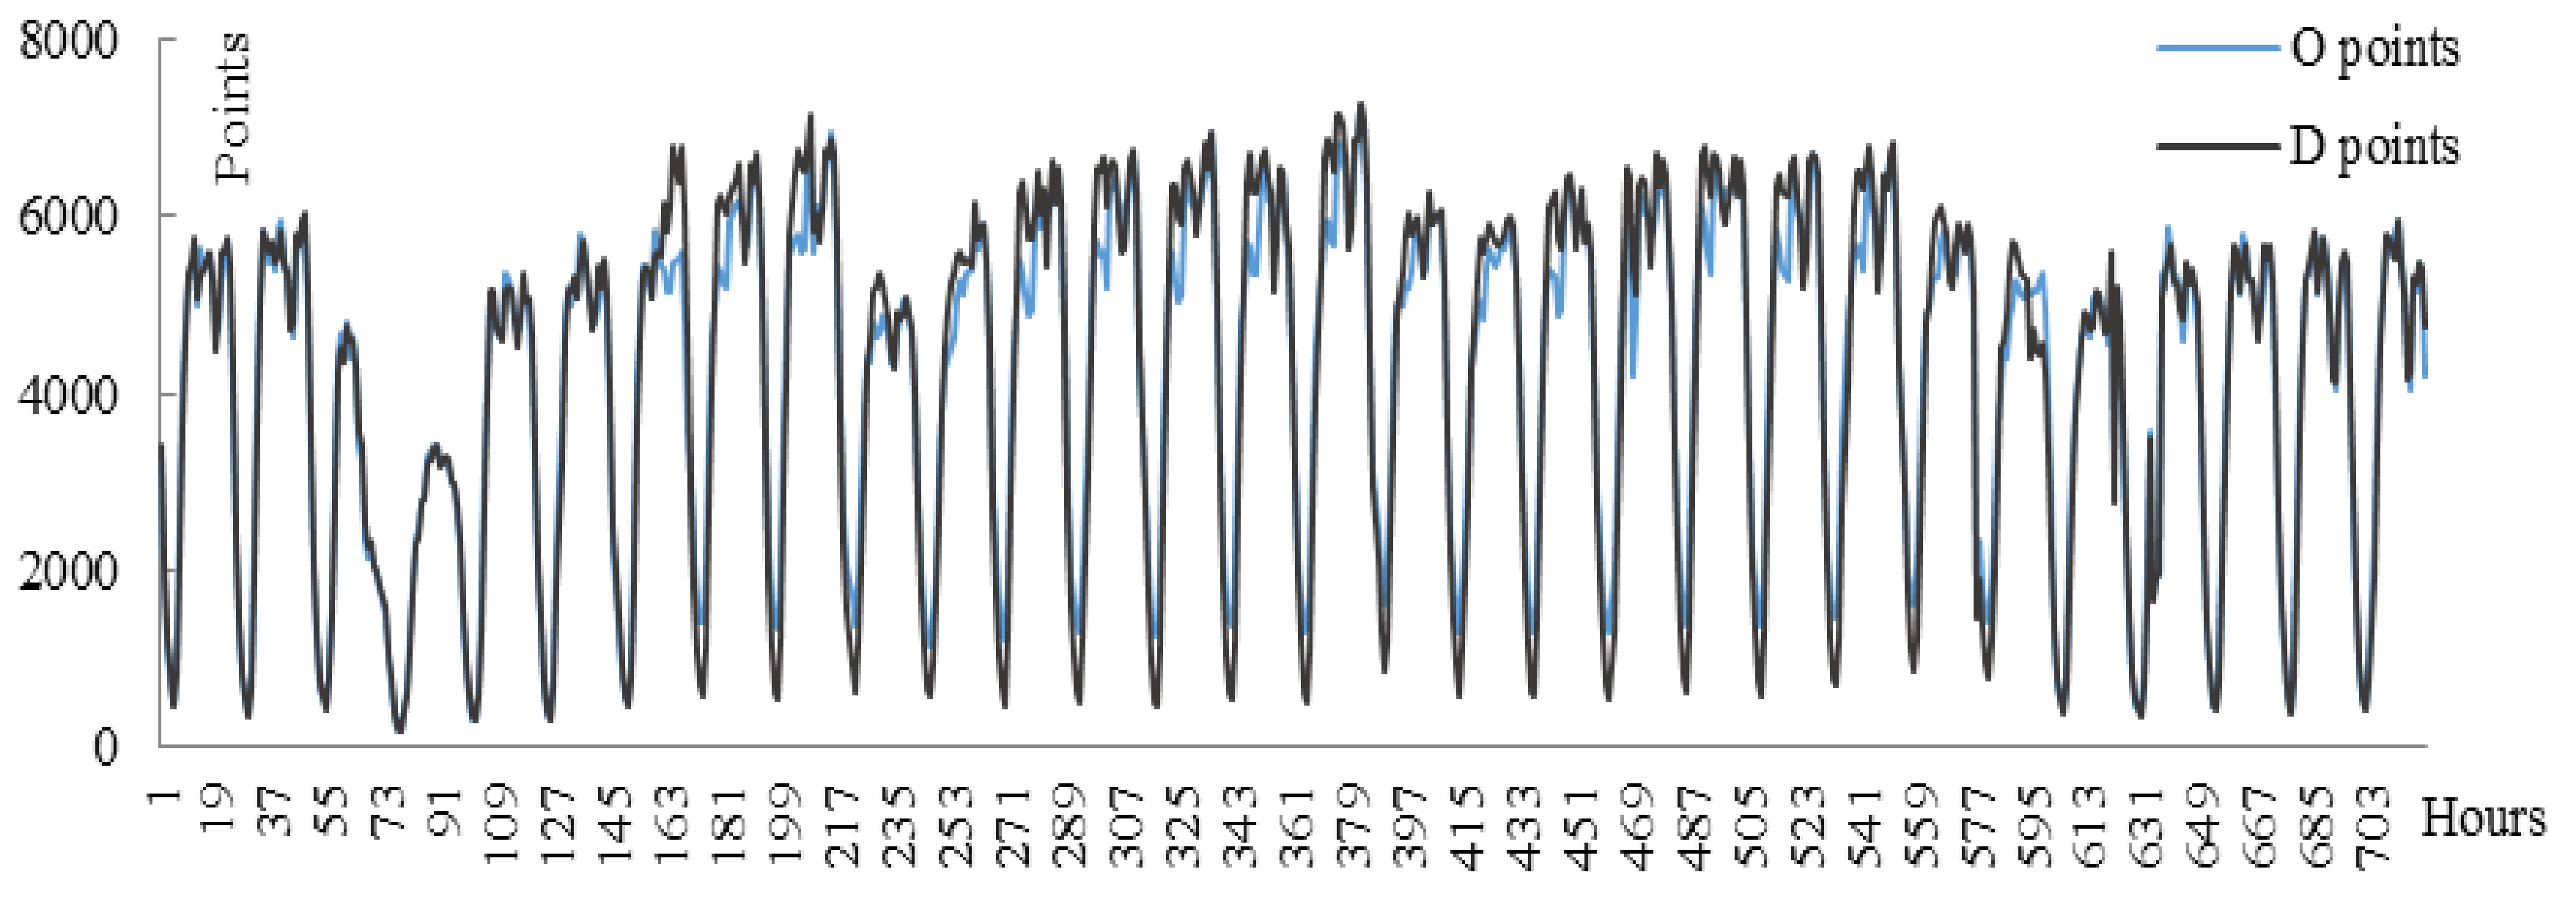
To quantitatively analyse the interactions between functional regions, we explored the temporal features of these interactions based on the method described in Section 3.2. We first divided 30 days into 720 h by one-hour intervals and counted the number of O/D points per hour to analyse the time variations of taxi O/D points in functional regions. We found that the distribution curves of the O/D points display reproducible temporal patterns and clearly follow a daily cycle for 30 one-day periods (Figure 9).
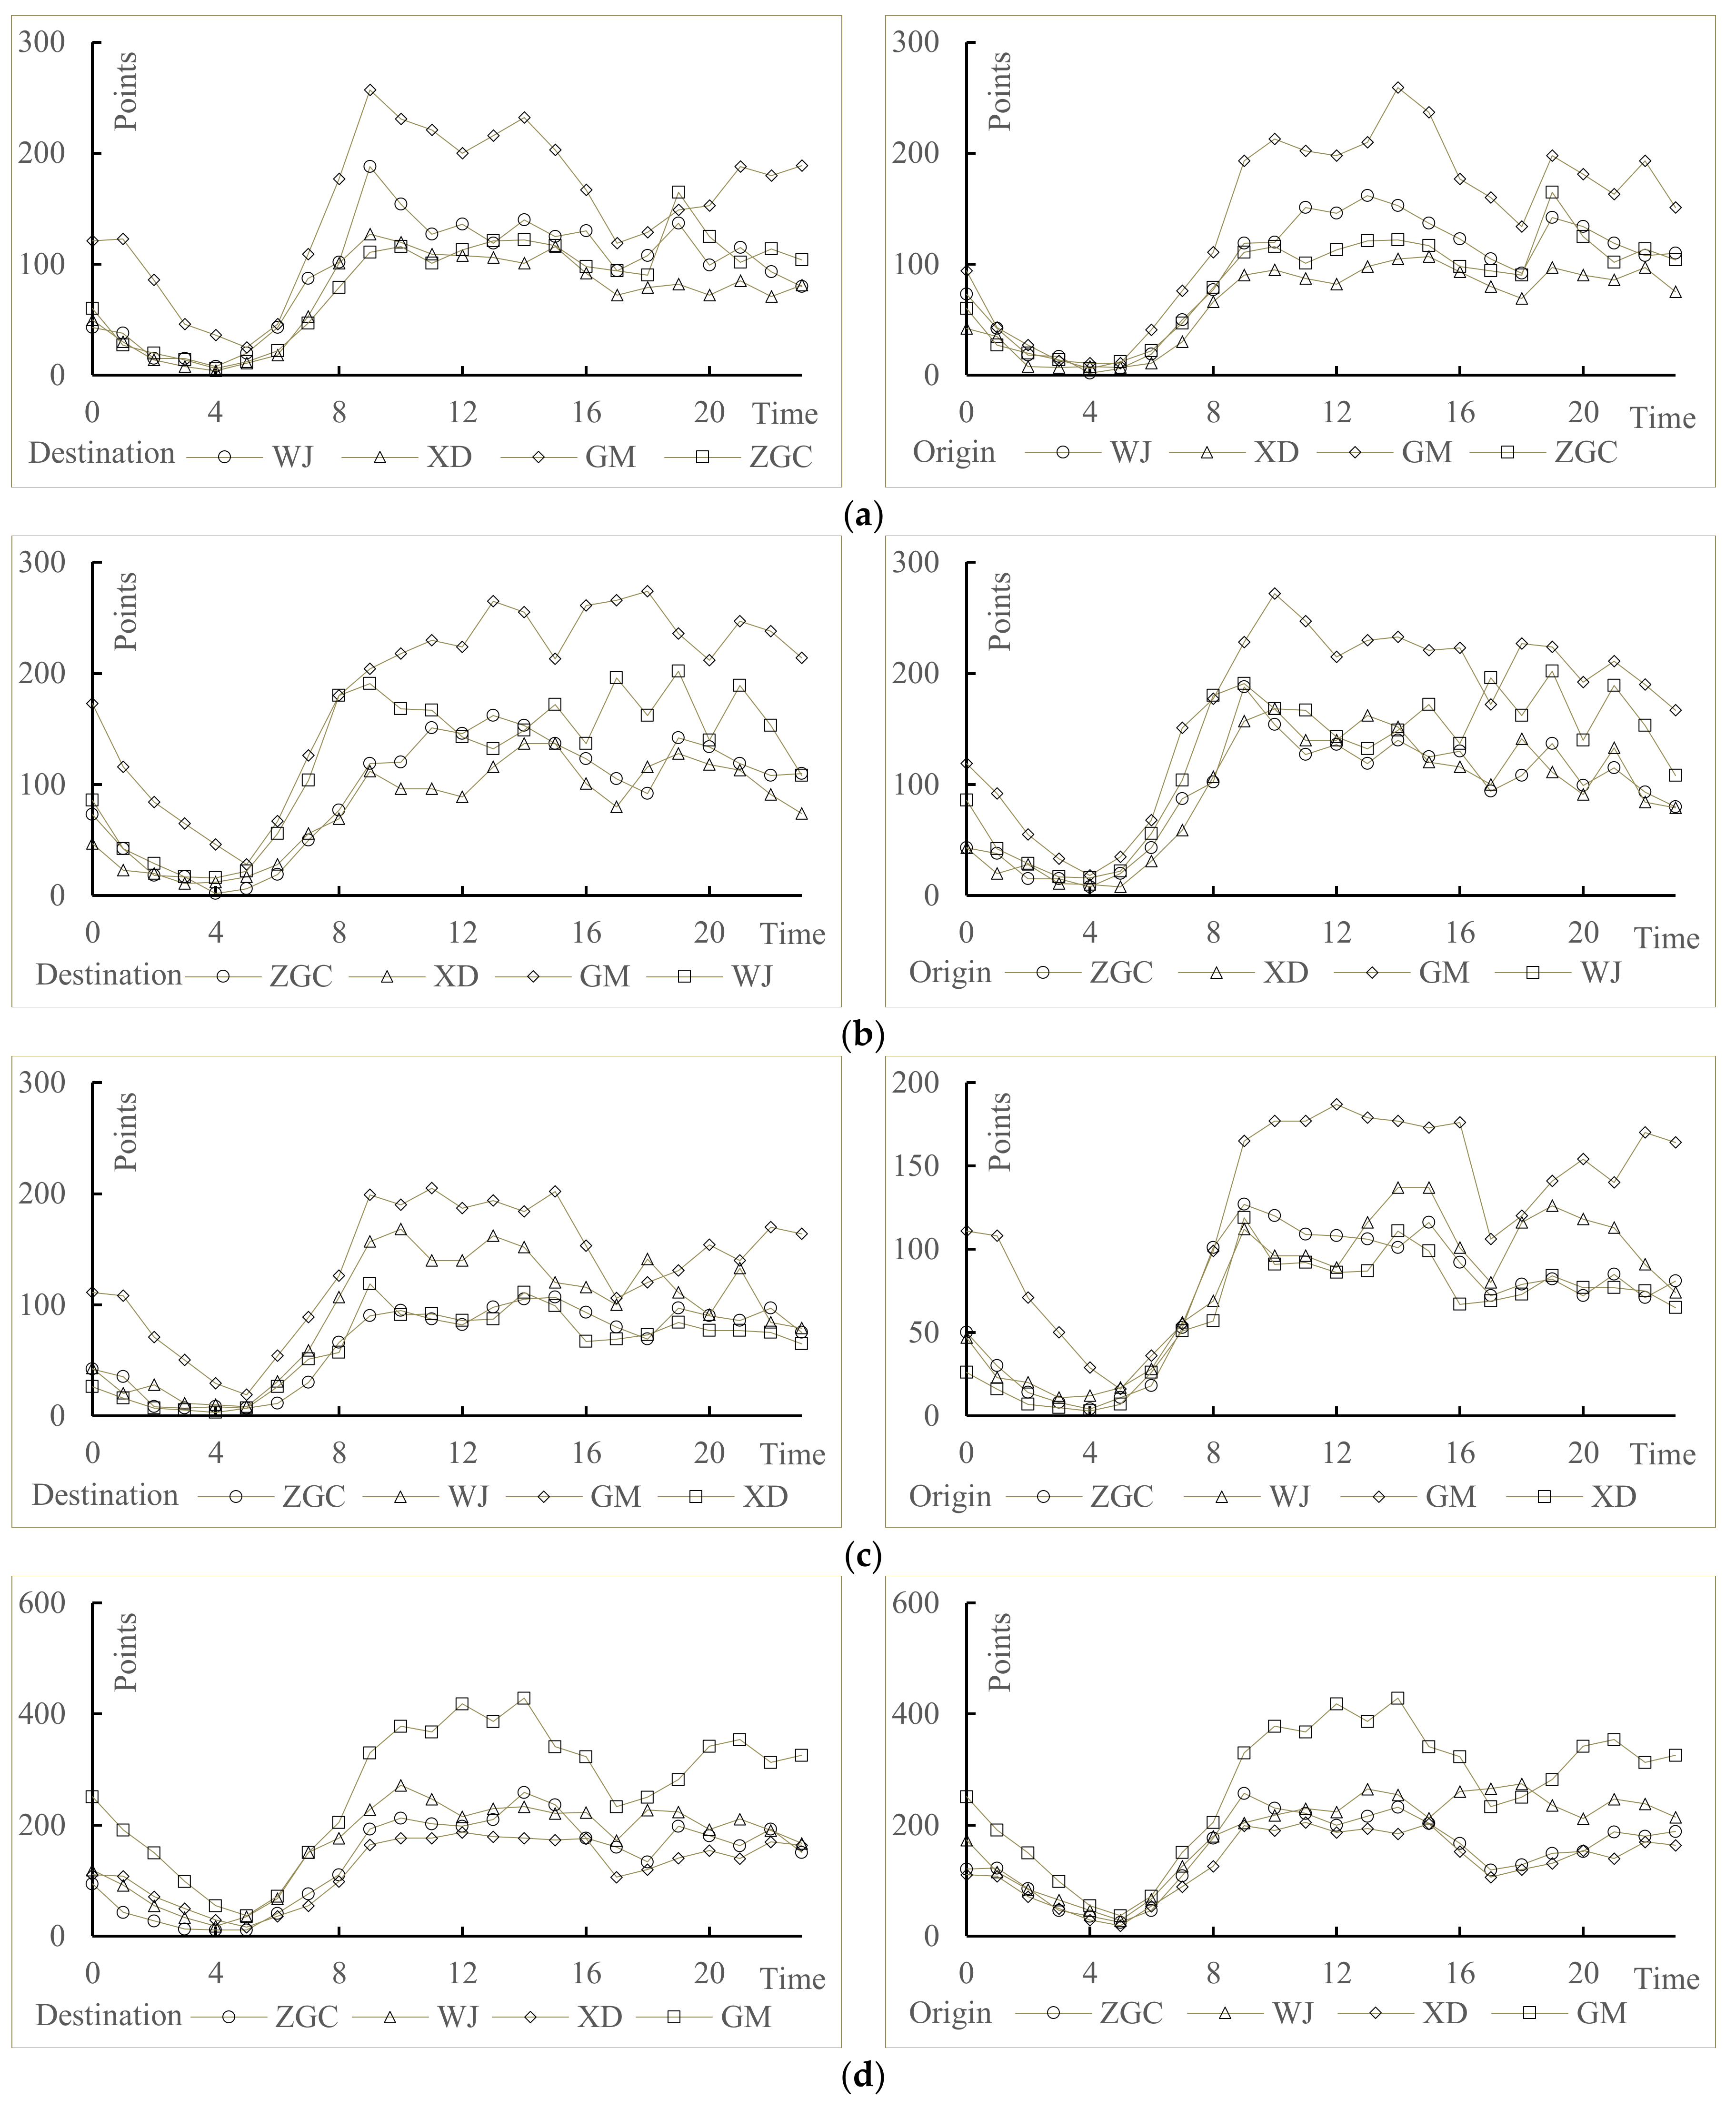
The taxi O/D points that showed the four functional regions attracting each other were counted within 24-h periods due to the periodic taxi O/D trends. Figure 10 shows that the four functional regions attracted taxi O/D points from each other over time.
Subsequently, we used four time periods of 06:00–08:00, 11:00–13:00, 17:00–19:00 and 21:00–23:00 as examples to explore the interaction intensities among the four functional regions. The percentage of taxi O/D points obtained for the functional regions that attracted each other were calculated for the four time periods (Table 5). The average value for the ZGC attracted by itself in the four time periods was 0.227 (i.e., when residents in ZGC take a taxi, there is a 22.7% probability that their destination is still within ZGC). Similarly, the average values for WJ, XD and GM were 0.294, 0.180 and 0.349, respectively.
Furthermore, we set the average values of the functional regions as the threshold value. A greater than average value indicates that one functional region has a strong attraction to another functional region. In general, XD has a strong attraction to the other three functional regions, while GM has a strong attraction to itself. When residents took taxis in ZGC during the period of 08:00–16:00, GM was the main destination. From 06:00 to 09:00, WJ attracted more taxi O/D points from ZGC, XD and GM. In the period of 17:00 to 23:00, WJ was the main destination for the residents, who took a taxi from ZGC, XD and GM, which reflects the daily commute of residents in WJ to some extent. Meanwhile, the interaction intensity between WJ and GM was greater than the interaction intensity between WJ and the other functional regions, which is consistent with the pattern of distance decay in the spatial interactions. There were strongly interconnected activities linking the two business-oriented districts, XD and GM. In general, the total taxi O/D points of the two business-oriented districts increased during 08:00 to 14:00 and reached their highest peak at 12:00. After 18:00, the attracting O/D points of the two business-oriented districts continued to rise, reaching a new peak at 22:00. This is consistent with the spatiotemporal behaviours of residents when shopping and engaging in other activities at business centres.
By quantitatively analysing the spatial distributions and interaction intensities of functional regions, we conclude that (1) GM is a business-oriented district with a strong attraction to itself; (2) GM and XD are two core business districts with strong traffic exchange activities; and (3) government planning developed WJ to be a large-scale residential commuter community. As a result, the three business-oriented districts are attractive to WJ, while the nearest district GM has the strongest attraction.
5. Discussion and Conclusions
Urban functional regions are a hot research topic. The identification of urban functional regions can enable a diversity of valuable applications. First, residents can expand their knowledge about the city in which they live by identifying functional regions. Second, the urban planning of a city can be calibrated by identifying functional regions. In this paper, we propose a practical framework using spatial semantics and interactions to identify urban functional regions. The framework involves two steps: identifying functional regions and revealing their interactions. A case study using POI data and taxi trajectory data from Beijing validated the proposed framework. The case study found that: (1) incorporating spatial semantics and interaction patterns helps to improve the identification of urban functional regions; and (2) the interaction intensities between functional regions reveals the underlying association between human activity patterns and urban structure. The proposed framework can be used to identify urban functional regions and promote an enhanced understanding of urban structures.
There are still some limitations within this study. First, the precision of functional regions identification highly depends on the quantity of taxi O/D flows data. The taxi dataset was collected from approximately 4000 taxis during thirty consecutive days. Consequently, to a large extent, taxi O/D flows can reflect the activities of real people and reasonably represent functional regions’ spatial interactions. However, taxi O/D flows are able to represent part of urban travel due to people taking taxi trips within a certain distance range. Further studies may expand the data source to the trace data of personal cars, metro trips and bus trips, before taking advantage of each type of data. This combination of diverse data can be more applicable in identifying urban functional regions and detecting changes in urban spatial structure. Second, it is clear that more detailed POI information might lead to more reliable results. For example, by taking the popularity of POI into consideration, we can study the co-occurrence patterns of POI types, which indicate the associated human activities. In future work, POIs will be assigned corresponding weights according to the building area and public awareness in order to classify functional regions more accurately.
Acknowledgments
This work is funded by the National Key Research and Development Program of China (Grant No. 2016YFB0501403); the National Natural Science Foundation of China (Grant No. 41271399); and the China Special Fund for Surveying, Mapping and Geoinformation Research in the Public Interest (Grant No. 201512015).
Author Contributions
Yandong Wang conceived and designed the experiments; Yanyan Gu performed the experiments; Mingxuan Dou and Mengling Qiao analyzed the data; Yandong Wang contributed reagents/materials/analysis tools; Yanyan Gu wrote the paper.
Conflicts of Interest
The authors declare no conflict of interest.
References
- Liu, Y.; Wang, F.; Xiao, Y.; Gao, S. Urban land uses and traffic ‘source-sink areas’: Evidence from GPS-enabled taxi data in Shanghai. Landsc. Urban Plan. 2012, 106, 73–87. [Google Scholar] [CrossRef]
- Yuan, J.; Zheng, Y.; Xie, X. Discovering regions of different functions in a city using human mobility and POIs. In Proceedings of the 18th ACM SIGKDD International Conference on Knowledge Discovery and Data Mining, New York, NY, USA, 12–16 August 2012; pp. 186–194. [Google Scholar]
- Liu, Y.; Sui, Z.; Kang, C.; Gao, Y. Uncovering patterns of inter-urban trip and spatial interaction from social media check-in data. PLoS ONE 2014, 9, e86026. [Google Scholar] [CrossRef] [PubMed]
- Liu, X.; Kang, C.; Gong, L.; Liu, Y. Incorporating spatial interaction patterns in classifying and understanding urban land use. Int. J. Geogr. Inf. Sci. 2016, 30, 334–350. [Google Scholar] [CrossRef]
- Zhan, X.; Ukkusuri, S.V.; Zhu, F. Inferring urban land use using large-scale social media check-in data. Netw. Spat. Econ. 2014, 14, 647–667. [Google Scholar] [CrossRef]
- Krosche, J.; Boll, S. The xPOI Concept. In Proceedings of the First International Workshop on Location and Context Awareness, Oberpfaffenhofen, Germany, 12–13 May 2005; Springer: Berlin/Heidelberg, Germany, 2005; pp. 113–119. [Google Scholar]
- Kwan, M.P. Space-Time and Integral Measures of Individual Accessibility: A Comparative Analysis Using a Point-based Framework. Geogr. Anal. 1998, 30, 191–216. [Google Scholar] [CrossRef]
- Yang, Y.; Tian, L.; Yeh, A.G.O.; Li, Q.Q. Zooming into individuals to understand the collective: A review of trajectory-based travel behaviour studies. Travel Behav. Soc. 2014, 1, 69–78. [Google Scholar] [CrossRef]
- Gong, L.; Liu, X.; Wu, L.; Liu, Y. Inferring trip purposes and uncovering travel patterns from taxi trajectory data. Cartogr. Geogr. Inf. Sci. 2016, 43, 103–114. [Google Scholar] [CrossRef]
- Jia, T.; Ji, Z. Understanding the functionality of human activity hotspots from their scaling pattern using trajectory data. ISPRS Int. J. Geo-Inf. 2017, 6, 341. [Google Scholar] [CrossRef]
- Qi, G.; Li, X.; Li, S.; Pan, G.; Wang, Z.; Zhang, D. Measuring social functions of city regions from large-scale taxi behaviors. In Proceedings of the 2011 IEEE International Conference on Pervasive Computing and Communications Workshops (PERCOM Workshops), Seattle, WA, USA, 21–25 March 2011; pp. 384–388. [Google Scholar]
- Peng, C.; Jin, X.; Wong, K.C.; Shi, M.; Liò, P. Collective human mobility pattern from taxi trips in urban area. PLoS ONE 2012, 7, e34487. [Google Scholar] [CrossRef]
- Kong, X.; Liu, Y.; Wang, Y.; Tong, D.; Zhang, J. Investigating public facility characteristics from a spatial interaction perspective: A case study of Beijing hospitals using taxi data. ISPRS Int. J. Geo-Inf. 2017, 6, 38. [Google Scholar] [CrossRef]
- Elwood, S.; Goodchild, M.F.; Sui, D.Z. Researching volunteered geographic information: Spatial data, geographic research, and new social practice. Ann. Assoc. Am. Geogr. 2012, 102, 571–590. [Google Scholar] [CrossRef]
- Guo, D. Flow Mapping and Multivariate Visualization of Large Spatial Interaction Data. IEEE. Trans. Vis. Comput. Gr. 2009, 15, 1041–1048. [Google Scholar] [CrossRef]
- Yan, J.; Thill, J.C. Visual data mining in spatial interaction analysis with self-organizing maps. Environ. Plan. B 2009, 36, 466–486. [Google Scholar] [CrossRef]
- Zhong, C.; Arisona, S.M.; Huang, X.; Batty, M.; Schmitt, G. Detecting the dynamics of urban structure through spatial network analysis. Int. J. Geogr. Inf. Sci. 2014, 28, 2178–2199. [Google Scholar] [CrossRef]
- Demsar, U.; Reades, J.; Manley, E.; Batty, M. Edge based communities for identification of functional regions in a taxi flow network. In Proceedings of the 8th International Conference on Geographic Information Science, Vienna, Austria, 24–26 September 2014. [Google Scholar]
- Poussevin, M.; Baskiotis, N.; Guigue, V.; Gallinari, P. Mining ticketing logs for usage characterization with nonnegative matrix factorization. In Big Data Analytics in the Social and Ubiquitous Context; Springer: Berlin/Heidelberg, Germany, 2014. [Google Scholar]
- Ozer, M.; Kim, N.; Davulcu, H. Community detection in political Twitter networks using Nonnegative Matrix Factorization methods. In Proceedings of the 2016 IEEE/ACM International Conference on Advances in Social Networks Analysis and Mining (ASONAM), San Francisco, CA, USA, 18–21 August 2016; pp. 81–88. [Google Scholar]
- Mahrsi, M.K.; Come, E.; Baro, J.; Oukhellou, L. Understanding passenger patterns in public transit through smart card and socio-economic data. In Proceedings of the 3rd International Workshop on Urban Computing (UrbComp), New York, NY, USA, 24–27 August 2014. [Google Scholar]
- Hu, T.; Yang, J.; Li, X.; Gong, P. Mapping urban land use by using Landsat images and open social data. Remote Sens. 2016, 8, 151. [Google Scholar] [CrossRef]
- Kontschieder, P.; Bulo, S.R.; Pelillo, M.; Bischof, H. Structured labels in random forests for semantic labelling and object detection. IEEE Trans. Pattern Anal. Mach. Intell. 2014, 36, 2104–2116. [Google Scholar] [CrossRef] [PubMed]
- Gao, S.; Janowicz, K.; Couclelis, H. Extracting urban functional regions from points of interest and human activities on location-based social networks. Trans. GIS 2017, 21, 446–467. [Google Scholar] [CrossRef]
- Jiang, B. Head/tail breaks for visualization of city structure and dynamics. Cities 2015, 43, 69–77. [Google Scholar] [CrossRef]
- Long, Y.; Shen, Z. Discovering functional zones using bus smart card data and points of interest in Beijing. In Geospatial Analysis to Support Urban Planning in Beijing; Springer: Berlin/Heidelberg, Germany, 2015; pp. 193–217. [Google Scholar]
- Hobel, H.; Abdalla, A.; Fogliaroni, P.; Frank, A.U. A semantic region growing algorithm: Extraction of urban settings. In AGILE 2015: Geographic Information Science as an Enabler of Smarter Cities and Communities; Springer: Berlin, Germany, 2015; pp. 19–33. [Google Scholar]
- McKenzie, G.; Janowicz, K. The effect of regional variation and resolution on geosocial thematic signatures for points of interest. In AGILE 2017: Societal Geo-Innovation; Lecture Notes in Geoinformation and Cartography; Springer: Berlin, Germany, 2017; pp. 237–256. [Google Scholar]
- Wang, Y.; Wang, T.; Tsou, M.H.; Li, H.; Jiang, W.; Guo, F. Mapping dynamic urban land use patterns with crowdsourced geo-tagged social media (Sina-Weibo) and commercial points of interest collections in Beijing, China. Sustainability 2016, 8, 1202. [Google Scholar] [CrossRef]
- Yue, Y.; Wang, H.; Hu, B.; Li, Q.; Li, G.; Yeh, A. Exploratory calibration of a spatial interaction model using taxi GPS trajectories. Comput. Environ. Urban Syst. 2012, 36, 140–153. [Google Scholar] [CrossRef]
- Miller, H.J. Tobler’s first law and spatial analysis. Ann. Assoc. Am. Geogr. 2004, 94, 284–289. [Google Scholar] [CrossRef]
- Ministry of Housing and Urban-Rural Development of the People’s Republic of China. GB50137-2011 Code for Urban Land Use Classes and Standards of Planning Construction Land; China Architecture & Building Press: Beijing, China, 2011.
- Boarnet, M.; Crane, R. The influence of land use on travel behavior: Specification and estimation strategies. Transp. Res. Part A 2001, 35, 823–845. [Google Scholar] [CrossRef]
- Lee, D.; Seung, H.S. Learning the parts of objects by non-negative matrix factorization. Nature 1999, 401, 788–791. [Google Scholar] [CrossRef] [PubMed]
Figure 1.
Flowchart of the proposed framework.

Figure 2.
Illustration of POI semantics for functional regions.

Figure 3.
Illustration of interactions between functional regions based on taxi O/D flows in a particular time period.
Figure 3.
Illustration of interactions between functional regions based on taxi O/D flows in a particular time period.

Figure 4.
Spatial distribution of O/D points for all the taxis over thirty days in the study area of Beijing.
Figure 4.
Spatial distribution of O/D points for all the taxis over thirty days in the study area of Beijing.

Figure 5.
Spatial distribution for three types of functional regions. Using NMF, the 725 1 × 1 km2 grids were classified into 370 H1 grids, 23 H2 grids and 332 H3 grids.
Figure 5.
Spatial distribution for three types of functional regions. Using NMF, the 725 1 × 1 km2 grids were classified into 370 H1 grids, 23 H2 grids and 332 H3 grids.

Figure 6.
The spatial distribution of functional regions according to spatial semantics based on POI point density: (a) Workspace POI; (b) Residence POI; and (c) Leisure POI represent the functional regions for H1 (Workplace POI), H2 (Residence POI) and H3 (Leisure POI), respectively.
Figure 6.
The spatial distribution of functional regions according to spatial semantics based on POI point density: (a) Workspace POI; (b) Residence POI; and (c) Leisure POI represent the functional regions for H1 (Workplace POI), H2 (Residence POI) and H3 (Leisure POI), respectively.

Figure 7.
Hotspot maps for the intensities and ranges of interactions among the four functional regions.
Figure 7.
Hotspot maps for the intensities and ranges of interactions among the four functional regions.

Figure 8.
Spatial distribution of the traffic attraction of the four functional regions: (a) Taxi O/D points’ attraction for ZGC; (b) taxi O/D points’ attraction of WJ. The O/D point density curve of WJ shows three peaks at 4 km, 9.5 km and 12.5 km, which coincide with the distances between WJ and the other three functional regions; (c) Taxi O/D points’ attraction for XD. The O/D point density curve of XD gradually decreases to zero at 10 km, indicating that the residents’ average trip distance by taxi is 10 km and generally not more than 20 km; (d) Taxi O/D points’ attraction for GM.


Figure 9.
Curves of O points and P points representing the temporal variations of the taxi O/D flows over the entire study area. There are large numbers of O/D points that exhibit 24-h cycles.
Figure 9.
Curves of O points and P points representing the temporal variations of the taxi O/D flows over the entire study area. There are large numbers of O/D points that exhibit 24-h cycles.

Figure 10.
Temporal variations of the four functional regions’ interactions based on O/D points. The left/right map of (a) demonstrates that when people take taxis to/from in ZGC, the taxi O/D flows between ZGC and the other three functional regions occur at different time periods daily. Similarly, (b–d) represent the temporal variations for WJ, XD and GM, respectively.


Table 1.
POI point density for functional regions (points/km2).
| POI Categories | H1 | H2 | H3 |
|---|---|---|---|
| CW | 2.8 | 1.0 | 1.5 |
| CR | 1.0 | 5.0 | 1.0 |
| CL | 0.4 | 0.0 | 4.0 |
Table 2.
Categories of POIs.
| ID | 1st Level Category | 2nd Level Category |
|---|---|---|
| 1 | Residence | Serviced apartment, Residential area, Villa, etc. |
| 2 | Administration and public service | Culture & Education service, Talent market, Governmental agency, Social organization, Sports & Leisure, Medical insurance, Community facility, etc. |
| 3 | Commercial facilities | Catering service, Shopping service, Financial insurance, Car service, Domestic service, Accommodation service, Corporation, Logistics service, etc. |
| 4 | Industrial | Factory, Metallurgical enterprise, Mining company, Industrial park, etc. |
| 5 | Road and transportation | Road ancillary facility, Address information, Transportation service, etc. |
| 6 | Green space and square | Scenic spot, Park plaza, etc. |
Table 3.
POI point density for H1, H2 and H3 (points/km2).
| ID | POI Categories | H1 | H2 | H3 |
|---|---|---|---|---|
| 1 | Residence | 165 (41.4%) | 56 (14%) | 180 (44.9%) |
| 2 | Administration and public service | 116 (53.2%) | 27 (12.4%) | 75 (33.4%) |
| 3 | Commercial facilities | 421 (50.3%) | 190 (22.7%) | 226 (27%) |
| 4 | Industrial | 123 (55.7%) | 17 (7.7%) | 81 (36.6%) |
| 5 | Transportation | 46 (49.5%) | 15 (16.1%) | 32 (34.4%) |
| 6 | Green space and square | 6 (26.1%) | 11 (47.8%) | 6 (26.1%) |
Table 4.
Spatial semantics of H1, H2, and H3 based on POI categories.
| 1st Level Category | 2nd Level Category | H1 | H2 | H3 |
|---|---|---|---|---|
| Residence | Residential area | 41.4% | 14% | 44.9% |
| Leisure | Green space and square | 26.1% | 47.8% | 26.1% |
| Workplace | Commercial facilities, Industrial, Transportation and Administration and public service | 51.6% | 18.2% | 30.2% |
Table 5.
Temporal variations of functional regions’ interactions based on O/D points.
| Time Periods | ZGC | WJ | ||||||||
| WJ | XD | GM | ZGC | Total | ZGC | XD | GM | WJ | Total | |
| 06:00–08:00 | 0.294 | 0.189 | 0.274 | 0.243 | 1 | 0.198 | 0.187 | 0.263 | 0.352 | 1 |
| 11:00–13:00 | 0.206 | 0.197 | 0.372 | 0.226 | 1 | 0.217 | 0.189 | 0.368 | 0.226 | 1 |
| 17:00–19:00 | 0.288 | 0.161 | 0.317 | 0.234 | 1 | 0.199 | 0.158 | 0.311 | 0.333 | 1 |
| 21:00–23:00 | 0.242 | 0.15 | 0.402 | 0.206 | 1 | 0.185 | 0.138 | 0.412 | 0.264 | 1 |
| Time Periods | XD | GM | ||||||||
| ZGC | WJ | GM | XD | Total | ZGC | WJ | XD | GM | Total | |
| 06:00–08:00 | 0.235 | 0.313 | 0.278 | 0.174 | 1 | 0.223 | 0.306 | 0.175 | 0.295 | 1 |
| 11:00–13:00 | 0.217 | 0.224 | 0.367 | 0.192 | 1 | 0.254 | 0.21 | 0.175 | 0.361 | 1 |
| 17:00–19:00 | 0.212 | 0.307 | 0.293 | 0.188 | 1 | 0.200 | 0.316 | 0.151 | 0.333 | 1 |
| 21:00–23:00 | 0.183 | 0.263 | 0.389 | 0.165 | 1 | 0.187 | 0.255 | 0.15 | 0.408 | 1 |
© 2018 by the authors. Licensee MDPI, Basel, Switzerland. This article is an open access article distributed under the terms and conditions of the Creative Commons Attribution (CC BY) license (http://creativecommons.org/licenses/by/4.0/).
Share and Cite
MDPI and ACS Style
Wang, Y.; Gu, Y.; Dou, M.; Qiao, M. Using Spatial Semantics and Interactions to Identify Urban Functional Regions. ISPRS Int. J. Geo-Inf. 2018, 7, 130. https://0-doi-org.brum.beds.ac.uk/10.3390/ijgi7040130
AMA Style
Wang Y, Gu Y, Dou M, Qiao M. Using Spatial Semantics and Interactions to Identify Urban Functional Regions. ISPRS International Journal of Geo-Information. 2018; 7(4):130. https://0-doi-org.brum.beds.ac.uk/10.3390/ijgi7040130
Chicago/Turabian StyleWang, Yandong, Yanyan Gu, Mingxuan Dou, and Mengling Qiao. 2018. "Using Spatial Semantics and Interactions to Identify Urban Functional Regions" ISPRS International Journal of Geo-Information 7, no. 4: 130. https://0-doi-org.brum.beds.ac.uk/10.3390/ijgi7040130
Note that from the first issue of 2016, this journal uses article numbers instead of page numbers. See further details here.