A Method of Mining Association Rules for Geographical Points of Interest

1
School of Geographic Spatial Information, University of Information Engineering, Zhengzhou 450000, China
2
The Unit 31682 of Lanzhou, Lanzhou 730000, China
3
Intellectual City Research Institute of Zhengzhou University, Zhengzhou 450000, China
*
Author to whom correspondence should be addressed.
ISPRS Int. J. Geo-Inf. 2018, 7(4), 146; https://0-doi-org.brum.beds.ac.uk/10.3390/ijgi7040146
Submission received: 1 March 2018
/
Revised: 4 April 2018
/
Accepted: 6 April 2018
/
Published: 10 April 2018
Abstract
:Association rule (AR) mining represents a challenge in the field of data mining. Mining ARs using traditional algorithms generates a large number of candidate rules, and even if we use binding measures such as support, reliability, and lift, there are still several rules to keep, and domain experts are needed to extract the rules of interest from the remaining rules. The focus of this paper is on whether we can directly provide rule rankings and calculate the proportional relationship between the items in the rules. To address these two questions, this paper proposes a modified FP-Growth algorithm called FP-GCID (novel FP-Growth algorithm based on Cluster IDs) to generate ARs; in addition, a new method called Mean-Product of Probabilities (MPP) is proposed to rank rules and compute the proportion of items for one rule. The experiment is divided into three phases: the DBSCAN (Density-Based Scanning Algorithm with Noise) algorithm is used to cluster the geographic interest points and map the obtained clusters into corresponding transaction data; FP-GCID is used to generate ARs, which contain cluster information; and MPP is used to choose the best rule based on the rankings. Finally, a visualization of the rules is used to validate whether the two previously stated requirements were fulfilled.
1. Introduction
In the last two decades, association rule (AR) mining has become one of the most important tasks in the field of knowledge discovery. AR mining results have been applied in numerous fields such as urban bus networks [1], intrusion detection [2], recommendation [3], oral cancer [4], and product-service systems [5]. AR mining can be described as follows: let I = {i1, i2, ⋯, im} be a set of items and let D be the transactions of a database, where each transaction T is a set of items in I. An AR can be defined as an implication of the form “X ⇒ Y”, where X ⊆ I, Y ⊆ I, and X ∩ Y = ∅. X is called the antecedent of the rule, and Y is called the consequent of the rule. The rule can be interpreted as “if itemset X occurs in a transaction, then itemset Y will also likely occur in the same transaction”.
The main algorithms for mining ARs are Apriori and FP-Growth. The Apriori-based algorithm first proposed by Agrawal et al. [6], which is the most popular AR mining algorithm, employs breadth-first search and tree structures to calculate candidate itemsets in two phases [7]. The first phase extracts frequent itemsets from transactional databases. These frequent itemsets are detected using user-defined parameters, for example, minimum support, or min _sup. The second phase finds ARs among the frequent itemsets. Minimum confidence, or min _conf, which is also a user-specified parameter, is employed for the discovery process. FP-Growth is a well-known and frequently used itemset mining algorithm and was first introduced by Han et al. [8,9,10] for avoiding candidate generation to decrease memory requirements and to reduce the mining search space. The greatest advantage of this method is that it compresses all transactions of the database into a frequent pattern tree, which contains information associated with the itemsets. Frequent patterns are generated by recursively searching a conditional FP-tree.
In general, mining algorithms produce a large number of ARs, but not all of them are useful to you, which requires us to discover the rules of interest. Interestingness has become increasingly important since the inception of the field of data mining [11]. Two types of interestingness factors have been developed: objective and subjective interestingness factors [12]. Subjective interestingness factors [13,14] are user driven in the sense that they require user domain knowledge, and objective interestingness factors [15,16] are said to be data driven and consider data cardinalities [17]. However, we want to determine not only the qualitative rules but also the quantitative rules, which could be used to determine the best rule from numerous rules and to obtain the proportion of items in one rule. This is the motivation behind this paper.
The application of clustering algorithms to mining ARs is also a common method. This paper uses DBSCAN (Density-Based Scanning Algorithm with Noise) [18], which is widely known for finding clusters with arbitrary shapes. The algorithm is applied in various fields such as spatial travel pattern recognition [19], gene expression [20], and hotspot distribution [21]. DBSCAN has two input parameters, namely, ϵ—the radius of the neighborhood and µ—the density threshold, which is the minimum number of points required in the neighborhood of a core object. These two parameters assist users in finding acceptable clusters.
As mentioned above, Apriori and FP-Growth are the two primary methods used for mining association rules, and the result of using these two methods is the production of a large number of rules; even if we use a large number of constraints for filtering, such as support, confidence, and lift, considerable numbers of rules need to be retained. To determine which of these remaining rules is the most interesting requires that domain experts make subjective choices. The starting point of this paper is to determine whether we can directly provide the ranking of the associated rules and reduce human intervention by field experts. The Mean-Product of Probabilities (MPP) algorithm given below will attempt to solve this problem.
The main work of this paper is to propose a method of mining ARs for geographical points of interest in order to find the relationship between geographic points of interest, including quantitative relationships. This method mainly includes three stages. The first stage uses the DBSCAN algorithm to cluster the geographical interest points and then maps the generated cluster to the transaction data; at the same time, each of the transaction data contains its corresponding cluster information. The second stage modifies the FP-Growth algorithm. The FP-Tree can contain the cluster information of the node item in the construction, and the FP-GCID algorithm is used to generate the association rules and uses the reliability and the rule type to filter the generated rules. The third stage constructs the MPP algorithm and uses the algorithm to determine the quantitative ranking of the remaining rules. Rules with higher ranks are of greater interest. At the same time, the MPP algorithm can also yield the proportions of the best rules.
2. Literature Review
This section briefly reviews related literature. Section 2.1 provides the development of the study of the FP-Growth algorithm. Section 2.2 reviews the various types of interestingness measures that are used to find the most useful rule pattern.
2.1. Analysis of FP-Growth Approaches
Because of its advantage resulting from the use of two scans, FP-Growth has become especially popular, and numerous researchers have made various improvements to the method. Lin et al. [22] proposed the IFP-Growth algorithm, which improves the performance of the FP-Growth algorithm based on three factors: the introduction of a FP-tree with reduced complexity, less recursive conditional FP-tree building, and lower memory requirements. Liu et al. [23] and Hu and Chen [24] focused on mining ARs with multiple minimum supports. The latter work incorporated two improvements based on the former work. First, they proposed a novel frequent itemset mining algorithm called CFP-Growth. The algorithm is based on MIS-tree, which is similar to the FP-tree structure and stores crucial information about frequent patterns. Second, compared to conventional single-minimum support, which increases the difficulty for users when setting appropriate thresholds, each item can have its own minimum support. The advantage of this algorithm is that it scans the transactional database only once. Lin et al. [25] employed a utility mining [26,27] strategy called a high-utility pattern tree, or HUP-tree, to reconstruct the FP-tree by considering costs, profits, and other measures. In addition, the HUP-growth algorithm was proposed to generate high-utility patterns. Leung et al. [28] developed an FP-tree-based algorithm called FPS that buries the succinct constraints deep inside the mining process. Lin et al. [29] proposed an MCFP-tree based on the FP-tree to discover rule patterns with multiple constraints.
A compressed and arranged transaction sequence tree, or CATS-tree, was introduced by Cheung and Zaïane [30]. To construct the CATS-tree, the database is scanned once, and all the transaction information is compressed on the tree, therein generating frequent patterns with multi-support constraints. Koh and Shieh [31] developed the AFPIM algorithm, or Adjusting FP-tree for Incremental Mining algorithm. The algorithm swaps the FP-tree construction when the transaction database is updated. By combining the above two algorithms, Leung et al. [32] proposed a novel tree structure, called the canonical-order tree, or CanTree, that captures the content of the transaction database and orders tree nodes according to a canonical order. Tanbeer et al. [33] presented a novel tree structure called CP-tree (compact pattern tree) that scans a database only once and produces the same effect as the FP-tree. The CP-tree is constructed using a branch-by-branch method, called the branch sorting method, that dynamically produces a highly compact frequent-descending tree structure. Moreover, the CP-tree exhibits a superior performance in incremental mining and interactive mining tasks.
2.2. Analysis of Approaches to Interestingness Measures
Numerous ARs will be generated in frequent itemset mining. To determine which rules are interesting, various types of methods have been developed to measure interestingness. Lan et al. [34] developed a novel and effective associative classification approach by combining the intensity of implication and dilated chi-square with an existing associative classification algorithm. The former interestingness measure was proposed to find meaningful ARs, and the latter was used to reveal the interdependence between conditions and class variables. Malhas and Al Aghbari [35] presented an AR ranking approach called the sensitivity measure, which determines a sensitivity by evaluating the uncertainty-increasing potential based on Bayesian belief networks. Mutual information is used to measure such uncertainties. The drawback of this approach is that it requires background knowledge from the user. Vo and Le [36] proposed a new approach to mining interesting ARs by combining lattice and hash tables, therein providing increased effectiveness over methods using only hash tables. Shaharanee et al. [37] proposed a systematic framework for ascertaining generated ARs by incorporating a data mining algorithm with statistical measurement techniques such as redundancy analysis, sampling, and multivariate statistical analysis to discard non-significant rules. Ohsaki et al. [38] compared a total of 40 interestingness measures through experiments using clinical datasets. Using an f-measure and correlation coefficient, the experiments estimated a medical expert’s interest based on the performance of each interestingness measure.
2.3. Analysis of Mining Association Rules with Clustering
Combining clustering and classic AR mining is another effective way to improve the efficiency of AR mining. These clustering algorithms include k-means [39], DBSCAN [40], hypergraph mapping [41,42], and bitmap mapping [43]. Zhao et al. [39] used partitioning clustering (k-means) to filter large ARs discovered using the Apriori algorithm, and most uninteresting rules were removed. Therefore, domain experts can make a decision from a small set of rules. Lee et al. [40] presented a framework for mining point of interest (PoI) associations. Density-based DBSCAN was used to cluster PoI patterns from massive geo-tagged photos with tourist city backgrounds and to generate three kinds of PoI patterns: global level, local level, and categorization. PoI associations were then found using the Apriori algorithm. Zaki et al. [42] presented a new and efficient algorithm to discover ARs. The algorithm partitions itemsets into equivalence classes and constructs the equivalence class graph without comparing generated candidates with the Apriori algorithm. Based on the graph, maximal uniform hypergraph clique clustering was proposed to find potential frequent itemsets. Three lattice traversal schemes were used to search the final ‘true’ frequent itemsets. Han et al. [41] mapped a large number of generated ARs onto hypergraphs and partitioned the hypergraphs with the hMETIS [44] algorithm to find the most frequent itemset clusters. Differing from hypergraph mapping, Lent et al. [43] mapped the set of two-attribute ARs onto a two-dimensional space grid. The grid was converted to a monochrome bitmap represented by 0s and 1s. Employing bitwise operations, the paper utilized the BitOp algorithm to enumerate clusters and to filter the clusters until no clusters remained.
If the association rule mining is divided into four stages, transaction data preparation, frequent item mining, rule generation, and rule filtering, the paper [40] and [42] belong to the second stage, the paper [41] and [43] are in the third stage, and the paper [39] is in the fourth stage. The DBSCAN algorithm used in this paper is in the first stage, and its purpose is to generate the transaction data needed for association rule mining.
3. Methodology
This section introduces our preliminary works, which form the theoretical basis of the following experiments. The following sub-sections are organized as follows: A novel frequent itemset algorithm, called FP-GCID, is introduced in Section 3.1. Section 3.2 introduces the mean-product of probabilities, which is used to rank rules.
3.1. FP-GCID
Only the qualitative relationship between two rules can be obtained by traditional frequent pattern growth algorithms. Therefore, achieving quantitation relations based on qualitative relations represents an interesting real-world problem. Thus, this is our motivation for improving the FP-Growth algorithm.
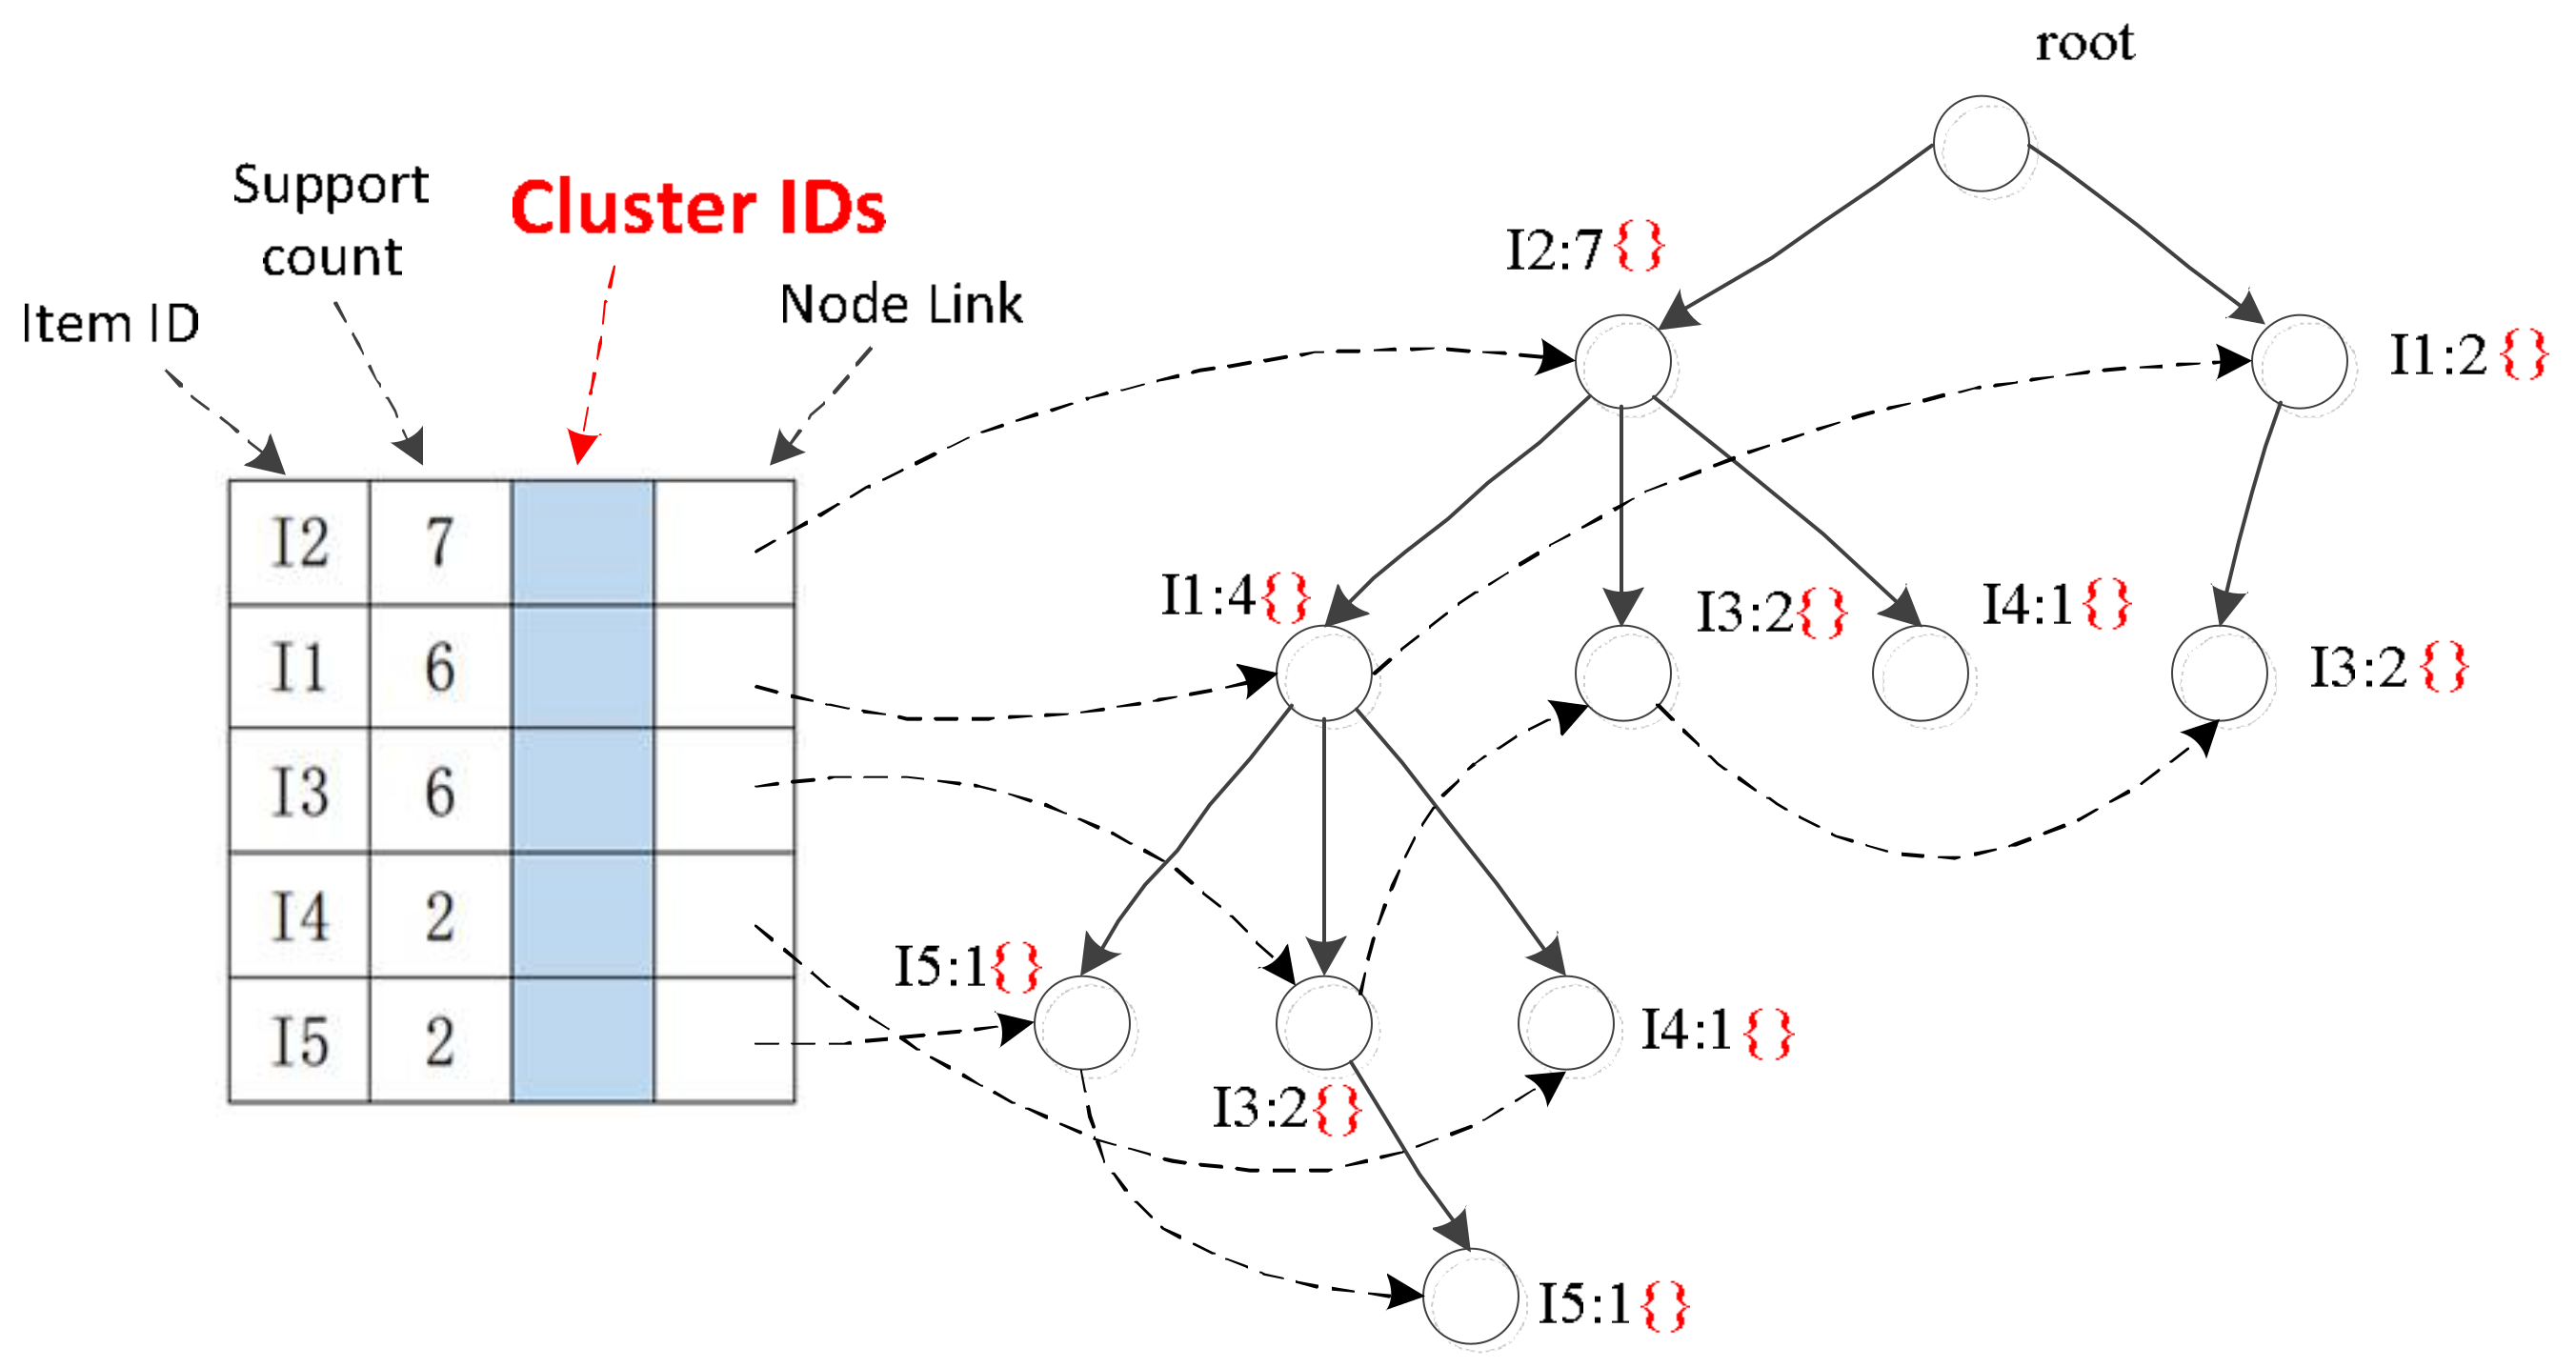
FP-GCID is a novel FP-Growth algorithm based on Cluster IDs, as shown in Figure 1. In the table on the left side of Figure 1, we insert a new column between column 2 and column 3, namely, ‘Cluster IDs’. This column stores the IDs of clusters. Moreover, we rebuild the FP-Tree, as shown in the tree on the right-hand side of Figure 1. The red brackets contain cluster IDs corresponding to the nodes.
“Why do we insert cluster IDs into nodes or leafs?” To answer this question, we refer back to our initial motivation for writing this paper: We provide a quantitative description while mining qualitative ARs. Therefore, how to rank ARs is a key aspect of our research. Saving the cluster IDs greatly facilitates the subsequent mining steps, which will be detailed in Section 4. Experiment.
3.2. Mean-Product of Probabilities (MPP)
This section will present a ranking algorithm for the rule mean-product of probabilities (MPP) (the MPP is interpreted as averaging and multiplying probability values derived from the calculation of in Equation (3)). Three definitions are proposed to calculate the rule generated by frequent patterns. Definition 1 is a basic definition of the concept. Definition 2 is used to calculate the percentage of itemsets in all clusters. Definition 3 reveals how to calculate the rank values for ARs.
Definition 1.
We define A = {a1, a2, ⋯, an} as an itemset vector and T = {t1, t2, ⋯, tm} as a transaction dataset in a database, where transaction tj is included in itemset A, tj ⊆ A. Define C = {c1, c2, ⋯, cm} as a cluster vector, where cluster cj contains kinds of items expressed as , and is a subset of A, . Thus, we have (here, the meaning of equivalent to tj is that a collection of the types of all items in a cluster represents the transaction data, the process of equivalence will be show in Section 4.1). Let |ai| denote the count of item ai, then, |cj| is the total of items in cluster cj.
Definition 2.
Let P = [Pa1, Pa2, ⋯, Pan]T be a probability vector of the itemset, where Pai = [paic1, paic2, ⋯, paicm] is the i-th item’s probability of all clusters. We can obtain the probability of the i-th item of the j-th cluster as
where |ai|cj is the quantity of the i-th item in the j-th cluster, and |cj| is the quantity of the j-th cluster.
Example 1.
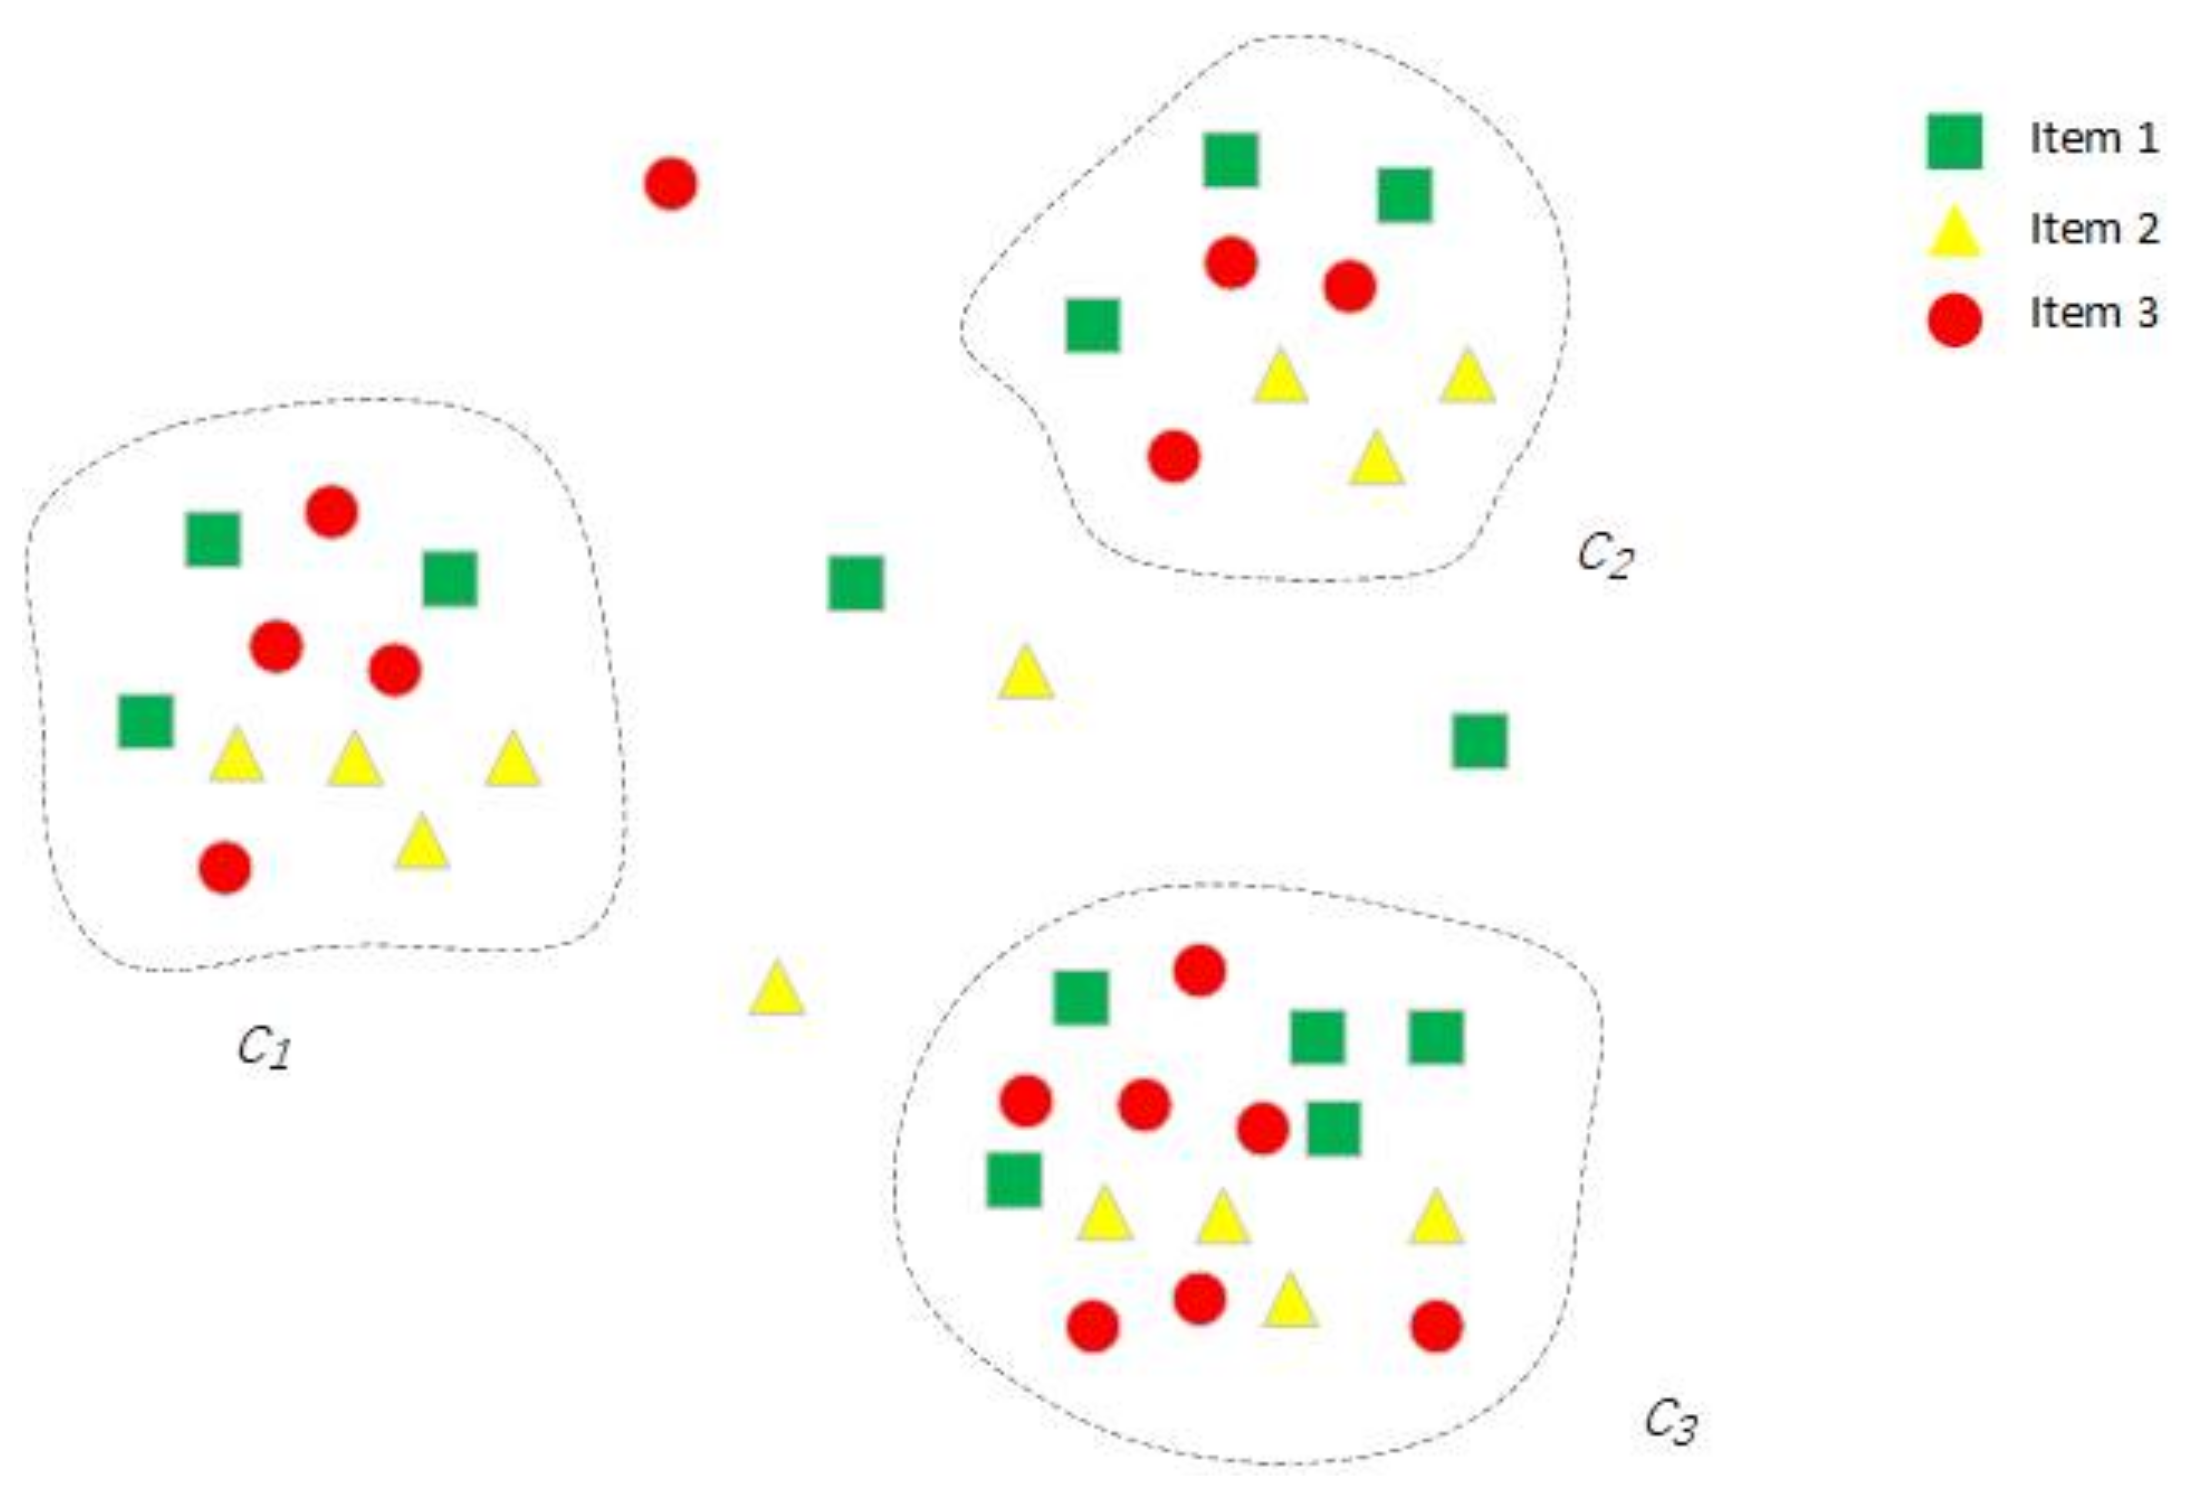
Figure 2 illustrates clusters that have three items, i.e., A = {Item1, Item2, Item3}, and C = {c1}. We choose the cluster c1 as an example. The number of each item is {|Item1|, |Item2|, |Item3| = {3,4,4}, and the total items in cluter c1 is |c1| = 11. Then, according to formula 1, we can obtain the probabilities of items in: .
According to Example 1, we can describe Definition 2 as computing the proportion of one item in one cluster.
Definition 3.
R:{R1, R2, ⋯, Rh} is the vector of ARs, Rk is the k-th rule and is combined with , and , where k ∈ [1, ⋯, h], , is the antecedent, . is the consequent, and belongs to C. The corresponding details are as follows:
Notice that there is only one item in consequent . This will be explained in the experimental section. represents the rank values of ARs, and the value of the -th rule is
where , is the probability of the antecedent, and is the probability of the consequent.
Example 2.
Let us assume that there exists a rule , or , where , and ; here, are also represented by , respectively. We can obtain the following:
- For the count for , there is only one cluster; therefore, ;
- For the probability of the antecedent, ;
- For the probability of the consequent, ;
- For the rank value of the first rule, .
According to Example 2, we can describe Definition 3. as computing the quantitative order of ARs.
4. Experiment and Analysis
All our experiments were implemented on a Lenovo IdeaPad Y400 (Intel Core i7-3630QM 2.4 GHz, 8 GB RAM) made by Lenovo Group in Beijing, China, with Windows 8 China Home Edition, Matlab 2012b (64bit) and ArcGIS 10.2 installed.
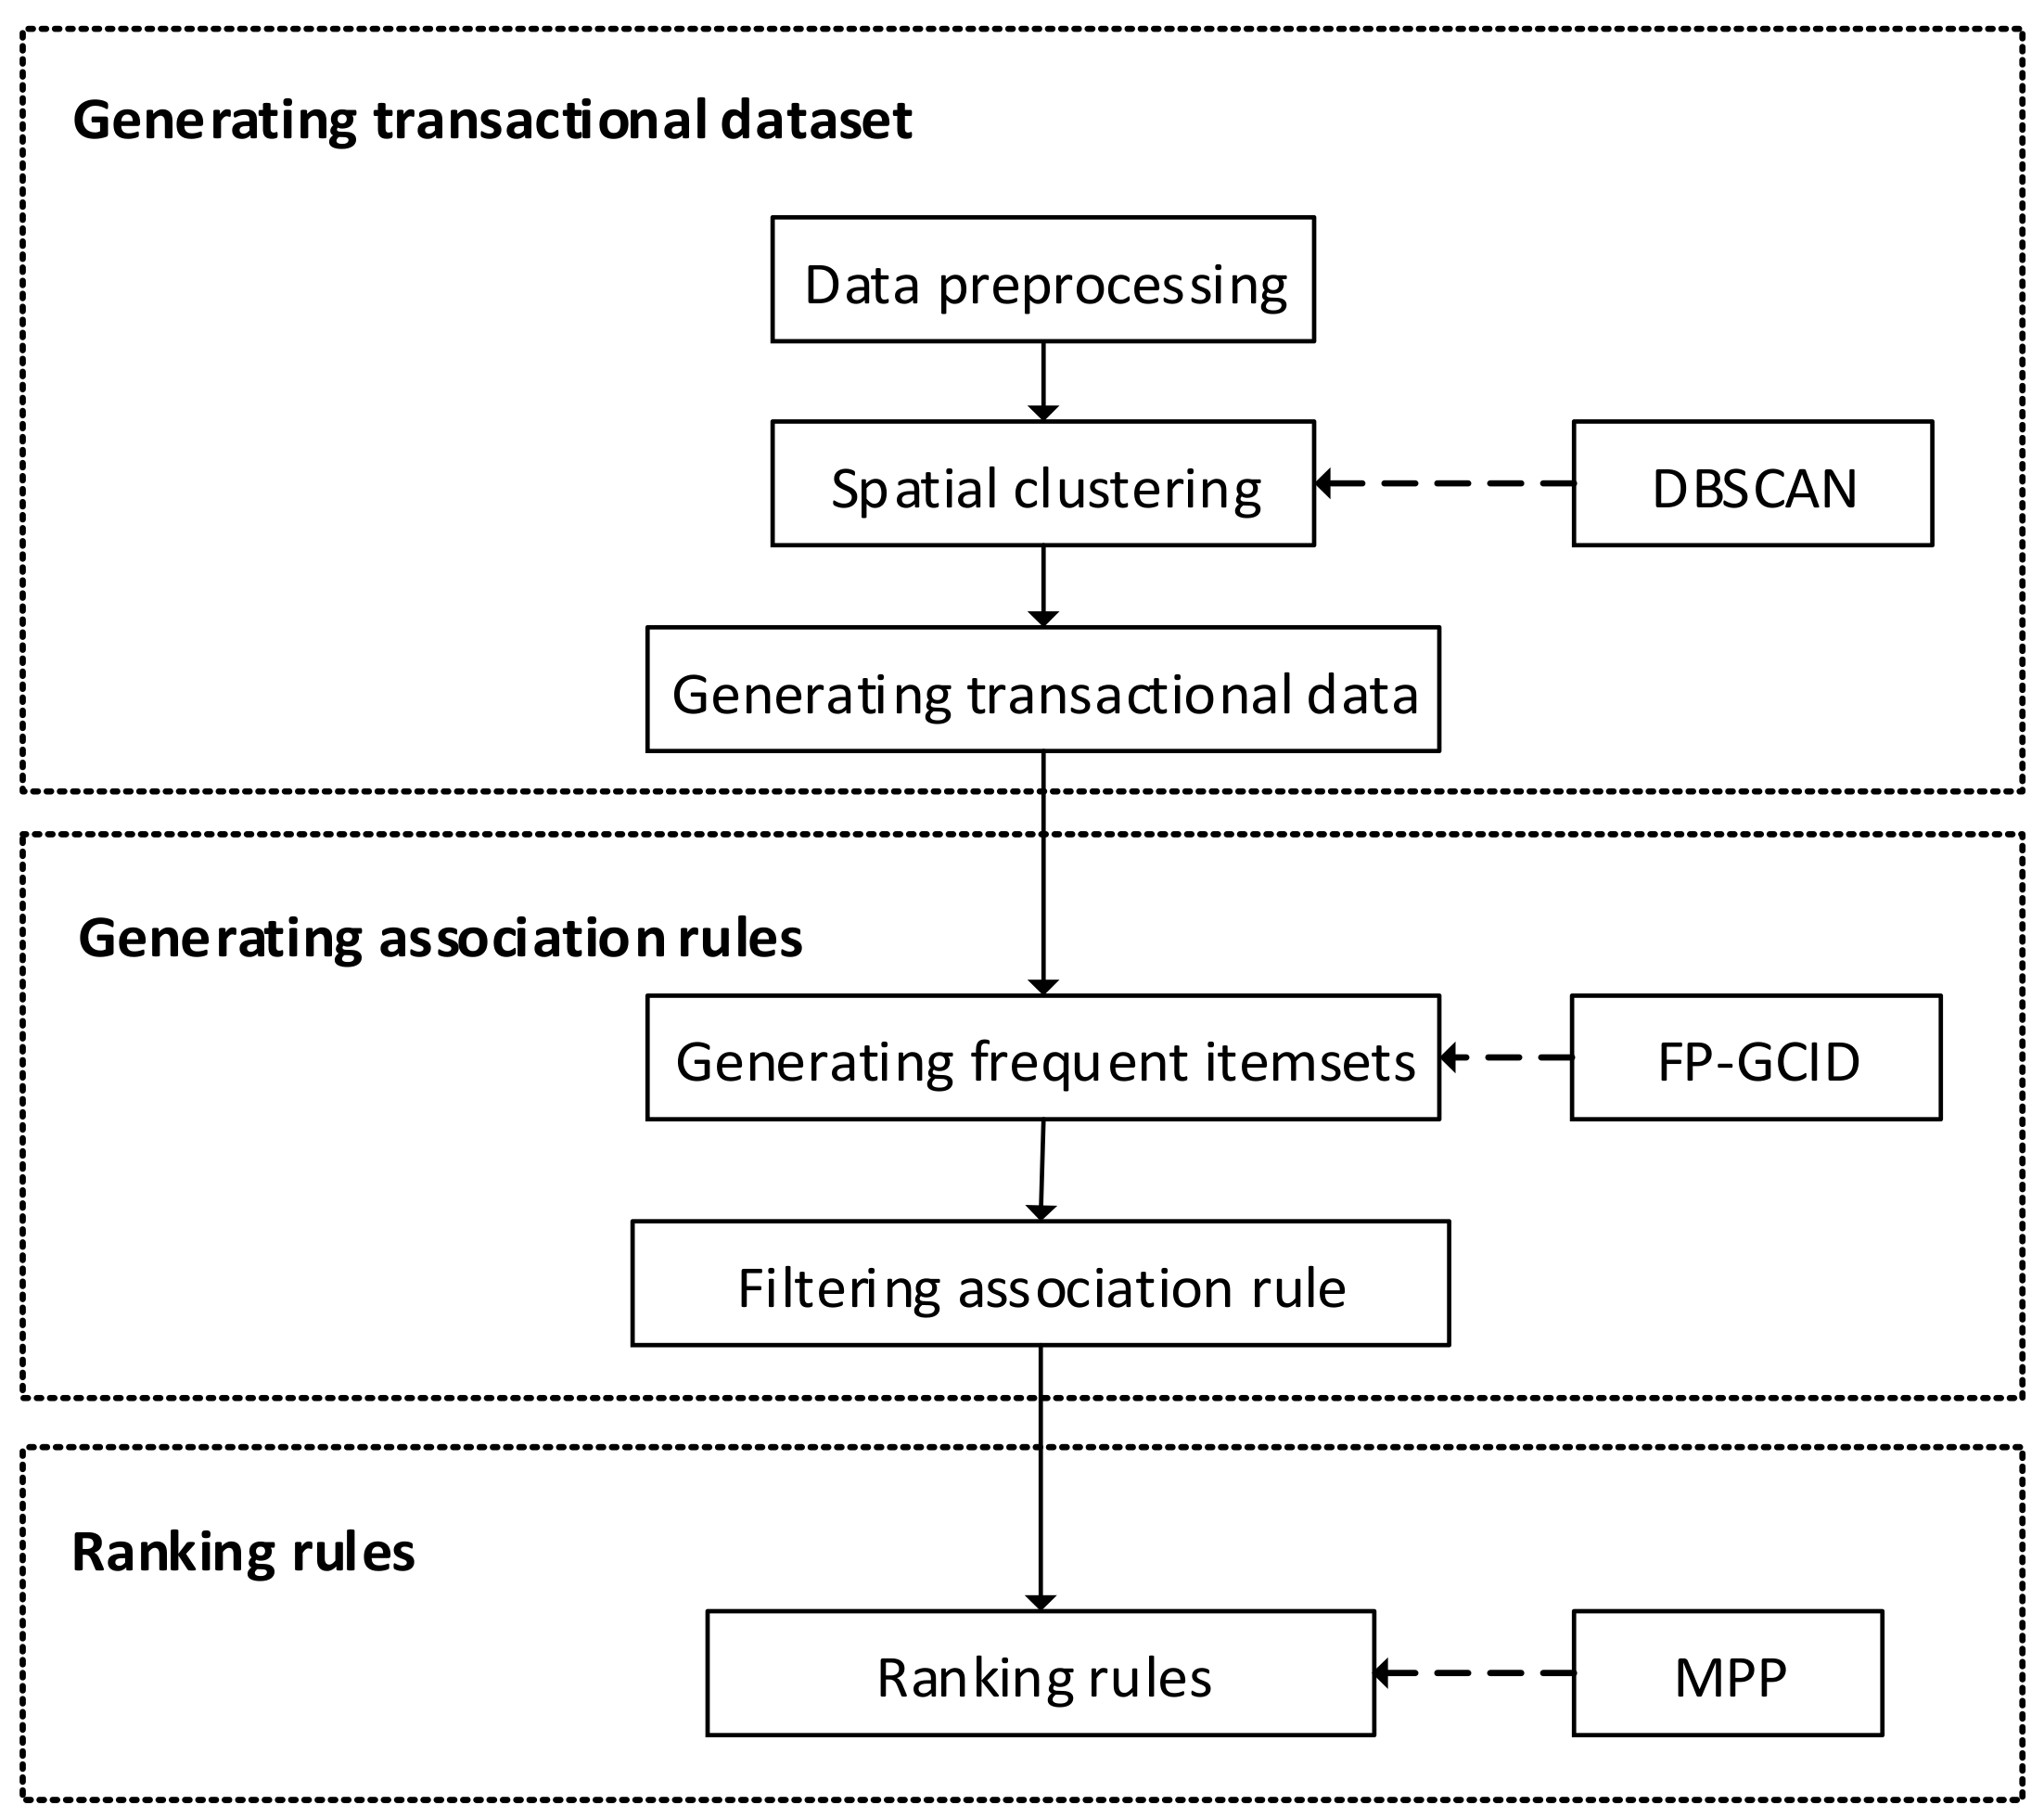
The experiment is divided into three phases (Figure 3). The first phase is used to generate the transactional dataset, which forms the basis for the experiment. This phase includes two sub-phases: preprocessing and spatial clustering. ARs are generated in the second phase by the FP-GCID algorithm, which is an improved version of the FP-Growth algorithm. Minimum confidence is used to filter uninteresting rules. The third phase is used to measure interestingness rules via the MPP approach.
4.1. Generating Transactional Datasets with DBSCAN
4.1.1. Data Preparation
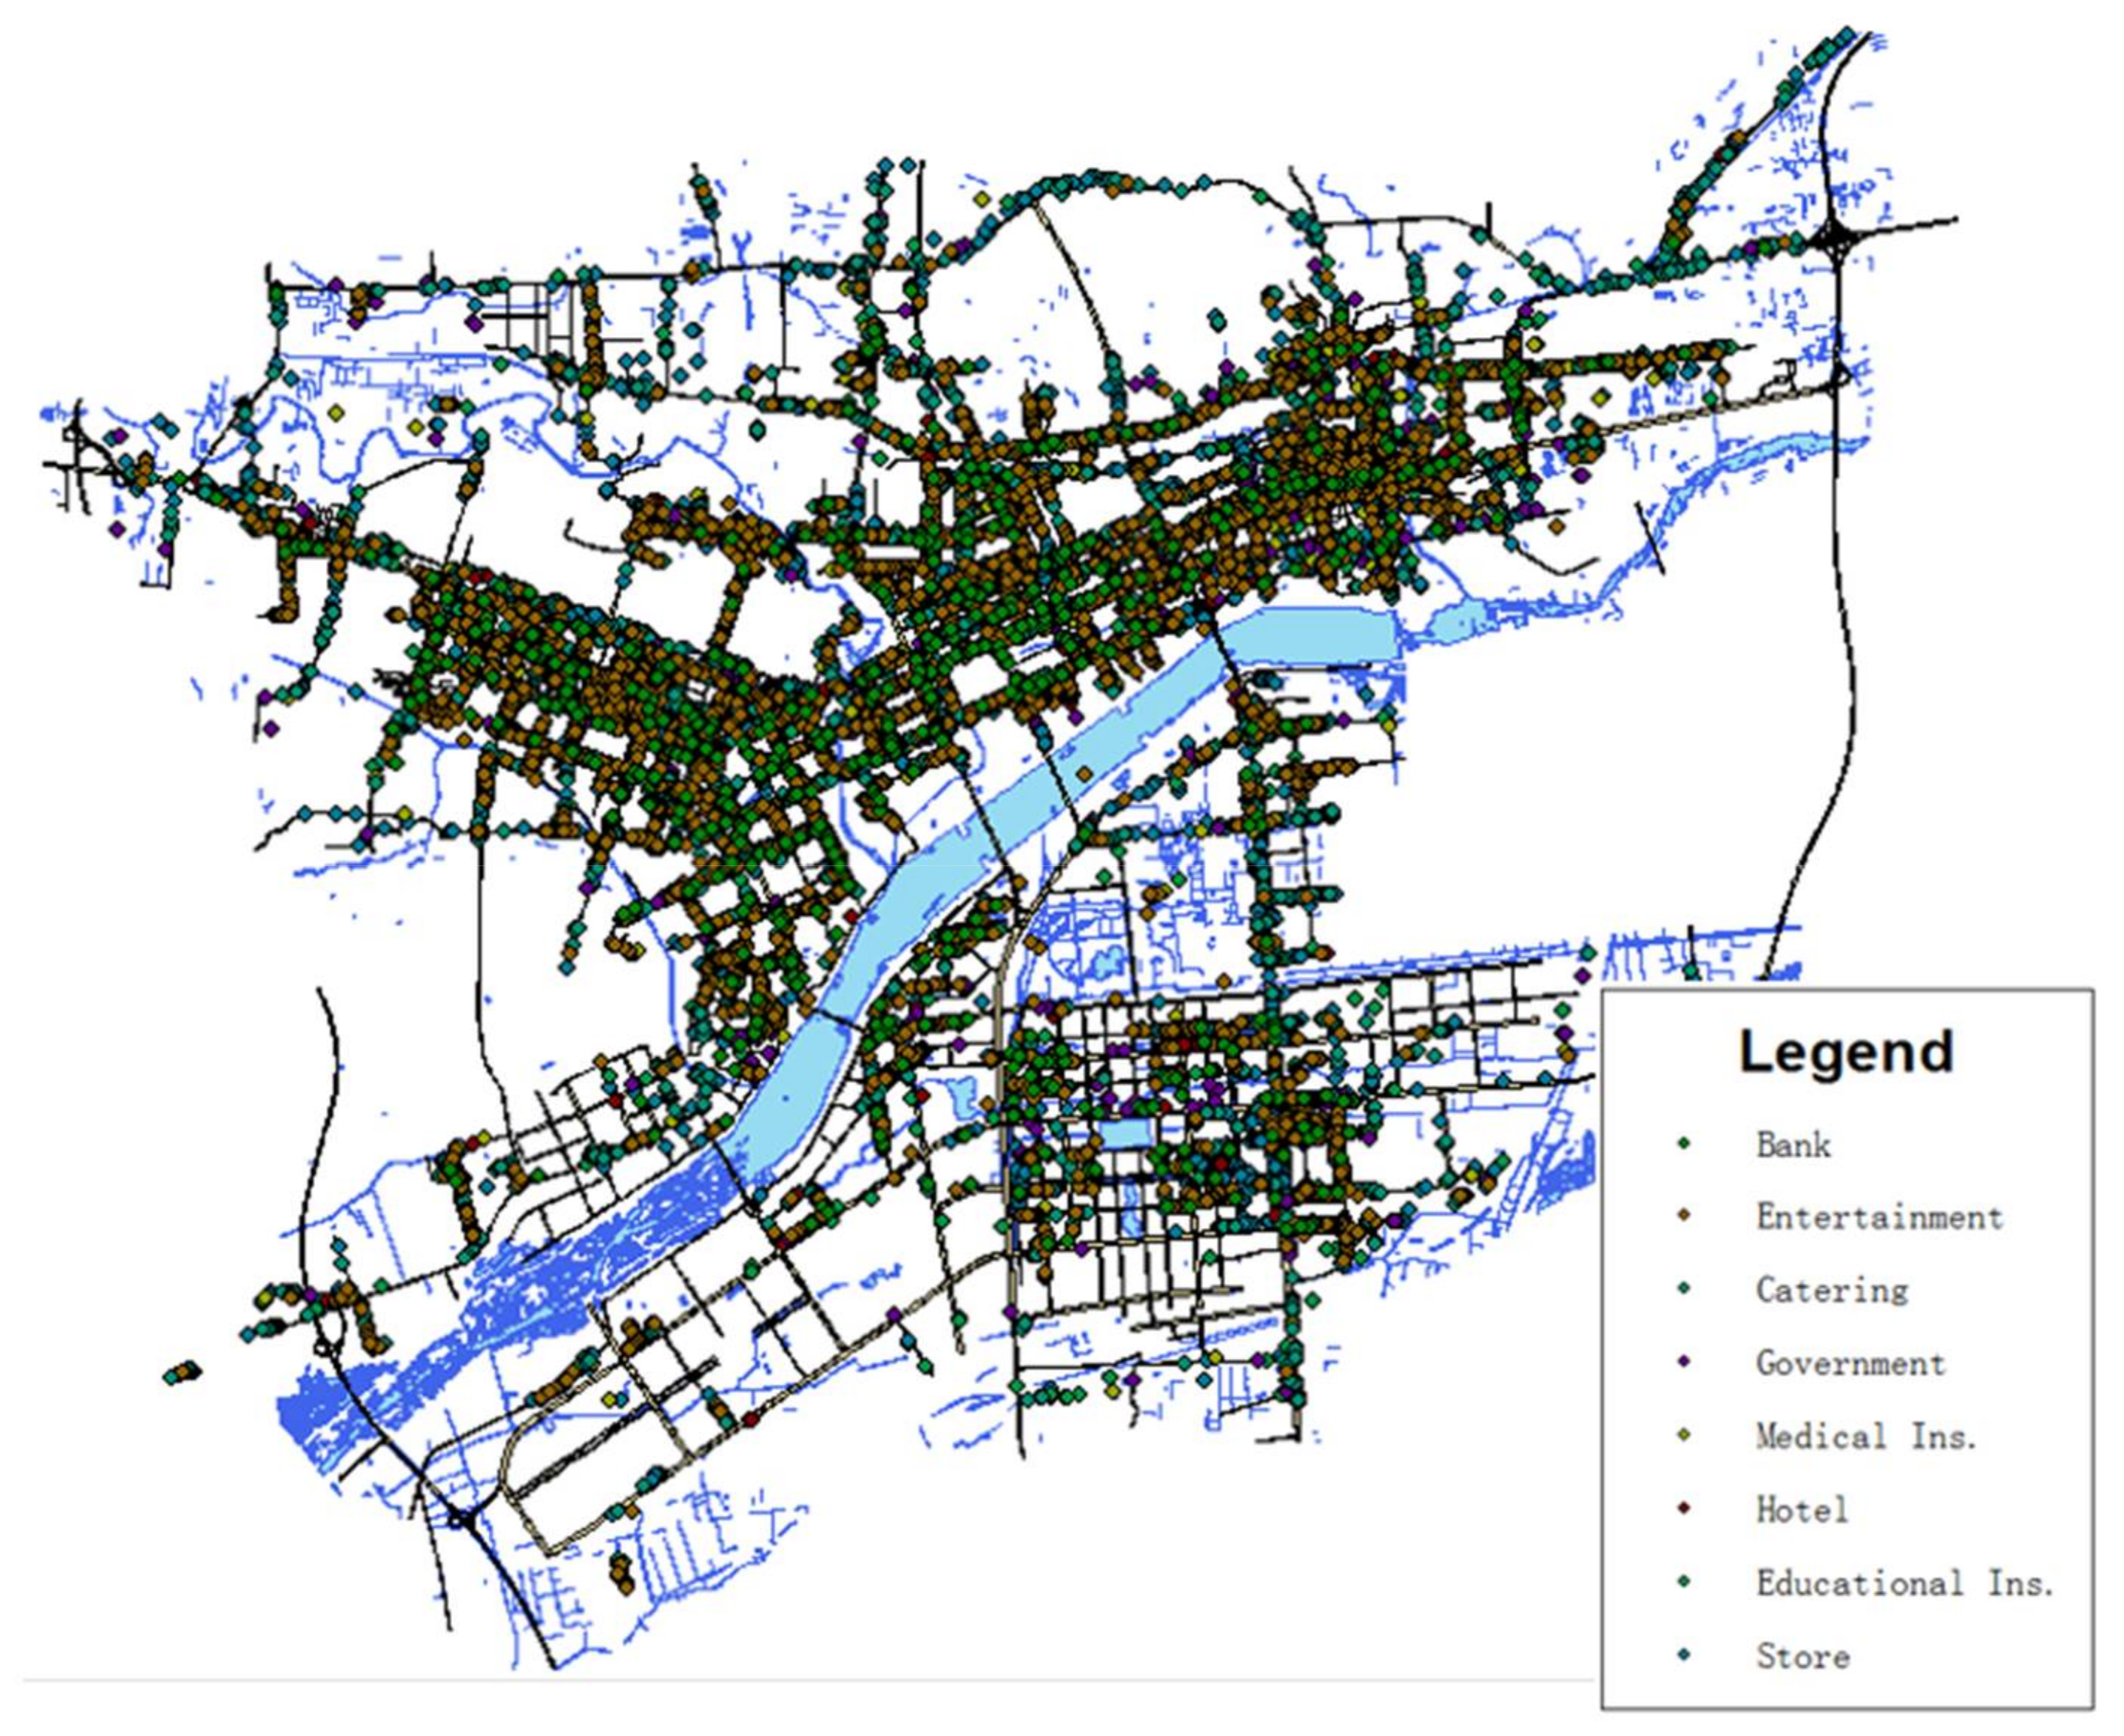
The experimental object is the urban shops in Luoyang, China. All the data were provided by the Urban Planning Bureau of Luoyang. There are eight types of items, as shown in
Table 1: Catering, Bank, Entertainment, Store, Educational Institution, Hotel, Government, and Medical Institution. In addition, there are over ten thousand shops.
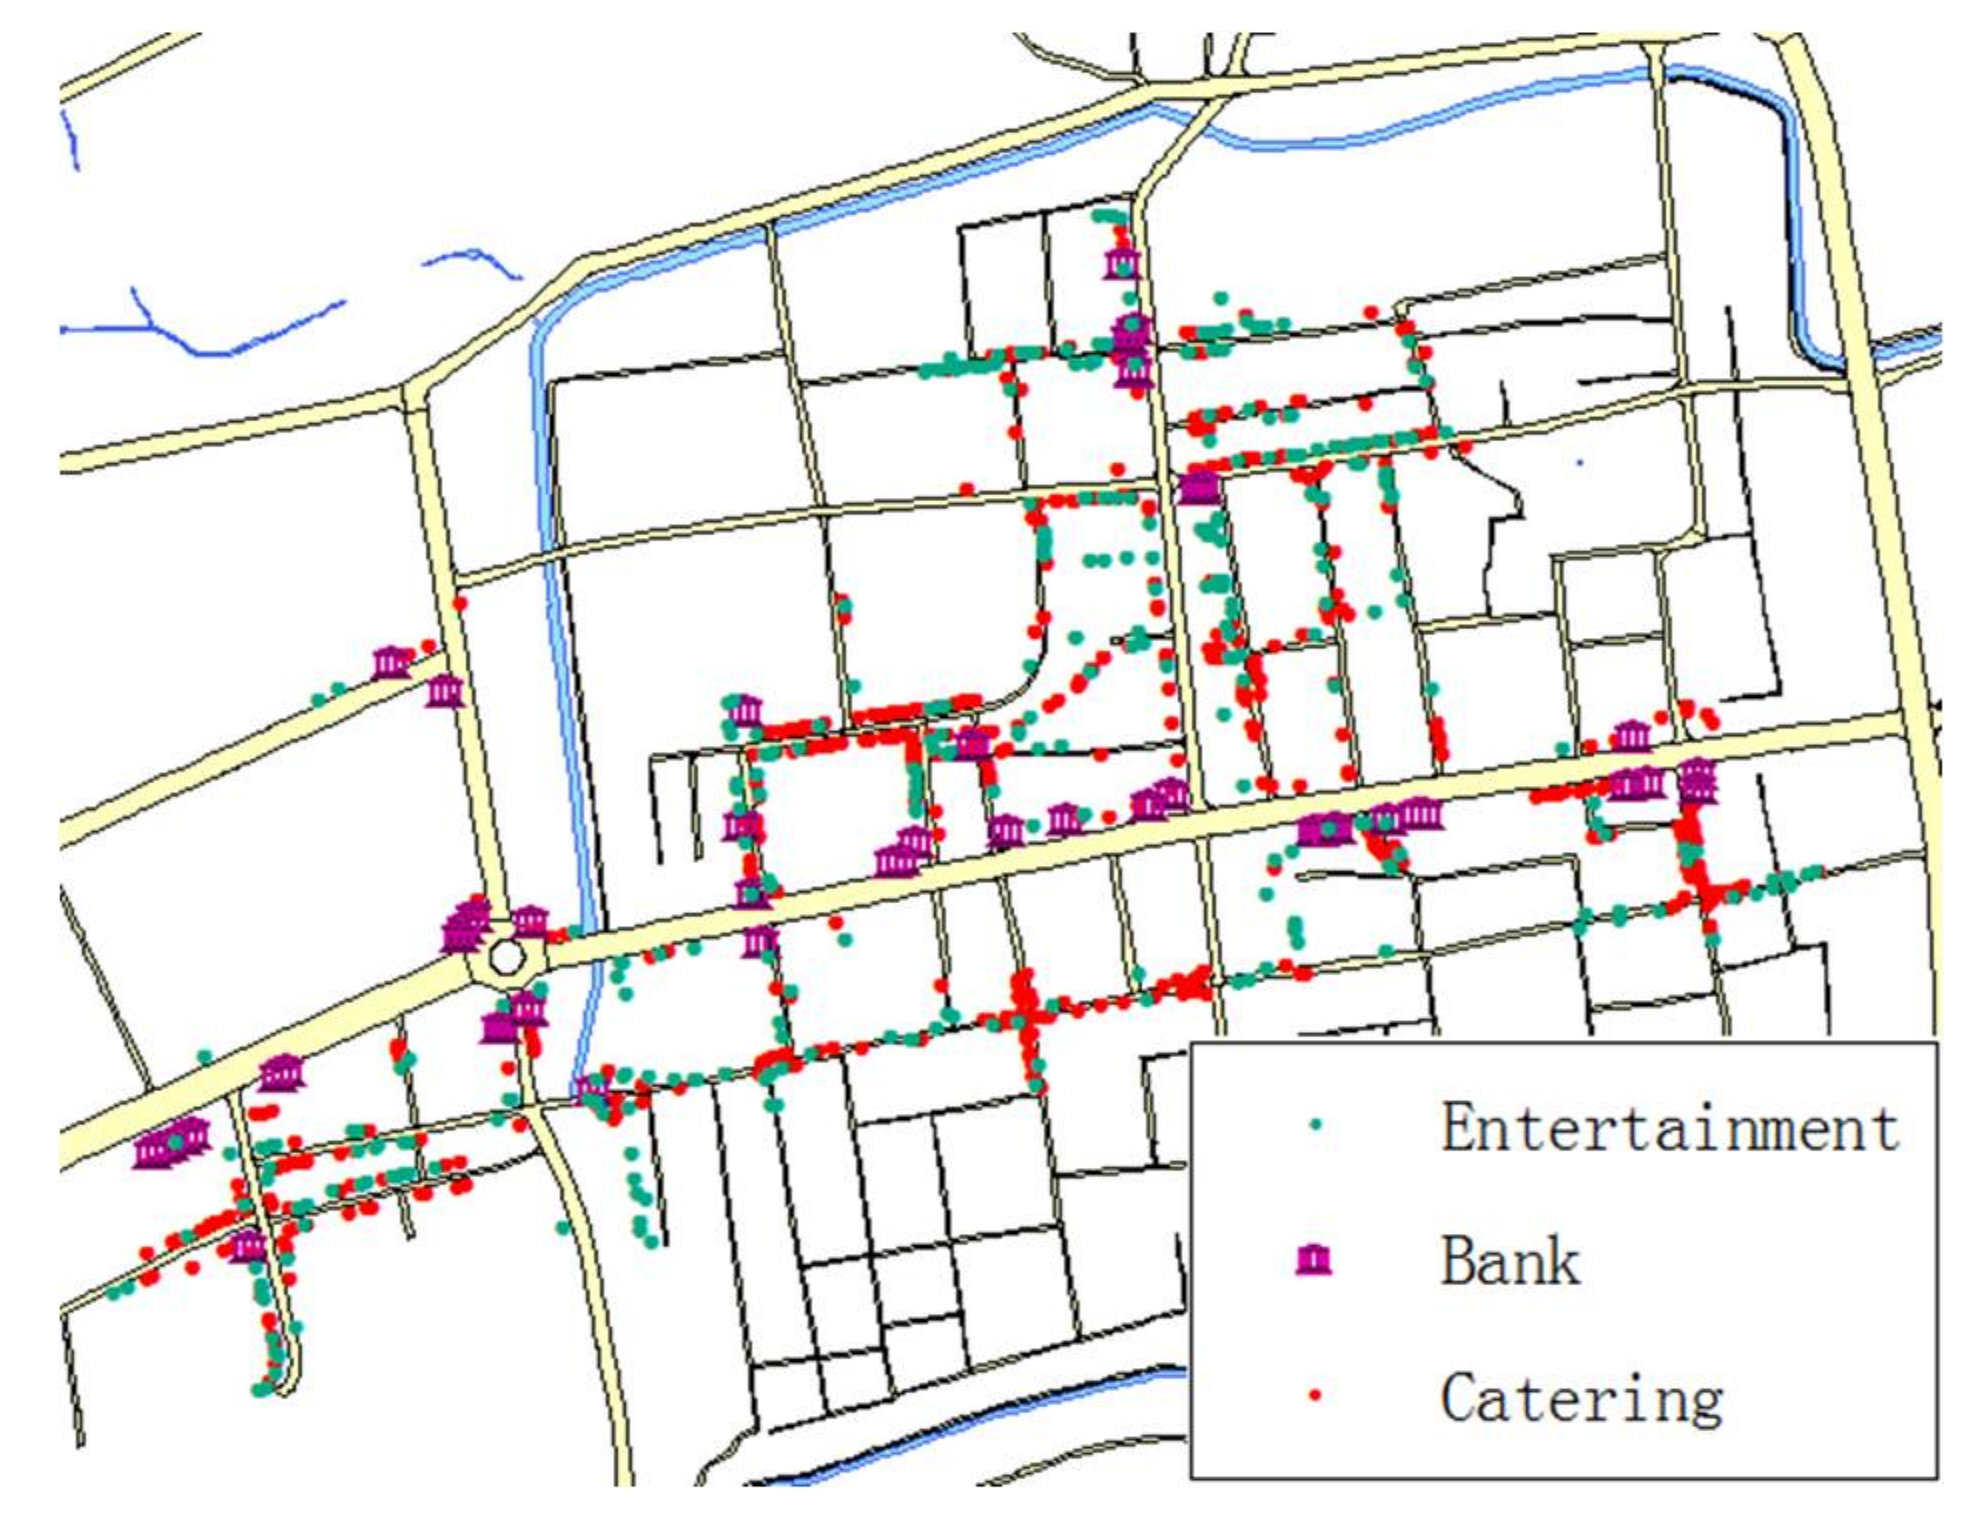
Figure 4 shows all the data objects for Luoyang City.
4.1.2. Spatial Clustering with DBSCAN
If we want to mine frequent patterns, a large number of itemsets should be used. The purpose of this section is to generate the itemsets in preparation for the latter section and phases.
As stated above, the target data contain coordinate information. Therefore, we can use the spatial similarity of data points to generate the clusters. Each cluster contains many data points, which belong to different items. In addition, the items in one cluster are regarded as one item of transaction data; therefore, the number of clusters is the number of transactional data sets.
Our data sets concern urban shops; position information depends on, for example, road distributions and building structures. In other words, the distribution of urban shops is arbitrary; therefore, we can take full advantage of this characteristic of rural data and adopt the DBSCAN algorithm to construct the transactional data sets.
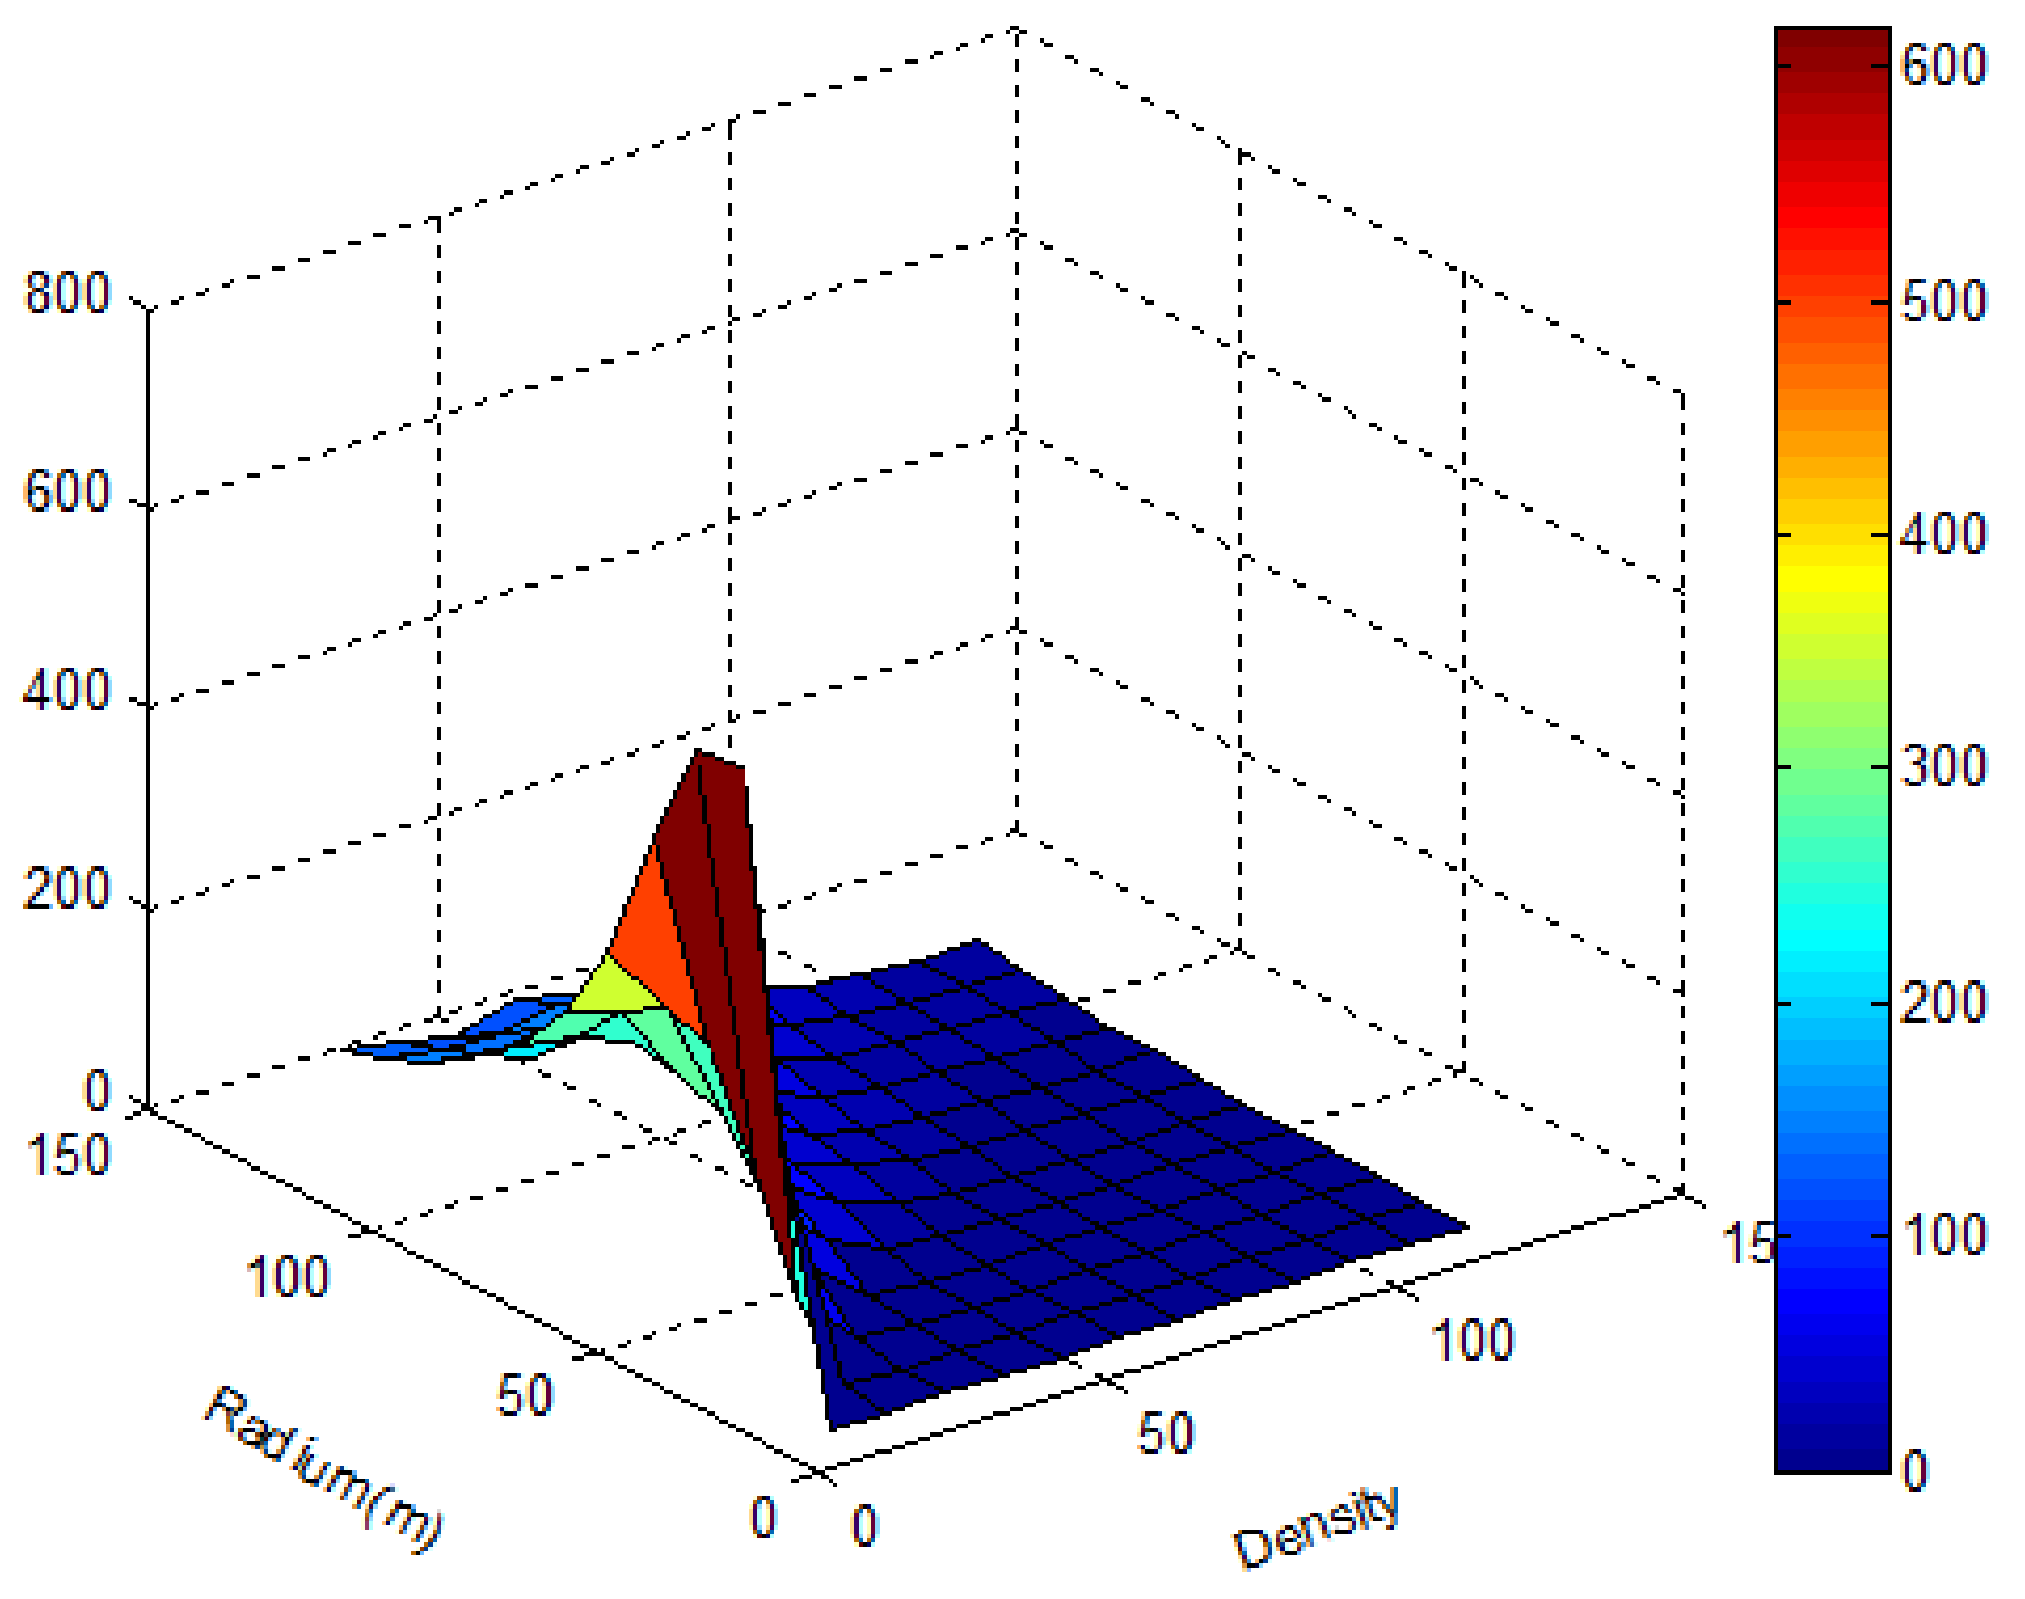
We conducted the experiments with different input parameters. The results are listed in Table 2, which lists the quantities of clusters generated by the DBSCAN algorithm. Figure 5 provides a direct representation of the varieties of the clustering as a function of -radius and -density. Two tendencies can be seen in Table 2 and Figure 5:
- Fixing -radius, the quantity of clusters decreases with increasing density;
- Fixing -density, the quantity of clusters is represented as a single wave shape with increasing radius.
4.1.3. Conversion to Transactional Data
Definition 1 tells us that the collection of the types of all items in a cluster represents one transaction, and one item id contained by the cluster represents one item; therefore, based on the above clustering results, we know that 32 clusters showed in Table 3 were generated, which means that data on 32 transactions were generated.
4.2. Generating Association Rules with FP-GCID
4.2.1. Generating Frequent Itemsets
After clustering via the DBSCAN algorithm, we obtain 32 transactional data items, which is our starting point for subsequent mining tasks. Mining frequent itemsets is the second phase of our experiment. This phase can provide different results using the FP-Growth algorithm because of the inserted cluster IDs. To provide a clear description of this phase, we partition it into three steps, and every step should consider the influence of the inserted cluster IDs.
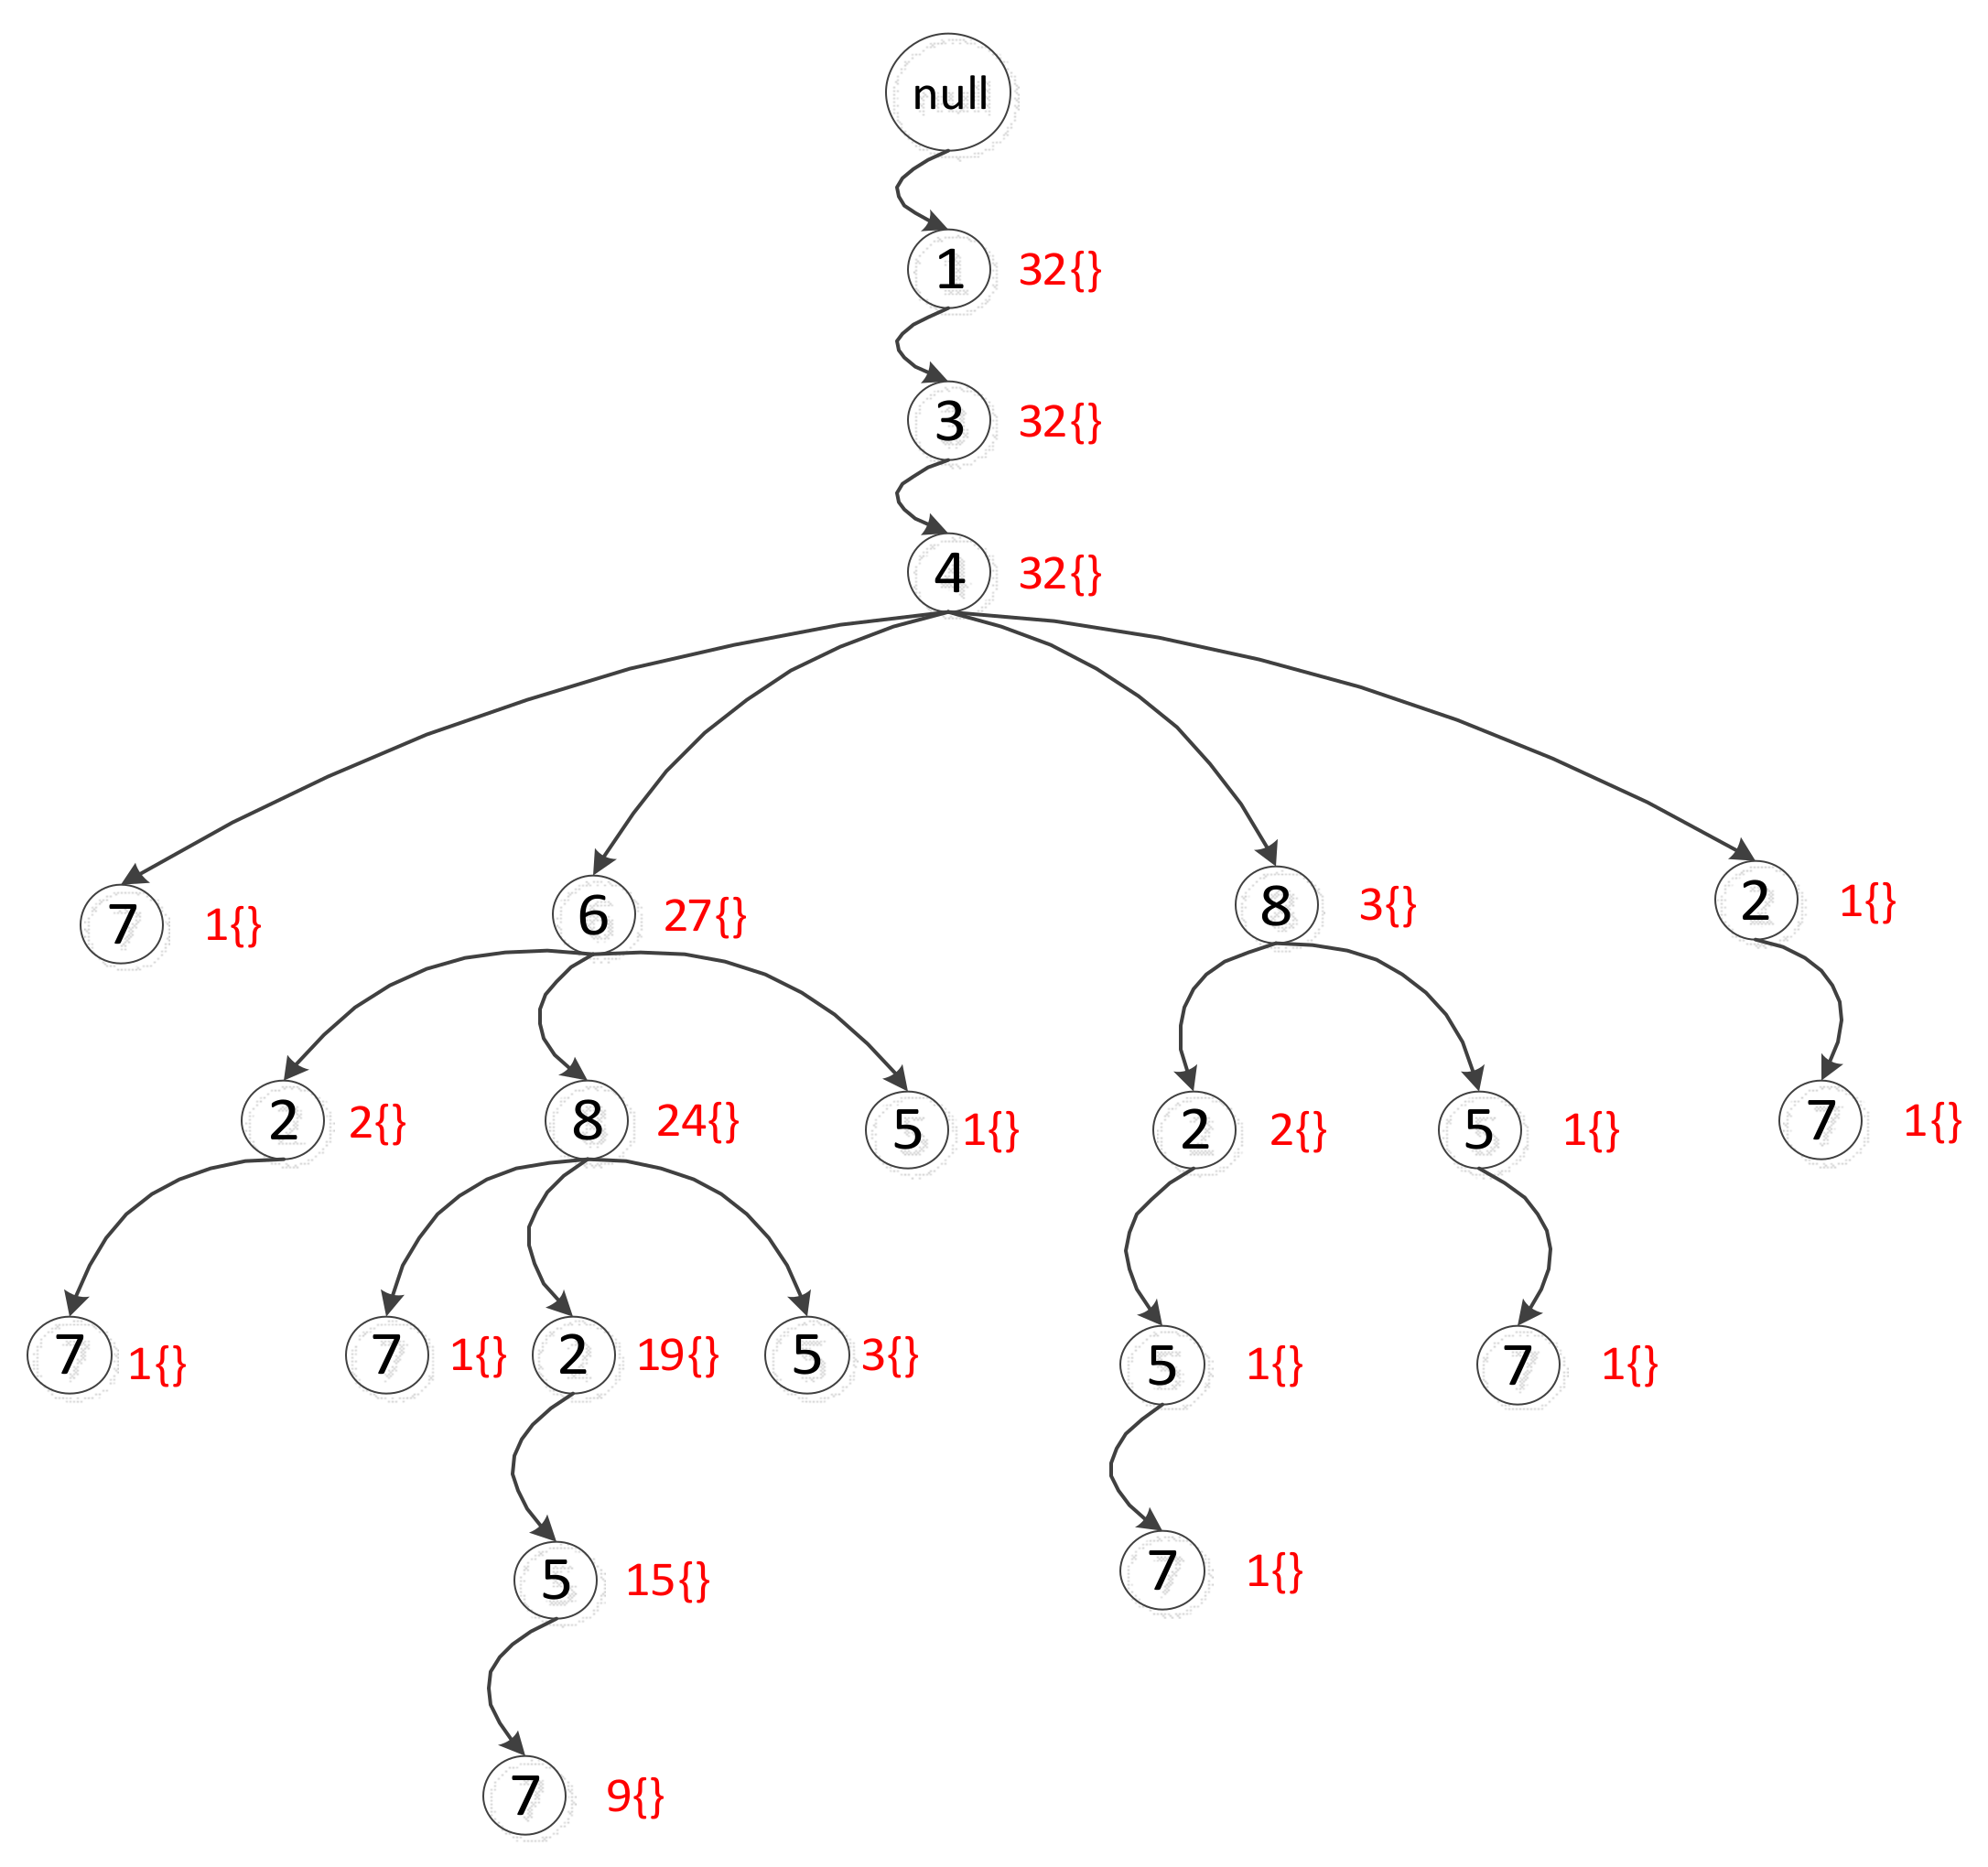
Step 1: Constructing CFP-Tree (Conditional Frequent Pattern Tree). We modify the traditional FP-Growth algorithm as in Figure 7. The nodes contain items (inside the circle). Each node contains the number of this item and the cluster IDs, shown to the right of the nodes. For example, the first node behind the root node represents item 1, and there are 32 transactional data items containing item 1. Specifically, every transactional data item includes item 1. Additionally, the node contains 32 cluster IDs, corresponding to 32 transactional data items. The other nodes are identical.
Step 2: Combining the repeated frequent itemsets. Note that the combining step is also different than that in the FP-Growth algorithm; this step will determine the quality and accuracy of the frequent itemset mining process. Figure 8 provides a sketch of the combination process. Let us suppose that itemset X = {2, 5, 7} is frequent and that there are two frequent itemsets in the CFP-Tree. Therefore, we should combine these repeated itemsets. Taking the second itemset (dotted oval denoted as red 2) as an example, the contained cluster IDs are {12, 25} and {12}, with {12} corresponding to itemset X. We choose item 7’s cluster IDs {12} as the itemset’s cluster IDs as a result of it being the largest minimum number of cluster IDs in this itemset. In other words, we select the bottom item’s cluster IDs in the CFP-Tree as its itemset’s cluster IDs. After this choosing operation, we combine these three itemsets with some complex operations, such as adding the count of the itemsets together, adding the cluster IDs of the itemsets together, and deleting the same cluster IDs in the last itemset.
According to the quantity of transactional data items and the CFP-Tree, we set the minimum support as equal to 15 so that more than 50 percent of the frequent itemsets can be filtered out.
Step 3: Checking the frequent itemsets.
“How do we ensure the quality of the combination?” The checking step is used to ensure the quality of the combinations. Following Step 2, after combining three itemsets, we obtain the terminal itemset {2, 5, 7}, with 10 cluster IDs: {2, 17, 19, 21, 23, 24, 26, 27, 28, 31}. Based on the cluster IDs, we can find the corresponding clusters and verify if they contain this itemset. Table 4 lists the IDs of the items contained in these clusters.
4.2.2. Association Rule Filtering
The objective of filtering is to remove redundant ARs, which we do not want. The filtering process can be divided into two steps:
- Confidence filtering: Because of the excessive number of frequent itemsets, we choose the maximum possible minimum confidence (0.99), that is, only rules with a confidence of greater than 0.99 will be reserved. When no confidence settings are used, there are 1960 ARs. After minimum confidence filtering, there are 360 association rules reserved, occupying only 18.4%.
- Type filtering: There are three types of rules: One-to-Multi, Multi-to-Multi, and Multi-to-One. However, only Multi-to-One is of interest because of its real meaning. After type filtering, only 193 ARs have been reserved.
4.3. Finding Interesting Rules with MPP
The ARs were generated in the previous two sections; they will be ranked in this section using the MPP algorithms. Ranking is the main difference between our algorithm and other AR mining algorithms.
After AR filtering, only 193 rules are reserved. According to Definition 3.3, we cannot rank all the ARs at one time with a single law. Therefore, two laws must be defined before the ranking rules are used:
- The quantities of the antecedent must be the same: According to the numerator of Equation (3), the probability of the antecedent monotonically decreases with the quantity of the antecedent . Therefore, if we want to compare two rules, they must have the same quantities.
- The consequent must be the same: Noting the denominator of Equation (3), the probability of the consequent will make Equation (3) monotonically decrease. Therefore, if we want to compare two rules, they must have the same consequent.
According to the above two laws, we rank the rules with fixed quantities of the antecedent and fixed consequents. Here, we fix the consequent as 1 and the quantity of the antecedent as 2. The results of the rule ranking are shown in Table 5. From Table 5, we find that the probability of the rule ‘2,3-1’ receives the top ranking, and the disparities between the first rule and the other rules are quite obvious.
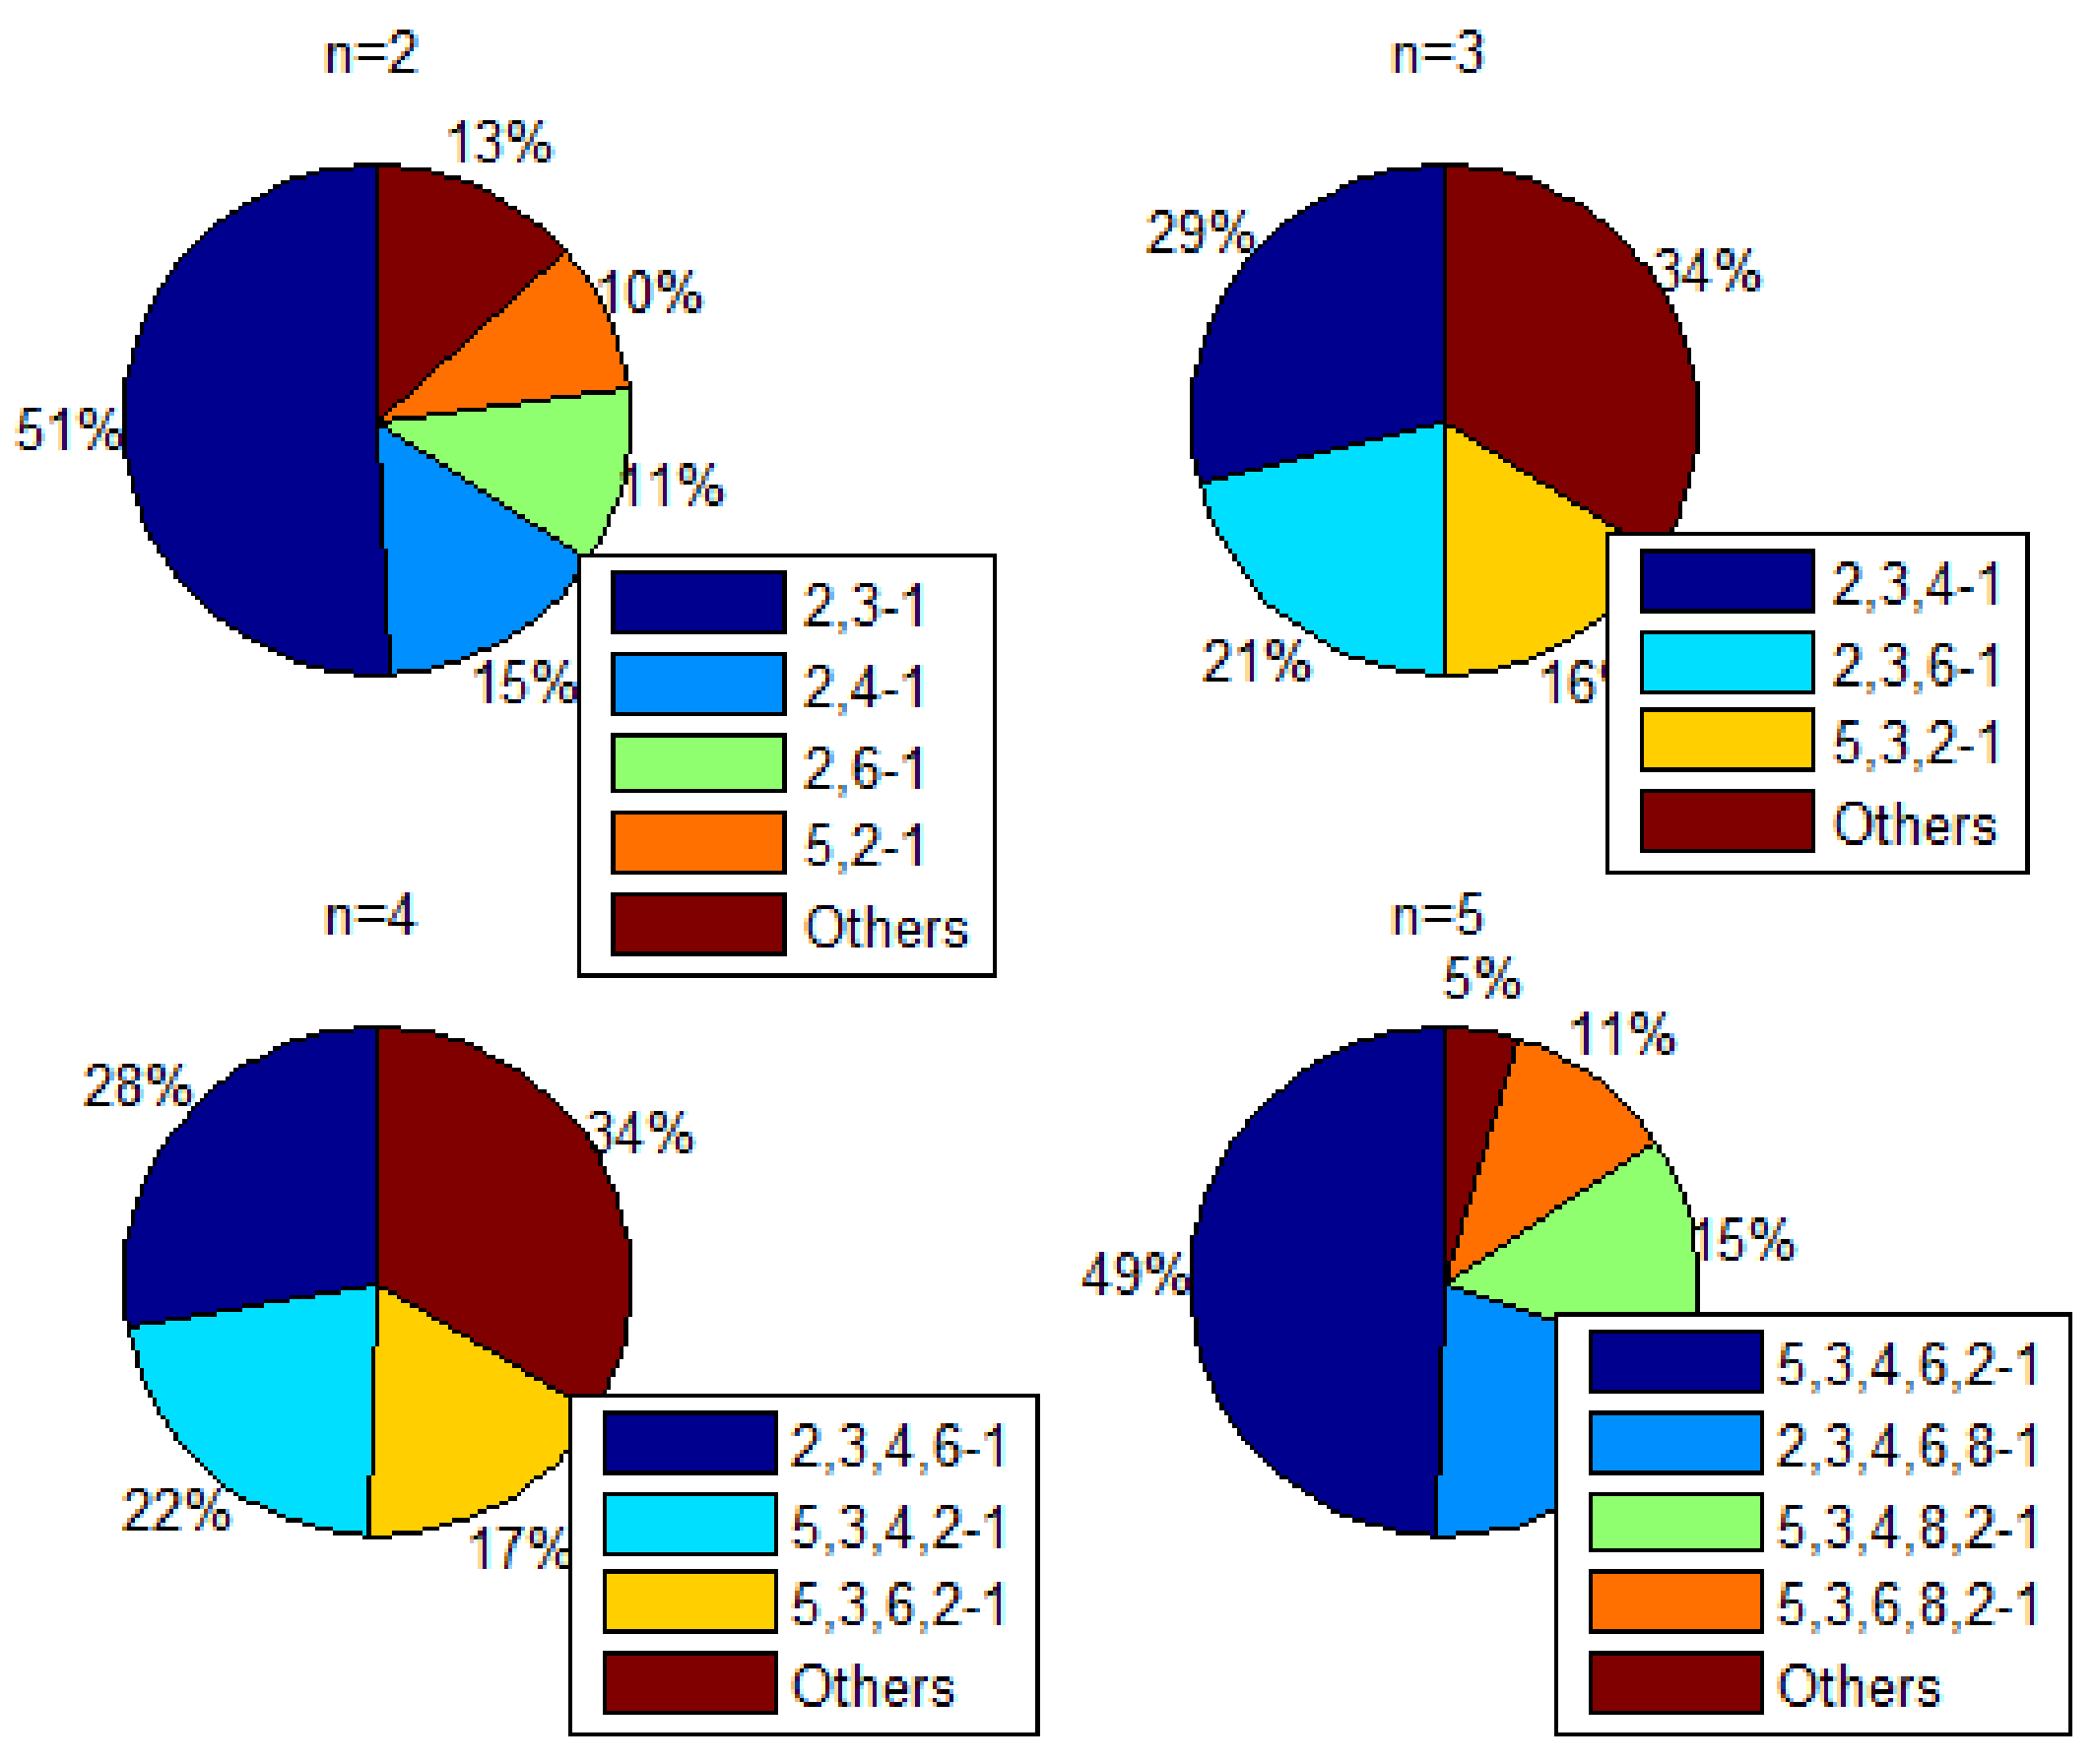
Similar to Table 5, we can find all the best rules corresponding to different quantities of the antecedent with a fixed consequent of 1. Note that the first four rules constitute 77.1 percent of the total probability in Table 5; thus, the other rules can be ignored. Additionally, to provide a better representation, we combine rules that have rank values of less than 0.09, as shown in Figure 9.
Taking (‘n’ represents the number of the antecedent in an association rule) (top-left part of Figure 9) as an example, the first four rules are listed in the legend, and the rule constitutes the largest proportion of rule type , where . Specifically, is the most important rule in with the consequent equaling 1. This indicates that one should be more considerate of nearby banks and entertainment when deploying a restaurant at a point of interest. In addition, following the change of , , . and are our best rules with a fixed consequent of 1.
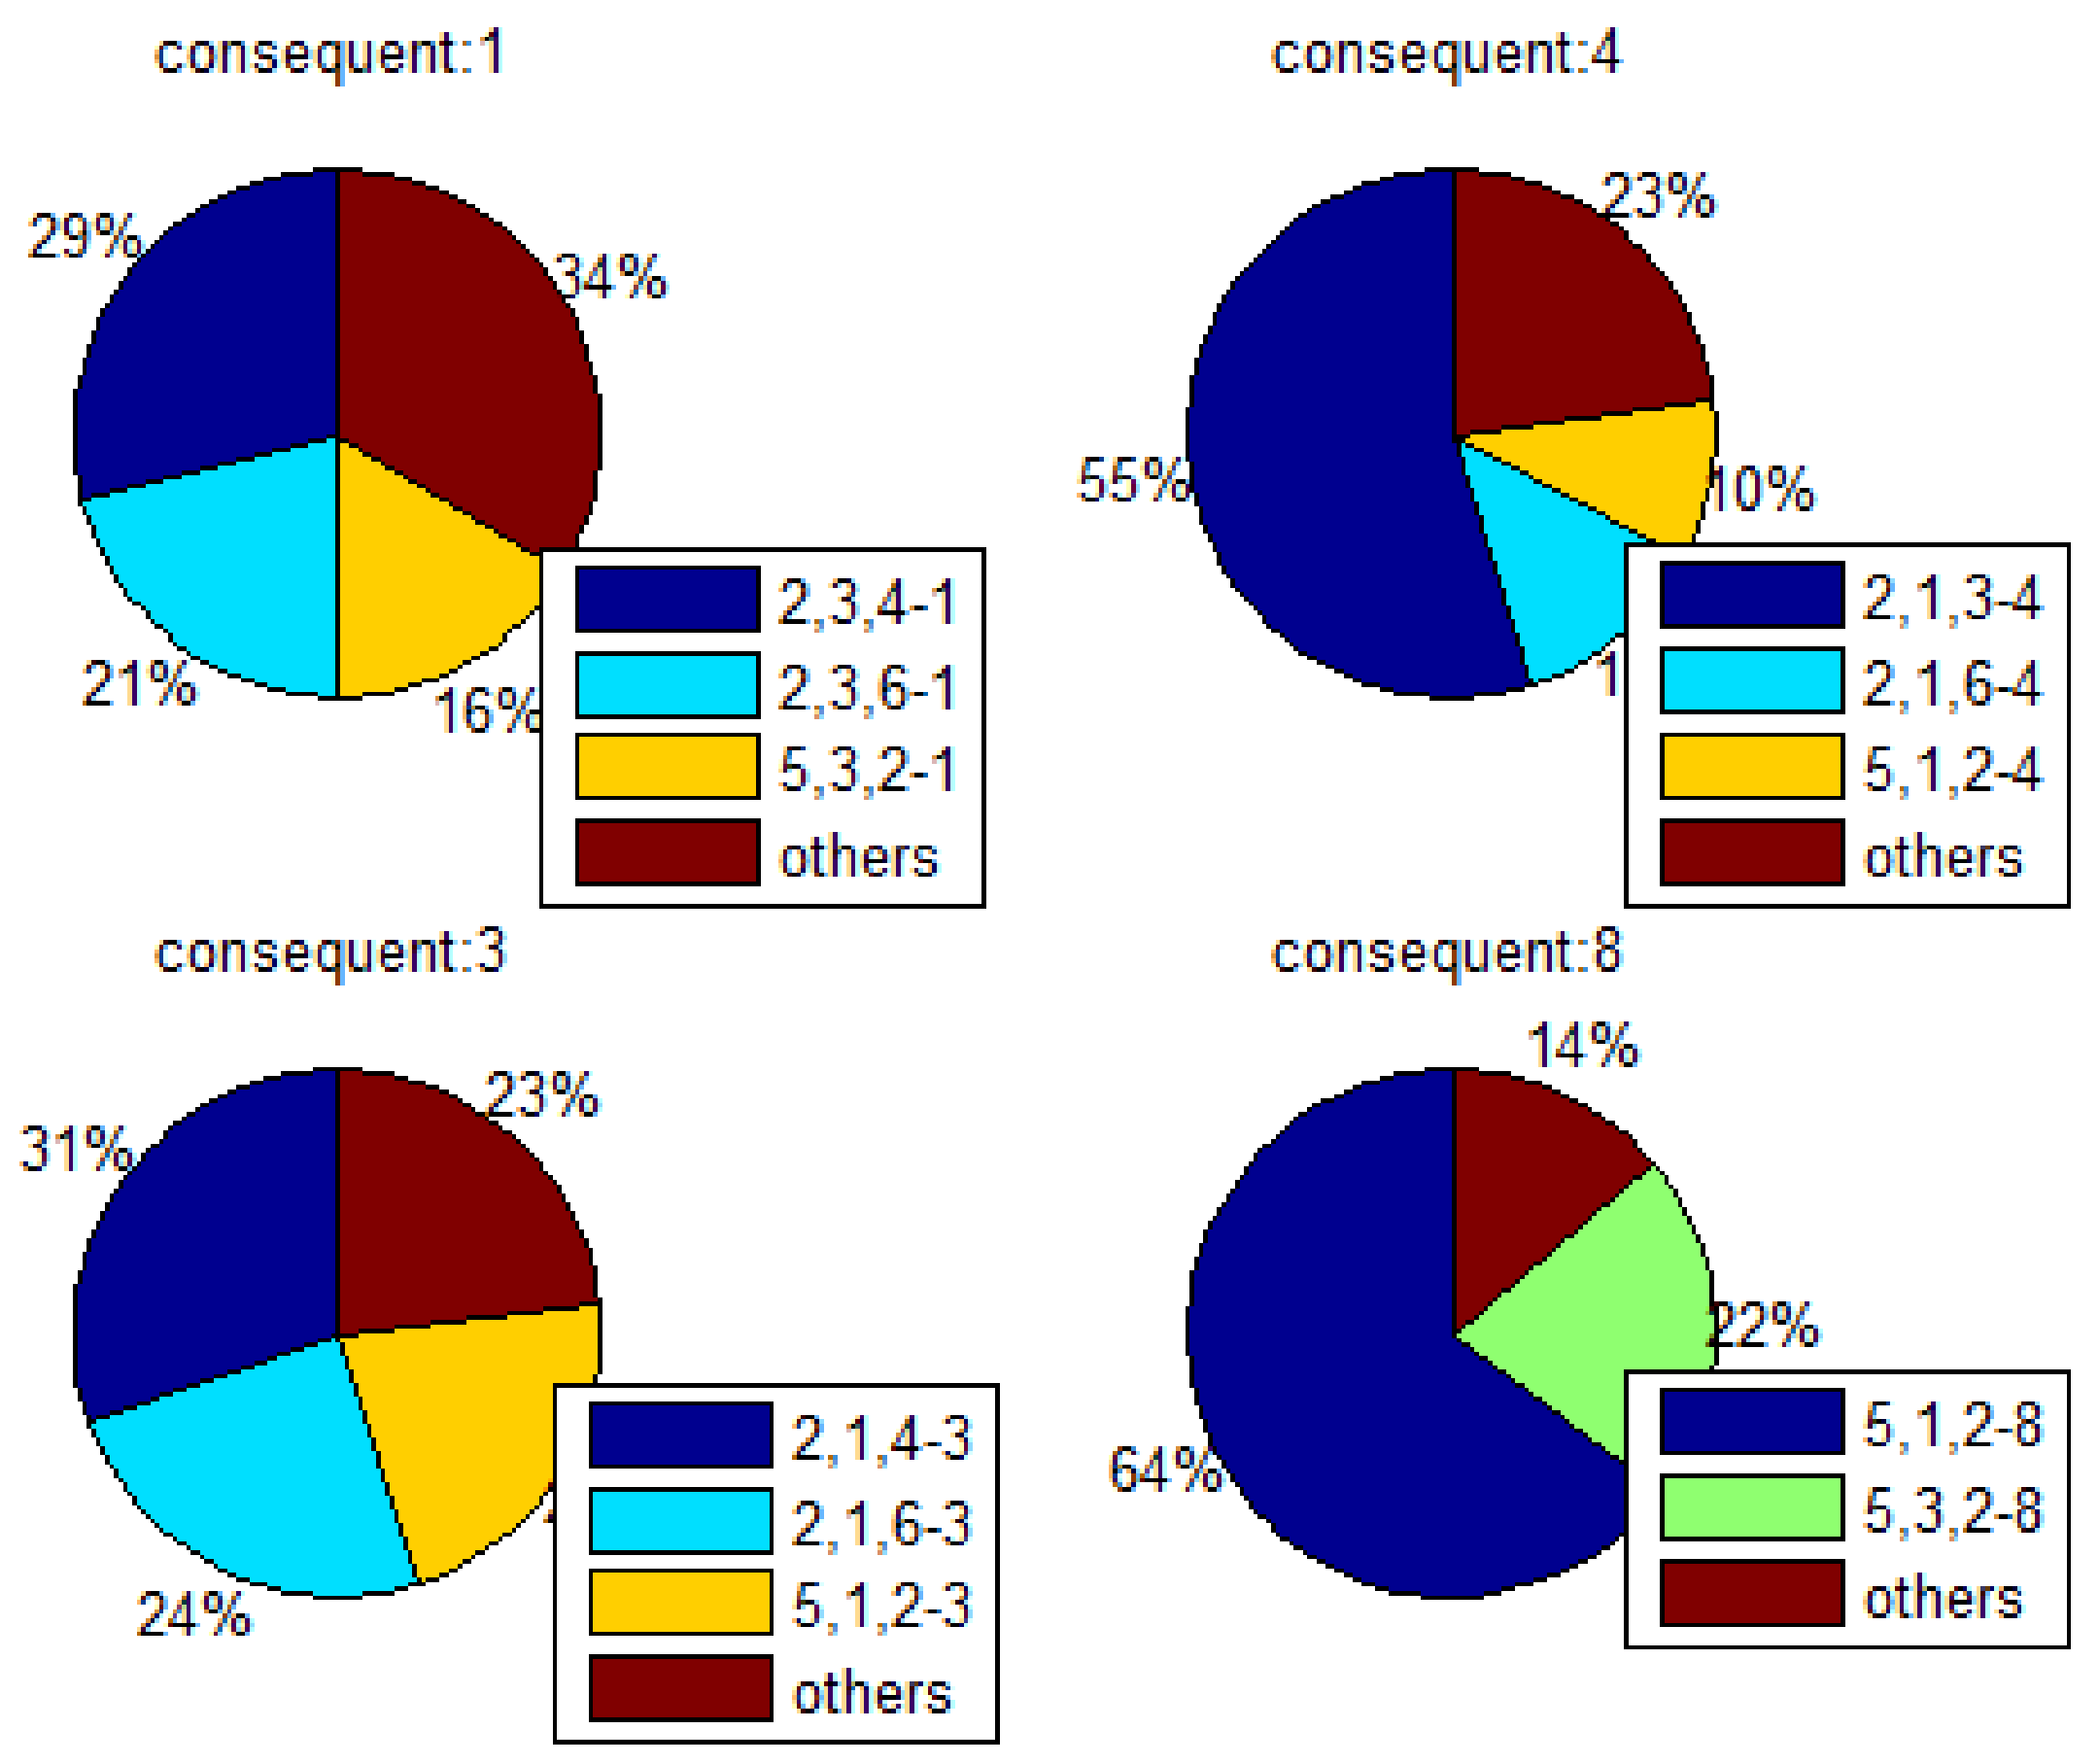
Figure 10 provides another perspective of rules with fixed antecedent quantities. Here, we can determine the most effective rule with the corresponding consequent or determine which items have the closest relation when we choose the point of interest.
Sometimes, we not only determine the most useful rule but also obtain greater interestingness in the proportion between items in the rule. That is, we discuss the second meaning of quantitation. We take as an example, as previously mentioned. According to Equation (3), the mean probability of items of this rule is . After normalization, this can be expressed as . Specifically, if we have 5.3 banks and 1 entertainment establishments, there would be approximately 2.7 catering establishments nearby. Note that the number of items cannot actually be a decimal. Figure 11 shows the distribution for the rule .
5. Conclusions
Traditional mining methods for association rules, such as Apriori and FP-Growth, produce a large number of alternative rules, and even if we use a variety of constraint methods, some rules still need to wait for domain experts to make a choice. However, in many cases, we need to get the rules quickly and avoid human intervention. One way to solve this problem is to use the MPP method presented in this paper to rank all the rules, with the top rule as the desired result. These rules are generated using an improved FP-Growth algorithm, FP-GCID, which not only has the information of the antecedent and the consequent, but also contains the cluster information of each transaction item in the rule. The transaction data is mapped by the clustering result: we first use the DBSCAN algorithm to cluster the Luoyang shop data, then treat the type of the store contained in each cluster as a transaction data. It should be pointed out that this paper uses the DBSCAN algorithm only to map transaction data, which is different from other clustering methods for mining association rules.
This paper has solved a substantial challenge of data mining, namely, mining ARs; however, the final purpose of data mining is to provide knowledge and advice for decision makers. Our AR mining results will be used in association with urbanization, which remains the main tendency of city development in China. Expansion and reform are the only methods of achieving urbanization. However, a plan designed by the Urban Planning Bureau for expansion and reform must be provided. Therefore, in the future, our work will attempt to assist planners in developing urban plans.
Acknowledgments
This work is supported by the National Natural Science Foundation of China (No. 41571394)―“Research on concept drift of the spatial data stream”.
Author Contributions
S.L. and J.G. conceived of the presented idea. S.L. developed the theory and performed the computations. J.G. designed and performed the experiments, derived the models and analyzed the data. H.L. verified the analytical methods. All authors discussed the results and contributed to the final manuscript.
Conflicts of Interest
The authors declare no conflict of interest.
References
- Maquee, A.; Shojaie, A.A.; Mosaddar, D. Clustering and association rules in analyzing the efficiency of maintenance system of an urban bus network. Int. J. Syst. Assur. Eng. Manag. 2012, 3, 175–183. [Google Scholar] [CrossRef]
- Sohrabi, M.; Javidi, M.M.; Hashemi, S. Detecting intrusion transactions in database systems: A novel approach. J. Intell. Inf. Syst. 2014, 42, 619–644. [Google Scholar] [CrossRef]
- Lin, W.; Alvarez, S.A.; Ruiz, C. Efficient adaptive-support association rule mining for recommender systems. Data Min. Knowl. Discov. 2002, 6, 83–105. [Google Scholar] [CrossRef]
- Sharma, N.; Om, H. Significant patterns for oral cancer detection: Association rule on clinical examination and history data. Netw. Model. Anal. Health Inform. Bioinform. 2014, 3, 50. [Google Scholar] [CrossRef]
- Geng, X.; Chu, X.; Zhang, Z. An association rule mining and maintaining approach in dynamic database for aiding product–service system conceptual design. Int. J. Adv. Manuf. Technol. 2012, 62, 1–13. [Google Scholar] [CrossRef]
- Agrawal, R.; Imieliński, T.; Swami, A. Mining association rules between sets of items in large databases. In Proceedings of the ACM SIGMOD International Conference on Management of Data, Washington, DC, USA, 26–28 May 1993. [Google Scholar] [CrossRef]
- Agrawal, R.; Srikant, R. Fast algorithms for mining association rules. In Proceedings of the 20th International Conference Very Large Data Bases, VLDB, Santiago, Chile, 12–15 September 1994. [Google Scholar]
- Han, J.; Pei, J.; Yin, Y. Mining frequent patterns without candidate generation. In Proceedings of the ACM SIGMOD International Conference on Management of Data, Dallas, TX, USA, 16–18 May 2000. [Google Scholar] [CrossRef]
- Han, J.; Cheng, H.; Xin, D.; Yan, X. Frequent pattern mining: Current status and future directions. Data Min. Knowl. Discov. 2007, 15, 55–86. [Google Scholar] [CrossRef]
- Han, J.; Pei, J.; Yin, Y.; Mao, R. Mining frequent patterns without candidate generation: A frequent-pattern tree approach. Data Min. Knowl. Discov. 2004, 8, 53–87. [Google Scholar] [CrossRef]
- Frawley, W.J.; Piatetsky-Shapiro, G.; Matheus, C.J. Knowledge discovery in databases: An overview. AI Mag. 1992, 13, 57. [Google Scholar] [CrossRef]
- Freitas, A.A. On objective measures of rule surprisingness. In Proceedings of the European Symposium on Principles of Data Mining and Knowledge Discovery, Nantes, France, 23–26 September 1998. [Google Scholar] [CrossRef]
- Padmanabhan, B.; Tuzhilin, A. Unexpectedness as a measure of interestingness in knowledge discovery. Decis. Support Syst. 1999, 27, 303–318. [Google Scholar] [CrossRef]
- Shekar, B.; Natarajan, R. A framework for evaluating knowledge-based interestingness of association rules. Fuzzy Optim. Decis. Mak. 2004, 3, 157–185. [Google Scholar] [CrossRef]
- Al-Hegami, A.S.; Bhatnagar, V.; Kumar, N. Novelty framework for knowledge discovery in databases. In Proceedings of the International Conference on Data Warehousing and Knowledge Discovery, Zaragoza, Spain, 1–3 September 2004. [Google Scholar] [CrossRef]
- Bhatnagar, V.; Al-Hegami, A.S.; Kumar, N. Novelty as a measure of interestingness in knowledge discovery. Constraints 2006, 9, 18. [Google Scholar]
- Lenca, P.; Meyer, P.; Vaillant, B.; Lallich, S. On selecting interestingness measures for association rules: User oriented description and multiple criteria decision aid. Eur. J. Oper. Res. 2008, 184, 610–626. [Google Scholar] [CrossRef]
- Ester, M.; Kriegel, H.-P.; Sander, J.; Xu, X. A density-based algorithm for discovering clusters in large spatial databases with noise. In Proceedings of the Second International Conference on Knowledge Discovery and Data Mining, Portland, OR, USA, 2–4 August 1996. [Google Scholar]
- Ma, X.; Wu, Y.-J.; Wang, Y.; Chen, F.; Liu, J. Mining smart card data for transit riders’ travel patterns. Transp. Res. Part C Emerg. Technol. 2013, 36, 1–12. [Google Scholar] [CrossRef]
- Edla, D.R.; Jana, P.K. A prototype-based modified DBSCAN for gene clustering. Procedia Technol. 2012, 6, 485–492. [Google Scholar] [CrossRef]
- Usman, M.; Sitanggang, I.S.; Syaufina, L. Hotspot distribution analyses based on peat characteristics using density-based spatial clustering. Procedia Environ. Sci. 2015, 24, 132–140. [Google Scholar] [CrossRef]
- Lin, K.-C.; Liao, I.-E.; Chen, Z.-S. An improved frequent pattern growth method for mining association rules. Expert Syst. Appl. 2011, 38, 5154–5161. [Google Scholar] [CrossRef]
- Liu, B.; Hsu, W.; Ma, Y. Mining association rules with multiple minimum supports. In Proceedings of the Fifth ACM SIGKDD International Conference on Knowledge Discovery and Data Mining, San Diego, CA, USA, 15–18 August 1999. [Google Scholar] [CrossRef]
- Hu, Y.-H.; Chen, Y.-L. Mining association rules with multiple minimum supports: A new mining algorithm and a support tuning mechanism. Decis. Support Syst. 2006, 42, 1–24. [Google Scholar] [CrossRef]
- Lin, C.-W.; Hong, T.-P.; Lu, W.-H. An effective tree structure for mining high utility itemsets. Expert Syst. Appl. 2011, 38, 7419–7424. [Google Scholar] [CrossRef]
- Yao, H.; Hamilton, H.J. Mining itemset utilities from transaction databases. Data Knowl. Eng. 2006, 59, 603–626. [Google Scholar] [CrossRef]
- Yao, H.; Hamilton, H.J.; Butz, C.J. A foundational approach to mining itemset utilities from databases. In Proceedings of the 2004 SIAM International Conference on Data Mining, Lake Buena Vista, FL, USA, 22–24 April 2004. [Google Scholar] [CrossRef]
- Leung, C.K.-S.; Lakshmanan, L.V.; Ng, R.T. Exploiting succinct constraints using FP-trees. ACM SIGKDD Explor. Newsl. 2002, 4, 40–49. [Google Scholar] [CrossRef]
- Lin, W.-Y.; Huang, K.-W.; Wu, C.-A. MCFPTree: An FP-tree-based algorithm for multi-constraint patterns discovery. Int. J. Bus. Intell. Data Min. 2010, 5, 231–246. [Google Scholar] [CrossRef]
- Cheung, W.; Zaiane, O.R. Incremental mining of frequent patterns without candidate generation or support constraint. In Proceedings of the Seventh International Database Engineering and Applications Symposium, Los Alamitos, CA, USA, 16–18 July 2003. [Google Scholar] [CrossRef]
- Koh, J.-L.; Shieh, S.-F. An efficient approach for maintaining association rules based on adjusting FP-tree structures. In Proceedings of the International Conference on Database Systems for Advanced Applications, Jeju Island, Korea, 17–19 March 2004. [Google Scholar] [CrossRef]
- Leung, C.K.-S.; Khan, Q.I.; Li, Z.; Hoque, T. CanTree: A canonical-order tree for incremental frequent-pattern mining. Knowl. Inform. Syst. 2007, 11, 287–311. [Google Scholar] [CrossRef]
- Tanbeer, S.K.; Ahmed, C.F.; Jeong, B.-S.; Lee, Y.-K. Efficient single-pass frequent pattern mining using a prefix-tree. Inform. Sci. 2009, 179, 559–583. [Google Scholar] [CrossRef]
- Lan, Y.; Janssens, D.; Chen, G.; Wets, G. Improving associative classification by incorporating novel interestingness measures. Expert Syst. Appl. 2006, 31, 184–192. [Google Scholar] [CrossRef]
- Malhas, R.; Al Aghbari, Z. Interestingness filtering engine: Mining Bayesian networks for interesting patterns. Expert Syst. Appl. 2009, 36, 5137–5145. [Google Scholar] [CrossRef]
- Vo, B.; Le, B. Interestingness measures for association rules: Combination between lattice and hash tables. Expert Syst. Appl. 2011, 38, 11630–11640. [Google Scholar] [CrossRef]
- Shaharanee, I.N.M.; Hadzic, F.; Dillon, T.S. Interestingness measures for association rules based on statistical validity. Knowl.-Based Syst. 2011, 24, 386–392. [Google Scholar] [CrossRef]
- Ohsaki, M.; Abe, H.; Tsumoto, S.; Yokoi, H.; Yamaguchi, T. Evaluation of rule interestingness measures in medical knowledge discovery in databases. Artif. Intell. Med. 2007, 41, 177–196. [Google Scholar] [CrossRef] [PubMed]
- Zhao, Y.; Zhang, C.; Zhang, S. Discovering interesting association rules by clustering. In Proceedings of the Australasian Joint Conference on Artificial Intelligence, Cairns, Australia, 4–6 December 2004. [Google Scholar] [CrossRef]
- Lee, I.; Cai, G.; Lee, K. Mining points-of-interest association rules from geo-tagged photos. In Proceedings of the 2013 46th International Conference on System Sciences (HICSS), Wailea, HI, USA, 7–10 January 2013. [Google Scholar] [CrossRef]
- Han, E.-H.; Karypis, G.; Kumar, V.; Mobasher, B. Clustering based on association rule hypergraphs. In Proceedings of the Workshop on Research Issues on Data Mining and Knowledge Discovery, Tucson, AZ, USA, 11 May 1997. [Google Scholar]
- Zaki, M.J.; Parthasarathy, S.; Ogihara, M.; Li, W. New Algorithms for Fast Discovery of Association Rules. In Proceedings of the Third International Conference on Knowledge Discovery and Data Mining, Newport Beach, CA, USA, 14–17 August 1997. [Google Scholar]
- Lent, B.; Swami, A.; Widom, J. Clustering association rules. In Proceedings of the 13th International Conference on Data Engineering, Birmingham, UK, 7–11 April 1997. [Google Scholar]
- Karypis, G.; Aggarwal, R.; Kumar, V.; Shekhar, S. Multilevel hypergraph partitioning: Applications in VLSI domain. IEEE Trans. Very Large Scale Integr. (VLSI) Syst. 1999, 7, 69–79. [Google Scholar] [CrossRef]
Figure 1.
FP-GCID—novel FP-Growth algorithm based on Cluster IDs.

Figure 2.
Illustration of clusters.

Figure 3.
Experimental procedure. MPP: Mean-Product of Probabilities; DBSCAN: Density-Based Scanning Algorithm with Noise.
Figure 3.
Experimental procedure. MPP: Mean-Product of Probabilities; DBSCAN: Density-Based Scanning Algorithm with Noise.

Figure 4.
The data objects of Luoyang.

Figure 5.
The clustering as a function of -radius and -density

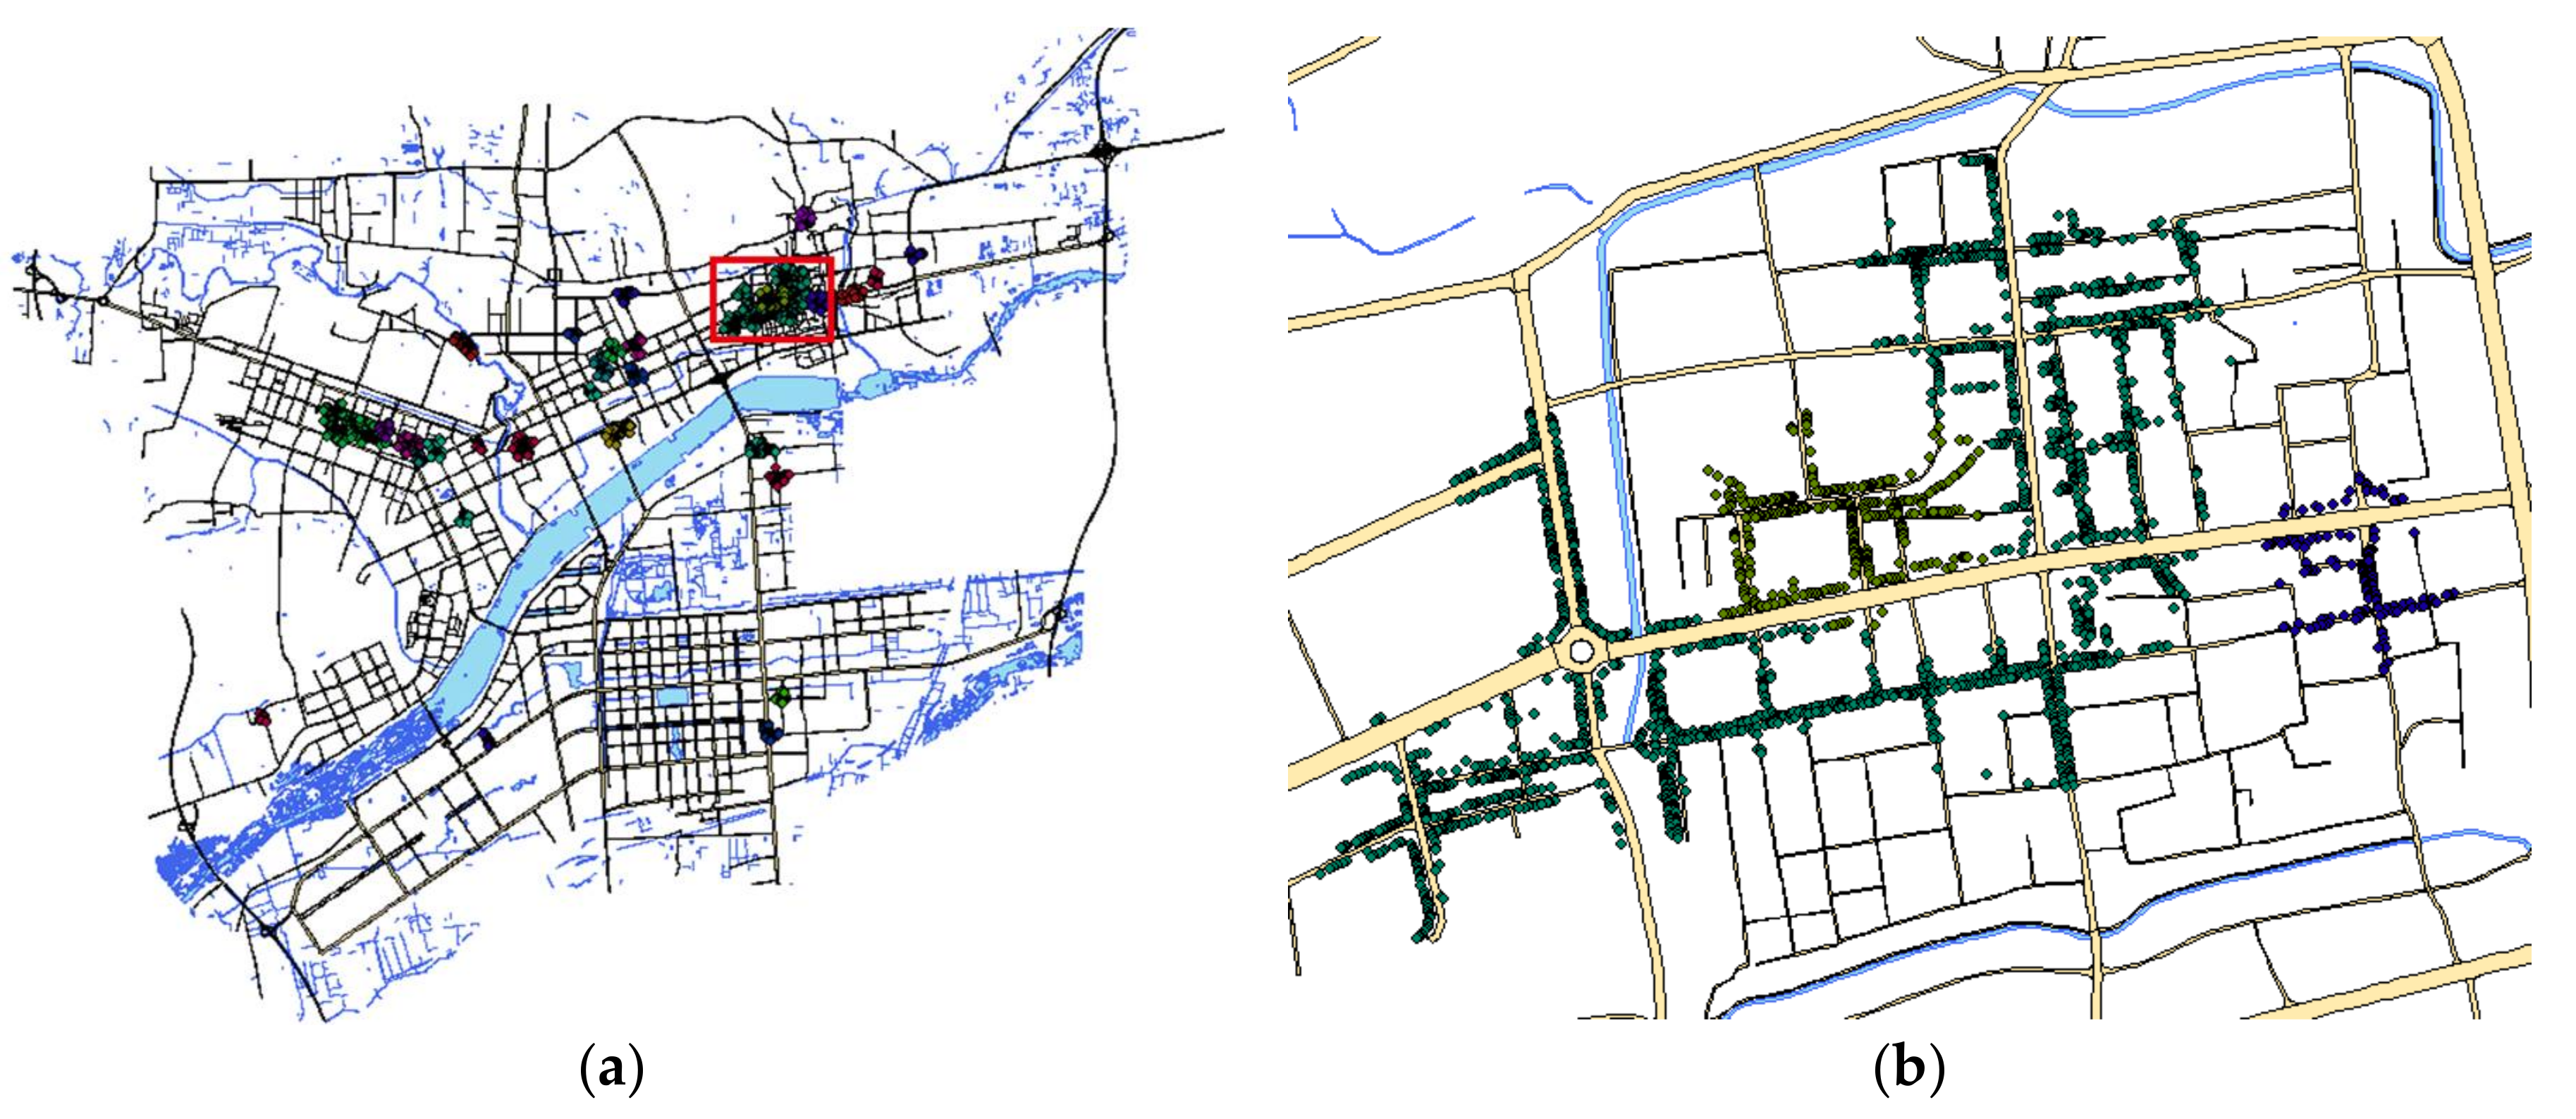
Figure 6.
Spatial Data Clustering. (a) Clusters (radius = 110, density = 80); (b) Detailed view of area in red in the left panel.
Figure 6.
Spatial Data Clustering. (a) Clusters (radius = 110, density = 80); (b) Detailed view of area in red in the left panel.

Figure 7.
Constructing the CFP-Tree.

Figure 8.
Combining the repeated frequent itemsets.

Figure 9.
Fixing the consequent as 1.

Figure 10.
The quantity of the antecedent fixed as 3.

Figure 11.
The distribution for the rule .


Table 1.
Items of urban shops in Luoyang City.
| Item ID | Item Name | Quantities |
|---|---|---|
| 1 | Catering | 8094 |
| 2 | Bank | 1014 |
| 3 | Entertainment | 4299 |
| 4 | Store | 17,888 |
| 5 | Educational Institution | 784 |
| 6 | Hotel | 786 |
| 7 | Government | 469 |
| 8 | Medical Institution | 1332 |
| sum | All | 34,666 |
Table 2.
DBSCAN clustering.
| 10 | 20 | 30 | 40 | 50 | 60 | 70 | 80 | 90 | 100 | 110 | 120 | ||
|---|---|---|---|---|---|---|---|---|---|---|---|---|---|
| (m) | |||||||||||||
| 10 | 3 | 0 | 0 | 0 | 0 | 0 | 0 | 0 | 0 | 0 | 0 | 0 | |
| 20 | 248 | 6 | 0 | 0 | 0 | 0 | 0 | 0 | 0 | 0 | 0 | 0 | |
| 30 | 618 | 66 | 6 | 1 | 0 | 0 | 0 | 0 | 0 | 0 | 0 | 0 | |
| 40 | 610 | 167 | 51 | 8 | 2 | 0 | 0 | 0 | 0 | 0 | 0 | 0 | |
| 50 | 495 | 269 | 92 | 39 | 10 | 4 | 2 | 0 | 0 | 0 | 0 | 0 | |
| 60 | 356 | 283 | 155 | 68 | 33 | 12 | 5 | 3 | 1 | 0 | 0 | 0 | |
| 70 | 272 | 253 | 171 | 106 | 46 | 26 | 12 | 9 | 4 | 2 | 1 | 1 | |
| 80 | 214 | 205 | 182 | 125 | 70 | 33 | 20 | 14 | 9 | 6 | 3 | 3 | |
| 90 | 182 | 161 | 168 | 134 | 89 | 49 | 28 | 19 | 14 | 11 | 6 | 3 | |
| 100 | 150 | 132 | 147 | 130 | 104 | 70 | 32 | 24 | 19 | 15 | 11 | 6 | |
| 110 | 128 | 121 | 119 | 130 | 108 | 82 | 58 | 32 | 23 | 17 | 14 | 13 | |
| 120 | 113 | 102 | 90 | 106 | 93 | 88 | 66 | 45 | 29 | 21 | 16 | 16 | |
Table 3.
Transactional data.
| Trans. ID | List of Item’s ID | Trans. ID | List of Item’s ID |
|---|---|---|---|
| 1 | 1,3,4,5,7,8 | 17 | 1,2,3,4,5,6,7,8 |
| 2 | 1,2,3,4,5,6,7,8 | 18 | 1,3,4,5,6,8 |
| 3 | 1,3,4,5,6,8 | 19 | 1,2,3,4,5,6,7,8 |
| 4 | 1,3,4,5,6 | 20 | 1,3,4,6,7,8 |
| 5 | 1,2,3,4,6 | 21 | 1,2,3,4,5,7,8 |
| 6 | 1,2,3,4,5,6,8 | 22 | 1,2,3,4,5,6,8 |
| 7 | 1,3,4,7 | 23 | 1,2,3,4,5,6,7,8 |
| 8 | 1,2,3,4,8 | 24 | 1,2,3,4,5,6,7,8 |
| 9 | 1,2,3,4,5,6,8 | 25 | 1,2,3,4,6,7 |
| 10 | 1,3,4,5,6,8 | 26 | 1,2,3,4,5,6,7,8 |
| 11 | 1,2,3,4,6,8 | 27 | 1,2,3,4,5,6,7,8 |
| 12 | 1,2,3,4,7 | 28 | 1,2,3,4,5,6,7,8 |
| 13 | 1,3,4,6,8 | 29 | 1,2,3,4,5,6,8 |
| 14 | 1,2,3,4,5,6,8 | 30 | 1,2,3,4,6,8 |
| 15 | 1,2,3,4,6,8 | 31 | 1,2,3,4,5,6,7,8 |
| 16 | 1,2,3,4,5,6,8 | 32 | 1,2,3,4,6,8 |
Table 4.
List of item IDs contained in the clusters.
| Cluster IDs | List of Item IDs |
|---|---|
| 2 | 1,2,3,4,5,6,7,8 |
| 17 | 1,2,3,4,5,6,7,8 |
| 19 | 1,2,3,4,5,6,7,8 |
| 21 | 1,2,3,4,5,7,8 |
| 23 | 1,2,3,4,5,6,7,8 |
| 24 | 1,2,3,4,5,6,7,8 |
| 26 | 1,2,3,4,5,6,7,8 |
| 27 | 1,2,3,4,5,6,7,8 |
| 28 | 1,2,3,4,5,6,7,8 |
| 31 | 1,2,3,4,5,6,7,8 |
Table 5.
Rule ranking with two antecedent and fixed consequents of 1.
| Ranking | Rules | Probability | Ranking | Rules | Probability |
|---|---|---|---|---|---|
| 1 | ‘2,3-1’ | 0.509 | 9 | ‘6,4-1’ | 0.007 |
| 2 | ‘2,4-1’ | 0.148 | 10 | ‘8,3-1’ | 0.007 |
| 3 | ‘2,6-1’ | 0.114 | 11 | ‘5,6-1’ | 0.006 |
| 4 | ‘5,2-1’ | 0.096 | 12 | ‘5,4-1’ | 0.006 |
| 5 | ‘2,8-1’ | 0.037 | 13 | ‘7,4-1’ | 0.004 |
| 6 | ‘6,3-1’ | 0.026 | 14 | ‘8,4-1’ | 0.002 |
| 7 | ‘5,3-1’ | 0.019 | 15 | ‘8,6-1’ | 0.002 |
| 8 | ‘7,3-1’ | 0.015 | 16 | ‘5,8-1’ | 0.001 |
© 2018 by the authors. Licensee MDPI, Basel, Switzerland. This article is an open access article distributed under the terms and conditions of the Creative Commons Attribution (CC BY) license (http://creativecommons.org/licenses/by/4.0/).
Share and Cite
MDPI and ACS Style
Lian, S.; Gao, J.; Li, H. A Method of Mining Association Rules for Geographical Points of Interest. ISPRS Int. J. Geo-Inf. 2018, 7, 146. https://0-doi-org.brum.beds.ac.uk/10.3390/ijgi7040146
AMA Style
Lian S, Gao J, Li H. A Method of Mining Association Rules for Geographical Points of Interest. ISPRS International Journal of Geo-Information. 2018; 7(4):146. https://0-doi-org.brum.beds.ac.uk/10.3390/ijgi7040146
Chicago/Turabian StyleLian, Shiwei, Jinning Gao, and Hongwei Li. 2018. "A Method of Mining Association Rules for Geographical Points of Interest" ISPRS International Journal of Geo-Information 7, no. 4: 146. https://0-doi-org.brum.beds.ac.uk/10.3390/ijgi7040146
Note that from the first issue of 2016, this journal uses article numbers instead of page numbers. See further details here.