Article

Identification of Painted Rock-Shelter Sites Using GIS Integrated with a Decision Support System and Fuzzy Logic

by
Ruman Banerjee
1,2,
Prashant K. Srivastava
3,*,
A. W. G. Pike
4 and
George P. Petropoulos
5
1
Department of Archaeology and Anthropology, University of Bristol, Bristol BS8 1UU, UK
2
Department of Archaeological Sciences, Indian Institute of Technology Gandhinagar, Gujarat 382355, India
3
Institute of Environment and Sustainable Development, Banaras Hindu University, Varanasi 221005, India
4
Department of Archaeology, University of Southampton, Avenue Campus, Southampton SO17 1BF, UK
5
Department of Soil & Water Resources, Institute of Industrial & Forage Crops, Hellenic Agricultural Organization—“Demeter” (former “NAGREF”), 1 Theofrastou St., 41335 Larissa, Greece
*
Author to whom correspondence should be addressed.
ISPRS Int. J. Geo-Inf. 2018, 7(8), 326; https://0-doi-org.brum.beds.ac.uk/10.3390/ijgi7080326
Submission received: 17 May 2018 / Revised: 1 August 2018 / Accepted: 6 August 2018 / Published: 12 August 2018

Abstract

:
The conservation and protection of painted rock shelters is an important issue. Throughout the world, if unprotected, they are vulnerable to vandalism or to industrial activities such as quarrying. This research explores the integrated use of a Geographic Information System (GIS) with a multi-criteria decision support system and fuzzy logic to identify possible rock art sites over the Vindhyan Plateau in the district of Mirzapur, Central India. The methodology proposed compares results obtained by spatial modelling with validation data derived from recent exhaustive field surveys of more than forty newly discovered rock-shelters in the Vindhyan region. The zones obtained by predictive modelling are in agreement with validation datasets and show that the method can be used for new site prospection. This method represents a potential tool for landscape planners and policy makers to employ when seeking protection from anthropogenic activities of potential areas of painted rock-shelter sites and archaeological deposits.

1. Introduction

Rock-shelters and caves are fixed natural structures in the landscape with distinct topography and geomorphological characteristics, and have been used in a variety of human activities (e.g., shelter, rock art) for much of prehistory [1]. While painted rock shelters have been well characterized in Europe [2], America [3], Africa [4], etc., in India studies have been regionally focused, leaving some areas where little is known about the distribution of such sites [5]. The gaps in our knowledge are exemplified by the recent discovery of previously unrecorded painted rock shelters in Central India [6], which forms the data set for this study. In an Indian context, even the most recent research work has mostly been confined within the premises of geology, indicating a partial relation to the archaeological paradigm [7,8,9].
The detection of archeological sites through field surveys is difficult in the region because of the complex terrain and lack of proper transportation [6]. Involving local people in site exploration is very labour intensive and expensive, and provides less coverage of the survey area. The advent of geospatial technologies has led to a considerable amount of work being undertaken to map and characterize landscapes [10,11,12] and archaeological features [8], and could be useful for monitoring rock art, with predictive geospatial tools used to locate likely areas to prospect. Sophisticated terrain mapping through geospatial data combined with predictive modelling can resolve the problem of identifying painted shelter sites in a more cost-effective and efficient way [13,14]. The combination of GIS and fuzzy logic is particularly powerful. Fuzzy logic has successfully been used so far for stone tool classification, typological classification [15], settlement pattern analysis [16], landscape classification [17], archaeological data visualization [18], and archaeological simulation and modelling [19]. Given its tremendous scope and already proven potential, its integration with GIS can be used jointly to collect, store, classify, examine, and manage the data that assists predictive modelling [20].
To our knowledge, detailed methodological and problem-oriented research using remote sensing and GIS data has never been attempted in this region, despite the fact that in prehistoric archaeology the applications of remote sensing and GIS have gained considerable popularity in other parts of the world [21,22]. Prehistoric sites have been characterized using remote sensing and fuzzy logic GIS according to their palaeo-geographical, geo-morphological, and archaeological features in order to understand the geographic location and contextual parameters of the sites [6,23,24]. These parameters are used to identify unexplored areas with similar characteristics and arguably the highest probability of containing similar sites. The model is then validated with the distribution of known sites in the area. The outcome of this study and research, both in the field and in the laboratory setup, can be used to sensitize local people, the state, and the central government to protect the rock art sites in the surveyed and studied region. Relevant authorities and concerned institutions located in the regions of the rock art sites can be given information about prehistoric social choices, land use patterns, and, finally, about the potential of rock-shelter archaeology. The identification of areas in which new sites could be found is highly relevant to the protection of this archaeological heritage from rapid site destruction resulting from such activity as deforestation and illegal mining of the sandstone.

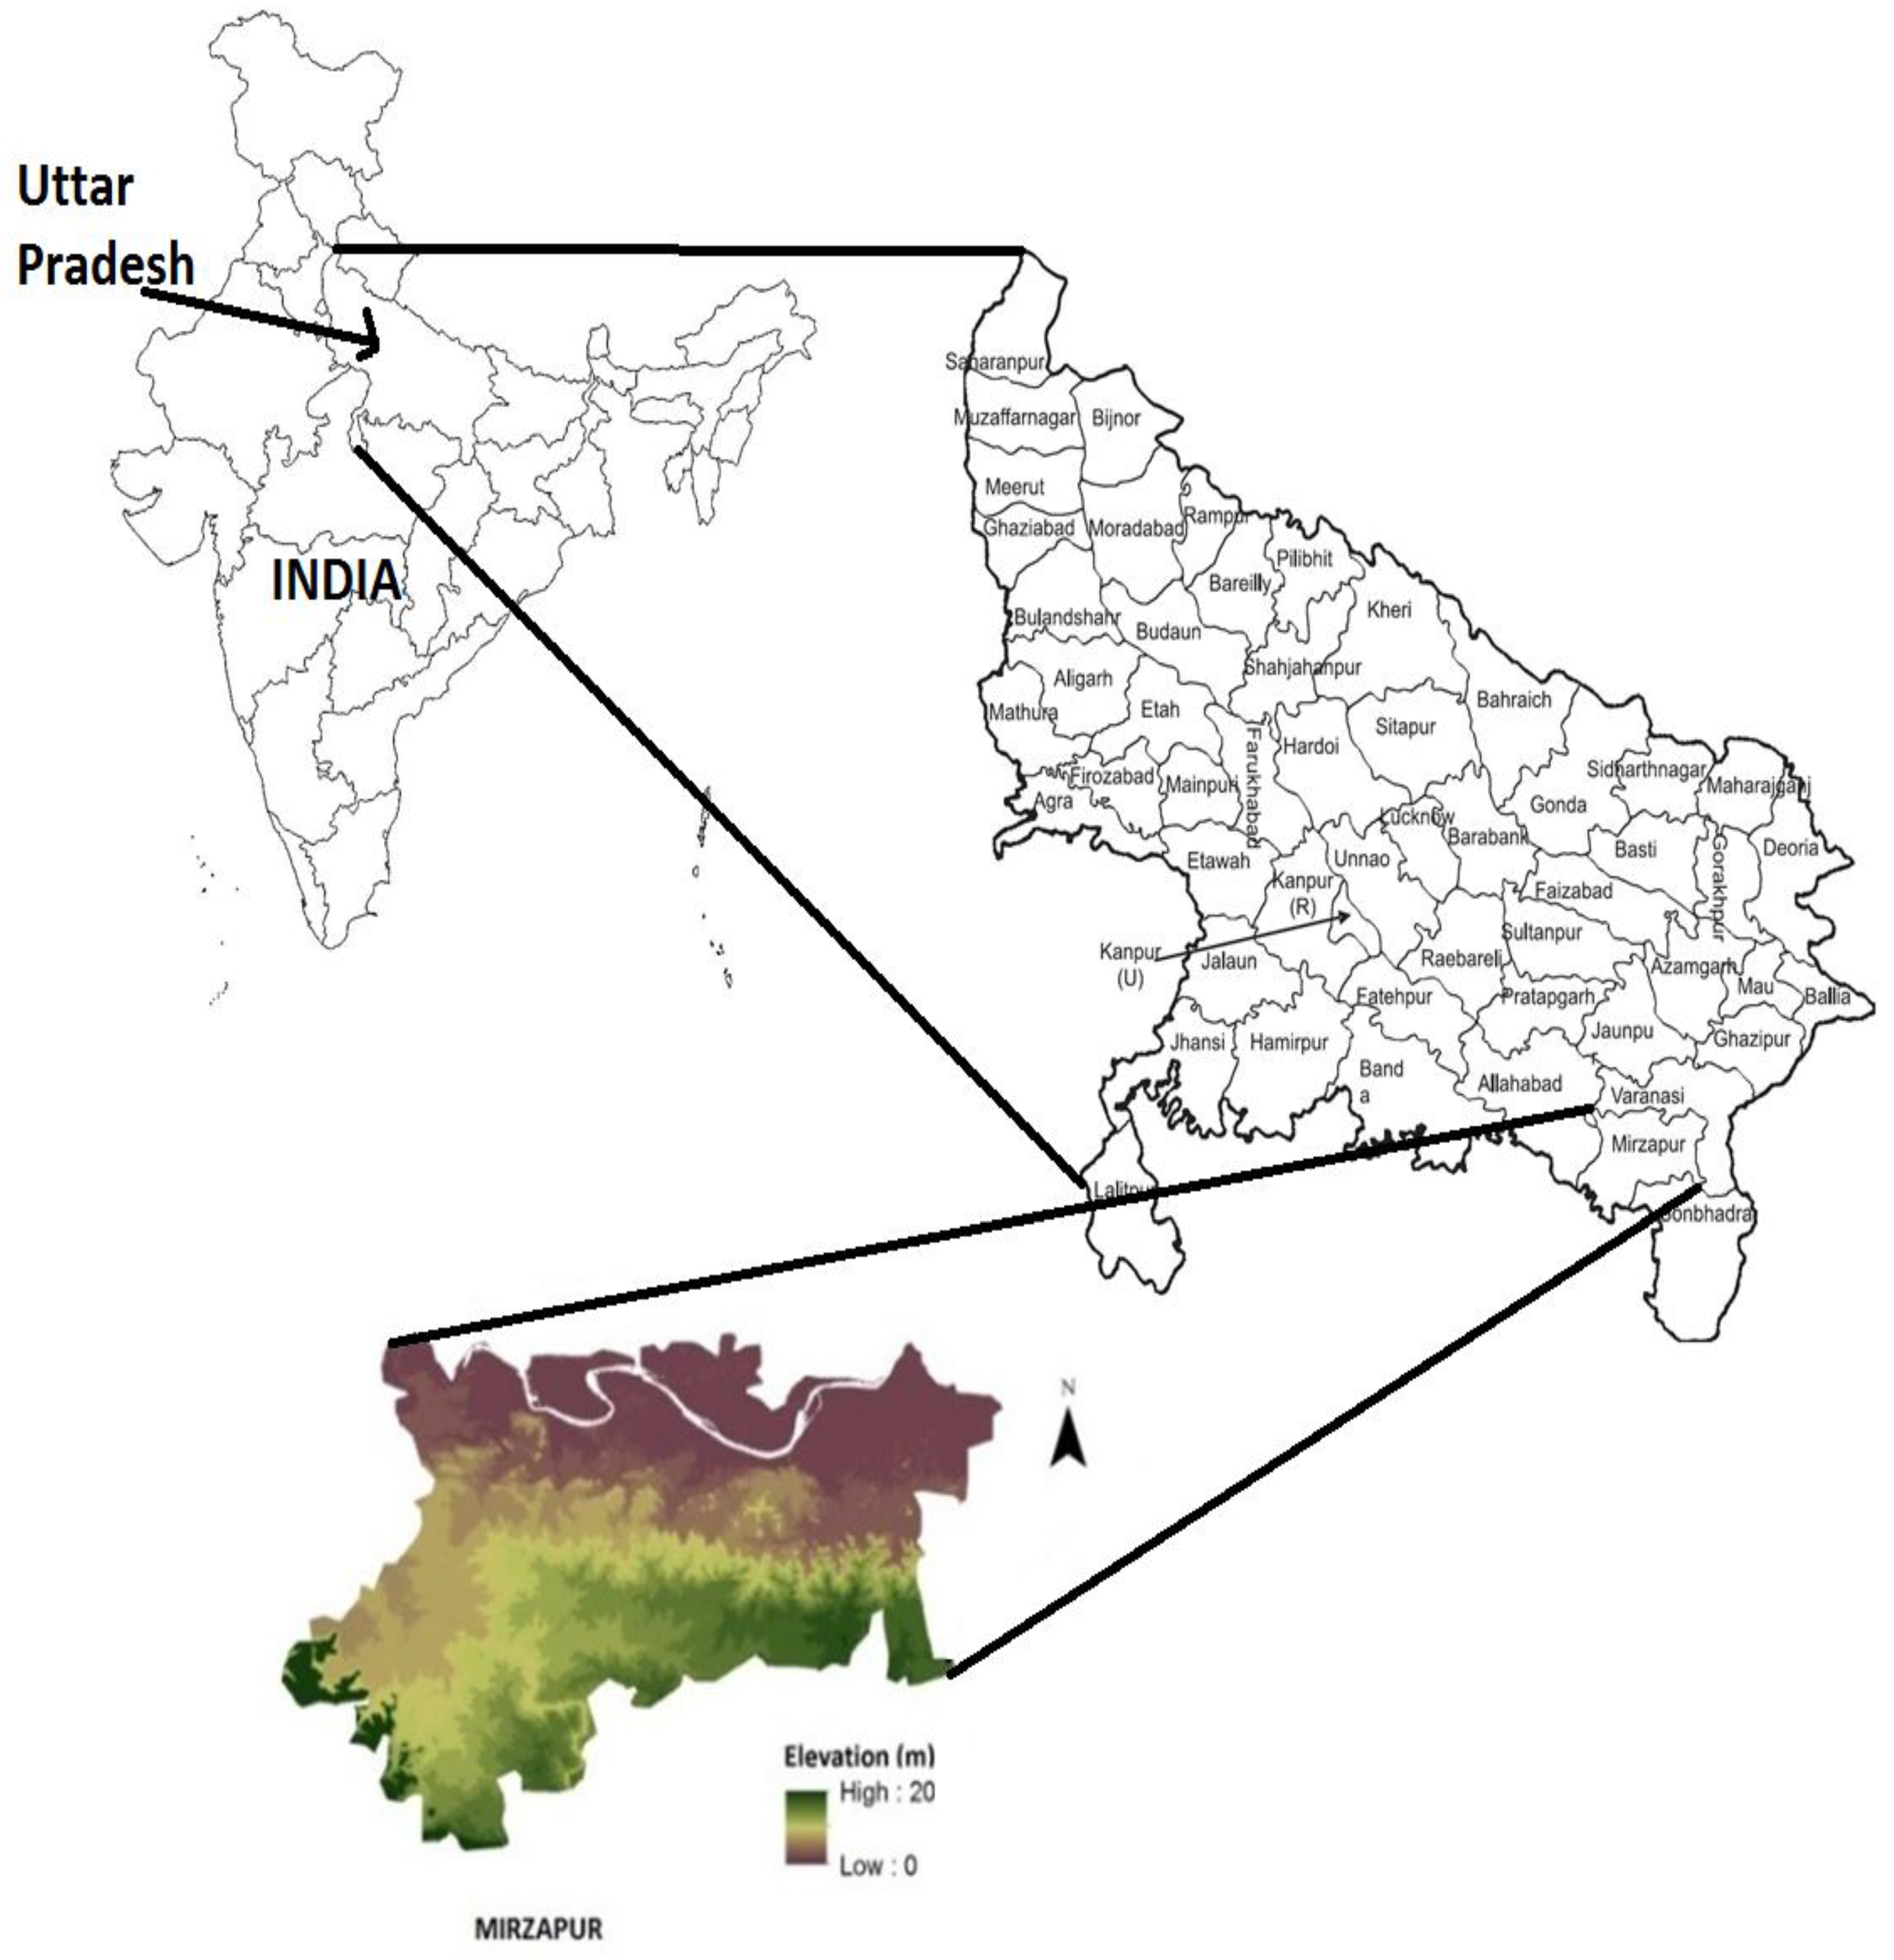
2. Description of the Study Area

Central India represents a vast corpus of painted rock shelters in and around Mirzapur district, covering an area of 4522 square kilometres [25]. Mirzapur (Figure 1) is located under the Vindhyan sandstone hills and has a dendritic drainage pattern associated with the prominent rivers of the region such as the Ganga, Belan, and Son [26]. The Vindhyan range, being a border between Northern and Peninsular India, spreads from Gujarat state in the West to Uttar Pradesh state in the North through Madhya Pradesh. It is situated at the southern border of the Gangetic valley and forms the border of the lower Sivalik and the Himalayan Ranges. The Upper Vindhyan formations comprise mostly sandstone and quartzite. The valleys of Mirzapur were the home of non-hierarchical prehistoric hunter-gatherers for a long period of time, as evidenced by the presence of numerous rock-shelters containing various imageries depicting several themes and styles, and by scattered stone tools on their surfaces.
Field observations and systematic surveys suggest that the soil of the region is heterogeneous in nature, depending on the undulating topography, underlying hard rock strata, vegetation, and rainfall. The Indo-Gangetic alluvium soil, red, and mixed red soils of Mirzapur are rich in kankar nodules or the concretions of lime, evidenced by field-work and published work. The texture of the soil determines the shape, size, and smoothness of the granules. The red, black, and yellow colours of the soil from the Mirzapur district are due to the presence of iron, organic matter or humus, micro-organisms, copper, and manganese. The predominant red clay is extremely ferruginous or rich in iron, and the fertile alluvium varies from sandy to clayey loam at different locations within the district [27,28].

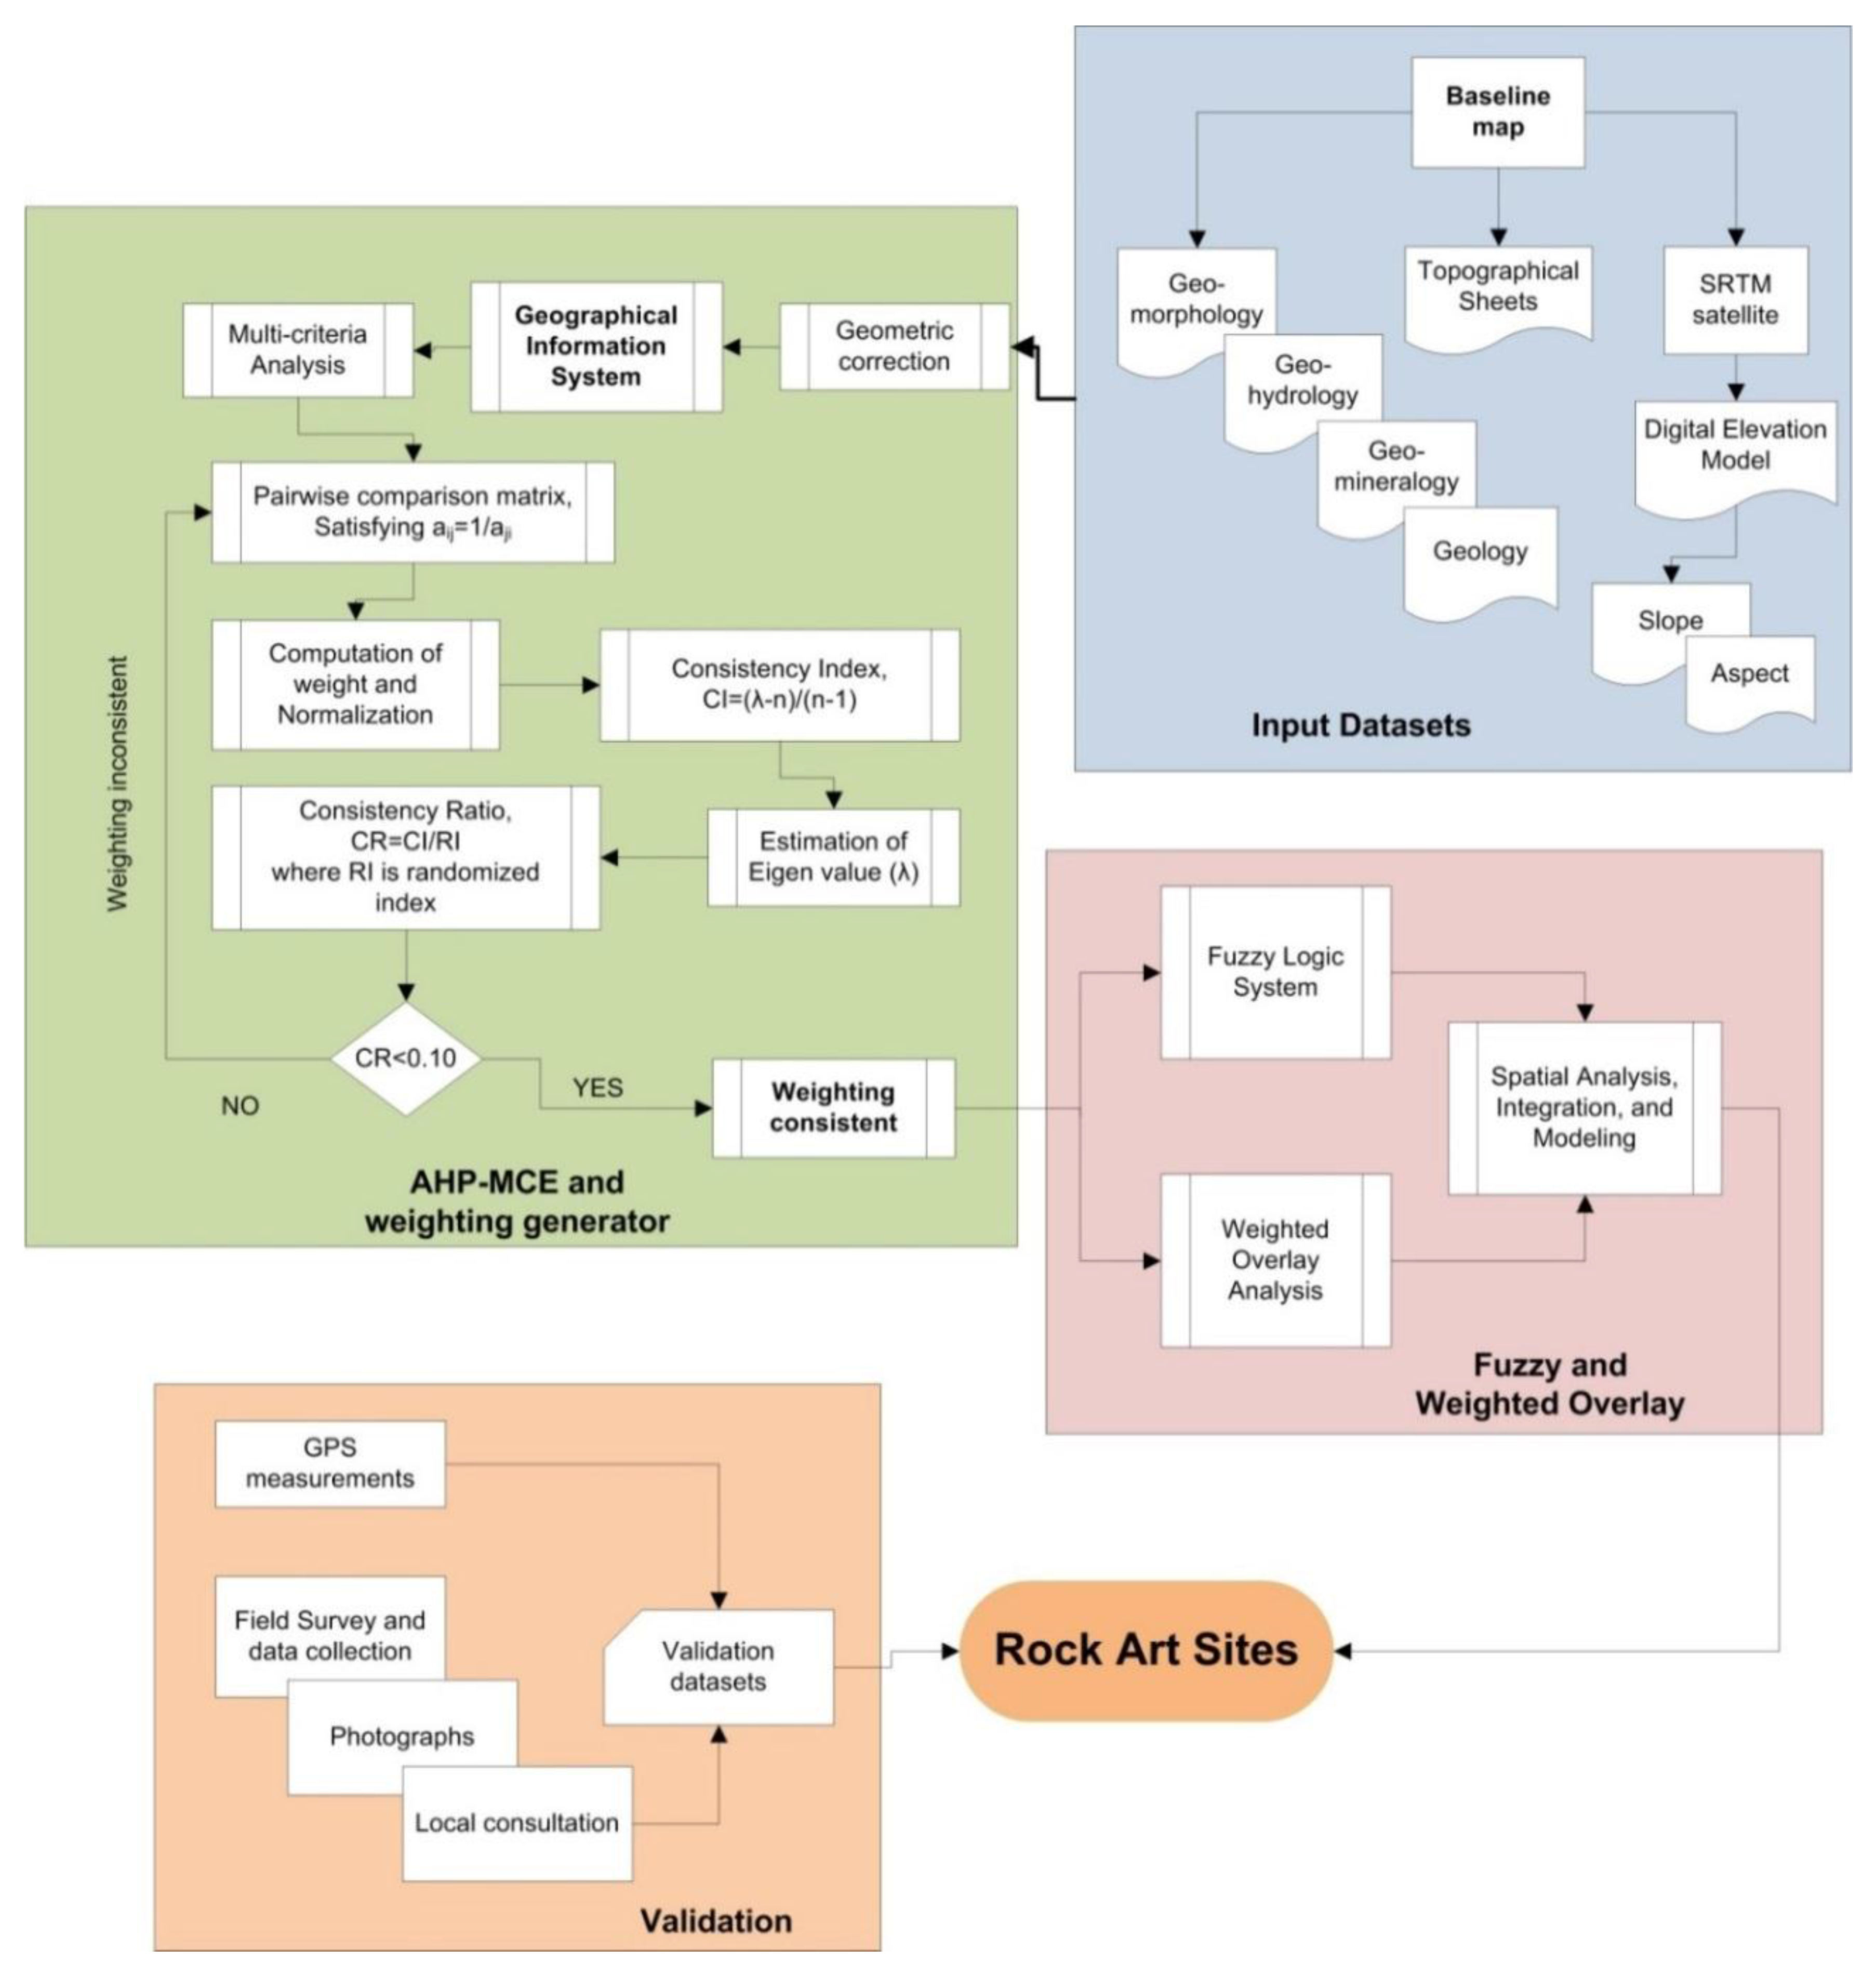
3. Datasets and Methodology

The data set mainly consists of a Shuttle Radar Topographic Mission (SRTM) digital elevation model, photographs of the rock art, district resource and planning maps, and topographical sheets. Firstly, all datasets were reprojected to World Geodetic System (WGS) 84 with the Universal Transverse Mercator (UTM) Zone 44 cartographic system. The district resource maps, which are available from the Geological Survey of India, Calcutta were subsequently digitized, georeferenced, mosaiced, and incorporated into the GIS database to model the rock-shelters of Mirzapur region. ArcGIS version 10.1 was used in this study for all the data analysis and layer integration. In order to overlay and integrate raster thematic maps of different spatial resolutions, all the data layers were spatially co-registered to bring them in the same spatial reference frame. Thus, an image to image co-registration of all the Geospatial datasets was performed. The SRTM DEM was used as the reference image to which all other available thematic images were co-registered. Approximately 50 commonly identified Ground Control Points (GCPs) were selected based on random sampling from easily detectable corner points (e.g., road junctions). Positional root mean square error (RMSE) was kept below one pixel (i.e., 90 m of SRTM DEM) in both x and y dimensions while geo-referencing.
To construct predictive models for classifying new site clusters on the landscape, the character of the Palaeolithic records has been investigated and examined to enable key variables embedded within the local geology and geomorphology to be included. A suite of raw data was obtained by means of site discovery, thorough exploration and survey work, detailed documentation, and cataloguing of the archaeological sites. Detailed field surveys and integration of spatial and non-spatial data of archeological significance in GIS was carried out to detect and characterise the prehistoric painted rock art sites of Mirzapur. Environmental factors that could have affected choice of occupation in prehistoric Mirzapur were geospatially examined, and specific weight factors were allocated in terms of the location of the archaeological sites [29]. After completing this step, an integration of all the defined key variables was carried out in a GIS environment using weighted overlay techniques and Fuzzy Logic System.
A set of seven key combinations of variables was then chosen (Table 1) to characterise areas where probable sites might be found. Combinations of geological, geo-morphological, geo-mineralogical, hydro-geological, and geo-technical variables associated with all the documented sites of different cultural periods were subsequently extracted to build a predictive model to characterise the prehistoric sites on the landscape. These combinations can provide different weightings of the variables (Table 2). Thematic maps as predictive models were then generated by integrating the data, in terms of nature, quality, and quantity, into a suite of sophisticated statistical software to characterise the existing rock-shelter sites and to identify areas of high potential to find sites of different and/or similar cultural periods with similar attributes [30]. The distribution of known and documented rock art sites was then compared to the model prediction, and a map was presented in order to understand and visualise how the parameters and their inter-relationships directly connected with the pattern of sites.
While conducting the systematic survey and exploration in the field, various types of maps were used, including Survey of India topographical sheets, district resource maps, road maps, tourist maps, and local maps found in literature reviews. As the area of exploration was extremely remote and administrative boundaries recently underwent drastic changes when Sonbhadra received the status of an independent district from Mirzapur, all the maps and local oral anecdotes were used in conjunction to explore the sites. Coordinates of the sites and those of important landmarks were obtained by handheld Garmin e-Trex 60. After three seasons of field work, the baseline maps were created in the laboratory. The SRTM digital elevation model was used to calculate slope and aspect of the area and topographical sheets and other maps were digitized and georeferenced to obtain geomorphology, geohydrology, geo-mineralogy, and geology maps. All these constituted part of the input datasets.
Multi-criteria analysis and Fuzzy logic were then implemented in tandem, first to understand the nature of the field data and then to understand how both techniques impart similar results for predictive modelling in terms of rock-art site prospection and future work. Although the technical applications of MCE weight assignment and fuzzy logic have been arbitrary, they have shown extremely useful for spatial analysis, integration, and modelling. Both techniques are briefly described in the following sections.

4. Multi-Criteria Evaluation (MCE) and Weighting Assignment

The MCE analysis is mostly based on Analytical Hierarchy Principle (AHP) given by [31]. In MCE, a pair-wise comparison is used for the selection of preferences for both criteria and choices. It is a 9 ranking scale to compare choices in the model, in which 1 represents the least weight followed by 2 to 9 in ascending order of importance. After pair-wise comparisons on criteria, a matrix representation of the model is obtained called as the ‘decision matrix’. A linear algebra transformation of the decision matrix was then used. The consistency of the selection and the knowledge-based judgments involved are dependent on the eigenvalue of the decision matrix, which finally leads to the consistency ratio calculation for the preference of choices, which should be less or equal to 0.1. The first step in calculation of the consistency ratio is the calculation of the consistency index (which is the maximum eigenvalue of the comparison matrix). The Consistency Ratio (CR) is a result of the division of the Consistency Index (CI) by the Random Inconsistency index (RI). The numerical basis of the MCE is represented through the Equations (1)–(3).
The priorities of the criteria are estimated from the principal eigenvector “e” of the matrix “M”, calculated from Equation (1):
M e = λ max e  
in which λmax is the largest eigenvalue of the matrix “M” and the eigenvector “e”. The eigenvector obtained is then normalized to yield a vector of weights corresponding to individual attributes.
The Consistency Ratio (CR) and Consistency Index (CI) are calculated to determine whether the evaluation is successful or not [11]. CR < 0.1 indicates good consistency [31]; however, if it is >0.1 the comparison is inconsistent and hence there appears a need for reassessment. The CR and CI can be expressed by Equations (2) and (3), respectively:
C R = C I / R I  
C I = ( λ max n ) / ( n 1 )  
in which n is the number of variables and RI is the Random Inconsistency Index.
In this study, expert knowledge-based rank assignment is used for all the variables used, decided after the MCE. All the datasets are then overlaid on a GIS platform and integrated based on the degrees of influence on prehistoric rock art occurrences using a weighted overlay analysis. More details about this methodology can be found in [31,32,33].

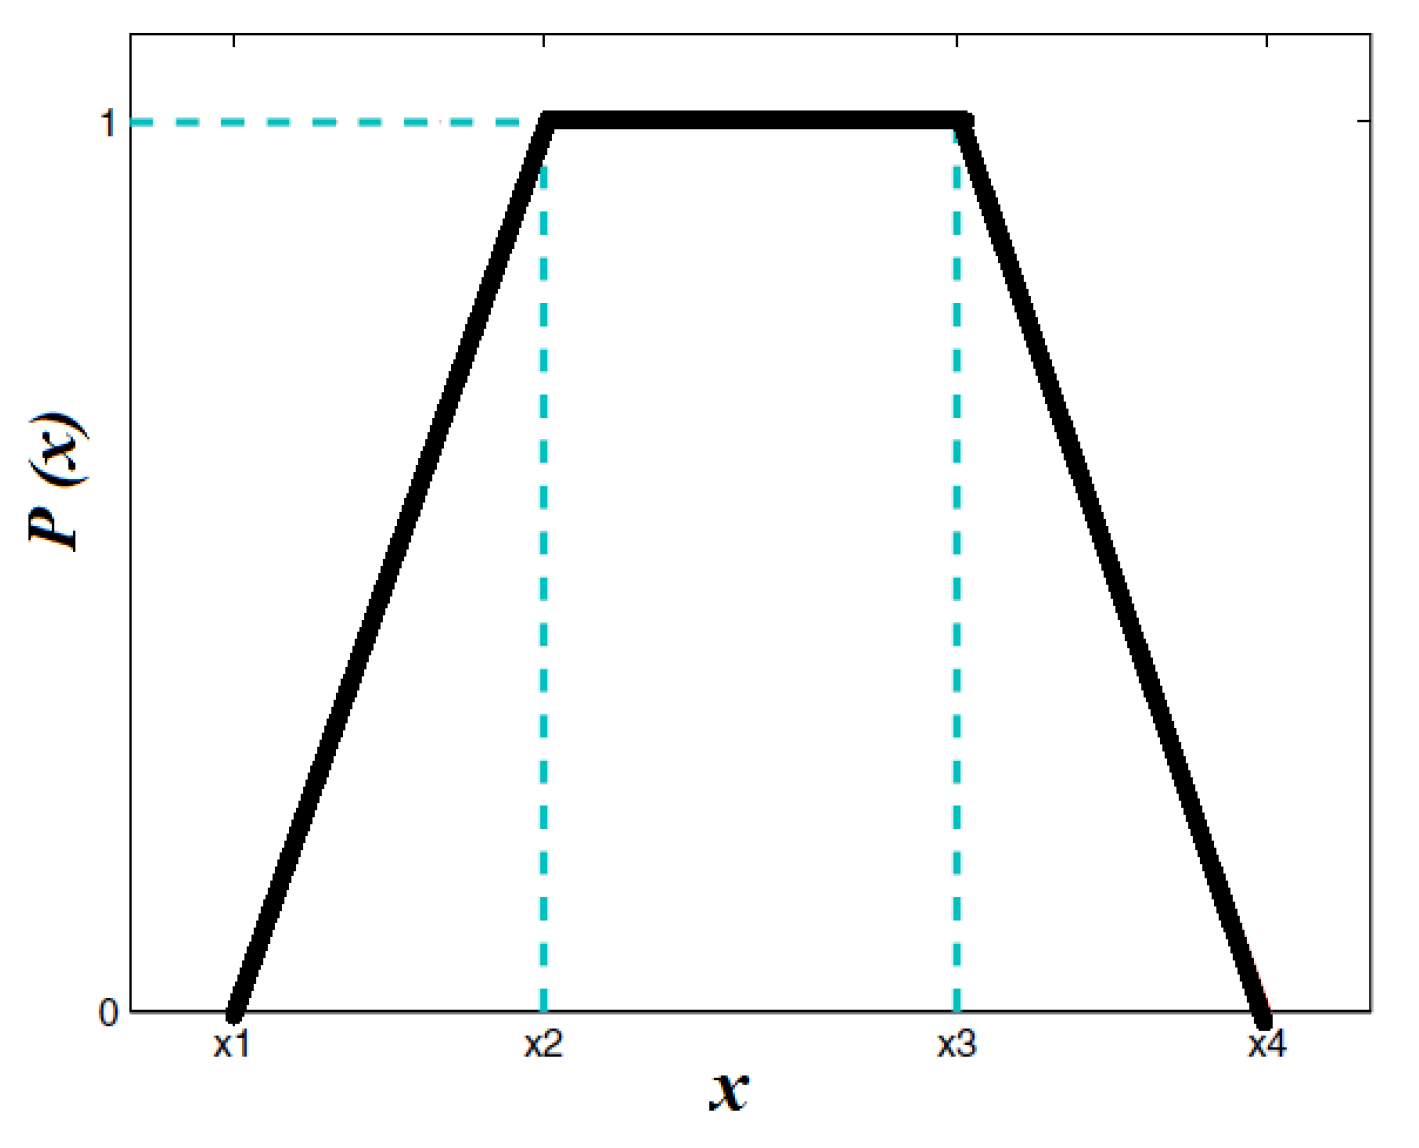
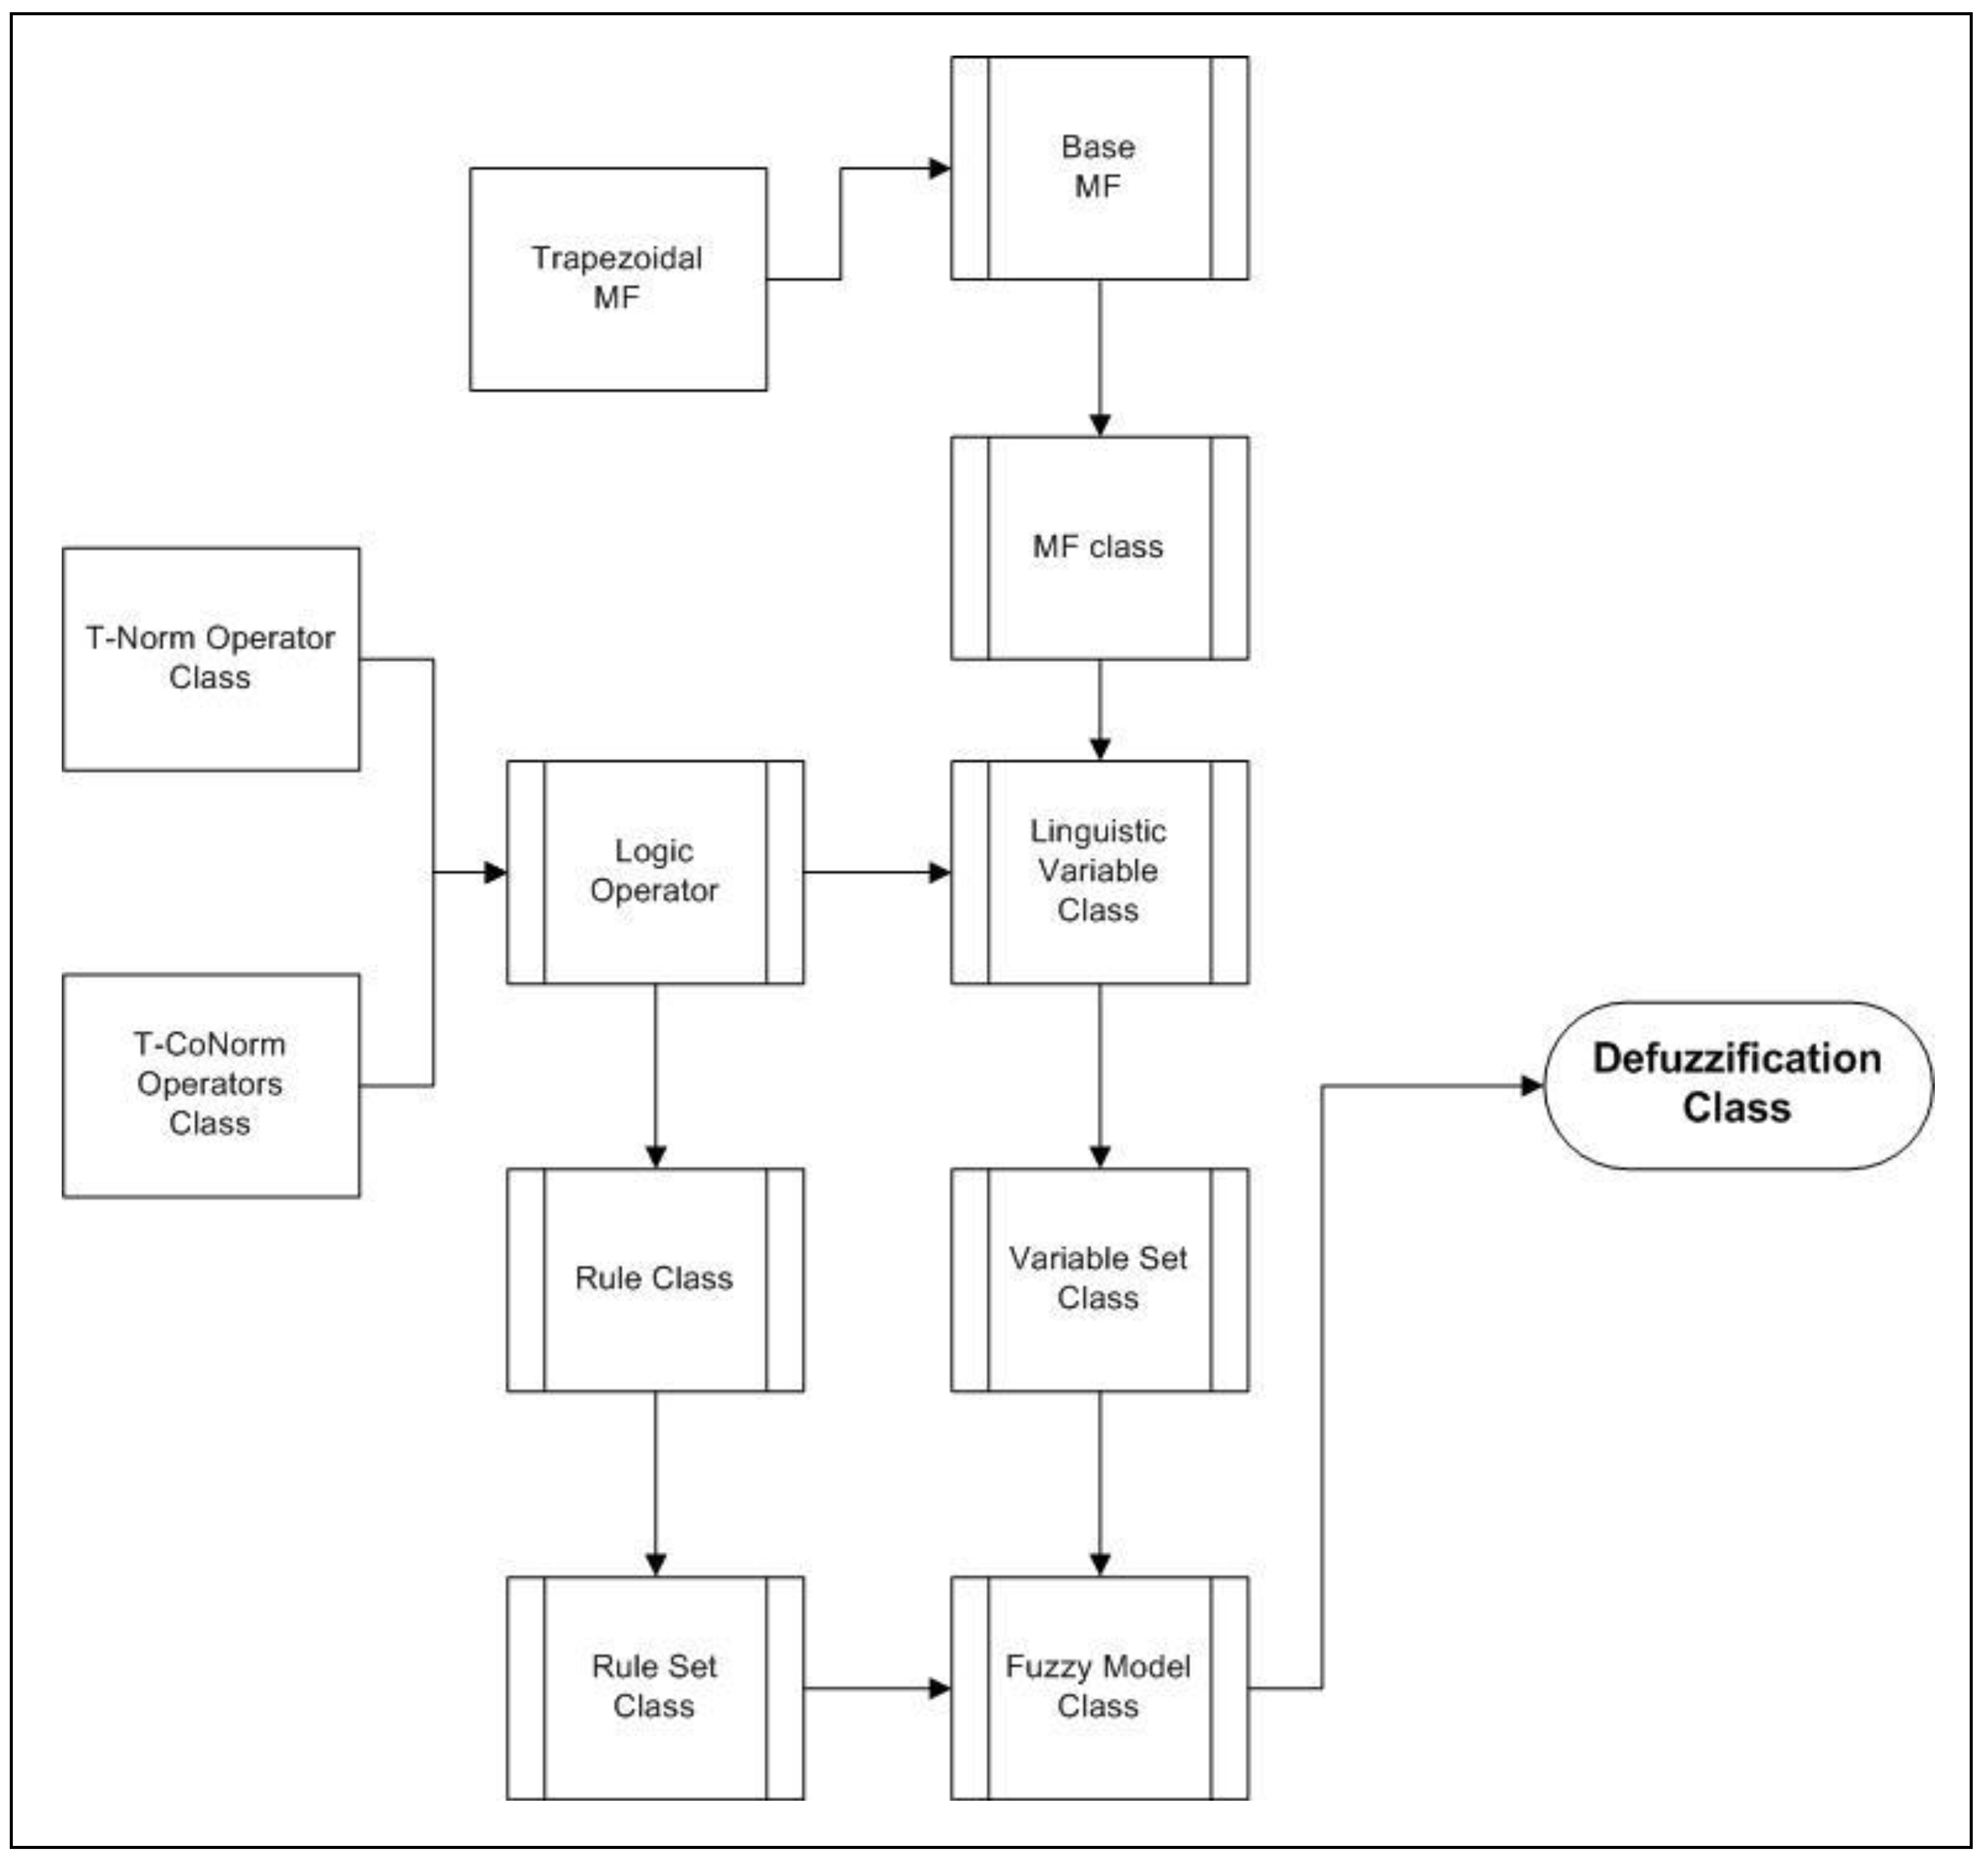
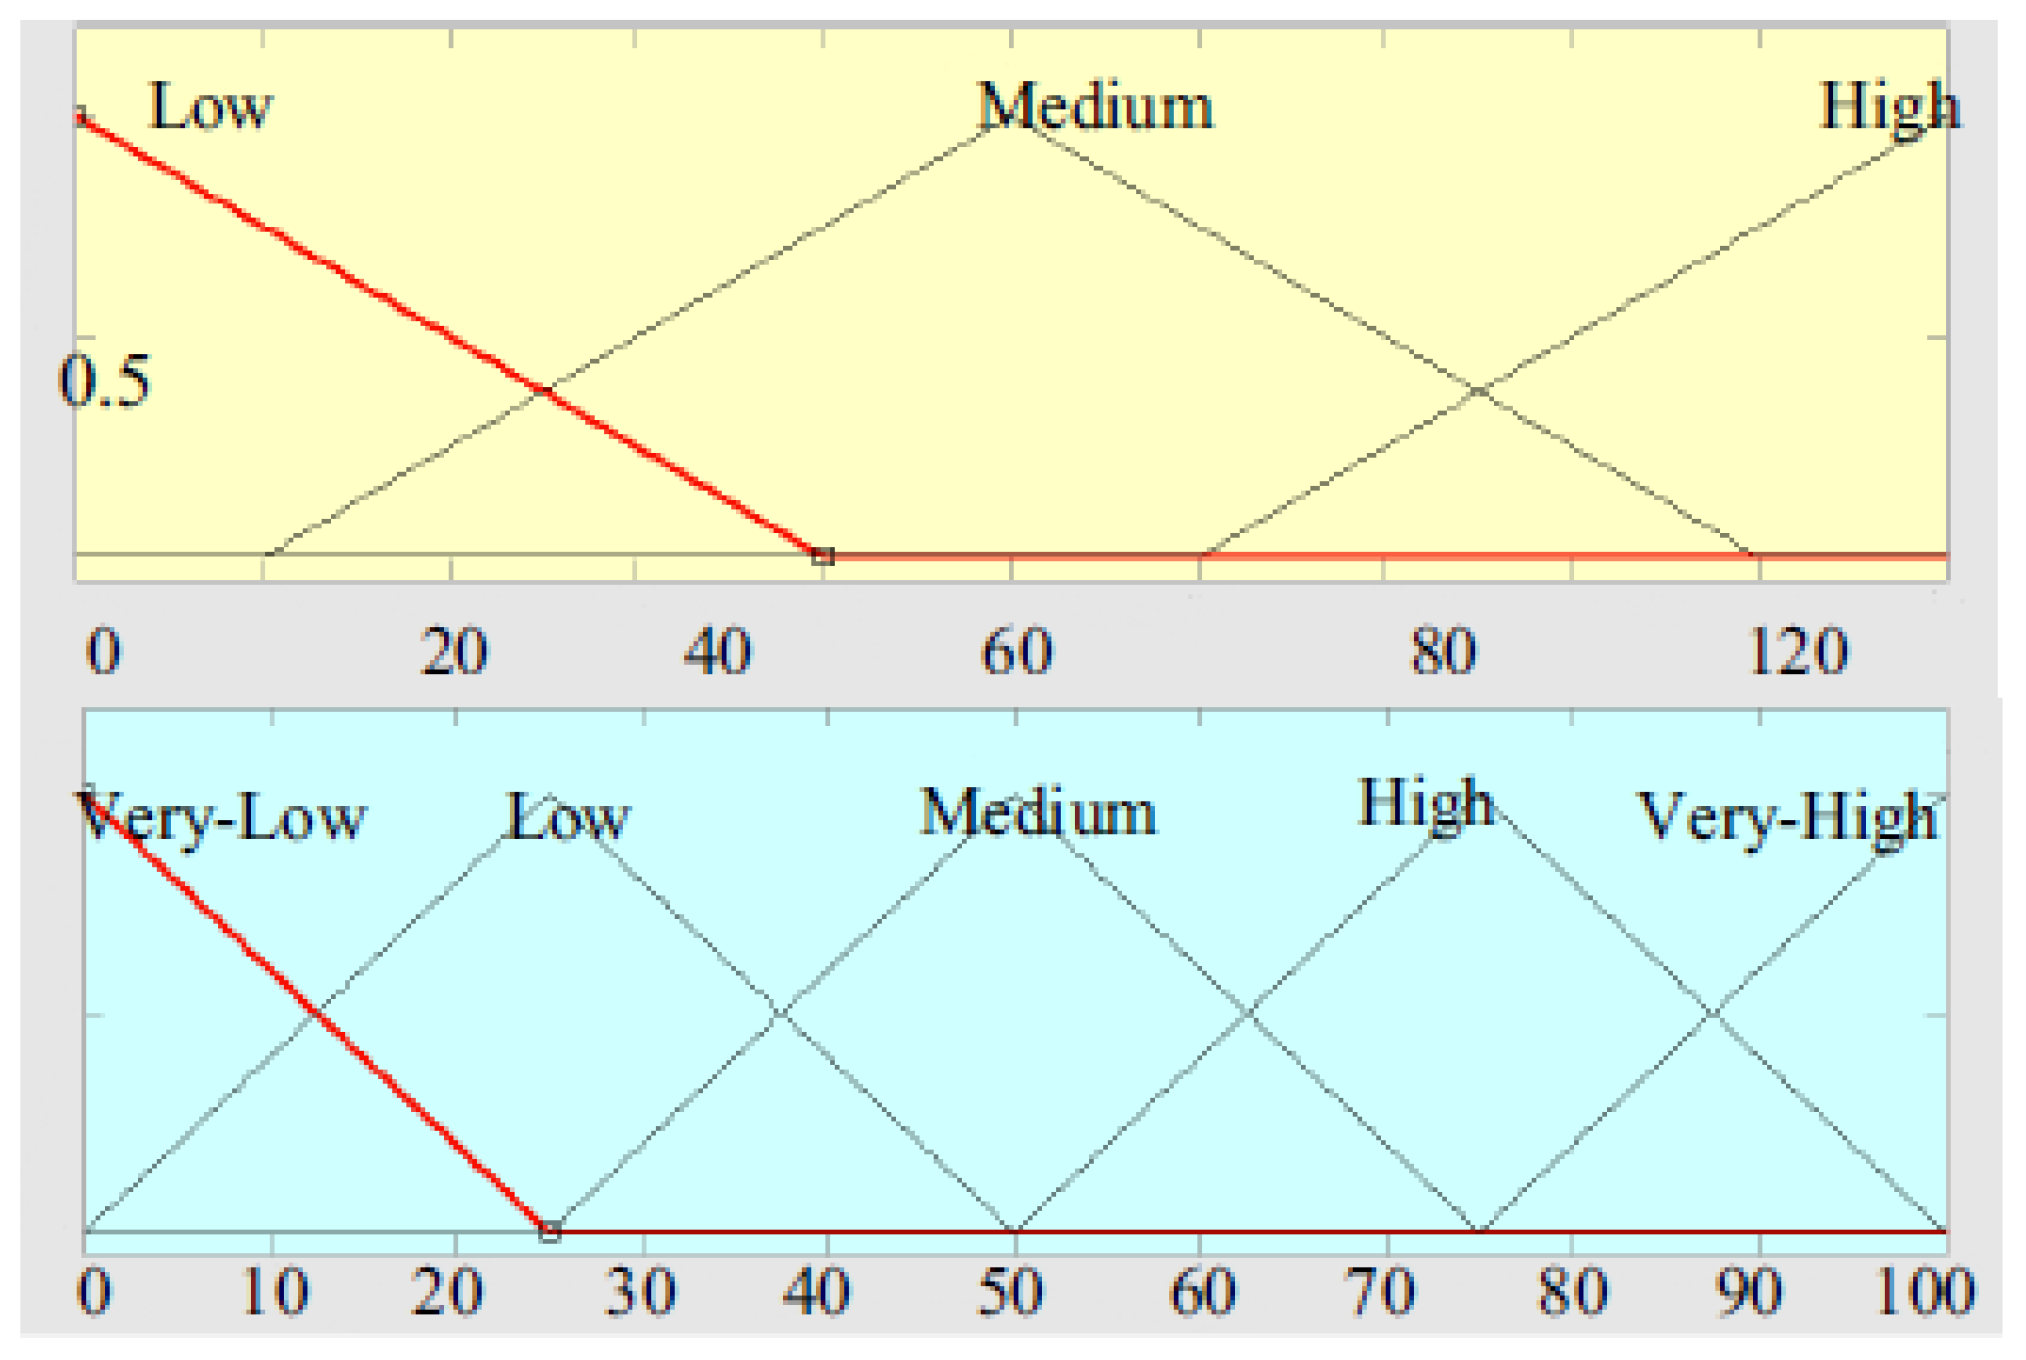
5. Fuzzy Logic System (FLS)

Fuzzy logic is fundamentally a supervised, semi-automatic algorithmic classification schema [34,35] in which archaeological elements can be embedded. Depending on the nature of membership function, different parameters and/or a set of parameters can be chosen to compare, associate, identify, and describe relationships among different elements of a membership function. Zadeh implemented fuzzy set theory to produce domain-specific outputs in which the variables under question represent non-linear relationships and enhanced complex interactions [36]. Deploying standard statistical measures, fuzzy set theory handles a small fraction of the entire decision spectrum, particularly in the case of data-sparse domains, when the data input is large but the knowledge domain is small, enabling real-time decision making [37]. Following this method, a combination of several classes of output can be generated. In FLS, numerical sets are replaced by precise linguistic variables denoting associated levels of membership depending on categorical input and output [38]. Fuzzy logic considers the intermediate and uncertain values as crisp inputs. Fuzzy sets can trace and quantify uncertainties within the data, efficiently overriding intrinsic subjectivity within the data domain by means of fuzzification, in which crisp variables are altered into fuzzy or continuous inputs [39]. Membership functions (MF) can be defined by various structures in which the most predominant ones are bell curves, triangular, and trapezoidal. The numbers of domain specific variables are proportional to each and every MF, predefined by individual input/output. Fuzzy sets recognize 1 and 0 as defined membership functions, in which 0 is false and 1 is true.
The functions are described by four parameters x1, x2, x3, and x4, in which x1 and x4 locate the “feet”, while x2 and x3 denote the “shoulders” of the trapezoid. The membership functions for rock art detection use the trapezoidal function model (Figure 2) and can be defined as
  f ( x , x 1 ,   x 2 , x 3 , x 4 ) = m a x ( m i n ( x x 1 x 2 x 1 , 1 , x 4 x x 4 x 3 ) , 0 )  
While applying the criterion of FLS in rock art research (Figure 2 and Figure 3), the crisp inputs include vicinity of water resources, geomorphology, geohydrology, geology, geomineralogy, aspect, and slope, while the crisp outputs are the category of the rock art sites that establish low, moderate, and high parameters set for the rock-shelters. For all the rules the AND fuzzy operations are applied, and the intersection or minimum between the two sets can be expressed as
  μ a μ b μ c μ d μ e μ f μ g = min [ μ a ( x ) , μ b ( x ) ,   μ c ( x ) , μ d ( x ) , μ e ( x ) ,   μ f ( x ) ,   μ g ( x ) ]  
in which μ is the degree of truth for each crisp input, and a, b, c, d, e, f, and g are the variables—vicinity of water resources, geomorphology, geohydrology, geology, geomineralogy, aspect, and slope, respectively.
An overview of the methodology adopted in this study is provided in Figure 4.

6. Results and Discussion

6.1. Categorisation and Weighting Assignment of Thematic Layers

The various thematic layers digitized and generated in this study form the basis of AHP-MCE. In this section, all the thematic layers are discussed in terms of their suitability towards the rock art prediction. The 1–9 value based ranking criterion was used for the pair-wise comparisons and subsequently for the weighting calculation.

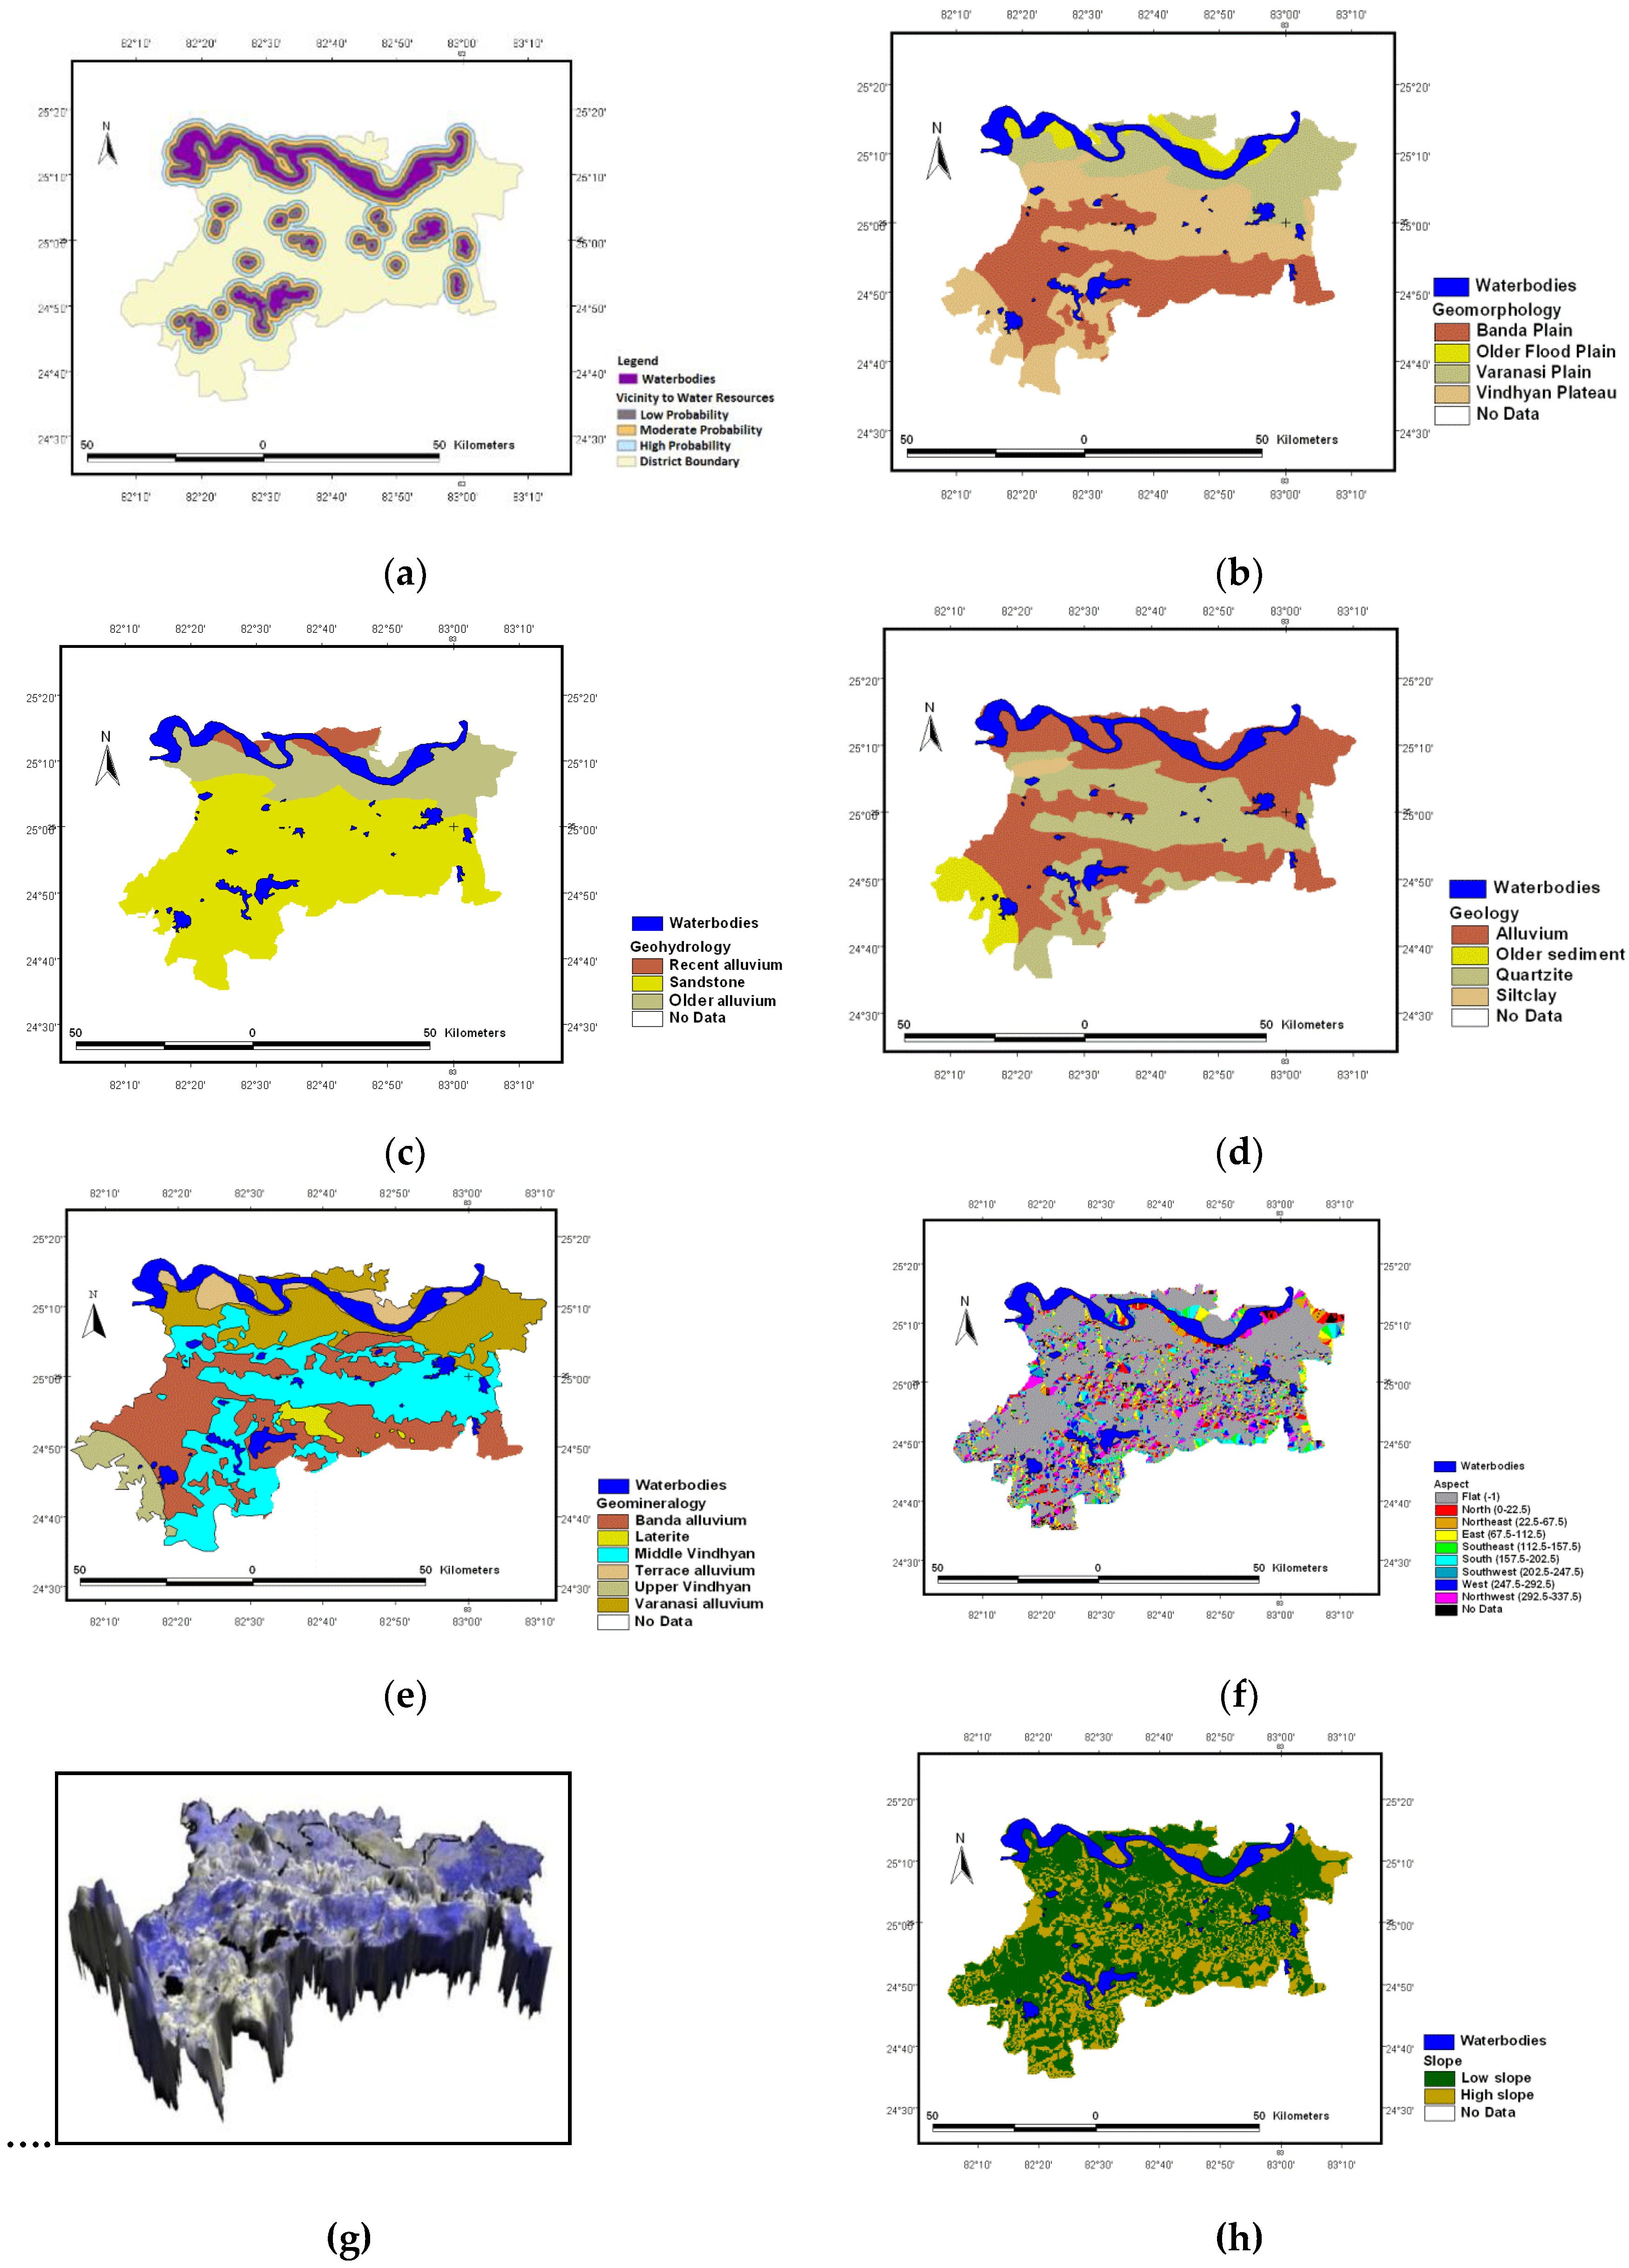
6.1.1. Vicinity of Water Resources and Archaeological Site Locations

The most striking feature of the area surveyed is the undulating hills and small hillocks representing forest cover within the valleys. It is expected that prehistoric foragers and hunters of game collected local forest produce and exploited the water resources from the catchment area for their survival. The presence of several water resources in these forest areas is likely a useful predictor of rock art creation, as prehistoric humans, like every living, being must have required constant source of water for their livelihood. Hence, the probability of having rock art areas near water resources is more justifiable than in faraway areas.
In order to delineate the possible impact of water resources, the buffer map of the vicinity to water resources with different colour regimes is generated with an interval of 3 km, and the classes obtained are on the basis of the vicinity to water resources (Figure 5a), named as near, intermediate, and far. These criteria receive individual values of 9, 4, and 1, respectively. The highest value represents considerably close proximity between the painted shelters and water resources. All the surveyed sites of South-Western and part of Central Mirzapur are situated very close to water resources. The parameter of water resources has been given a normalized weighting of 2.35%, much lesser than other parameters like geology and geomorphology, since it is difficult to ascertain the changing relationship of landscape and water resources both in the present and in the past, which, by and large, is highly dependent on the local climate and environment. The model here predicts and follows the same logic for the existence of similar shelters in Eastern, Central, and South-Eastern parts of the Mirzapur district. Where waterbodies are present in the catchment and microregion, there is a high probability that prehistoric sites will also be there. The proximity to water would mean higher chances of the presence of a rock art site than location further away, as [40] has mentioned that these hunter-gatherers generally confined activity to 10 km from their base points.

6.1.2. Influence of Geo-Morphological and Geo-Hydrology on Archaeological Sites

The geomorphology of the study region is shown in Figure 5b. It is covered by the Banda Plain (43.30% of the total landmass) along with the Older Flood Plain (4.15%), Varanasi Plain (19.55%), and the Vindhyan Plateau (33.00%). From the point of view of the geotechnical characters, the region of Mirzapur is comprised of alluvium (66.17%), older sediment (4.75%), quartzite (28.15%), and silt clay (0.93%). The quaternary deposits of the Son valley have been divided into five alluvial formations, the Sihawal, Khunteli, Patpara, Baghor, and Khetaunhi formations [41]. Several fieldwork visits have indicated that the rock-shelters are largely located in the plateau area and not on the plains. This distinction is quite stark. Prehistoric settlers appear to have followed the geomorphology of sandstone formations in the region for painting activities. The plains have far fewer rock art sites, although all the geomorphological parameters here have been given equal stress to provide a detailed glimpse of the region, both for present times and the past to delineate the preferences of the prehistoric hunter-gatherers.
The parameter of geomorphology has been given a normalized weightage of 24.90%. The Vindhyan Plateau, Banda Plain, Varanasi Plain, and Older Flood Plain received individual values of 9, 5, 3, and 1 depending on the presence of previously documented and newly found archaeological sites in each group. In Mirzapur, for example, most rock-shelters are situated in the Vindhyan Plateau.
Geo-hydrologically (Figure 5c), recent alluvium comprises 3.45%, sandstone comprises 74.20%, and older alluvium is 22.35% of the total geographic area. Geo-hydrology here has been an important criterion to assess the availability of water resources near to the rock art sites. The groundwater here is mostly restricted to the weathered residuals of sandstone, dolomite, and limestone fractured zone. Beneath the recent alluvium, older alluvium, silty clay, and sand, the groundwater is confined down to 300 m. All of the painted rock-shelter sites here are made of sandstone, which covers a large part of Mirzapur. The parameter of Geohydrology has been given a normalized weightage of 15.55%. The individual criterion sandstone, older alluvium, and recent alluvium received values of 8, 4, and 1, respectively. Sandstone obtained the highest value, since all the sites are congregated in sandstone hills in Mirzapur.

6.1.3. Impact of Geological Distribution on Archaeological Sites

Geologically (Figure 5d), the region of Mirzapur is comprised of alluvium (66.17%), older sediment (4.75%), quartzite (28.15%), and silty clay (0.93%). Older sediment represents the location for most of the surveyed sites in the region. The Ganga is the major river of Northern India, situated to the North of the Narmada river, and joined by various rivers from Southern India. Around 60 million years ago, the Deccan Trap basalt erupted in India, then situated near the equator, to create the present-day stream system. Intensive and extensive research conducted in past decades on sections of Belan and Son valley has led to the discovery of many Acheulian sites with stratigraphic control. Fluvial deposits on several occasions revealed stone tools ranging from the Acheulian to the Neolithic, and fresh field observations complement the fact that prehistoric tools primarily made of crypto-crystalline and occasionally quartzite are abundant in and around the area of Mirzapur. Srivastava [42] proposed three distinct climatic phases on the basis of calcrete formations in the alluvial sequences of the Ganga-Ramganga interfluves reinforced by clay mineralogical data. The stratigraphy of the Holocene period in the alluvial plains mainly represents the interposition of Aeolian and Lacustrine deposits. This reveals high-frequency changes in the hydrological system activated by monsoonal inconsistencies. The parameter of hydrogeology has been given a normalized weightage of 38.60%. In the local geology, painted sandstone shelters located in the older sediment and alluvium together might delineate the choice of the mobile hunter-gatherers in terms of prehistoric site selection and mobility pattern. This is why, in the ranking criteria, older sediment, alluvium, quartzite, and silty clay have been given individual ranks of 9, 7, 3, and 1. The sites are located in rocky regions where sandstones are plentiful and they are located away from the alluvial plains. It is quite probable that prehistoric hunter-gatherers deliberately avoided the alluvial plains due to natural hazards like flood. The rock art sites might have been used as areas of congregation and the imageries probably assisted the prehistoric dwellers to communicate group identities among several small bands.

6.1.4. Geo-Mineralogy and Distribution of Archaeological Sites

From geo-mineralogical point of view (Figure 5e), the Banda Alluvium represents 34.93%, Laterite 1.62%, Middle Vindhyan 30.81%, Terrace Alluvium 7.83%, Upper Vindhyan 4.01%, and Varanasi Alluvium 20.80% of the total lithological unit. The model of geo-mineralogy of the area predicts that the Middle Vindhyan unit of the district is equally important in terms of finding and locating new prehistoric sites, adding cultural heritage value to the region. Together, the Banda and Varanasi Alluvium forms the older alluvium group that is lower to Late Pleistocene in age. The Banda Alluvium is comprised of polycyclic sequences of grey to yellowish grey clay and silt with quartzo-feldspathic sand, whereas the Varanasi Alluvium shows evidence of polycyclic sequences of yellowish brown to khaki silt clay with ferruginous sand and kankar. The lower, middle, and upper Vindhyan, together known as the Vindhyan supergroup, forms one of the largest and thickest sedimentary successions in the world [43]. The Middle Vindhyan unit forming the Kaimur group is composed of quartzite and shale and is Neo-Proterozoic in age. Similarly, the Upper Vindhyan is composed of shale and sandstone and forms the Rewa group. Terrace alluvium, being Holocene in age, forms the newer alluvium group and has an alternate sequence of grey to khaki silty-clay and sand. Finally, the laterite capping with dark brown and maroon colour with dense limonite forms a part of the lithological unit. The parameter of geominerlogy has been given a normalized weighting of 9.5%. The Upper Vindhyan, Banda Alluvium, Middle Vindhyan, Varanasi alluvium, Laterite, and Terrace Alluvium received values of 9, 8, 6, 4, 2, and 1, respectively. The Upper Vindhyan group, having received the highest value, indicates its association with the maximum number of sites in the region. The values decrease gradually as the number of sites decrease in the other regions. The hunter-gatherers used crypto-crystalline materials, such as locally available chert, chalcedony, quartz, jasper, agate, and other such materials, to make prehistoric tools like blades, scrapers, burins, awls, points, etc. On-foot surveys and field-work in this region suggest that the Upper Vindhyan group provided ample raw materials to the prehistoric hunter-gatherers to make stone tools. The presence of greater number of painted rock-shelters in this region, along with raw materials for stone tool production, is probably, therefore, no coincidence, and it is important to understand and acknowledge the geo-mineralogical component to understand the availability of local raw materials and their proximity to painted rock-shelters.
There is some overlap between geohydrological and geological types (e.g., alluvium), but function-wise they have different operations. One type is more related to age of formation (geological), while the other type is related to hydrological behaviour of stratum (geohydrological). This is the set standard criteria followed by geologists. Alluvium classes are further refined in the geohydrological maps as recent alluvium, older alluvium, and sandstones. However, geologists focus on broader classes and their formations. That might be the reason distribution is not exactly the same in the thematic layers.

6.1.5. Aspect Maps in Relation to Archaeological Sites

The aspect maps of the area were divided into eight classes: namely, East, North-East, South-East, West, North, North-West, South-West, and South (Figure 5f). The highest values of 9, 7, 6, and 5 are given to East, North-East, South-East, and West, whereas lowest values of 4, 3, 2, and 1 have been assigned to North, North-West, South-West, and South. The Eastern aspect generally receives more sunlight than the Western one. The weightings also reflect that in this area North, North-West, West, and South-West slopes generally provide greater opportunities for rock painting to occur, since the creation of rock arts requires good sunlight. For the same reason, North-East, East, South-East, and South slopes are subject to lower weightings. The aspect parameter has been given a normalized weighting of 3.44%. This parameter is also important when analysed with emphasis on the role of social choice and the production and consumption of rock art in the past. Sites facing specific directions that have paintings at specific locations of the rock-shelter suggest the existence of ritual/sacred sites and/or hidden sites within an artificially constructed and contested landscape within the natural setting.

6.1.6. Impact of Slope on Archaeological Sites Distribution

Topography is an important physiographic factor related to human, wind, and flood behavior, and hence has the potential to affect the creation of rock art and the archaeology of an area. The area under study is very close to the River Ganges, which is perennial in nature and responsible for frequent flooding in the region. An area with very low slope has a greater chance of flood risk than a higher one. Therefore, the chances of finding rock art increase more towards higher slope than lower ones. The DEM (Figure 5g) of the area is converted into slope with only two categories, termed as low and high slope shown in Figure 5h. The frequency of sites decreases gradually with a lower slope. The locations of the sites reveal that almost all are situated in higher slope areas along the South-Western parts of the Mirzapur district. The slope parameter has been given a normalized weighting of 5.65%, in which high and low slopes take the values of 8 and 1, respectively. Characterising the present sites in terms of slope, the model predicts the possibility of finding other sites in the higher slope areas of the Mirzapur. Enhanced density of rock-shelters occurs at higher elevations, suggesting sacred or ritual sites hidden within the thickly vegetated forest cover and the presence of fewer sites at the lower elevations along the small rivulets suggests camp sites where the prehistoric hunter-gatherers might have preferred to carry out their utilitarian activities. By considering all the above parameters, the following equation (Equation (6)) has been estimated for the Delineation of Rock Art (DRA) using the weighting as provided by the MCE analysis, which is discussed in Section 4.
D R A = 38.6 * G e o log y + 24.9 * G e o m o r p h o log y + 15.55 * G e o h y d r o log y + 9.5 * G e o min e r a log y + 5.65 * S l o p e + 3.44 * A s p e c t + 2.35 * V i c i n i t y o f w a t e r r e s o u r c e s  

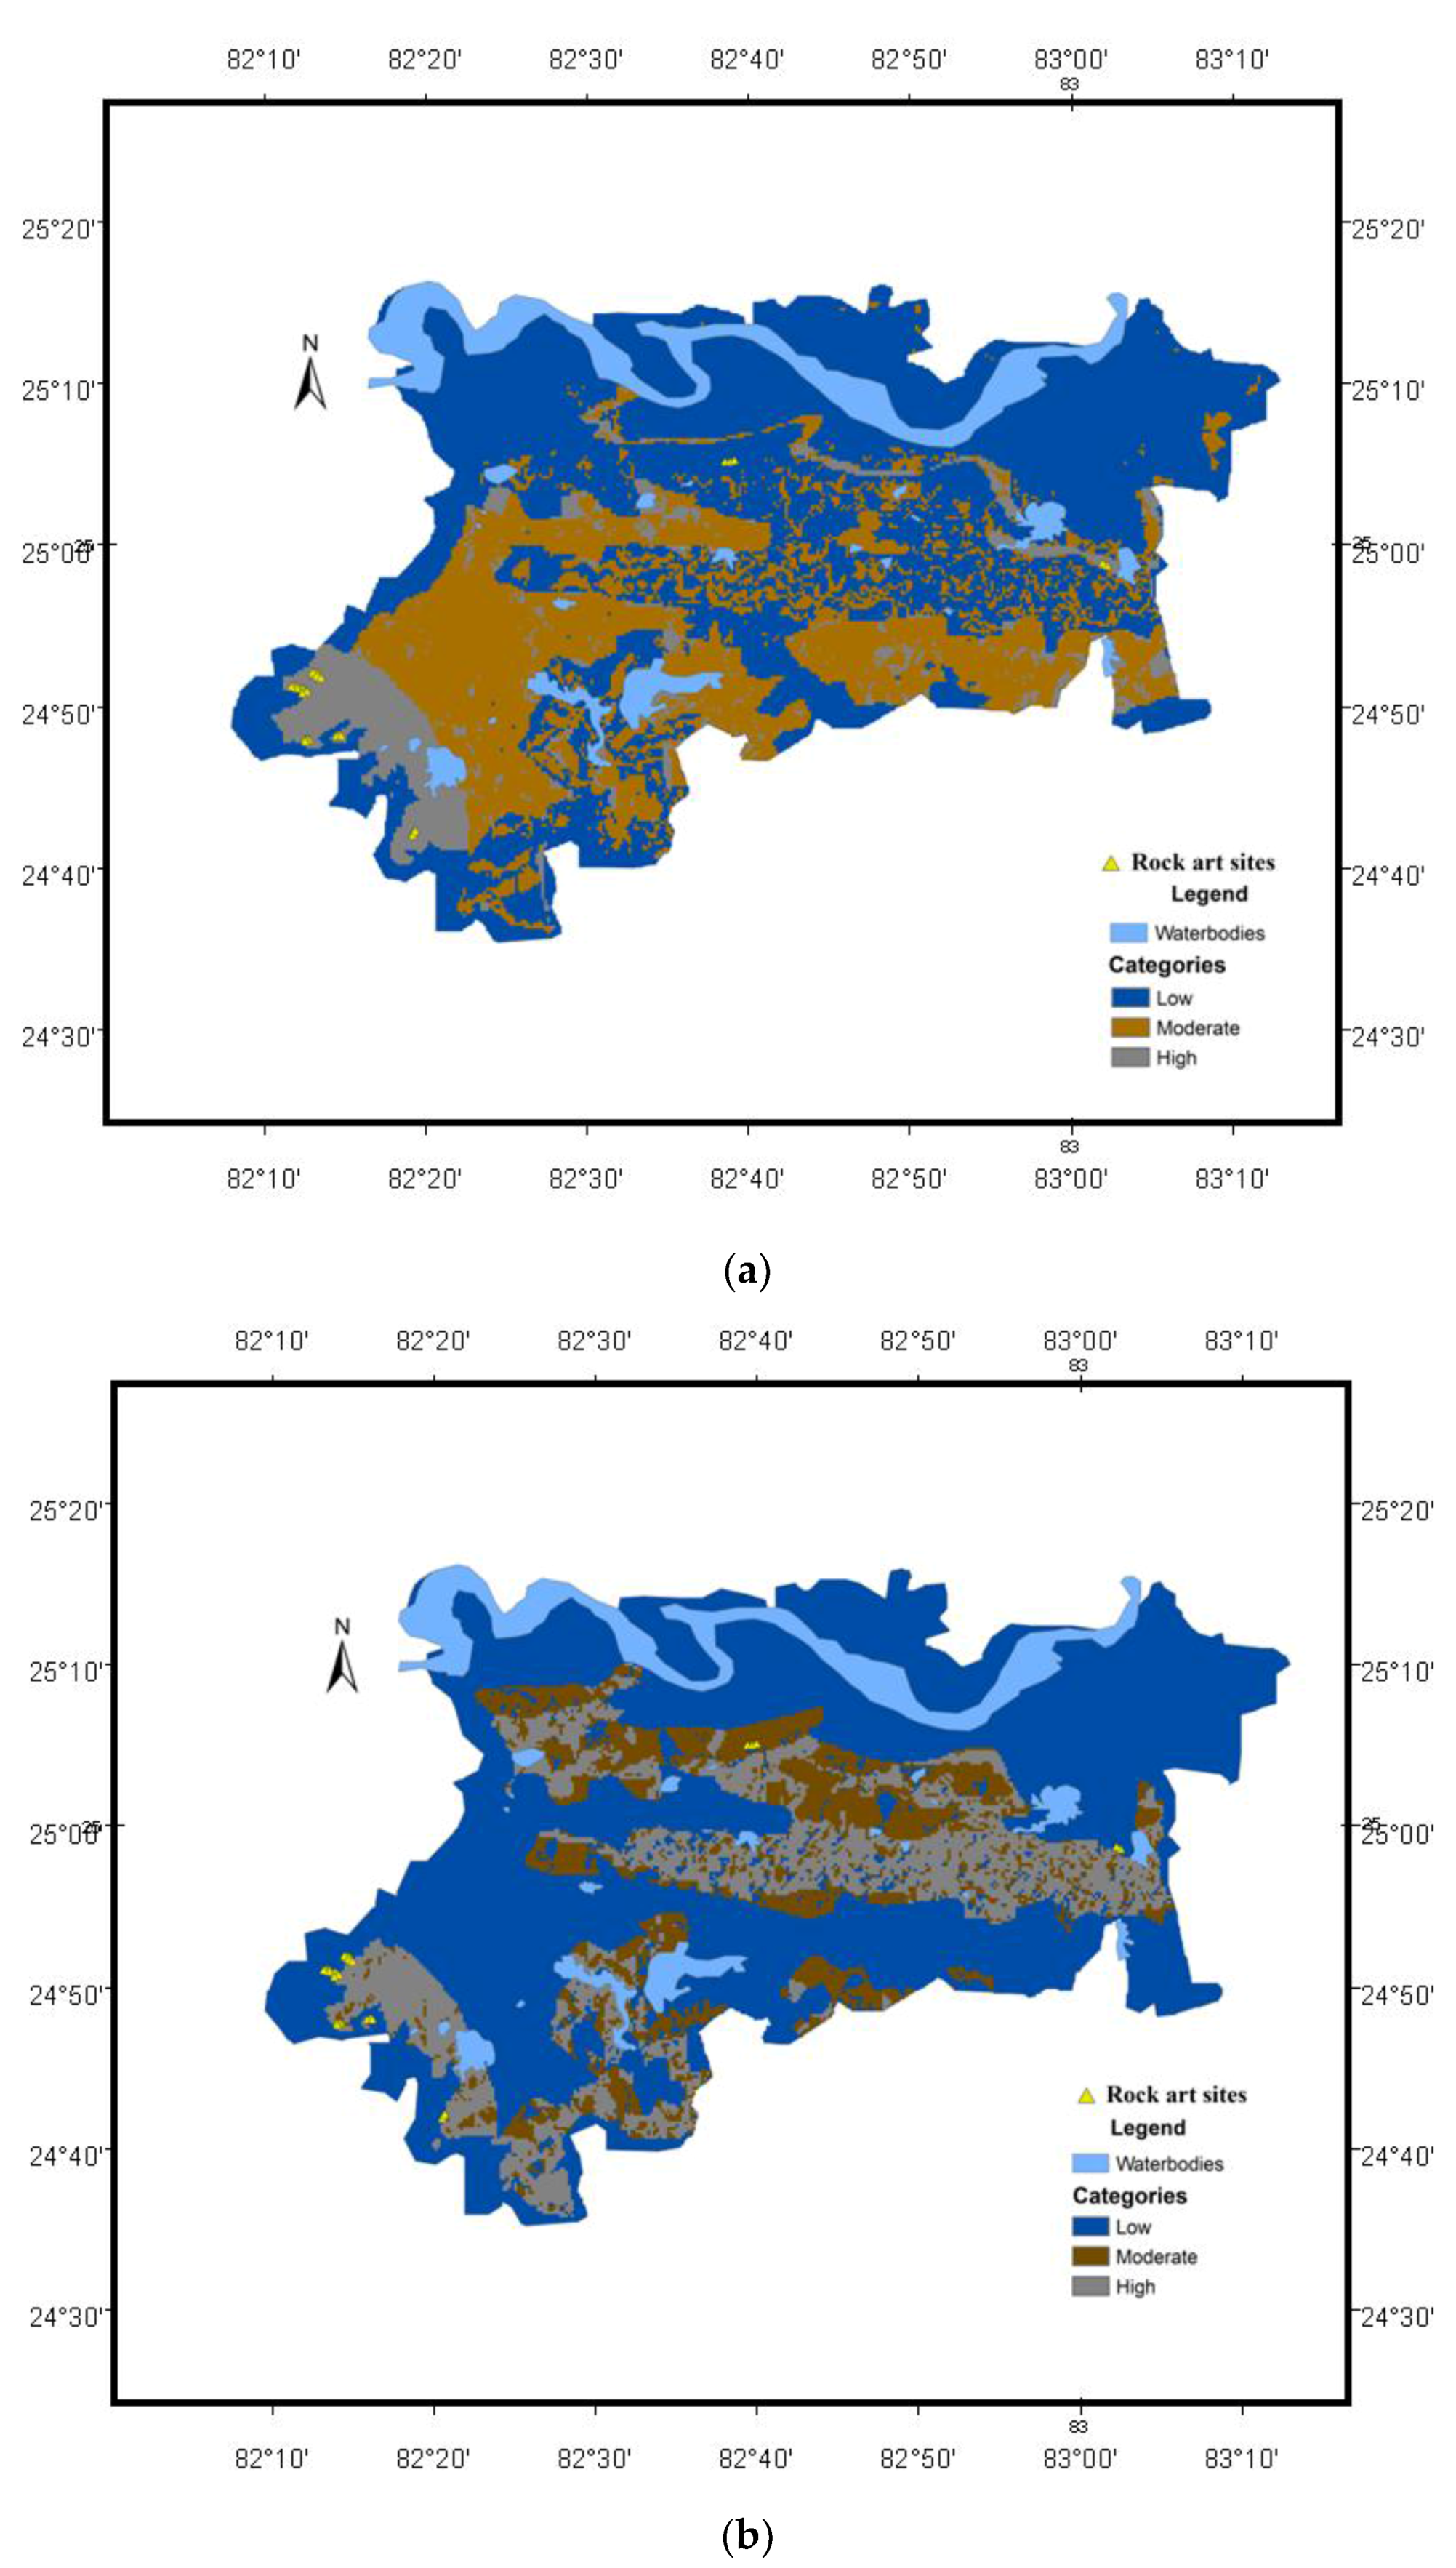
6.2. Rock Art Prospection Using the Fuzzy Logic System

The fuzzy logic approach helped substantially to understand the distribution of rock art sites in a region that vividly demonstrates the prehistoric land use patterns determining locale, the vicinity to water resources, and the availability of sandstone rock-shelters, both large and small, for painting activities and congregational and other ritualistic purposes.
Apart from the AHP-MCE based method, for a given location the fuzzy logic uses the seven crisp inputs—vicinity of water resources, geomorphology, geohydrology, geology, geomineralogy, aspect, and slope, and outputs the likelihood of painted rock art sites as Low (L), Moderate (M), and High (H). Likelihood categories can be produced with the help of a MFs graph that defines how each point in the input space is mapped to a membership value between 0 and 1. The input space in fuzzy logic refers to the universe of discourse, which contains all the possible elements of concern for rock art mapping. In Figure 6, the values L, M, and H denote the universe of discourse. We might say that the one is higher than the other, but such distinction is generally unhelpful, as it is not clear by what degree one is higher than the other. A better way of defining is through graphical representation, showing a smooth varying curve that passes from low to high. The output axis is a number known as membership value, between 0 and 1. The transition from low to high is known as membership function, which shows a significant difference between the categories chosen. Input variables for rock art prediction are chosen based on their ranking and feature score, e.g., the MFs for geology has four variables: older sediment, alluvium, quartzite, and silty clay, categorised as Very High (VH), High (H), Moderate (M), and Low (L), while geomorphology has also four variables, Vindhyan Plateau, Banda Plain, Varanasi Plain, and older flood plain, categorised as Very High (VH), High (H), Moderate (M), and Low (L). Similarly, the other crisp inputs used in this study can be generated through Table 2 with respect to their features and categories. The variables used in the FLS are briefly discussed in 5.1 and its subsections with respect to their influence on rock art sites and ranking. These crisp fuzzy inputs are assimilated into the inference in which the fuzzy rule base manages the inference for yielding a crisp fuzzy output (Figure 6). The degree of membership is determined based on the relations between the inputs, for which the desired output can be achieved. By taking the criteria (defined by the weightings in 6.1) as the vicinity of water resources, aspect, geo-hydrology, and slope are Low, and geo-mineralogy, geo-morphology, and geology are High; the rock art sites predicted by the model yielded a higher performance. (For these inputs, probability of finding new rock art sites was much more plausible and feasible than for the other possible assumptions).
According to the fuzzy logic, far Eastern and Northern parts of Mirzapur demonstrate fewer rock art sites, being very close to the Ganga river and on the floodplain, while the Southern and South-Western parts of Mirzapur represent higher concentrations of rock art. The sites are mostly located on the hilly terrains of Vindhyan Plateau. The Low, Moderate, and High regions given by the fuzzy logic model correspondingly signify the presence of no/lesser rock art, very few sites, and highly painted rock art sites, respectively.

6.3. Validation of the Predictive Model

Field-work and exploration in Mirzapur and adjoining regions over three years revealed many new painted shelters with archaeological deposits in them. To support the results, a plethora of stone tools (Figure 7) have been found from the painted rock art sites, indicating rich archaeological deposits. Some examples of rock art discovered are shown in Figure 8. The images have been enhanced using D-Stretch software for better visibility, as the actual images are quite discoloured and faded, and it is quite difficult to distinguish several of the motifs and other associated imageries. Almost all the surveyed rock-shelters that had paintings are entirely made of sandstone [44,45]. Survey suggests that some rock-shelters in this region might have had rock-paintings in the past, but due to anthropogenic, climatological, and, mostly, taphonomic action, the rock art is rapidly disappearing from these sites. The sites are more frequently found distributed away from the major rivers of the region, such as the River Ganges. They are situated along the small seasonal and/or perennial streams and springs. The South-Western part of Mirzapur represented the highest density of rock art clusters (see Figure 9). The South-Western part is located in the rocky outcrop of the region, a natural choice for the hunter-gatherers to look for rock-shelters made of Vindhyan Sandstone for painting purposes, offering a suitable region of interest, whereas the North-Eastern part is situated near to the Ganges flood plain, particularly in the alluvium rich area.
Nearly 30 rock art clusters have been discovered in the region. The field data clearly suggests a preponderance and congregation of sites at the higher elevations and along the South-Western part of Mirzapur. The validation MCE-GIS simulated results show that out of 30 rock art cluster points obtained using GPS (Global positioning System), 25 points are falling where the model simulated results indicated a very high chance of rock art with an accuracy of 83.33%, and the remaining 5 points fall within regions low and moderate probabilities (accuracy 16.67%). Similar validation results are also obtained in the case of fuzzy logic, which indicates that both methods are performing equally well (Figure 9). The main advantage of AHP-GIS has been its easy implementation and lower complexity compared to fuzzy logic, which requires more sophisticated computation. The application of fuzzy logic has been useful in this research, since it not only confirms an already deployed MCE-AHP model but is also in agreement with the field data. All the models envisaged in this study are in full agreement with the field-work data and can be implemented for future research work in adjoining regions.

7. Conclusions

Research and surveys have demonstrated the role of geography and geology in determining the choices of the hunter-gatherers in terms of the production of rock art at these sites. The application of predictive maps in the near future would save significant time and other resources related to original research work. This research successfully enabled the mapping of the rock-shelters in different parts of Mirzapur, modelling them for different elevations and regions. The location and characterisation of the rock-art sites in the present day landscape context have been revealed using GIS, field-work, and satellite topography data, in addition to the Fuzzy Logic System. These tools were found to be effective and efficient at building a model for visualising and understanding the spatial distribution of the factors influencing prehistoric social choice behind the formation of painted archaeological sites. The database built into this study provides a useful starting point to better understand the unresolved problems of rock art evolution, along with the formation and possible relationship between the archaeological sites of Mirzapur in the past and the present-day landscape. Both the sandstone rock-shelters and landscape are immobile and not susceptible to large scale changes. This methodology would aid the exploration and detection of several other potential sites within and outside the surveyed region, examining the concept of sacred and camp sites and their hidden and open aspects within the landscape.
The whole of the Central and Southern region also showed moderate potential for the presence of many new and previously undocumented rock art sites. Future research work in these regions and localities along the local streams and rivulets might produce numerous further occurrences of painted sites. Regions in close proximity to the river did not reveal the presence of any rock art site from the survey and exploration. More research in the near future would pave the way to create a contingency plan to conserve and preserve the cultural heritage of Mirzapur and adjoining regions by exploring and documenting the existing sites throughout this part of Central India. This work will further help to identify the rock art sites of neighbouring districts, while the methodology delineated here could be superimposed on other potential archaeological landscapes across India as a whole. It is expected that this work will open up new avenues in the field of remote sensing and geographical information systems application in archaeology.

Author Contributions

“Conceptualization, AWG, RB and PKS; Methodology, PKS; Software, PKS and RB; Validation, AWG, and RB; Formal Analysis, GPP, RB and PKS; Investigation, RB and PKS; Resources, RB, PKS and AWG; Data Curation, PKS and RB; Writing-Original Draft Preparation, All; Writing-Review & Editing, All; Visualization, PKS and RB; Supervision, AWG and PKS; Project Administration, AWG and RB; Funding Acquisition, AWG and RB”.

Funding

There is no external funding to report.

Acknowledgments

The first author is highly thankful to the Archaeological Survey of India, Janpath, New Delhi for granting the permission to pursue field-work in this region. Sincere and heartfelt thanks go to the local guides and villagers of Mirzapur, Rewa and adjoining areas for their support and cordial and timely help regarding the field-work, transportation, food, and lodging at the villages while conducting exploration, discovery, and documentation of several new rock-art sites in the region. The first author received University of Bristol Centenary Research Scholarship which supported this research endeavour. The research travel grants provided by the Graduate School of Arts and Humanities, University of Bristol, are highly acknowledged. Additional proofreading provided by A.K. King is highly acknowledged.

Conflicts of Interest

The authors declare no conflict of interest.

References

  1. Banerjee, R. Elephants in Indian Rock Art: An Appraisal for Relative Chronology; Centre for Asian Studies, University of Kelaniya: Kelaniya, Sri Lanka, 2016. [Google Scholar]
  2. García-Diez, M.; Garrido, D.; Hoffmann, D.; Pettitt, P.; Pike, A.; Zilhão, J. The chronology of hand stencils in europeanpalaeolithic rock art: Implications of new u-series results from el castillo cave (Cantabria, Spain). J. Anthropol. Sci. 2015, 93, 135–152. [Google Scholar] [PubMed]
  3. Wright, A.M. Assessing the stability and sustainability of rock art sites: Insight from southwestern Arizona. J. Archaeol. Method Theory 2017, 25, 1–42. [Google Scholar] [CrossRef]
  4. Guagnin, M.; Shipton, C.; el-Dossary, S.; al-Rashid, M.; Moussa, F.; Stewart, M.; Ott, F.; Alsharekh, A.; Petraglia, M.D. Rock art provides new evidence on the biogeography of kudu (Tragelaphusimberbis), wild dromedary, aurochs (Bosprimigenius) and African wild ass (Equusafricanus) in the early and middle holocene of north-western Arabia. J. Biogeogr. 2018, 45, 727–740. [Google Scholar] [CrossRef]
  5. Blinkhorn, J. Erwin Neumayer. Prehistoric rock art of India; Oxford university press: New Delhi, India, 2013. [Google Scholar]
  6. Banerjee, R.; Srivastava, P.K. Remote sensing based identification of painted rock shelter sites: Appraisal using advanced wide field sensor, neural network and field observations. In Remote Sensing Applications in Environmental Research; Springer International Publishing: Cham, Switzerland, 2014; pp. 195–212. [Google Scholar]
  7. Tripathi, A. Remote Sensing and Archaeology; Sundeep Prakashan: Delhi, India, 2005. [Google Scholar]
  8. Ray, H.; Ravindranath, S. The archaeology of ritual spaces: Satellite images and early chalukyan temples. Man Environ. 2007, XXXII, 89–101. [Google Scholar]
  9. Campana, S.; Forte, M.; Liuzza, C. (Eds.) Space, Time, Place: Third International Conference on Remote Sensing in Archaeology, 17–21 August 2009, Tiruchirappalli, Tamil, Nadu, India; British Archaeological Reports Ltd.: Tiruchirappalli, India, 2010. [Google Scholar]
  10. Srivastava, P.K.; Han, D.; Rico-Ramirez, M.A.; Bray, M.; Islam, T. Selection of classification techniques for land use/land cover change investigation. Adv. Space Res. 2012, 50, 1250–1265. [Google Scholar] [CrossRef]
  11. Srivastava, P.K.; Han, D.; Gupta, M.; Mukherjee, S. Integrated framework for monitoring groundwater pollution using a geographical information system and multivariate analysis. HydrolSci. J. 2012, 57, 1453–1472. [Google Scholar] [CrossRef] [Green Version]
  12. Singh, S.K.; Srivastava, P.K.; Gupta, M.; Thakur, J.K.; Mukherjee, S. Appraisal of land use/land cover of mangrove forest ecosystem using support vector machine. Environ. Earth Sci. 2014, 71, 2245–2255. [Google Scholar] [CrossRef]
  13. Srivastava, P.K.; Mukherjee, S.; Gupta, M.; Islam, T. Remote Sensing Applications in Environmental Research; Springer International Publishing: Cham, Switzerland, 2014; ISBN 978-3-319-05905-1. [Google Scholar]
  14. Maurya, S.; Srivastava, P.K.; Gupta, M.; Islam, T.; Han, D. Integrating soil hydraulic parameter and microwave precipitation with morphometric analysis for watershed prioritization. Water Resour. Manag. 2016, 30, 5385–5405. [Google Scholar] [CrossRef]
  15. Niccolucci, F.; Hermon, S. Estimating subjectivity of typologists and typological classification with fuzzy logic. Archeol. Calc. 2002, 13, 217–232. [Google Scholar]
  16. Wu, F. Simulating urban encroachment on rural land with fuzzy-logic-controlled cellular automata in a geographical information system. J. Environ.Manag. 1998, 53, 293–308. [Google Scholar] [CrossRef]
  17. Burrough, P.A.; van Gaans, P.F.; MacMillan, R. High-resolution landform classification using fuzzy k-means. Fuzzy Sets Syst. 2000, 113, 37–52. [Google Scholar] [CrossRef]
  18. De Runz, C.; Desjardin, E.; Piantoni, F.; Herbin, M. Using fuzzy logic to manage uncertain multi-modal data in an archaeological GIS. In Proceedings of the International Symposium on Spatial Data Quality-ISSDQ, Enschede, The Netherlands, 13–15 June 2007. [Google Scholar]
  19. De Runz, C.; Desjardin, E.; Piantoni, F.; Herbin, M. Management of multi-modal data using the fuzzy hough transform: Application to archaeological simulation. In Proceedings of the First IEEE International Conference on Research Challenges in Information Science, Ouarzazate, Morocco, 23–26 April 2007; pp. 351–356. [Google Scholar]
  20. Gupta, M.; Srivastava, P.K. Integrating GIS and remote sensing for identification of groundwater potential zones in the hilly terrain of Pavagarh, Gujarat, India. Water Int. 2010, 35, 233–245. [Google Scholar] [CrossRef]
  21. Parcak, S.H. Satellite Remote Sensing for Archaeology; Routledge: Abingdon-on-Thames, UK, 2009. [Google Scholar]
  22. Wiseman, J.; El-Baz, F. Remote Sensing in Archaeology; Springer: Berlin, Germany, 2007. [Google Scholar]
  23. Rajani, M.; Kasturirangan, K. Sea-level changes and its impact on coastal archaeological monuments: Seven pagodas of mahabalipuram, a case study. J. Indian Soc. Remote Sens. 2012, 41, 1–8. [Google Scholar] [CrossRef]
  24. Rajani, M.; Rajawat, A. Potential of satellite based sensors for studying distribution of archaeological sites along palaeo channels: Harappan sites a case study. J. Archaeol. Sci. 2011, 38, 2010–2016. [Google Scholar] [CrossRef]
  25. Drake-Brockman, D. Mirzapur: A Gazetteer; Superintendent Government Printing: Allahabad, India, 1911. [Google Scholar]
  26. Chakrabarti, D.K.; Singh, R. Archaeology between ballia and robertsganj in uttarpradesh; notes on some early historic routes of the area. South Asian Stud. 1998, 14, 103–118. [Google Scholar] [CrossRef]
  27. Pant, P.C. Prehistoric Uttar Pradesh: A Study of Old Stone Age; Agam Kala Prakashan: New Delhi, India, 1982. [Google Scholar]
  28. Misra, V. Prehistoric human colonization of India. J. Biosci. 2001, 26, 491–531. [Google Scholar] [CrossRef] [PubMed] [Green Version]
  29. Alexakis, D.; Sarris, A.; Astaras, T.; Albanakis, K. Detection of neolithic settlements in thessaly(Greece) through multispectral and hyperspectral satellite imagery. Sensors 2009, 9, 1167–1187. [Google Scholar] [CrossRef] [PubMed]
  30. Kvamme, K.L. Geographic information systems in regional archaeological research and data management. Archaeol. Method Theory 1989, 1, 139–203. [Google Scholar]
  31. Saaty, T.L. Analytic Hierarchy Process; McGraw-Hill: New York, NY, USA, 1980. [Google Scholar]
  32. Srivastava, P.K.; Mukherjee, S.; Gupta, M. Impact of urbanization on land use/land cover change using remote sensing and GIS: A case study. Int. J. Ecol. Econ. Stat. 2010, 18, 106–117. [Google Scholar]
  33. Saaty, T.L. An exposition on the ahp in reply to the paper “remarks on the analytic hierarchy process”. Manag. Sci. 1990, 36, 259–268. [Google Scholar] [CrossRef]
  34. Islam, T.; Srivastava, P.K.; Gupta, M.; Zhu, X.; Mukherjee, S. Computational Intelligence Techniques in Earth and Environmental Sciences; Springer: Dordrecht, The Netherlands, 2014; ISBN 978-94-017-8642-3. [Google Scholar]
  35. Badenko, V.; Kurtener, D.; Yakushev, V.; Torbert, A.; Badenko, G. Evaluation of current state of agricultural land using problem-oriented fuzzy indicators in GIS environment. In Proceedings of the International Conference on Computational Science and Its Applications, Beijing, China, 4–7 July 2016; pp. 57–69. [Google Scholar]
  36. Zadeh, L.A. Toward a theory of fuzzy information granulation and its centrality in human reasoning and fuzzy logic. Fuzzy Sets Syst. 1997, 90, 111–127. [Google Scholar] [CrossRef]
  37. Zadeh, L.A. Fuzzy logic. Computer 1988, 21, 83–93. [Google Scholar] [CrossRef]
  38. Zadeh, L.A. Fuzzy logic, neural networks, and soft computing. Commun. ACM 1994, 37, 77–84. [Google Scholar] [CrossRef]
  39. Islam, T.; Rico-Ramirez, M.A.; Han, D.; Bray, M.; Srivastava, P.K. Fuzzy logic based melting layer recognition from 3 ghz dual polarization radar: Appraisal with nwp model and radio sounding observations. Theor. Appl. Clim. 2013, 112, 317–338. [Google Scholar] [CrossRef]
  40. Roper, D.C. The method and theory of site catchment analysis: A review. Adv. Archaeol. Method Theory 1979, 2, 119–140. [Google Scholar]
  41. Williams, M.A.J.; Pal, J.; Jaiswal, M.; Singhvi, A. River response to quaternary climatic fluctuations: Evidence from the son and belan valleys, north-central India. Q. Sci. Rev. 2006, 25, 2619–2631. [Google Scholar] [CrossRef]
  42. Srivastava, P.; Singh, I.B.; Sharma, S.; Shukla, U.K.; Singhvi, A.K. Late pleistocene–holocene hydrologic changes in the interfluve areas of the central Ganga Plain, India. Geomorphology 2003, 54, 279–292. [Google Scholar] [CrossRef]
  43. Ray, J.S. Age of the vindhyansupergroup: A review of recent findings. J. Earth Syst. Sci. 2006, 115, 149–160. [Google Scholar] [CrossRef]
  44. Mathpal, Y. Depicted in the Mesolithic Rock Paintings of Central India; Brill Academic Pub.: Leiden, The Netherlands, 1985; p. 177. [Google Scholar]
  45. Cockburn, J. Art. V.—Cave Drawings in the Kaimūr Range, North-West Provinces. J. R. Asiat. Soc. 1899, 31, 89–97. [Google Scholar] [CrossRef]
Figure 1. Location of study area (Mirzapur, India).
Ijgi 07 00326 g001
Figure 2. Conceptual model of trapezoidal membership function.
Ijgi 07 00326 g002
Figure 3. Fuzzy architecture employed in this study.
Ijgi 07 00326 g003
Figure 4. Overview of the methodology used in this study.
Ijgi 07 00326 g004
Figure 5. Different thematic maps used in this study: (a) vicinity of water resources from archaeological sites, (b) geomorphology, (c) geohydrology, (d) geology, (e) geomineralogy, (f) aspect, (g) exaggerated DEM, (h) slope of the study derived from DEM.
Ijgi 07 00326 g005
Figure 6. Fuzzy logic output.
Ijgi 07 00326 g006
Figure 7. Non-patinated microliths from one of the painted rock-art sites in Mirzapur.
Ijgi 07 00326 g007
Figure 8. Painted rock shelters discovered during the field survey (a) Battle scene (b) Painting of Deer (c) Pair of Deer (d) Group of animals and hunting expedition.
Ijgi 07 00326 g008
Figure 9. Rock art sites based on (a) AHP-MCE approach and (b) Fuzzy logic.
Ijgi 07 00326 g009
Table 1. Weighting values of the variables.
GeologyGeomorphologyGeohydrologyGeomineralogicalSlopeAspectVicinity of water resourcesNormalized Weights (%)
Geology 1 38.6
Geomorphology0.51 24.9
Geohydrology0.250.51 15.55
Geomineralogical0.1670.250.51 9.5
Slope0.1430.1670.250.51 5.65
Aspect0.1250.1430.1670.250.51 3.44
Vicinity of water resources0.1110.1250.1430.1670.250.512.35
CR0.061
Table 2. Weighting values and consistency ratio according to different parameters.
S.No.ThemeOverall Rank of ThemeWeightingFeature/VariableIndividual Rank of FeatureConsistency RatioFLS
1Geology938.6Older sediment90.06VH
Alluvium7 H
Quartzite3 M
Silty clay1 L
2Geomorphology824.9Vindhyan Plateau90.07VH
Banda plain5 H
Varanasi plain3 M
Older flood plain1 L
3Geohydrology715.55Sandstone80.08H
Older alluvium4 M
Recent alluvium1 L
4Geomineralogical69.5Upper Vidhyan90.07VH
Banda alluvium8 H
Middle Vidhyan6 M
Varanasi alluvium4 L
Laterite2 VL
Terrace alluvium1 VVL
5Slope45.65High80.00H
Low1 L
6Aspect23.44East90.05EH
North-East7 VVH
South-East6 VH
West5 H
North4 M
North-West3 L
South-West2 VL
South1 VVL
7Vicinity of water resources12.35Near90.02H
Moderate4 M
Far1 L
EH = Extreme High, VVH = Very Very High, VH = Very High, H = High, M = Moderate, L = Low, VL = Very Low, VVL = Very Very Low.

