Review

The Scope of Earth-Observation to Improve the Consistency of the SDG Slum Indicator

1
Faculty of Geo-Information Science and Earth Observation (ITC), University of Twente, 7514 AE Enschede, The Netherlands
2
Department of Philosophy, University of Twente, 7522 NB Enschede, The Netherlands
*
Author to whom correspondence should be addressed.
ISPRS Int. J. Geo-Inf. 2018, 7(11), 428; https://0-doi-org.brum.beds.ac.uk/10.3390/ijgi7110428
Submission received: 31 August 2018 / Revised: 10 October 2018 / Accepted: 27 October 2018 / Published: 1 November 2018
(This article belongs to the Special Issue Geo-Information and the Sustainable Development Goals (SDGs))

Abstract

:
The continuous increase in deprived living conditions in many cities of the Global South contradicts efforts to make cities inclusive, safe, resilient, and sustainable places. Using examples of Asian, African, and Latin American cities, this study shows the scope and limits of earth observation (EO)-based mapping of deprived living conditions in support of providing consistent global information for the SDG indicator 11.1.1 “proportion of urban population living in slums, informal settlements or inadequate housing”. At the technical level, we compare several EO-based methods and imagery for mapping deprived living conditions, discussing their ability to map such areas including differences in terms of accuracy and performance at the city scale. At the operational level, we compare available municipal maps showing identified deprived areas with the spatial extent of morphological mapped areas of deprived living conditions (using EO) at the city scale, discussing the reasons for inconsistencies between municipal and EO-based maps. We provide an outlook on how EO-based mapping of deprived living conditions could contribute to a global spatial information base to support targeting of deprived living conditions in support of the SDG Goal 11.1.1 indicator, when uncertainties and ethical considerations on data provision are well addressed.

Graphical Abstract

1. Introduction

According to UN-Habitat, around 1 billion humans live in areas of deprived living conditions lacking basic necessities of life, where inhabitants and, in particular, children (being more vulnerable than adults) are faced with unhealthy living environments [1]. With continued high urbanization rates, in particular, in Asia and Africa, and the low capacity of the formal housing sector to provide affordable housing to low-income groups, much of this growth will lead to the expansion of settlements with deprived living conditions, in global statistics and policy reports commonly referred to as slums. The SDG Goal 11, which aims at inclusive, safe, resilient, and sustainable cities and human settlements, uses as one of its key indicators “the proportion of urban population living in slums, informal settlements or inadequate housing”. Current global statistics show a relative decline but an absolute increase of inhabitants living in such areas [1]. For example, in India and Tanzania, according to official statistics, the proportion of the slum population declined between 1990 and 2014, from 55% to 24% (India) and 77% to 51% (Tanzania) [2]. This information relies on national reporting based on census and survey information, and involves reporting and consistency problems at several levels [3]. In general, statistics on slums, informal settlements, or inadequate housing (summarized as areas of deprived living conditions and hereafter called deprived areas) are reported by national governments; such national–officially reported and local statistics (e.g., by NGOs) often show disparities [4]. For example, in Bangalore (India), the Karnataka Slum Development Board [5] officially recognized 597 slums, while a local survey by the Association for Promoting Social Action mapped over 1500 slums [6]. However, comparing the area of surveyed slums (169 ha) with the area of officially recognized slums (113 ha), highlights that, in particular, small slum pockets are not recognized. Furthermore, data on locations and growth dynamics of deprived areas are commonly unavailable, outdated, inconsistent, or exclude specific areas. Small settlements are commonly neglected by official statistics, as their size falls below a certain threshold, while for larger deprived areas, base information is uncertain (e.g., population estimates). For example, the population count (census) of Dharavi (Mumbai’s largest slum) in India is around 300,000 inhabitants, while a remote sensing-based estimate combined with ground information estimated 500,000 inhabitants [7]. In India, official slum maps covering notified and recognized slums commonly exclude a large number of slums, e.g., areas below a minimum size, or cities that have stopped notifications because they do not have the resources for upgrading (notified slums are entitled to basic upgrading) [8], while information on areas with inadequate housing beyond slums is not readily available. Moreover, global data repositories, e.g., the urban indicators published by UN-Habitat’s Global Urban Observatory, do not provide a consistent summary of the proportion of deprived areas or their population, per city across the globe. To summarize, consistency problems arise from variations in data collection methods and political and operational decisions of including deprived areas in official statistics, both at the local and global scale. This might result in a dramatic underestimation of the population living in such areas. To generate up-to-date spatial information on areas of deprived living conditions is essential to support effective pro-poor policies.
Very-high-resolution (VHR) satellite imageries (available at a spatial resolution of up to 30 cm) allow detecting areas with deprived living conditions, which have unique morphological characteristics [9]. These morphological characteristics and building structures (compared to formally developed areas) [10], i.e., relatively higher built-up densities with a lack of vegetation internally (compared to formal built-up areas), small building footprints, heterogeneity in orientation, and irregular layout patterns of areas, allow for the mapping of such areas with VHR imageries [11]. In general, Earth Observation (EO)-based methods can provide a relatively consistent mapping approach of land cover/use using uniform features/rules, allowing for frequent spatial and temporal coverage. These could, therefore, be used to produce up-to-date base information on the location and spatial dynamics of areas of deprived living conditions [3].
In the past years, several studies showed the capacity of EO-based methods for mapping deprived areas, e.g., using machine-learning methods [12,13]. Furthermore, recent developments have shown the capacity of EO-based maps to provide data at the city scale that allow one to compare cities across the globe regarding morphological slums [14]. To support monitoring the SDG indictor 11.1.1, the aim of our article is to provide an overview of suitable EO-based methods to monitor dynamics of areas with deprived living conditions (e.g., via physical proxies) and to estimate the population using EO-based maps combined with locally available (survey) data. Therefore, we formulated several research questions:
  • Which state-of-the-art, EO-based method is appropriate to generate spatial information on deprived areas at the city scale and can be scaled-up for a global data repository?
  • What are suitable approaches to address uncertainties of mapping results?
  • How can mapping products be publicly provided taking geo-ethics into account?
  • What is required to derive population estimates of inhabitants living in deprived living conditions from EO-based maps?
To address these four questions, the paper is split into the following sections. Section 2 provides an overview of the current methodology used to collect data and compute the SDG indicator 11.1.1, as well as critically reflect on its adequacy and effectiveness and its potential link to EO-based methods. Section 3 discusses potential EO-based data and methods to provide global statistics on the location, spatial extent, dynamics, and diversity of deprived areas. Section 4 deals with uncertainties in generating data on deprived areas and their link with accuracy assessment. Section 5 provides an overview of EO-based population estimates and how information on deprived areas should be communicated to the general public. For Section 3, Section 4 and Section 5, case studies drawn from African, Asian, and Latin American cities are used, illustrating the capacity and limitations of EO. Section 6 discusses the overall potential of EO-based maps in support of the SDG indicator 11.1.1. In Section 7, we conclude and outline recommendations and future directions to generate national and global statistics on people living in deprived conditions.

2. Overview of Methods to Provide Information for the SDG Indicator 11.1.1: From Survey to Remote Sensing-Based Methods

This section provides an overview of data and methods used by UN-Habitat to report for the SDG indicator 11.1.1, which is until now did not include remote sensing-based methods, and reflects on limitations to provide consistent and localized information on deprivation. The last part of this section provides an overview of remote sensing to localize information on deprivation and introduces subsequent sections.

2.1. Overview of the Method by UN-Habitat

The SDG Goal 11, which refers to inclusive, safe, resilient, and sustainable cities and human settlements, uses as one of its indicators “the proportion of urban population living in slums, informal settlements or inadequate housing”. According to the UN Statistic Division [15], this indicator is classified as a tier 1 indicator, meaning that it “is conceptually clear, has an internationally established methodology and standards are available, and data are regularly produced by countries for at least 50 percent of countries and of the population in every region where the indicator is relevant”. The global organizations dealing with this indicator are UN-Habitat and UNEP. Data are available at the Global Urban Indicators Database (UN-Habitat). The data are computed from household surveys and national census, including MICS (Multiple Indicator Cluster Surveys) and DHS (Demographic and Health Surveys). For the SDG indicator 11.1.1, UN-Habitat has expanded its conventional five slum indicators with the inadequate housing aspect. Inadequate housing, which is based on Article 25 of the Universal Declaration of Human Rights, includes in principle seven indicators, i.e., security of tenure, services, affordability, habitability, accessibility, location, and cultural adequacy [16]. However, due to the complexity of these indicators (Table 1), UN-Habitat only uses affordability to define inadequate housing, excluding all other indicators. Unaffordability is defined “as the net monthly expenditure on housing cost that exceeds 30% of the total monthly income of the household”. Thus, the SDG indicator 11.1.1 is computed as the (a) percentage of slum/informal settlements households (SISH) and (b) percentage of inadequate housing households (IHH) of the total city population. Data for inadequate housing are extracted from income or expenditures data via household surveys and are delivered at national level and partially at the city level. Spatial disaggregation is mentioned but is not clearly defined. Anticipated monitoring time intervals aim at 3–5 years. Using the inadequate housing indicator as an example, several German cities would be classified as places of inadequate housing, as their average household expenditure for renting is around or beyond 30%; poor households in large German cities spent on average 45% of their net income on rents [16], something that is not reported by the Federal Statistical Office of Germany within indicator 11.1.1.
UN-Habitat states that all countries employed the UN ‘slum’ definition, with minimal inconsistencies in the data collection [3]. However, consistency problems arise from variations within data collection methods, as well as political and operational decisions of including deprived areas into these official statistics. For example, for the city of Ahmedabad (India), the census stated 4.5% slum population in 2011 [17], while the municipality refers to 18% slum population at the same year [18]. A review of national census-based slum/informal areas definitions, a common input to compute SDG indicator 11.1.1, shows differences across countries (Table 2), limiting their comparability. Therefore, consistency problems exist both within countries (e.g., some local governments are more proactive to recognize/notify slums) and across countries (e.g., variations in minimum size of an area being considered). In this context, UN-Habitat admits a “lack of appropriate tools at national and city levels to measure all components required by Indicator 11.1.1, sometimes resulting in an underestimation of deteriorated housing units” [3]. Furthermore, the indicator does not capture homeless or floating population (e.g., pavement dwellers) and many countries and cities have a limited capacity of data collection.

2.2. Data Coverage and Aggregation Level of the Presently Available Information on the SDG Indicator 11.1.1

According to UN-Habitat, data in support of the SDG 11.1.1 indicator is available for all developing countries covering more than 320 cities worldwide. However, the UN-Habitat database at the World Bank site (https://data.worldbank.org/indicator/EN.POP.SLUM.UR.ZS (Visited on 23 April 2018)) misses several countries (it does this when excluding economies in transition too), e.g., Chile, Cuba, Malaysia, Mauritius, Nauru, Paraguay, Timor-Leste, Tonga, Trinidad and Tobago, and Uruguay. Many countries with missing data are small-island developing states, which might not have the capacity for regular household level data collection campaigns. Furthermore, economies in transition with a large Roma population are not included, though their settlements have often deprived living conditions [26], e.g., Figure 1 (left) shows a large settlement in Serbia but also small, deprived clusters in West European cities exists (Paris: Figure 1 (right)), which would be interesting to document.
Such global statistics are provided as one figure at the national level, or for some cities, as the proportion of slum dwellers at the city scale. However, this does not provide information about spatial characteristics and distribution of slums. For example, in Nairobi, around 60% of the deprived population is residing in approximately 4% of the built-up area, while in Dar es Salaam around 70% of the deprived population is living in 60% of the built-up area [27]. These two examples illustrate large physical differences of deprivation, notably that in Dar es Salaam such areas are less dense compared to Nairobi.

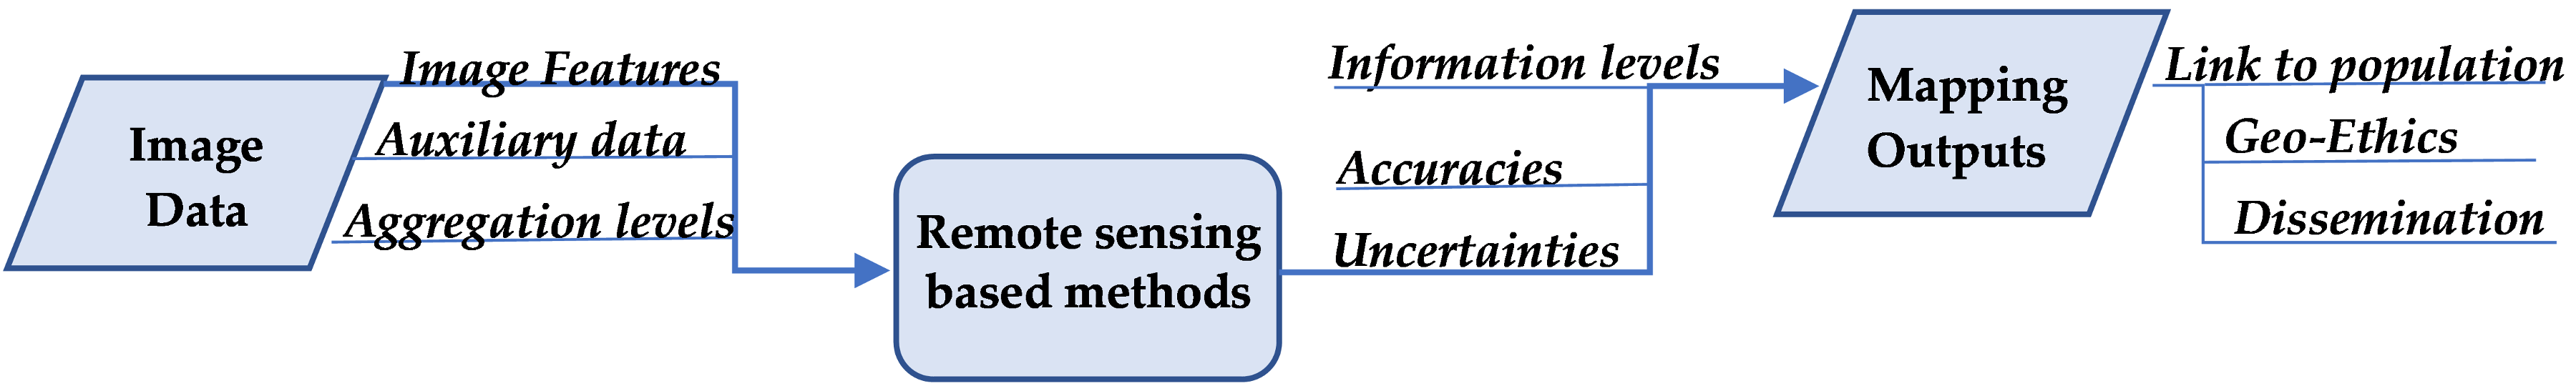
2.3. Major Remote Sensings Steps to Provide Localized Information on the SDG Indicator 11.1.1

Considering the SDG indicator 11.1.1, spatial information on the location and temporal dynamics is missing for local policy development; furthermore, communities and NGOs do not have such information in their hands (which is, for example, essential in case of evictions). Localized spatial information can be provided by remote sensing (Table 1), either directly or via image-based proxies using sample surveys or expert knowledge to train advanced algorithms. For this purpose, methodological advances in remote sensing on localizing deprived areas in support of the SDG indicator 11.1.1 are required (Figure 2). Recent methodological advances for mapping deprivation build on machine learning and suitable sensor systems to capture deprived areas at policy-relevant aggregation levels (Section 3). Furthermore, it is also important to make explicit the uncertainties of input and output data and their linkages with mapping accuracies (Section 4). Finally, population models need to be built, and localized data on deprivation need to be available that account for ethics (Section 5).

3. The Ability of Remote Sensing to Provide Data on Deprived Living Conditions at the City Level

This section provides an overview of suitable EO-data and methods to map areas of deprived living conditions at the city scale. Cases studies highlight the scope and the limitations of remote sensing-based mapping of deprived areas in support of localizing the SDG indicator 11.1.1. Two contrasting cases are used: Bangalore (India), a city where slums are often very small clusters, which are commonly not included in census statistics (the latest census data of 2011 show 8% of population as slum dwellers), and Dar es Salaam, where around 70% of the city has been developed without planning provision.

3.1. Suitable Remote Sensing Sensor Systems to Provide Localized Information on Deprived Areas

When employing remote sensing, a first major decision is the scale of mapping, i.e., building objects, or deprived areas at the city or national scale. Most remote-sensing studies, when mapping deprivation at area (settlement) scale, use VHR optical images (e.g., [12,28,29,30]). Such images have advantages due to their very-high spatial resolution (e.g., 30 cm WorldView-3 images) to show object details very clearly (Figure 3). However, such images are very costly (around 25 USD/km2 for an orthorectified image of 30 cm spatial resolution). Furthermore, a recent study showed that such VHR images are not strictly necessary when mapping the settlement extents [31] but might reduce classification accuracies due to unnecessary object-level complexity. Few studies have explored free images and low-cost data when mapping deprived areas, e.g., employing Sentinel-2 images (free of cost) [32] or SPOT 5 (lower cost) images [33]. In general, such data would allow due to its cost and computational efficiency to map deprived areas at regional and country scale. As an alternative, SAR data have been used, e.g., TerraSAR-X image [34,35,36] showing robust mapping results. Both data sources, optical and SAR, allow one to quantify the amount of roof coverage at settlement scale and could provide base data for the estimation of the deprived population [37].
When requiring the extraction of building objects in slum areas, VHR space-borne, Unmanned Aerial Vehicle (UAV) images [38,39] or LiDAR data [40] are required. For example, a UAV image with a spatial resolution of 3–5 cm allows the semi-automatic delineation of building outlines and provides building counts and highly accurate estimation of roof areas [41]. VHR images with a spatial resolution of up to 30 cm provide details on the morphology of urban areas (Figure 4(1)) as well as object level information (e.g., building outlines) (Figure 4(2)). When comparing VHR space-borne with UAV images (Figure 4(3)), it is obvious that UAV images provide even richer object-level information, allowing the identification of small details in backyards (Figure 4(3,4)) or whether the drainage is covered by waste (Figure 4(5)). However, such images are often difficult to acquire for large cities and typically focus on specific settlements.

3.2. At What Aggregation Level Should We Map Deprived Areas in Support of Global and Local SDG Initiatives?

The aggregation level to map deprived areas depends on the purpose, ranging from very detailed inventories in support of micro-scale upgrading of structures to identifying settlement boundaries for monitoring dynamics of deprived areas and population estimates. The diversity of image products having different spatial and temporal resolutions as well as spectral properties, and the variety of mapping algorithms, potentially allow aligning the EO-based mapping approach to the purpose [41].
Pixels of current VHR sensors are not necessarily the most appropriate mapping unit [31], since they commonly have a lot of noise. However, large aggregated mapping units (e.g., administrative wards) may not be very informative either, as they are likely to contain a mix of slum and non-slum areas. In support of localizing the SDG indicator 11.1.1, a unit that focuses on the settlement boundaries would be most appropriate. This could be achieved using an OBIA-based approach combined with machine learning to take advantage of both methods. A spatial aggregation unit of continuous built-up zones [42] based upon built-form variables such as spatial pattern and density, similar to the approach used for Local Climate Zones [43,44] (LCZ: as a consistent approach to mapping urban structure types of homogeneous zones), could allow further aggregation in other administrative units when required.

3.3. Recent Advances in Remote Sensing Based Mapping of Deprived Areas

EO-based mapping provides a synoptic view of areas of deprived living conditions, which contributes to our understanding of their spatial dimensions, e.g., regarding location, areal dimensions, form, connectivity, and linkages with their neighborhoods. The rationale of the EO-based mapping is that socioeconomic characteristics of human settlements are manifested by their physical appearance [45], which allows characterizing and mapping areas of deprived living conditions at different scales (from building to citywide mapping) through remote-sensing images. A first review of EO-based methodologies in mapping slums pointed out that visual interpretation, object-based image analysis (OBIA), image texture analysis, and machine learning are four major categories of EO-based methods [9]. Among the four methods, visual interpretation, though effective, has limitations regarding being time- and labor-intensive and having large uncertainty in its detection, in particular when done by several persons [46]. In contrast, classification algorithms based on OBIA and image texture-based analysis can semi-automate mapping of areas of deprived living conditions. Based on image/context understanding, user-defined feature sets and rules are used to detect such areas automatically. Object or pixel patterns in images corresponding to the spatial characteristics of slums are used to set up rules and select features for classification. This provides information on morphological and locational characteristics of deprivation. Classification rules or features are expected to be general enough to encompass the heterogeneity of areas of deprived living conditions at city level. For OBIA, the Generic Slum Ontology (GSO) was developed [47], which conceptualizes morphological characteristics of slums or, in general, areas of deprived living conditions at three spatial levels referred to as object, settlement, and environs levels. Each of the three levels contains a series of rules to quantify patterns of constituent image objects corresponding to the spatial configuration of such areas. However, a universal set of rules can hardly fit the heterogeneous spatial configuration of such areas across and within different cities, and thus, the transferability of methods is a major challenge [48]. The GSO is therefore suggested to be a comprehensive framework that could be adapted to a particular local urban context. For texture-based analysis, similar attempts were made to identify textural features that capture the configuration or areas with deprived living conditions in images. A set of textural features, e.g., the gray-level co-occurrence matrix (GLCM), has been used in conjunction with auxiliary spatial data and spectral indicators to differentiate slum and non-slum areas [49,50]. This feature set can be fed into machine learning classifiers such as decision tree, random forest (RF), and support vector machine (SVM), producing robust results across cities.
The performance of different features to map deprived areas has been compared [9], individually or in combination [51,52,53,54,55,56]. The results indicated that hardly any feature would fit for all cities. Although the GLCM, textons, lacunarity, and local binary pattern (LBP) are reported to generate higher classification accuracy than other features do, these features might fall short in mapping less prominent patterns such as very small slum pockets [50]. This again reflects on the limitation of choosing user-selected features. While the OBIA, when using user-defined rule-sets, may also generate promising results, the heterogeneity of the physical configuration of deprived areas and intense parameterization required by classification rules lead to a large variety of performance. This makes rule-based OBIA classification approach less transferrable within and across cities. These limitations can be overcome by coupling OBIA with supervised learning algorithm.
The above weakness of semi-automatic approaches is because limited prior knowledge is available for classification parameterization, parameterization in feature calculation, and feature selection. Without knowing the best feature combination in characterizing the heterogeneous configuration of deprived areas at the city scale, one could either choose features through trial-and-error or include a full set of empirically effective features to make the choice less arbitrary [53]. Thus, mapping may be conducted in a poorly designed feature space and subject to the curse of dimensionality [56], reducing the generalization capability and transferability of feature sets [57]. Feature selection allows reducing dimensionality, working with the most significant features, and it improves accuracy [58]; however, it still depends on the initial conceptualization of deprived living conditions and features fed into the feature selection approach. This bears the risk of overlooking the most significant features.
The recent application of deep learning as a representation learning technique to map areas of deprived living conditions has shown that the problems of parameterization and feature selection can be avoided [59]. The backpropagation adopted by deep neural networks (NN) can automatically update weights and learn features without human intervention [60]. Properly designed deep convolutional neural networks (DCNNs) are thus claimed to be able to “see” the features and generate rich and discriminative feature sets. When DCNNs are applied to map areas of deprived living conditions, the learning process is conducted directly on images without organizing pixels into columns of vectors so that the spatial configurations on images can be preserved through learning [61]. The automatically learned features are two dimensional and capture hierarchical spatial primitives such as lines, shapes, and objects representing the intrinsic spatial configuration of such areas. With all these advantages, the main objectives are to find out whether optimal DCNN architecture exists for a city-level mapping of areas with deprived living conditions, and whether a DCNN needs to be trained from scratch at each city or the features learnt from one city can be transferable to map others. The availability of good and sufficient training data is a problematic issue in data-scare environments, where innovative solutions are necessary.

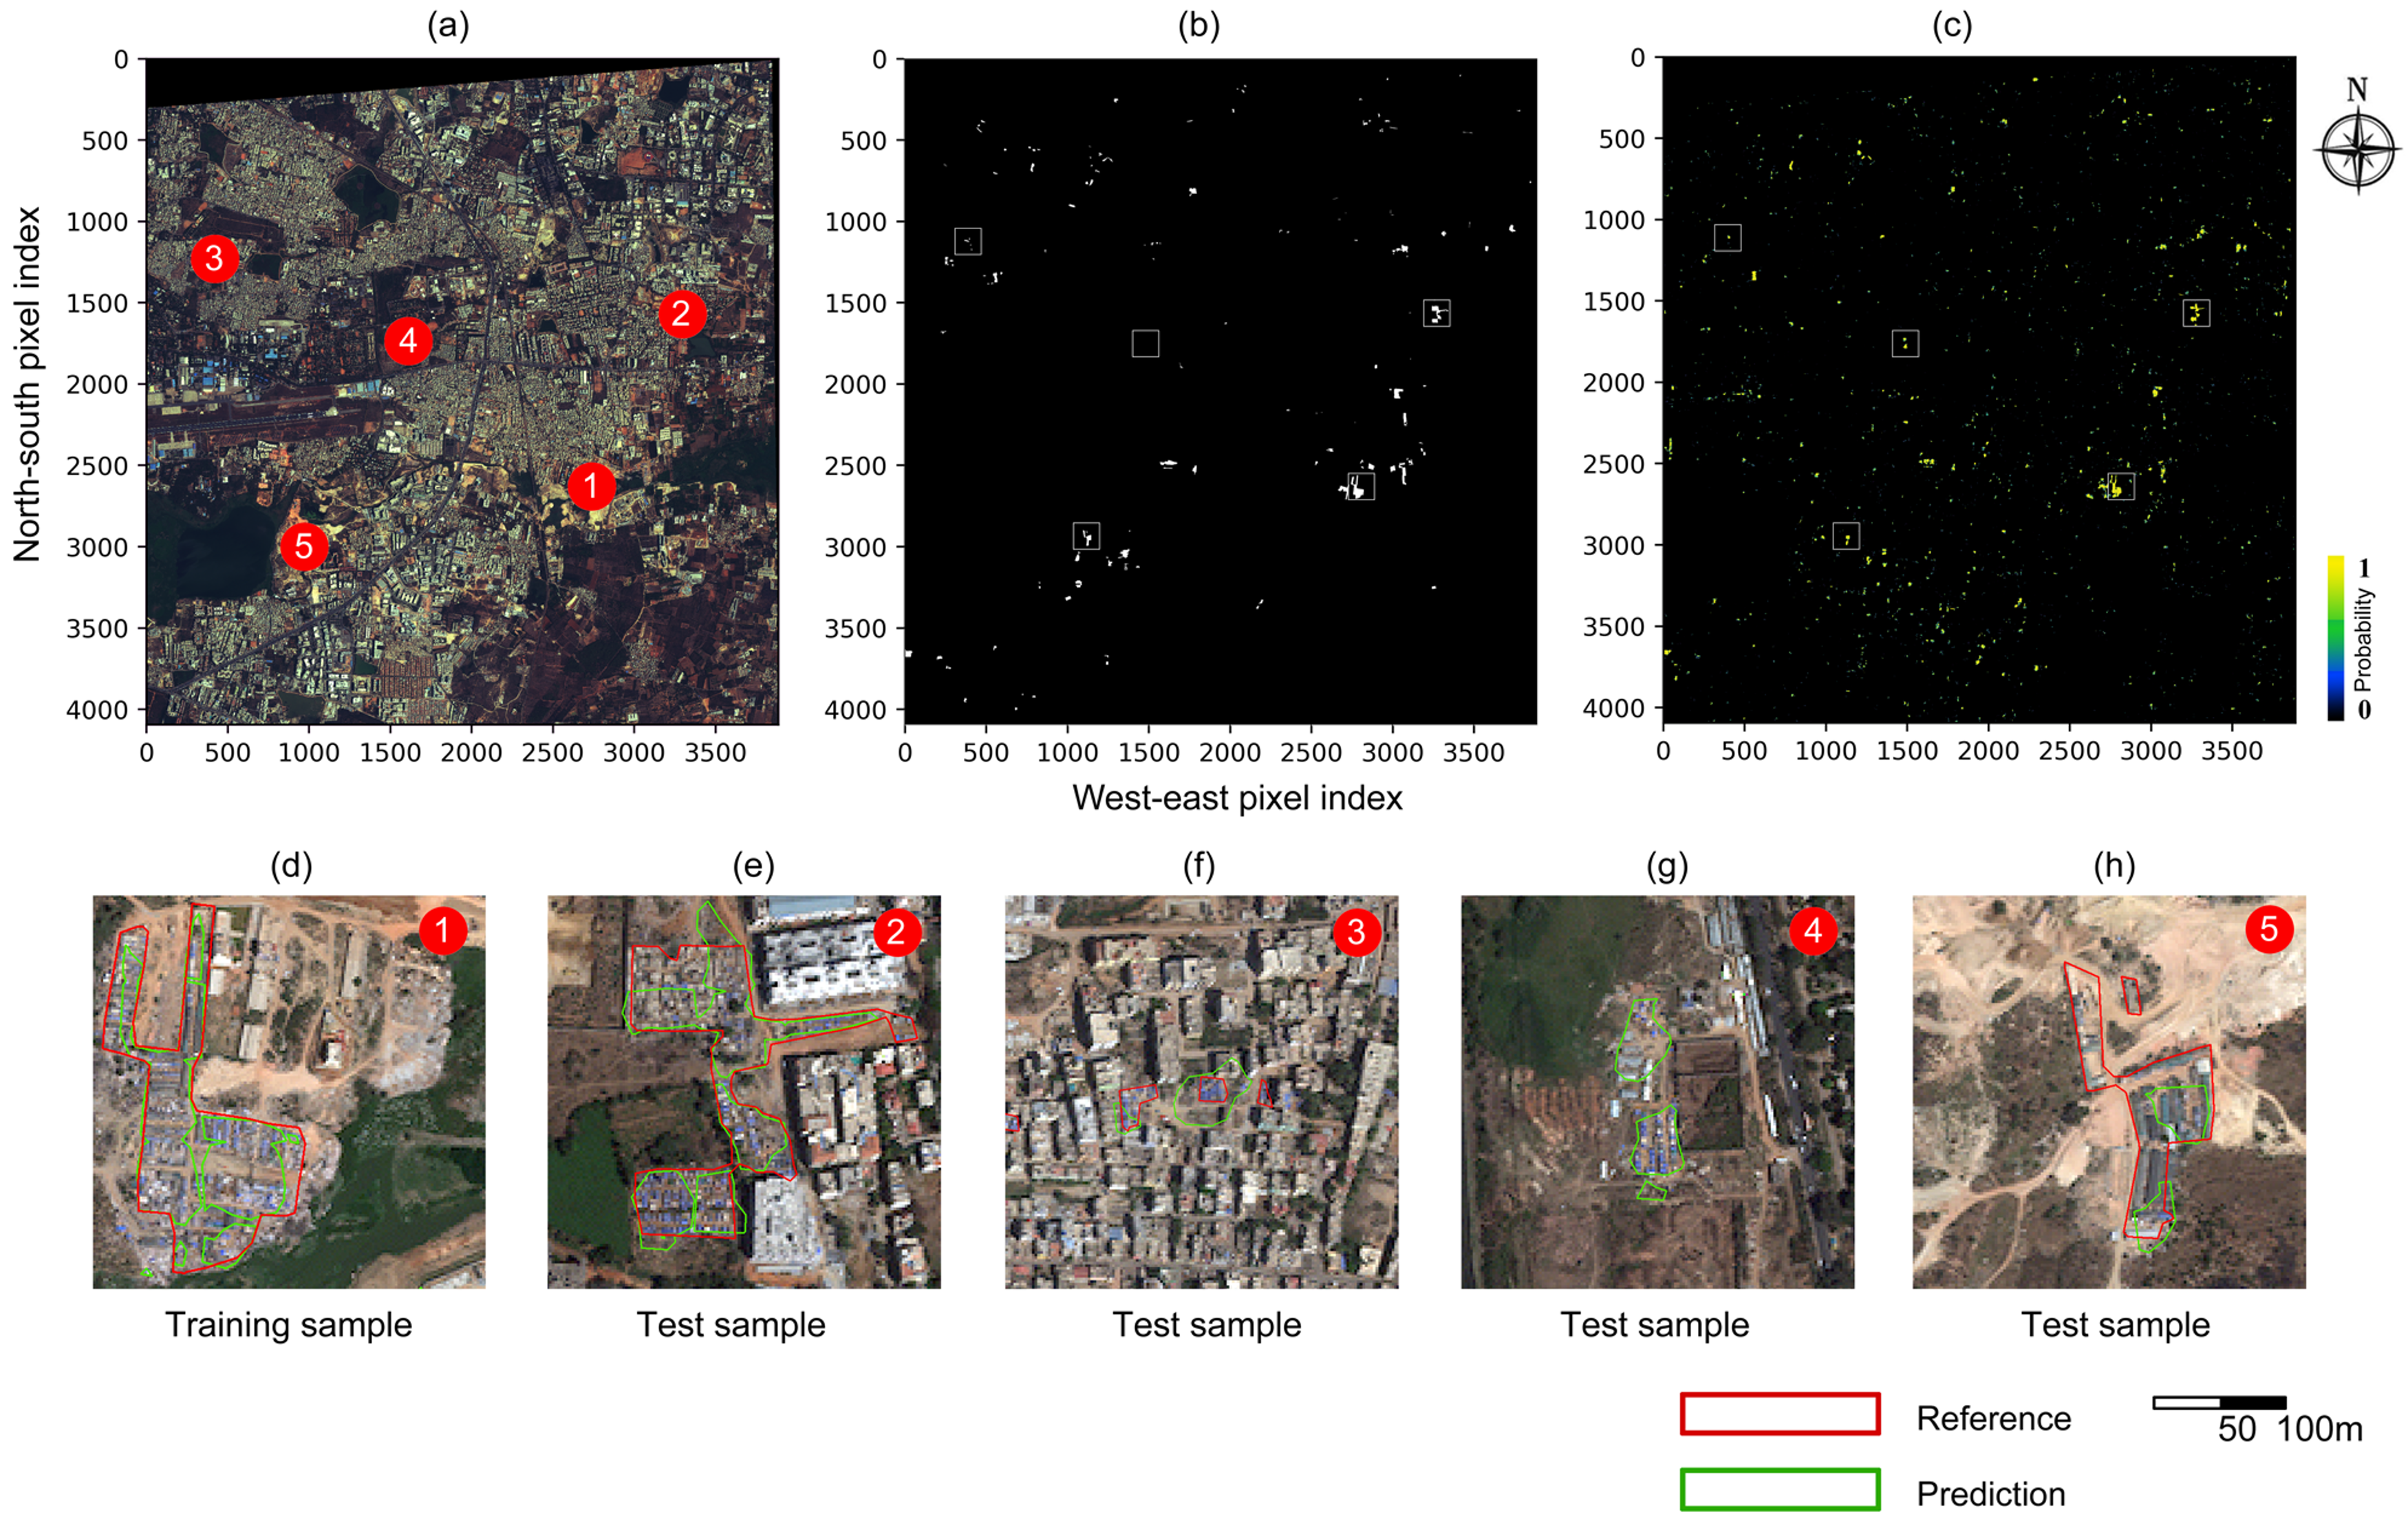
3.4. The Challenge to Map Small Deprived Pockets and High Spatial Dynamics: The Case of Bangalore

Bangalore, the administrative capital of the state of Karnataka in India, is experiencing rapid urbanization leading to a doubled slum population during the past decade [62]. With a population of over 8.5 million, Bangalore accounts for over 8.39% of the state population, one-fifth (local estimates) of which resides in slums [5]. Despite the large number of deprived dwellers, the spatial extent of slums only occupies limited urban areas in the form of very small slum pockets scattered over the entire city (Figure 5a,b).
The morphology of deprived areas displayed in remote sensing images can change in a very short period due to the sensitivity of their physical appearance to a change in a few numbers of houses or pockets (e.g., Figure 5). Their dynamics and small size are a challenge to well-developed classification approaches for the timely and accurate city-wide mapping of deprived areas.
For Bangalore, a DCNN is constructed to map both large and very small deprived clusters at the city scale. The mapping procedure attempts to approximate a real application, in which data accessibility and training samples are limited (unlike common practice in machine learning in which commonly 60–80% of the image is used for training). It is assumed that only a regular RGB Worldview-2 image with a resolution of 1.8 m is available (we restrict this to RGB, as this is a product often available with local organizations), and only the most prominent and large patches are well known and therefore used for training the DCNN. By using the largest patch of deprived areas (Figure 5d) as training data, the predicted distribution of deprived areas (Figure 5c) resembles the reference distribution by capturing the larger deprived patches such as those shown in Figure 5e. However, large extensional disagreement is observed for small deprived areas such as those shown in Figure 5f. The inability to detect small patches generates a large amount of noise over the study area as seen in Figure 5c. Thus, information about very small patches is poorly captured by the training sample. While the DCNN relies largely on automatically learnt features, it failed to obtain knowledge about various configurations of small deprived areas from limited training data (we assume that in most cases only limited training data is available). Figure 5g shows the strength of the DCNN in detecting deprived areas that are not labelled in reference data. Figure 5h shows an example that small deprived pockets are interleaved by elongated greenhouses, and the DCNN again showed its strength in detecting some of the small deprived pockets, although the entire patch of greenhouses is labelled as deprived in reference data.
Although the DCNN shows great potential in mapping deprived areas, when working with a very limited training set, extensional and existential variations are prevalent in mapping very small pockets when comparing predictions and reference data. The variations can be attributed to uncertainties in the reference data and limited generalization in training data (Section 4.1). As the deprived areas are very small, the predictive accuracy is very sensitive to extensional and existential variations. This relates to the issue of choosing point- or patch-/area-based accuracy assessment discussed in Section 4.3. However, at the citywide level, as the prediction of distribution and extent of deprived areas matches the reference data visually, the EO-based approach to track even very small, deprived pockets citywide to generate spatial information for the SDG indicator 11.1.1 can be reliable. As the DCNN learns the feature automatically, it is suggested that data preparation of both reference and training are of equal importance with model building.

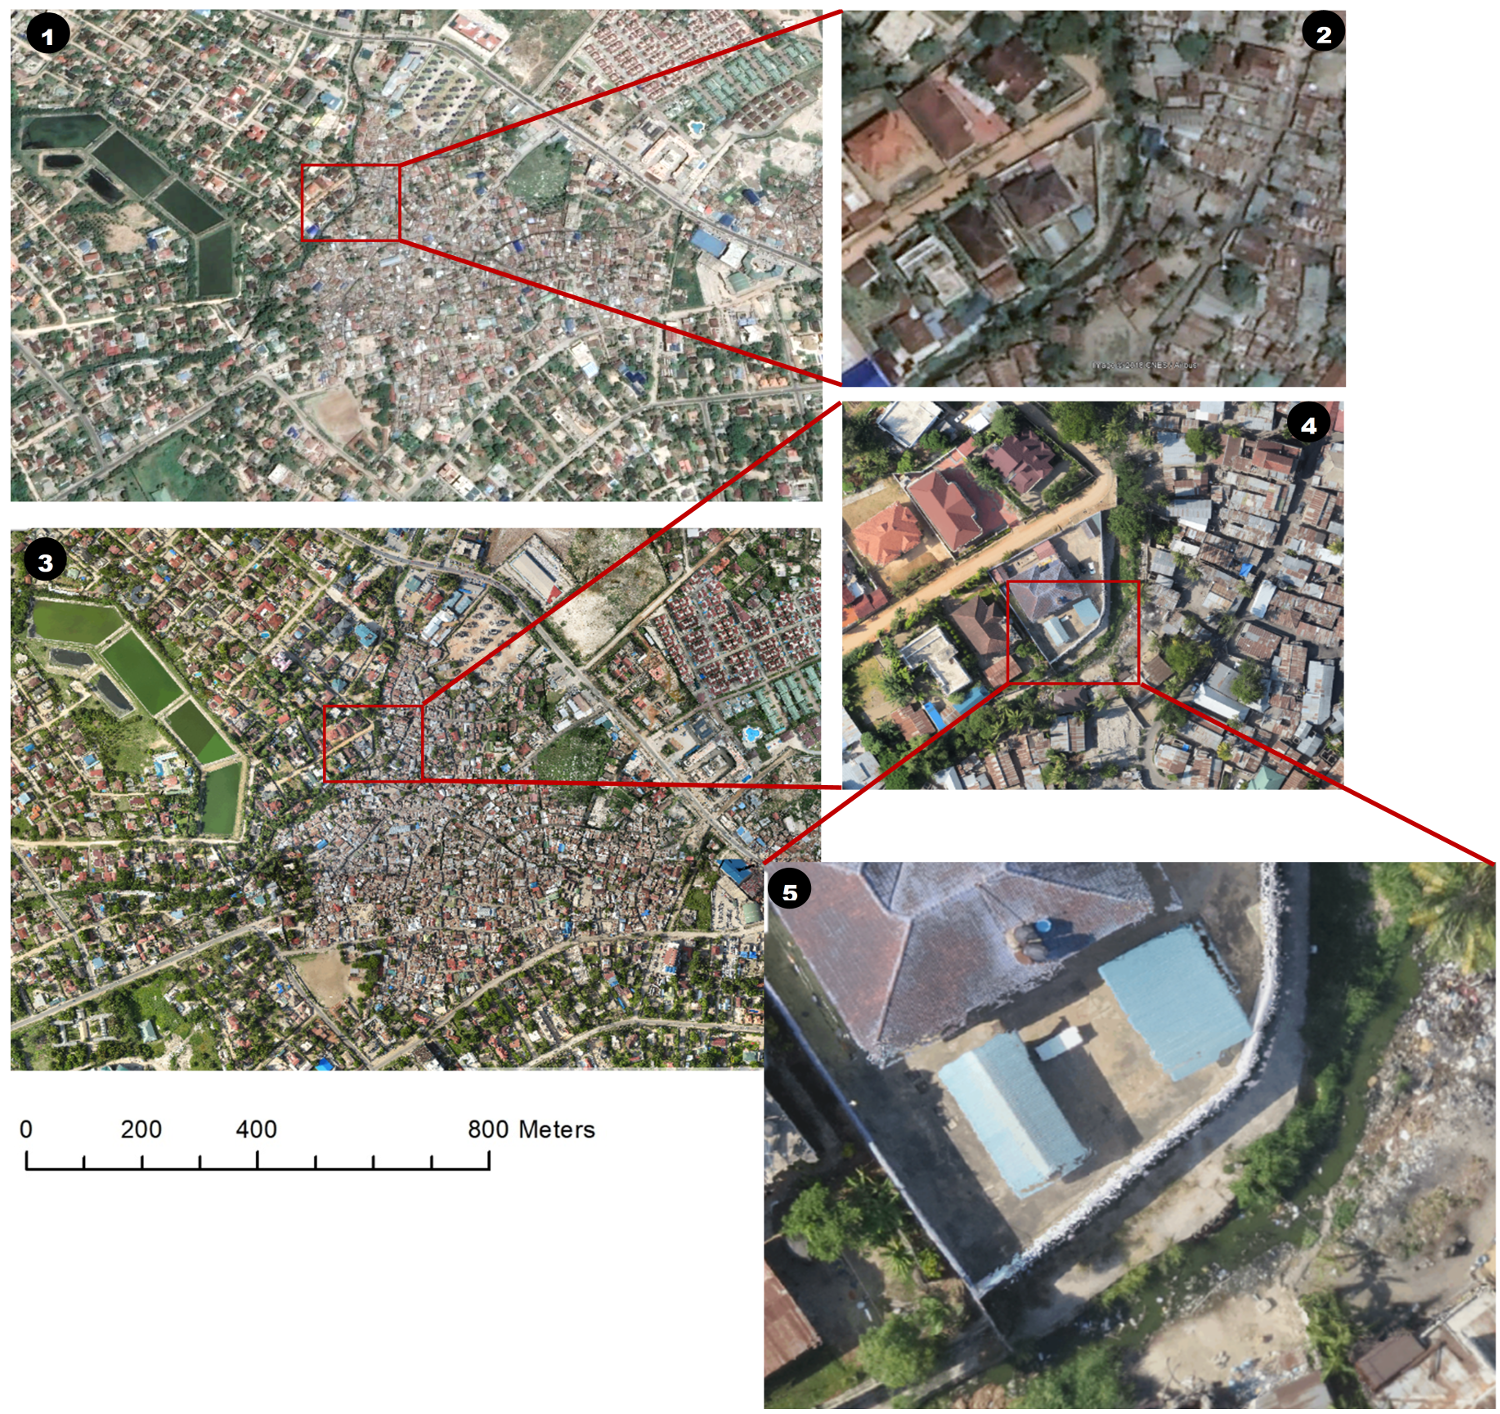
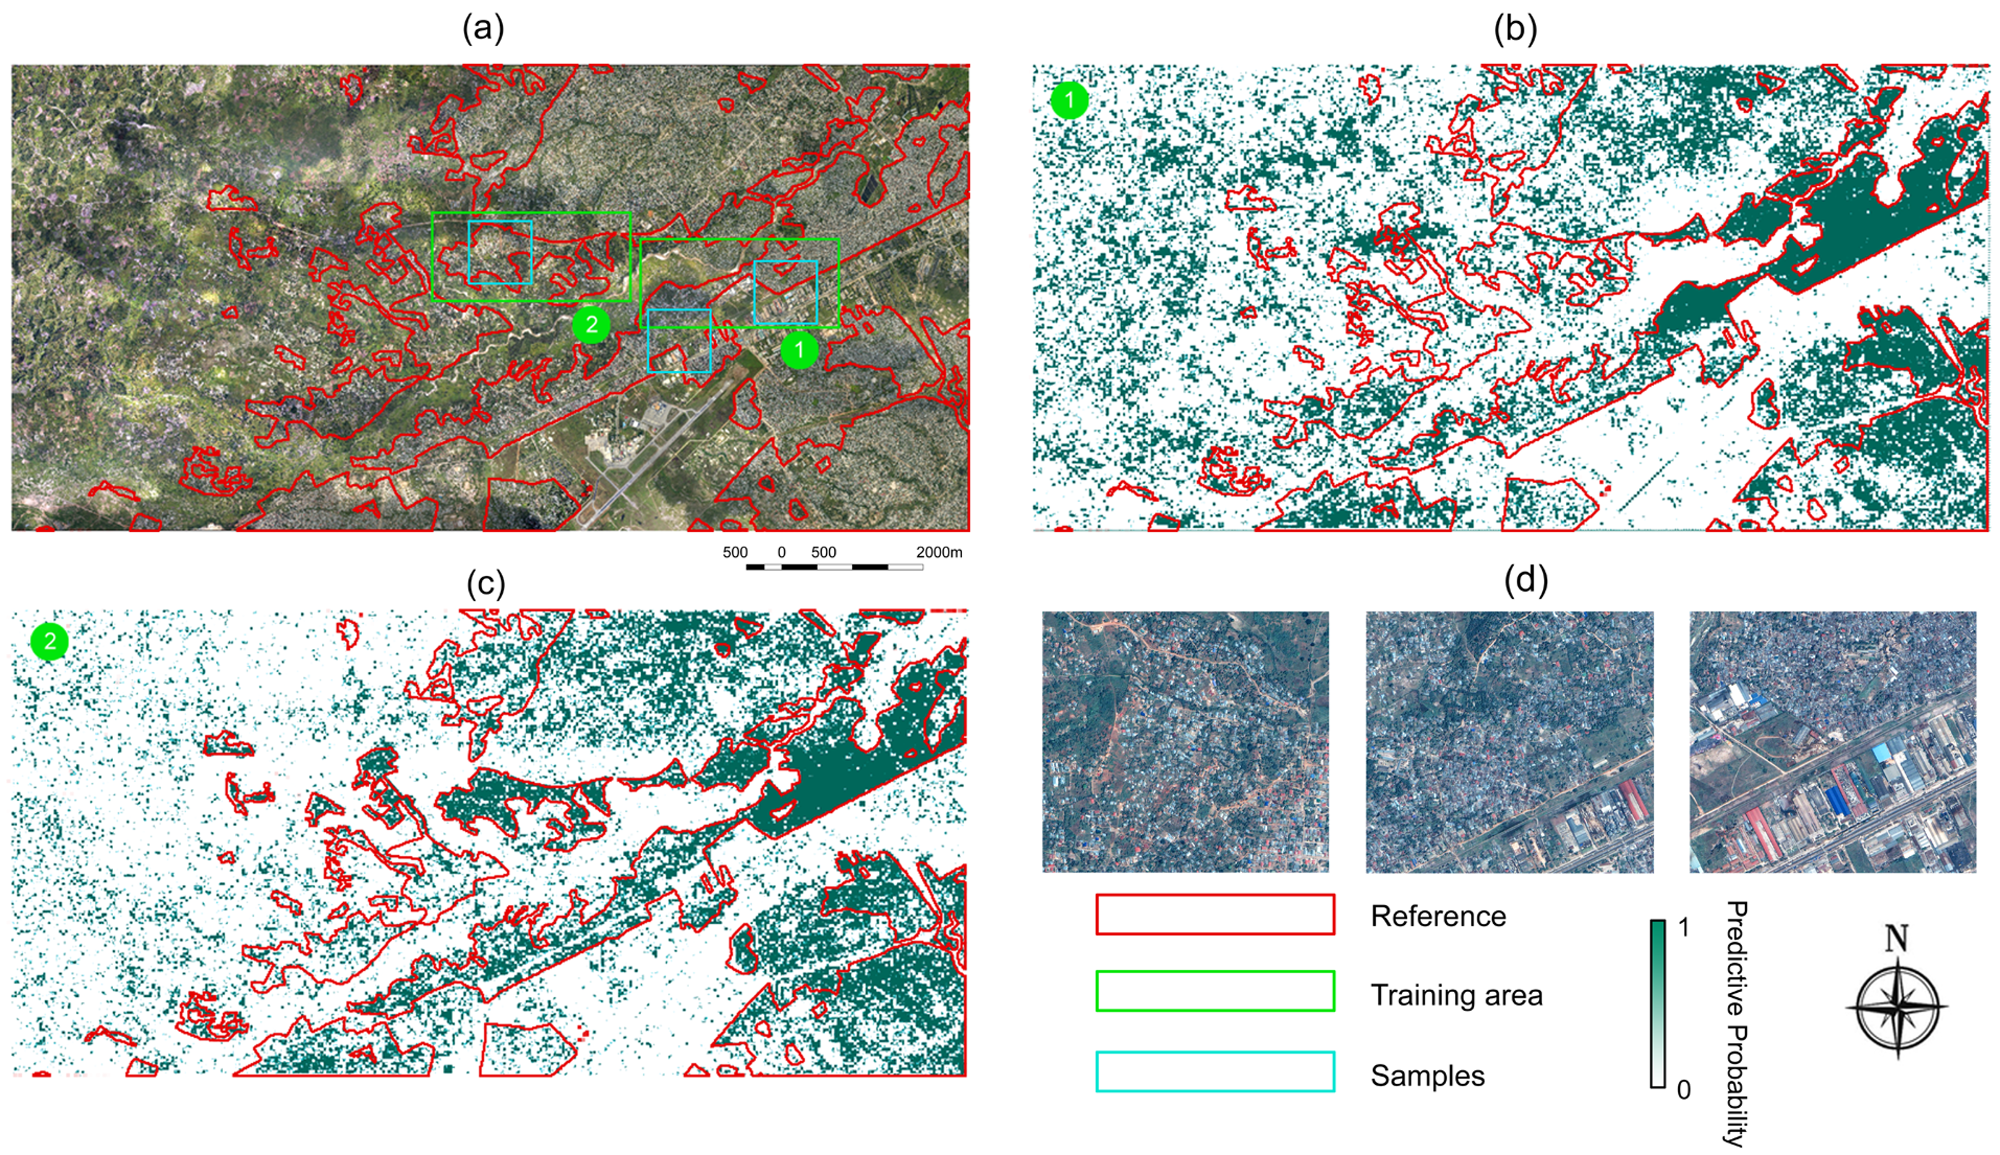
3.5. A City Built on Informality: The Case of Dar es Salaam

Dar es Salaam, the largest city and economic hub of Tanzania, has a population of around 4.4 million, housing 10% of the national population [63] and being one of the fastest growing cities in Africa. With the inability of the city government and municipalities to provide adequate land, housing, and infrastructure, around 70% of the urban households live in deprived areas (locally referred to as informal) [64]. Compared to Indian cities, the building density of deprived areas in Dar es Salaam is commonly lower, but, by contrast, they tend to cover large areas, spread over the entire city, which can be observed in remote sensing image as large and contiguous patches (Figure 6a).
Large patches of deprived areas may facilitate their identification by human experts yet not necessarily by machine learning algorithms. A lesson learnt from mapping in Bangalore is that deep learning is sensitive to training data. Thus, different training areas are used to test how the model captures various deprivation configurations contained in the training data. In Dar es Salaam, when the training data contains deprived areas only within the central urban area, the suburban deprived areas are not properly recognized (Figure 6b). Alternatively, if the training area combines urban and suburban deprived areas, more deprived areas in suburbia with lower density are mapped (Figure 6c). As information about deprived areas in urban areas is reduced, deprived areas in the city region are more or less missed in the prediction, especially to the east of the study area. The variations of their configuration are displayed in Figure 6d, forming a gradient from suburban to urban areas. Deprived areas in the suburbs have low densities and start to be dense and mixed with formal households; finally, they form compact clusters in central locations.
In summary, deprived areas in Dar es Salaam are highly diverse, and a significant gradient of configuration can be observed even in large contiguous patches. Keeping the classification model remains unchanged, different sets of training data can lead to different mapping results. Thus, preparing meaningful training data that adequately reflect the variety of morphologies is important for cities with a large proportion of deprived areas such as Dar es Salaam, other than for cities such as Bangalore with relatively small and dispersed deprived areas.

4. Uncertainties and the Accuracy Assessment of Mapping Deprived Areas

This section discusses uncertainties related to input data and the assessment of accuracies. Examples from India, Indonesia, and Brazil highlight the challenges to visually delineate the boundaries of deprived areas, particularly in urban environments where there is a gradual transition between deprived and non-deprived areas. Such uncertainties affect the assessment of mapping accuracies.

4.1. Uncertainties in Mapping Deprived Areas from Space and Ground

Remote sensing has the potential to generate spatial information on deprived areas in a consistent way for large areas. However, this requires reliable and sufficient training data. After mapping, the logical subsequent step is to assess the accuracy of the classification, which requires data for validation. Most studies of mapping deprived areas train the classifier and assess the accuracy based on data (e.g., points or polygons) acquired by visual image interpretation or ground data. However, two recent studies [46,65] showed that visual image interpretation done by local experts have, in general, low levels of agreement in complex areas, adding to the uncertainties in the mapping result. This is because the delineation of deprived vs. non-deprived is often very subjective.
Uncertainties in such reference data can be generally split into existential and extensional uncertainties [46,65]. In the context of deprived areas, existential uncertainty refers to situations where there are uncertainties about the existence of such areas on the ground [46,65]. Experts might disagree on an area (Figure 7 (right)), depending on the different set of indicators used and a general difference in operationalizing deprived living conditions [65]. There could also be disagreement based on the definition of deprived (slum) areas in a particular context. Additionally, there could be personal perceptions of what characteristics of a built environment constitute a deprived area or not. Extensional uncertainty is even more widespread, as it refers to the uncertainty related to the correct delineation of an area, thus finding out where the boundary should be drawn [65]. Boundaries of deprived areas are often fuzzy and difficult to capture on the ground in complex urban environments (Figure 7), e.g., whether the vegetation on the fringes of buildings should be included while delineating the boundary. Similar examples are elaborated in [65]. Thus, extensional uncertainty implies that the extent of deprived areas can be determined with limited certainty. To improve delineations, the combination of ground information and the synoptic view of an image can help to decide on the delineation of areas. However, this assumes that deprived areas are discrete entities with clear boundaries, clearly distinguishable from other classes, thus assuming a deprived/non-deprived dichotomy, which often is neither in images nor on the ground visible due to fuzzy and gradual boundaries (e.g., Figure 7 (left)).

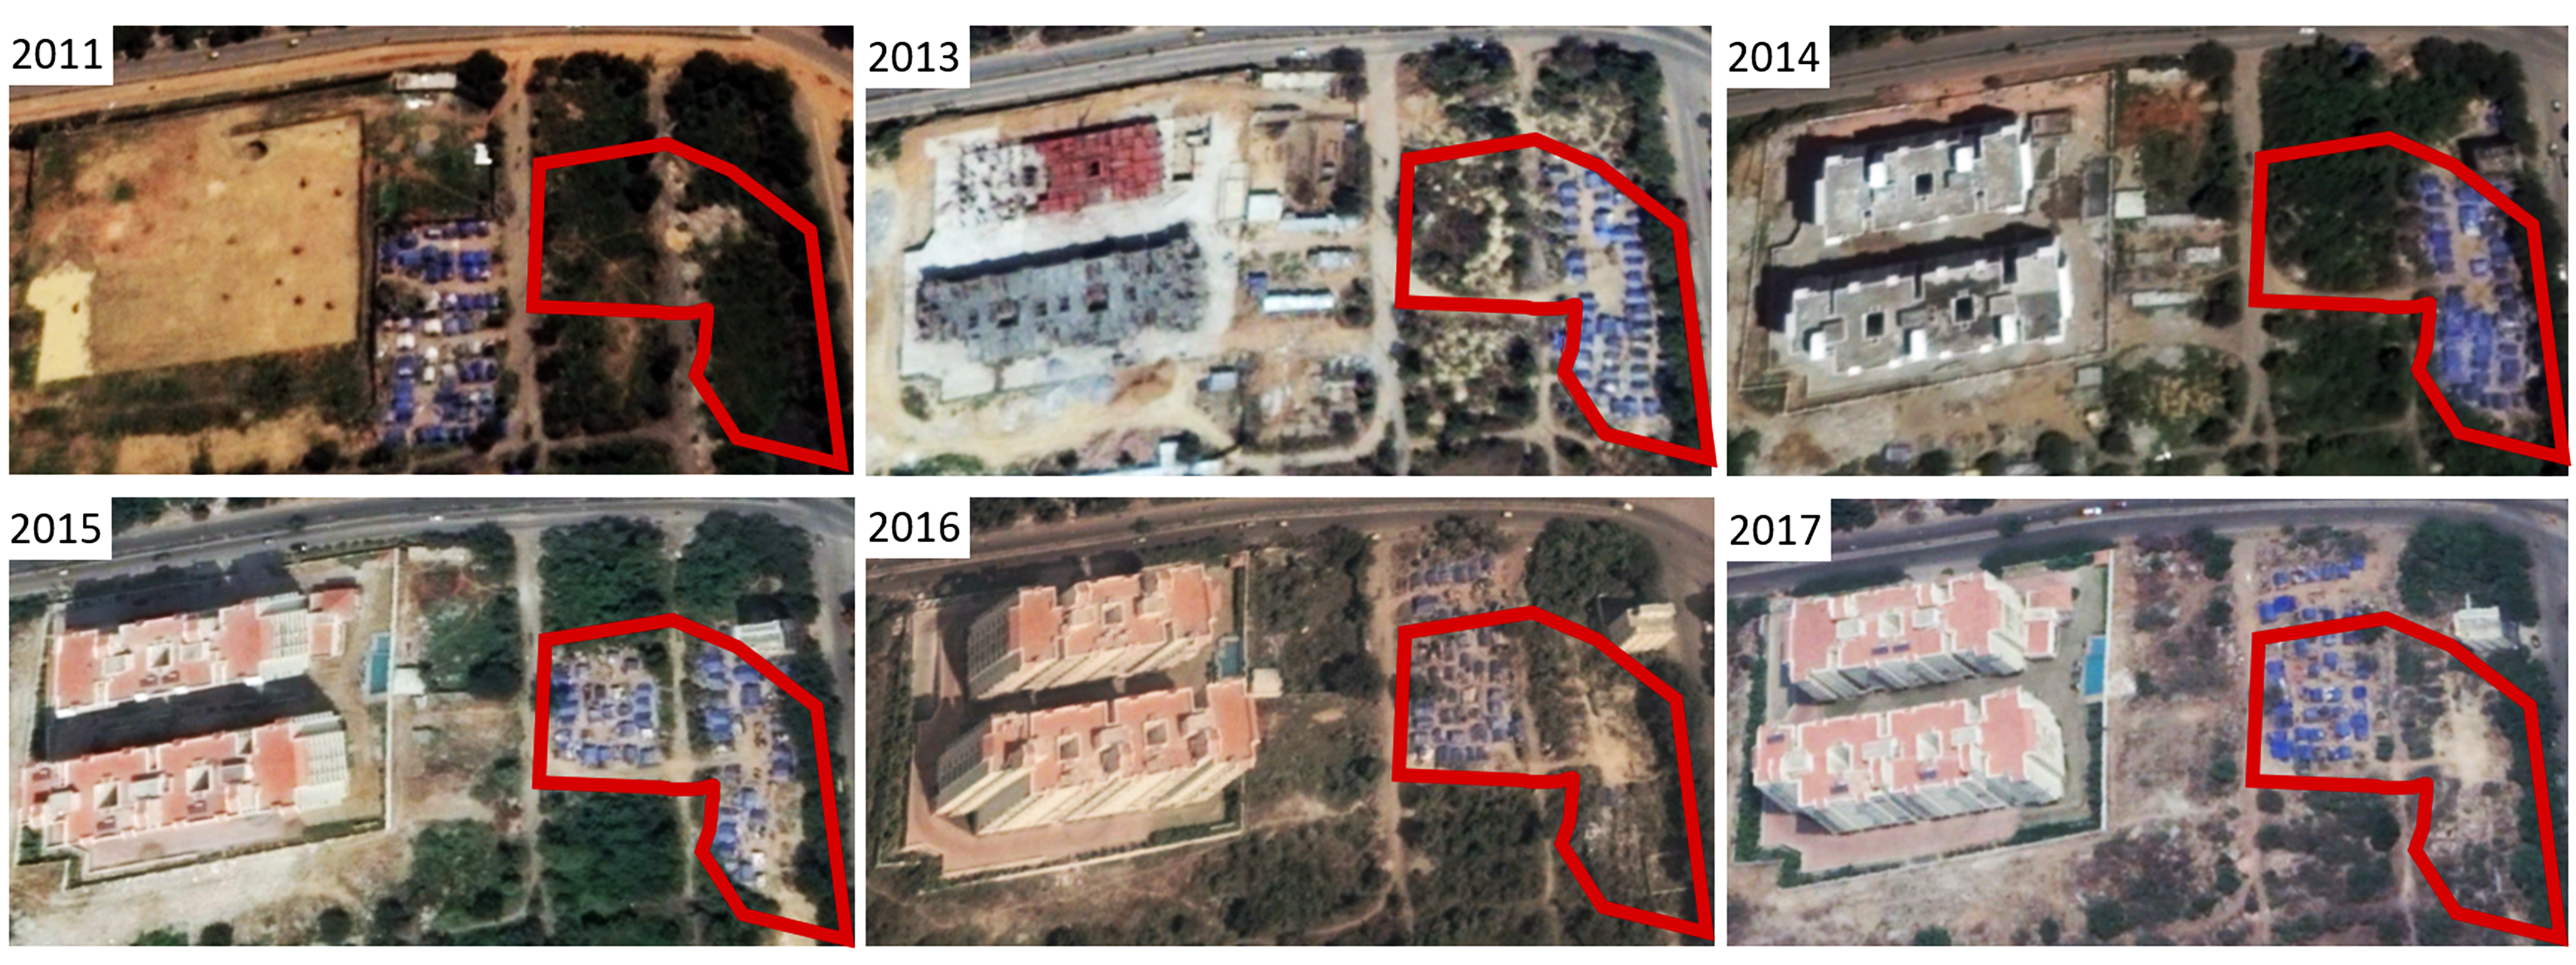
4.2. Uncertainties Caused by High Temporal Dynamics of Deprived Areas: The Case of Bangalore

Delineating boundaries can be even more challenging when deprived areas are highly dynamic and their extent and location change within a few months or years. The example of Bangalore, India (Figure 8) illustrates high spatiotemporal dynamics of deprived areas, close to a construction site of multi-story buildings. Collecting training data on the ground and combining them with an image with a small time-gap (e.g., half a year) might imply that training data are different to the image. At city scale, such dynamics can also be substantial and diverse, e.g., vertical and horizontal growth, densification processes, self-help improvements, evictions, or even gentrification processes. These complex spatio-temporal dynamics require monitoring systems of high temporal granularity. Such uncertainties substantially impact the training of data-demanding DCNNs.

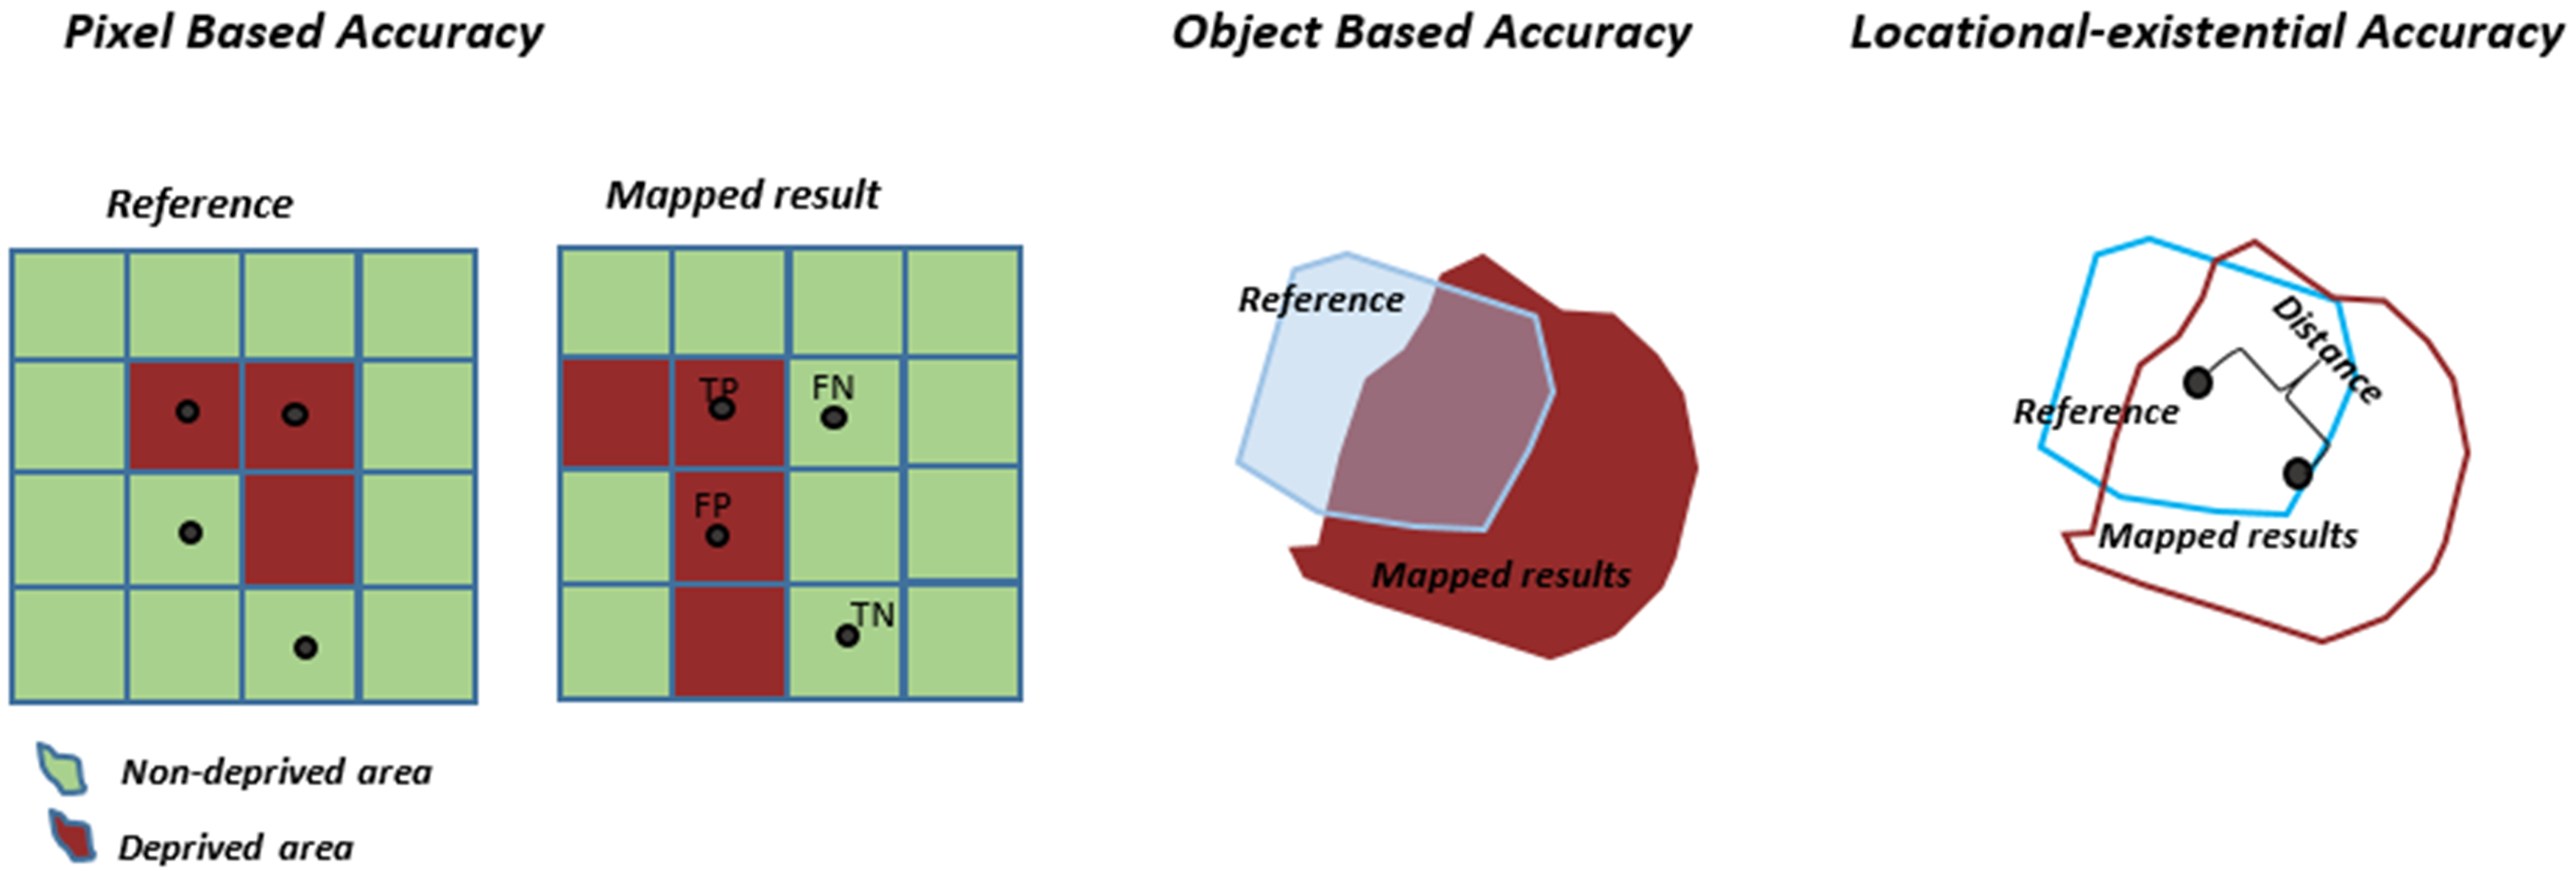
4.3. Assessing the Accuracy of Deprived-Area Maps

When comparing mapping results with reference data, the EO-based mapping of deprived and non-deprived areas are represented as positive and negative predictions and results in four mapping scenarios [66]: (1) deprived areas marked in the reference data as correctly mapped are denoted as true positive (TP); (2) deprived areas marked in the reference data ignored in mapping are false negative (FN); (3) non-deprived areas in the reference data falsely mapped as deprived are false positive (FP); and (4) correctly mapped, non-deprived areas in the reference data are true negative (TN). Methods used to assess the accuracy of thematic maps can be split into three general groups (Figure 9):
  • (Classical) pixel-based assessment methods, e.g., in the form of a confusion (error) matrix;
  • Object-based (extensional) methods, which assess the match of the extent of a mapped object with a reference object, e.g., in the form of the area of overlap;
  • Locational–existential methods, which assess the existence and/or the locational match of the mapped object with a reference object, e.g., count of objects within a threshold distance that agree with the reference data.
Pixel-based assessment methods can be encoded in a confusion matrix, assessing their precision (TP/(TP + FP)), recall (TP/(TP + FN)), and overall accuracy ((TP + TN)/(TP + FP + TN + FN)). Other measurements such as the Jaccard Index (TP/(TP + FN + FP)), which combines precision and recall accuracy, are also used in assessing the mapping results. While the mapping results can be encoded by one of the above-mentioned indices, the accuracy of mapping may not be uniform across the entire map. Due to the heterogeneity of deprived areas and their relation to the surrounding land-use and land-cover types, the accuracy of mapping can vary locally within a map. Object-based accuracy assessment is commonly not done—even within OBIA, as it is far more complex. Several measures have been proposed in the literature (e.g., [67,68]) that quantify the overlap of a classified and a reference object, e.g., the correctness, which is the ratio of the correctly mapped area compared to the total mapped area. Locational-existential methods assess whether an object (e.g., a deprived settlement) has been mapped at the location where the reference data indicate the existence of such a settlement. In such a case, the two centroids could be compared to assess the locational accuracy of the mapped object.
Since the evaluation of the accuracy depends on the quality of reference data, the accuracy cannot be evaluated solely and is subject to uncertainties mentioned above in Section 4.1 in generating the reference data [46]. Specifically, high accuracy may be related to a large uncertainty in delineating the boundary of deprived areas, because more predictions are considered to be true positive. The issue of uncertainty brings further the consideration of accuracy measurements. If the existence and extension of deprived areas are highly uncertain and difficult to delineate, accuracy assessment should be more flexible, acknowledging and modeling uncertainties and dealing with various representations of deprived areas including not only the extent but also the location of deprived areas. A potential option could be the conceptualizing or understanding of the different types of uncertainties and henceforth dealing with the underlying vagueness. Another alternative could be to consider deprived areas as Sorites susceptible [69] and use fuzzy set theory to deal with uncertainties. According to Sorites paradox, if a concept is Sorites susceptible, it should be modelled as a vague concept instead of a Boolean model. A recent study showed such an example where the uncertainty of image interpretations of slums was modelled using spatial statistical methods such as random sets [65].

4.4. The Uncertainty of Boundaries of Deprived Areas: The Cases of Jakarta and Bandung

In Indonesia, the mapping of deprived areas is complex, as they often share similar morphological characteristics with non-deprived areas [70,71]. In general, over the past decades, many areas called Kampungs have developed without formal planning, but some Kampungs are middle-class housing areas with formal tenure and good services. However, relatively well-off Kampungs and deprived Kampungs often exhibit similar morphological characteristics in images (Figure 10). Using image features (e.g., GLCM, LBP, PanTex, and NDVI), such areas can be differentiated with moderate accuracies, but the use of additional spatial layers can support their mapping, e.g., using locational characteristics such as flood zoning [46].
Presently, the Indonesian Government is conducting a national mapping program of slums to reach the ambitious target “cities without slums” by 2019 [70,71]. The mapping is conducted by ground surveys with a complex set of indicators (including location, building, infrastructure, service, tenure, fire-safety, and population characteristics) [28]. Mapping results show major inconsistencies, e.g., caused by different interpretations of the complex set of indicators. Furthermore, the national government received much more reported slum areas than expected, raising doubts about possible over-reporting by municipalities to get access to national funds [28]. In this context, images can offer the opportunity to produce consistent reference layers, which could then be used for verification. A combination of ground survey and image interpretations could, therefore, allow identification of conflicting ground-based mapping results (Figure 11).
In summary, the assessment of mapping outputs needs to be linked with uncertainties. The more complex and fuzzier the transition between deprived and non-deprived areas is, the more complex the generation of training and references data is. This also requires a careful selection of suitable accuracy metrics to fit the purpose and make the metrics available for supporting the interpretation of maps.

5. Remote Sensing-Based Products for the Generation of Information on the SDG Indicator 11.1.1

This section gives attention to how remote-sensing products allow extracting population estimates and how remote-sensing-based products should be provided to the public considering inherent uncertainties in methods and data. Cases from India and Kenya are used as illustrations.

5.1. Estimating Inhabitants of Deprived Areas—Combining Maps and Available Statistical Data

To support the generation of data for the SDG indicator 11.1.1, EO-based maps of deprived areas need to be combined with models to estimate the population. This requires ground information, e.g., disaggregating census-based population data using building footprints [37], while more complex estimation models may consider the floor area, e.g., derived from a digital surface model. For example, Figure 12 shows that with the use of stereo-images, census population data can be disaggregated considering the floor area per building [73]. However, these approaches depend on the quality of census population counts, which are often rather poor in deprived areas due to access issues but also the mistrust of inhabitants being reluctant to share private information (e.g., household size or sub-rental conditions) with local authorities. An alternative approach uses household surveys that provide an estimate of the person per roof area ratio (and their variations across different areas), which allow one to estimate the population via extracted roof areas.
In general, EO can provide essential base data for population estimates, which are required for the SDG 11.1.1 indicator, e.g., combining survey-based samples of population data with the mapped location and extent of deprived areas. For multi-story deprived areas, the amount of roof area per settlement, combined with the building heights (via stereo images or LIDAR data), allows estimation of total floor area. Furthermore, differences in socio-economic conditions can be mapped and related with specific person per floor area ratios. This can provide estimates of the population per deprived area, which can be subsequently aggregated to the city level and ultimately to derive country-level estimates. Detailed, community-based enumeration data can also sometimes be used [74]. Such approaches would provide estimates for the SDG indicator 11.1.1, for areas that are presently not (well) covered in global statistics, contrasting existing statistics, which are often only covering parts of the population and indicate areas where official statistics are dramatically underrepresenting the population of deprived areas. Having such a framework implemented would allow for relatively frequent updates of population estimates at flexible spatial aggregation units.

5.2. How Can We Provide Remote Sensing Based Data on Deprived Areas to the General Public?

The need for a critical approach to using computers in urban research can at least be traced back to Lefebvre’s work. In his monograph “The urban revolution” (first published in 1970), he asked: “Who is going to demonstrate that the ‘language of the city‘, to the extent that it is language, coincides with ALGOL, Syntol, or FORTRAN, the language of machines, and that this translation is not a betrayal? Doesn’t the machine risk becoming an instrument in the hands of pressure groups and politicians? Isn’t it already a weapon for those in power and those who do serve them?” [75] (p. 59).
Ever since Monmonier’s seminal work [76], maps have no longer been considered neutral tools. With the arrival of contemporary geographic information systems, geographers [77,78,79], as well as philosophers [80], highlighted the ethical and political relevance of transformation of mapping practices. On a more general level, the concerns were echoed in the philosophical discussion of the emerging digital ontology in the information age [81] and the critique of the understanding of technology as mere instruments [82]. Rather, technologies need to be understood as shaping the ways in which we perceive and act in the world.
The growing importance of digital technologies, like machine learning, the push for “smart city” developments and the “Internet of Things”, as well as the rise of “Big Data” has amplified the need for reflecting on responsible design and use of EO and mapping technologies [83,84]. In the context of this paper, we focus on the political and ethical challenges of making mapping products on deprived areas publicly available. Making such products available puts the spotlight on one of the most vulnerable groups in cities. As scientists, we aim to provide methods and data to support improvements of living conditions in such areas, but by making this data publicly available, we risk contributing to their stigmatization and possibly increase the likelihood of eviction.
First of all, we need to recognize that EO technologies embody a “top-down” approach to urban governance in a very literal sense. As such, they create a power asymmetry between those that have access to the mapping technologies and decide which areas are going to be mapped, and the populations being mapped. This asymmetry is amplified by the fact that there is no strict technical need to involve the inhabitants of the researched areas in the acquisition, analysis, and visualization of the data. For example, the person producing the final mapping product has the power to decide what gets recorded on the map without consulting the mapped communities. Yet, not only are the mapping products in question likely to shape the lives of individuals and groups, some people may also have a legitimate interest in not being mapped in the first place. Depending on the image resolution (see, e.g., Figure 4), there might be valid concerns about the privacy of the individual, which are further complicated by cultural differences in defining and evaluating privacy [85,86]. Since we favor the use of aggregated data in mapping, i.e., settlement boundaries, (see, e.g., Section 5.4), individual privacy is less of a concern. However, questions of group privacy, identity politics, and security of the data subjects need to be addressed [87].
Group privacy is concerned with the implications of data acquisition, processing, and use for members of a group even if the individual members remain anonymous. A challenge here is that groups are constituted through Big Data technologies, which identify members of groups as such. While this seems to be less of a concern in our case, there are still lessons to be learned from, e.g., the “Mass Atrocity Remote Sensing” project, which aimed to provide forensic evidence of crimes against humanity by analyzing satellite images and other data. However, the researchers quickly realized that the data also was used to target individuals and groups [88]. The cases discussed in this paper are not directly concerned with settlements in a conflict zone, and, therefore, the implications may look less severe. However,, in cities where slum evictions are occurring (see, for example, the recent reports of forced evictions of 30,000 people from Nairobi’s largest slum area, Kibera, for the purpose of road construction [88]), conflict abounds (Section 5.3). In relation to that, as we have already shown above, the distinction between “slum”, “informal settlement”, and “inadequate housing”, as well as the corresponding indicators, needs to be taken into account for methodological reasons. However, the use of a term like “slum” also needs to be reflected in the context of identity politics. While “slum” is used in policy documents and embraced by NGOs such as the “National Slum Dwellers Federation” (NSDF, India), inhabitants may reject the label. This is one of the motivations for using the term “areas of deprived living conditions”. Furthermore, mapping vulnerable groups may increase their vulnerability by rendering people living and working in a specific location visible as a poor and potentially marginalized group. In the worst case, the exposure of the location of specific groups may even pose a threat to its members, e.g., by exposing the location of refugees in an ongoing armed conflict.

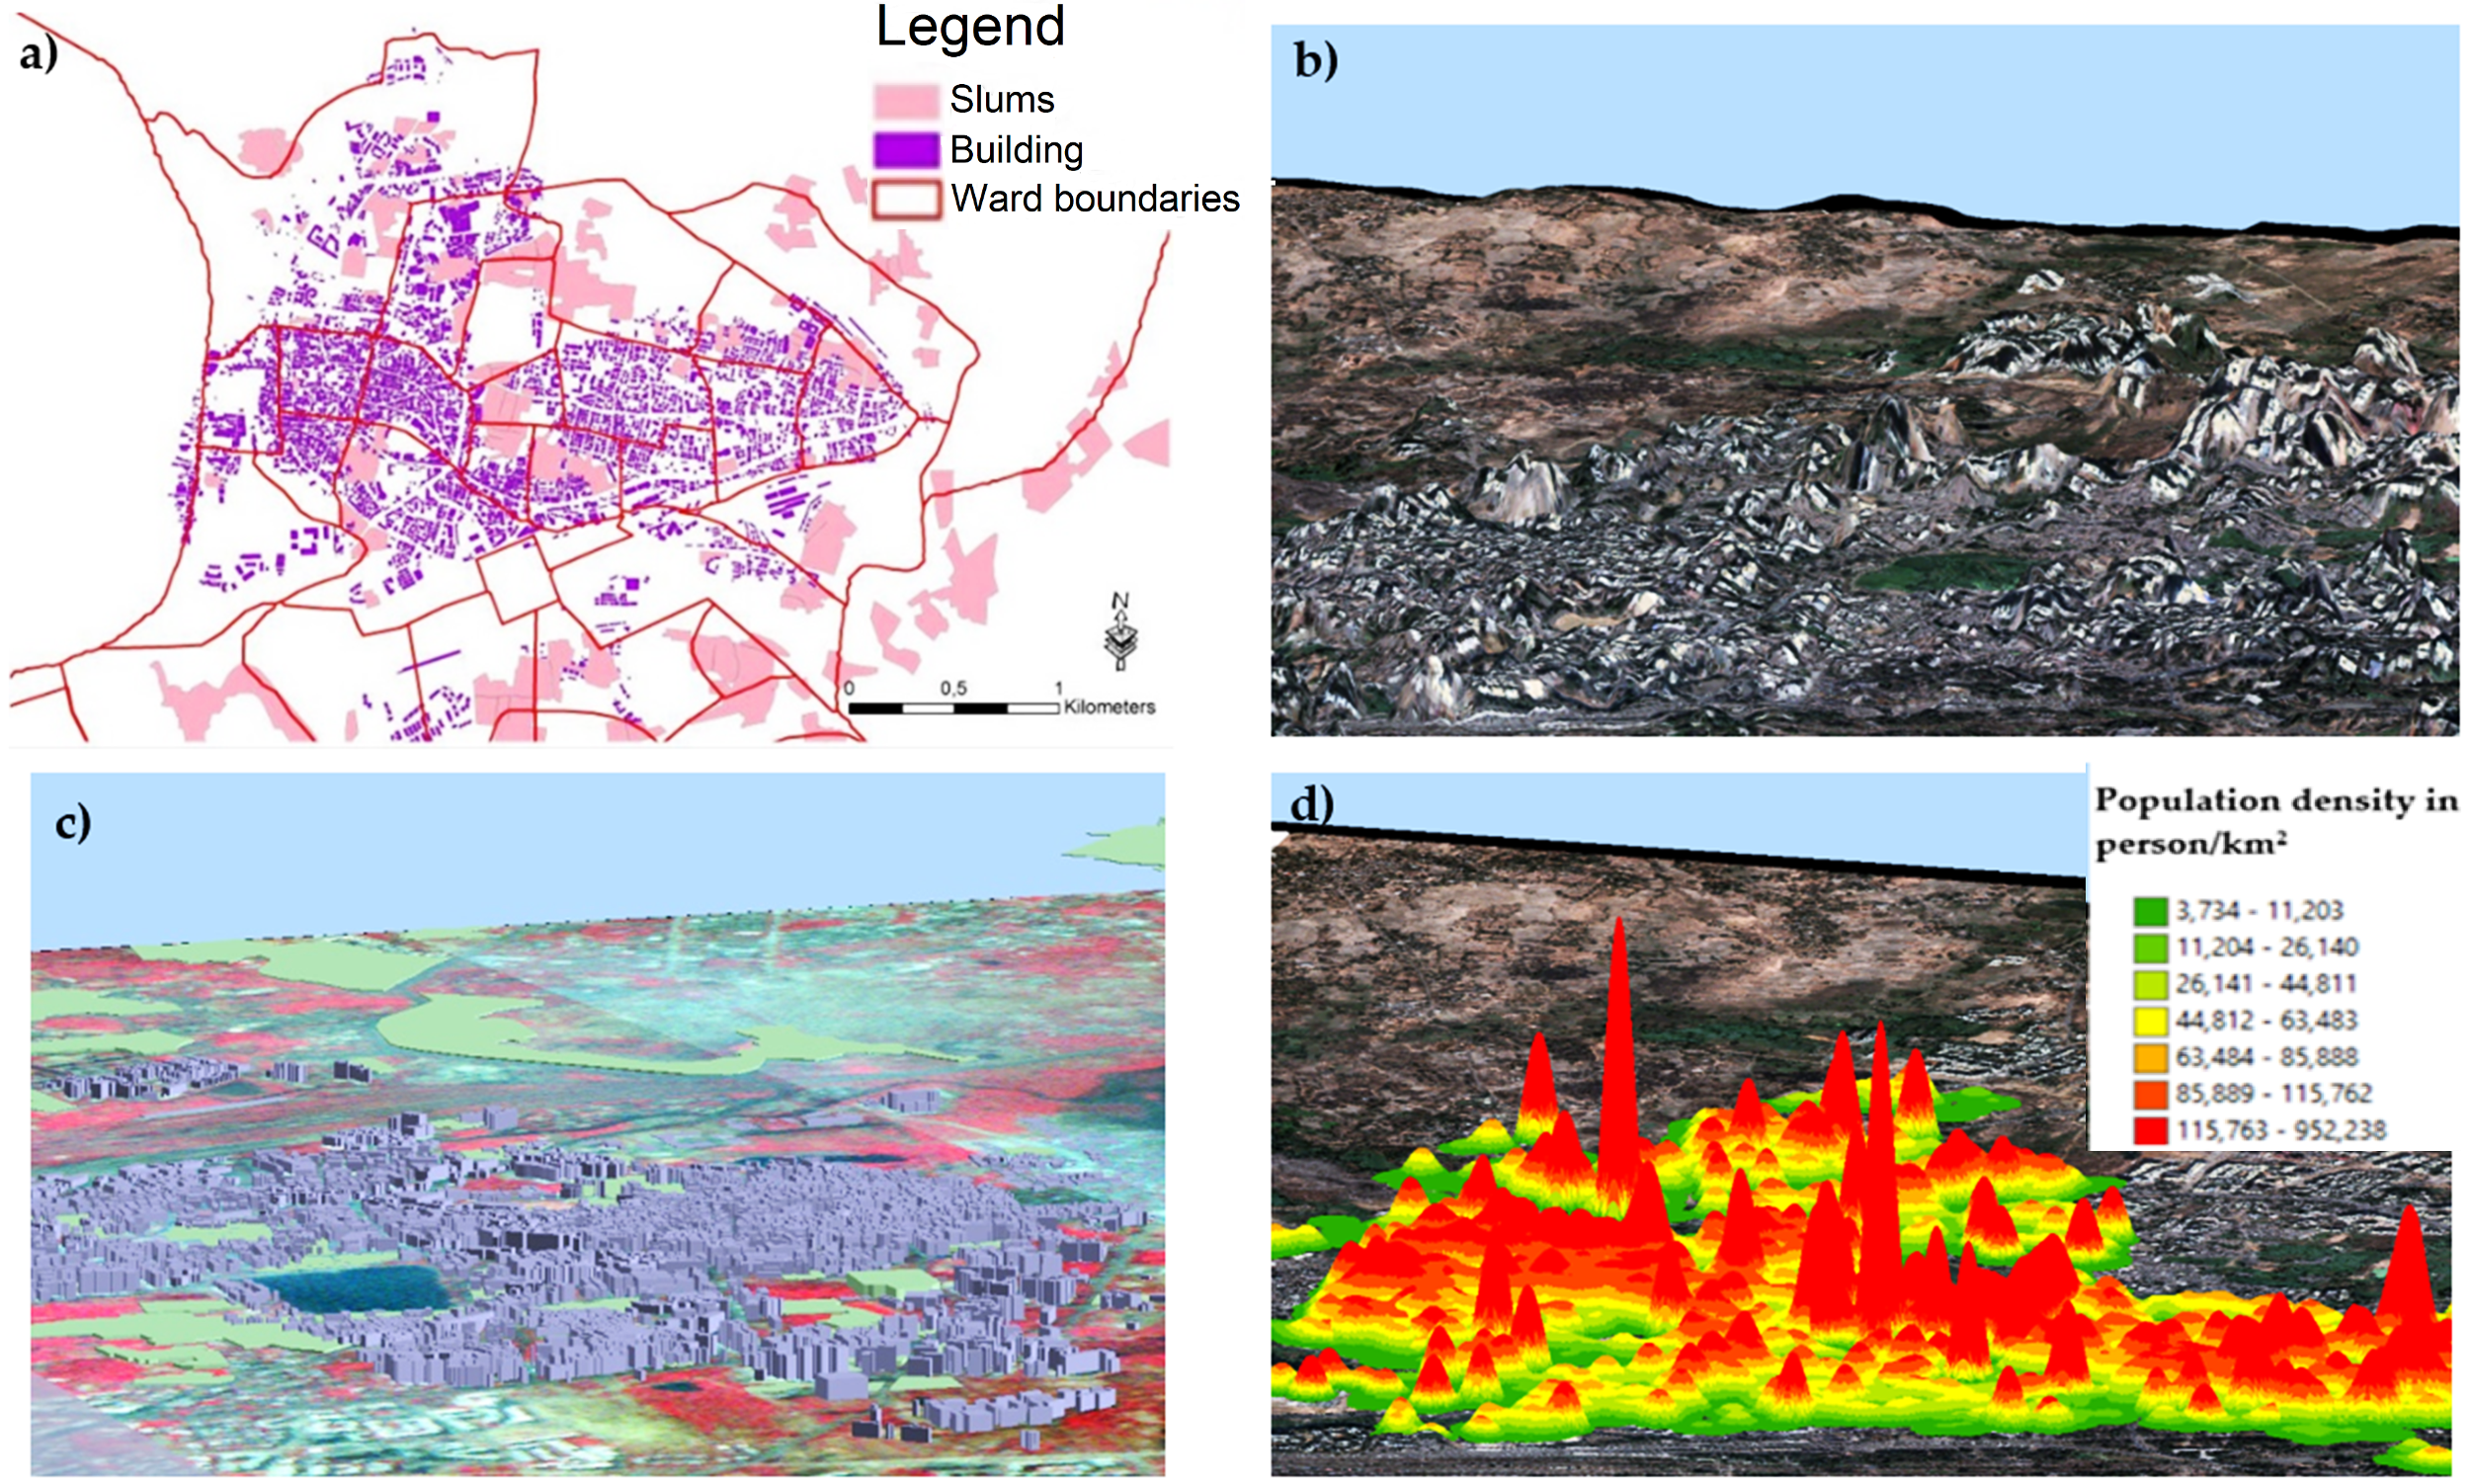
5.3. Population Estimates and Making Maps of Deprived Areas Publically Available: The Case of Nairobi

Nairobi, the largest city of Kenya, had a population of 3.1 million in 2009, according to the last census, and was estimated to be 4.1 million in 2016 [89], with around 60% living in slums [90]. However, slum figures vary; according to the Kenya Open Data Portal (http://kenya.opendataforafrica.org/), the percentage of slum population is only 36%. Population estimates are commonly very uncertain. For Kibera, often referred to as the biggest slum settlement in Africa and one of the five biggest slums on the globe [91], the 2009 Census reported a population of 170,000 inhabitants, while other population estimates are as high as 1 million [92]. Both extremes have been criticized for being unreliable. Population estimation methods that integrate ground surveys with VHR satellite images allow one to estimate the probable scale of the population living within the area and serve as a reference when uncertainties are large or official statistics show obvious omissions (e.g., ward with high built-up densities in form of deprived areas have lower population counts compared to formal areas of similar densities). Population estimates in many deprived areas in East Africa are helped by the fact that most houses are single-story, thus extracting the roof area from remote sensing images, combined with estimates of occupation rates, allows for the population to be estimated.
Nairobi is an interesting example regarding dynamics, as deprived areas not only grow, but many inhabitants also face evictions. Figure 13 shows the growth and disappearance of deprived areas in Nairobi at the edge of Kibera (see also Section 5.2 on 2018 evictions). The figure shows a common dynamic in cities: large-scale infrastructure developments are causing the demolition of deprived areas, but, in the absence of proper resettlement policies, the displaced often reappear in neighboring locations as new settlements or contribute to the expansion of existing deprived areas. However, such evictions are not only destroying housing, related livelihoods, and social networks of inhabitants, but informal facilities and infrastructures (e.g., informal schools, clinics) are also lost [91]. Thus, urban development projects are often realized by further impoverishing the poorest groups of urban inhabitants [93]. Drivers of eviction processes vary, ranging from infrastructure developments (a very common cause across the globe) to illegal evictions by private developers (also common). Interviews with local experts and inhabitants show a general lack of transparency and accountability in the land administration system [94]. Thus, producing archives of deprived area boundary maps, such as done by Slum Dwellers International (SDI), provides historical evidence to challenge fraudulent forced evictions and can support court cases [95]. VHR imagery allows the documenting of the changes of settlement extents but also the existence of individual structures such as dwellings. However, it is important that such data are in the hands of or easily accessible to local communities and NGOs supporting them, but is often not the case. Even then, success in the courts is expensive and time-consuming, and success is not guaranteed.

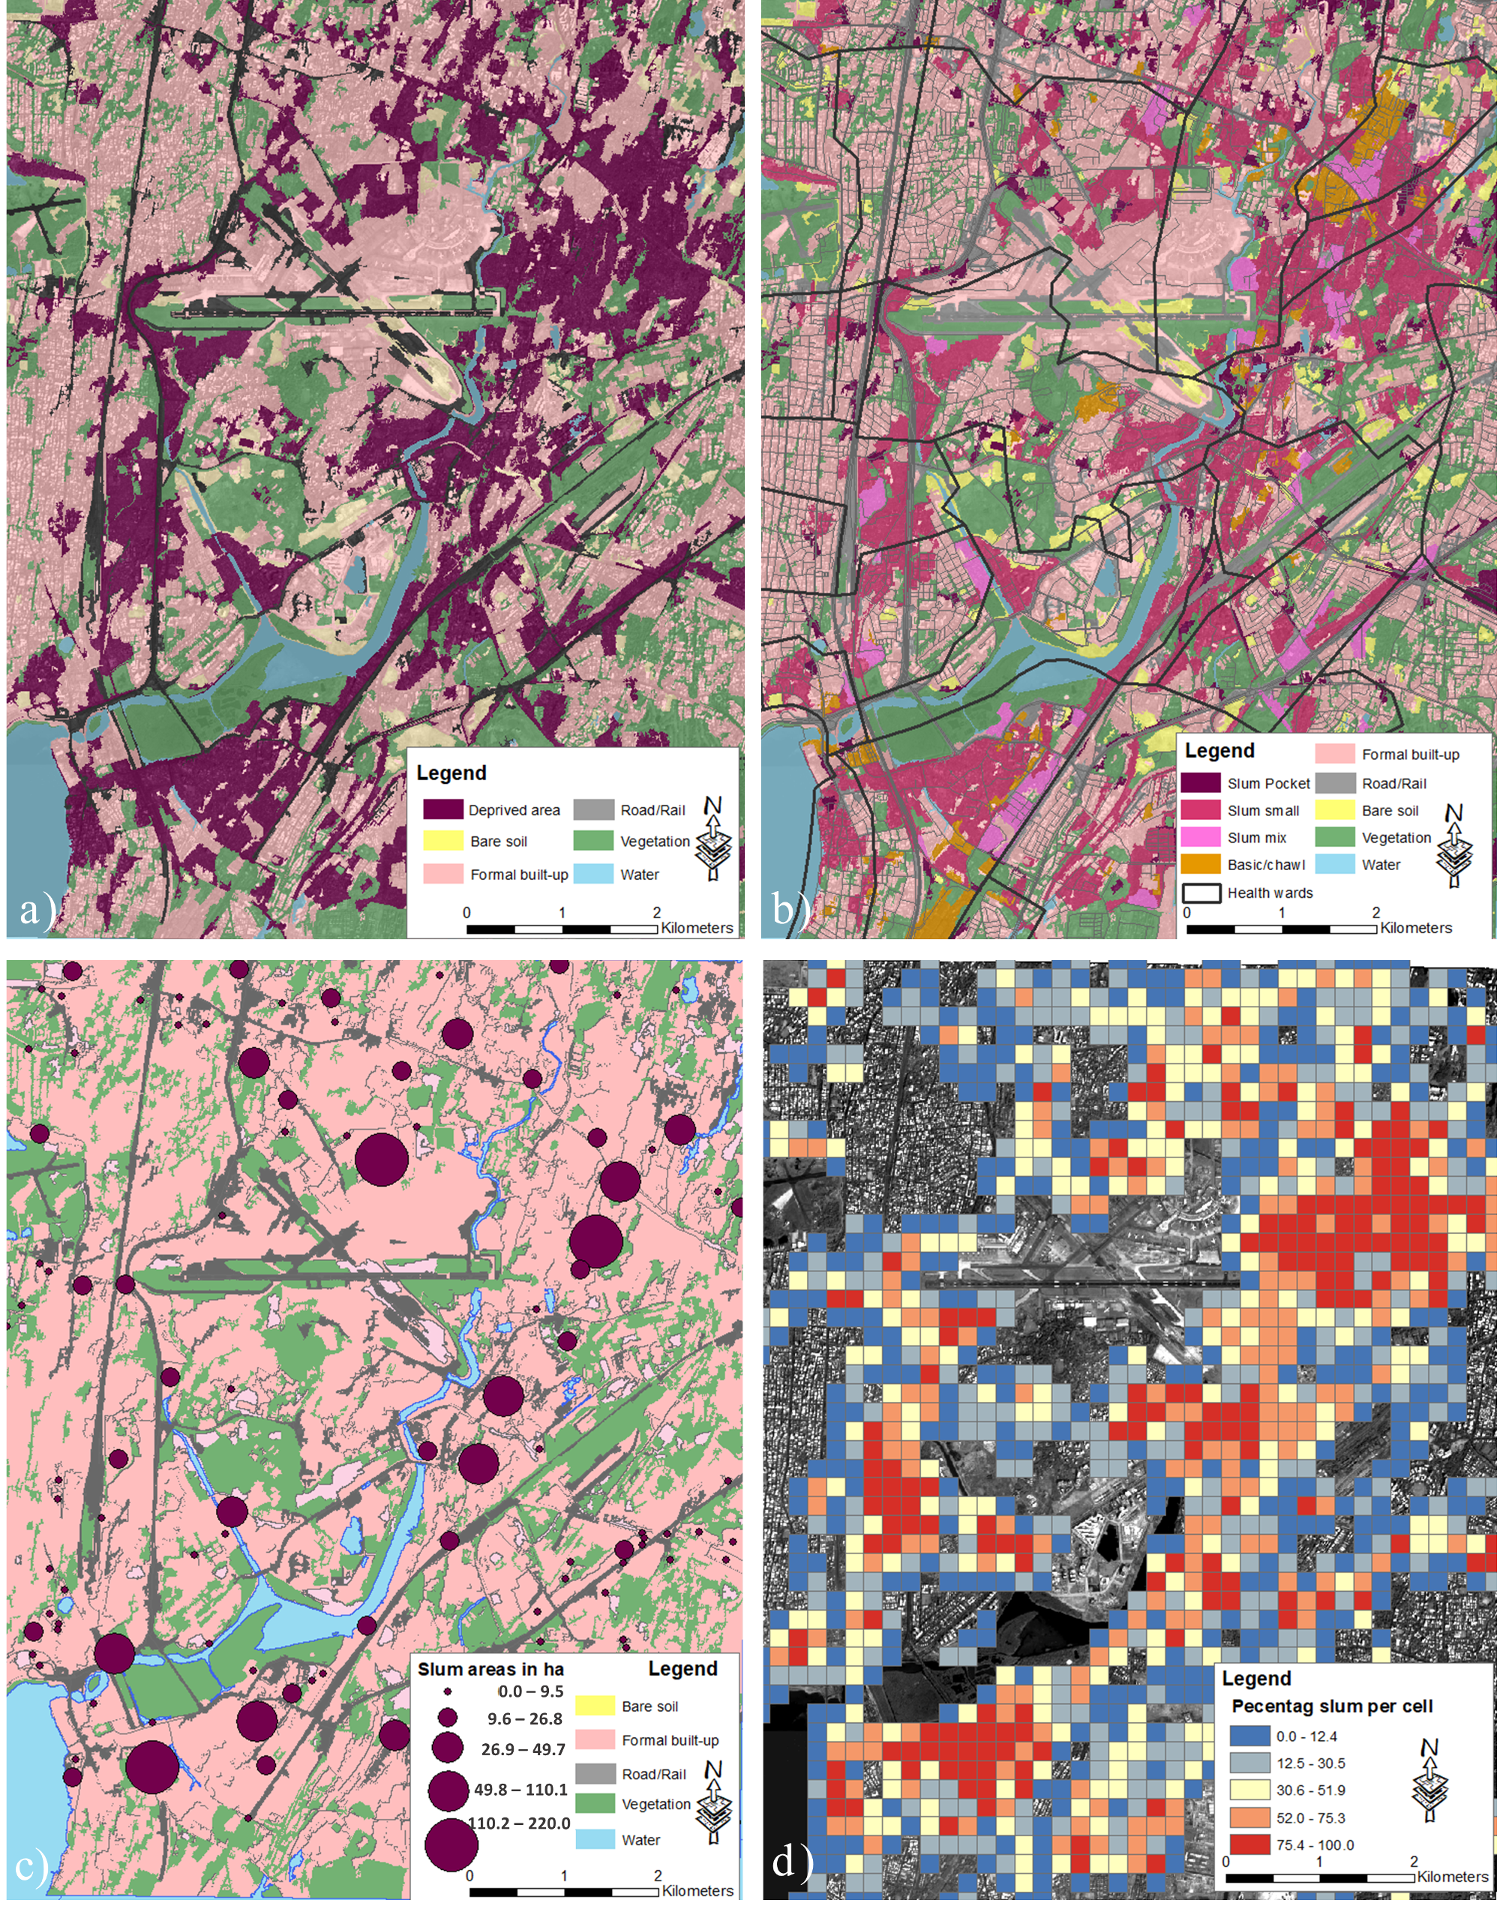
5.4. Leaving the Binary Vision Deprived Versus Non-Deprived Areas: The Case of Mumbai

Mumbai, an Asian megacity, with around 12.5 million city inhabitants and around 18.5 million within its metropolitan area (according to the 2011 census), has around 42% of its inhabitants living in slums [17]. Deprived areas are very diverse in Mumbai, e.g., large slum areas that fulfill housing but also livelihood functions (e.g., manufacturing), pavement dwellings with makeshift structures, or deteriorated chawl areas (19th-century textile workers housing of several floors). Furthermore, resettlement colonies, part of the formal built-up area, show aspects of inadequate housing, e.g., regarding accessibility and location. Thus, using census-based slum statistics, this diversity is not captured, and many deprived areas are excluded.
Employing a standard machine learning algorithm (random forest) and a combination of spectral and image textures, deprived areas can be mapped [49] (Figure 14a). By employing more complex spectral, textural, and spatial features, the diversity of different types of deprived areas can be captured too [96] (Figure 14b). However, this information is mapped with a specific accuracy, which also includes classification errors. In this example, the mapped deprived areas (Figure 14a) have an accuracy of around 90%, while the map showing their diversity has an accuracy of around 75%. Thus, in the case of Figure 14a,b, several mapped deprived areas are not deprived, while, in particular, very small deprived areas are omitted or the boundary is not perfectly extracted. To avoid the possibility that map users might think that mapped boundaries are crisp and certain, a possible solution to make data publicly available and shareable could be to use point locations (Figure 14c) that provide the approximate location of deprived areas across cities or a percentage count using cells (Figure 14d). This would prevent giving the impression that boundaries are clear and perfectly defined when they are fuzzy and uncertain.
Although deprived areas in Mumbai have a relatively easy morphology allowing their mapping through EO imagery, small pockets of pavement dwellers or temporary shelters are difficult to capture or unable to be captured with standard machine-learning methods; here, a DCNN in combination with VHR imagery would allow for a better prediction (Section 3.4). Although relatively high accuracies can be achieved, classification errors relate to the diversity of deprivation (often without crisp boundaries), locational and topographical difference, and similarities with high-density formal housing areas. Therefore, mapping outputs need to be communicated with care and possibly provided at a higher aggregated level with minimum detail, to avoid wrong interpretations as well as to reduce ethical issues related to making such maps available.
Finally, to address mapping ethics, it is important to take into account the purpose and goal of the mapping product. As a rule of thumb, the detail of data represented in the map should be minimized. If the purpose is to indicate the existence of undocumented areas of deprived living conditions, there is no need to disclose all the details in the map. Hence, it is crucial to make a distinction between the level of detail needed for the most accurate (automated) analysis and the level of detail represented in the final mapping product. At the same time, the users of the map—including the general audience—should be enabled to understand the way the data has been processed. This may include knowledge about the indicators employed but also the reliability and validity of the analysis. Regarding the visualization of aggregated data in combination with additional information layers to help users making sense of maps, aggregated data helps to minimize concerns about individual and group privacy, while additional information layers support the understanding of the map. Otherwise, the use of spatial obfuscation techniques might be indicated [97]. However, all these techniques might be insufficient, if even the knowledge of the approximate location and the labelling of the inhabitants as being members of a particular group undermines their security. We also need to be aware that by focusing on areas with specific morphological and locational characteristics, the technology will not capture populations living in deprived conditions, which lack these characteristics. For example, people living in newly built houses, which lack basic infrastructures for water and electricity, will not be mapped by the methods under discussion. Hence, the approach comes with a bias towards a specific group of the urban poor. Finally, we acknowledge that mapping per se will not change the political and societal conditions that rendered the area invisible in the first place.

6. Discussion

6.1. The Varying Degrees of Fuzziness When Mapping Deprived Areas

An initial challenge is to decide on the terminology—do we talk about slums/informal settlements, deprived areas, or under-serviced neighborhoods? This has not been decided still, and each term has a different underlying concept and understanding of such areas and therefore focusses on certain aspects. From our perspective, we should depart from the contested term slum and use either deprived or under-serviced, both of which point to their inadequacy for human habitation. These inadequacies can be related to other social issues (e.g., to health outcomes, where we know that life expectancies are in general lower and infant mortalities higher in such areas) [98,99,100].
After making an initial decision on the term, a conceptualization regarding indicators is essential for the generation of training, testing, and validation data. Even for deep learning, which avoids the generation of user-selected features, this initial conceptualization is also required. Deep learning approaches are extremely data demanding; they will not be efficient if training data are fuzzy and do not represent the variations of deprived areas in a given context.
Another aspect, insufficiently researched, is the required image data for a city scale mapping of deprived areas. Presently, most studies use commercial VHR imagery (e.g., Pleiades, WorldView), which have very high image costs (approximately ranging from €10–25 per km2). However, such imagery also has a lot of noise (e.g., variations of roof materials of individual buildings). It is insufficiently explored whether slightly lower resolution data (e.g., SPOT [33] or RapidEye, with prices below €4 per km2), are providing similar accuracies, or whether for city-level monitoring free imagery (e.g., Sentinel-2 [32]) could also provide a general overview.
To assess the outcomes of remote sensing-based mapping, we need to develop a consistent framework for evaluation that allows relating accuracy metrics with uncertainties. For this reason, we need to leave behind the classical pixel-based accuracy measures and specify area and location-based metrics to allow an assessment of the extensional (e.g., object or patch based) and existential accuracies [34,46,65]. For example, it is worthwhile to examine whether the mapping accuracy of large patches is less sensitive to extensional variation than that of small patches of deprived areas.
Ultimately, we need to keep in mind that we can only capture morphological aspects of deprivation with satellite images [14]. There are “deprived” areas that do not appear to be so when viewed on high spatial resolution imagery. This is due to an assumption that deprived living conditions physically manifest themselves in the landscape in a distinct manner. There are, however, areas where many people live in overcrowded environments without running water, sanitation, and waste facilities. Buildings that look regular on imagery may still be under-serviced (e.g., found in resettlement colonies in India [93]). Moreover, aspects of inadequate housing, such as affordability, cannot be directly captured from space, while other aspects (e.g., location and accessibility), which are presently not considered for the SDGs, can be captured. Thus, based on a clearer conceptualization and reliable and sufficient training data, remote sensing can potentially provide robust and consistent estimates of deprived areas that have distinct morphological characteristics.

6.2. Can We Map the Complexity of Deprived Areas with Earth Observation-Based Methods?

Using either the term deprived or under-serviced will force us to be more specific about what is “lacking” in such areas, i.e., what are the specific needs of inhabitants. This will require leaving the binary vision of “deprived–nondeprived” and require more specifications on the socio-economic and physical conditions. Such information can be used by local authorities and inhabitants to decide on specific upgrading programs and to mobilize community programs.
However, we need to further the work on the development of advanced machine learning algorithms to deal with this complexity. Recent publications in the field of machine learning suggest that deep learning will be the road forward to deal with complex classification problems [12,59]. However, most studies work with small areas of few km2 and rely on using most of the image (as labelled input) to train the computational demanding algorithms. More research is required for developing architectures that allow one to work with city-level images while relying on a limited amount of training data. Furthermore, we need to also map small developments, e.g., at the edges of cities, which can be very dynamic, and are commonly ignored in official data on deprived areas. However, the EO-based methods are only able to estimate socio-economic conditions via physical proxies visible in images and allowing their combination with ground-based data.
To improve the often-noisy pixel-based outputs, the combination of machine learning with OBIA may provide a suitable solution, e.g., by using segments to be classified with deep learning approaches. In addition, the use of segments, as compared to pixels, increases the computational efficiency. As the SDG indicators are not area-based statistics but refer to the proportion of the population, we need to develop dasymetric models [101,102,103] to estimate the population by combining available data sources (census, ground surveys, maps of deprived areas, building heights, etc.). At the global level, settlement-based statistics can be aggregated to provide a global summary on how many inhabitants are forced to live in such areas, which would fulfil the requirements of monitoring the SDG indictor 11.1.1. Assuming the further development of advanced machine learning, handling of Big Data, and cloud computing, regular updates on local conditions could be made available. Ultimately, we need to understand deprivation not as a binary but as continuous phenomenon; this requires algorithms and spatial model that can accommodate this additional complexity.

6.3. The Use of EO-Based Information on Deprivation

Different user groups have different information requirements. For example, historical and up-to-date records of boundaries of deprived areas and their dynamics need to be in the hands of local communities and NGOs supporting them in negotiations with authorities or in case of evictions. However, in most cities, when data on deprived areas is available, inhabitants and supporting NGOs cannot access such data. In this context, Slum Dweller International is in the progress of building a database (‘know your city’), e.g., to have evidences in case of illegal evictions [104]. Giving such groups access to the data and making them aware of the existence of the availability of the data can be seen as one way to acknowledge and address the asymmetrical power relation between the those who have access to mapping technologies and those who are mapped.
Another group of users is local authorities. They require data on specific service needs of areas and developments in hazardous or environmentally sensitive areas to provide alternatives. Globally aggregated information needs to be available when required by international decision makers. For both the local and the global levels, not only area-based, but also population estimates, are required. At the local level, population estimates are fundamental for service provision, while at the global level it is required to monitor the SDG indicator and compare cities, countries, and larger regions.
Any remote sensing-based mapping output, when shared with users including citizens, should state the degree of uncertainty in maps and related population estimates. A challenge here is to provide information in sufficient detail to support poverty alleviation while also protecting group and individual privacy. Any dataset communicated to whatever party and/or the general public must have short and understandable instructions on how to interpret it and what is the degree of uncertainty. In this context, general ethical guidelines are required. Providing simple information on how to read and interpret outputs should help to avoid misinterpretation, though it cannot prevent it. Furthermore, data should not be provided in unnecessarily high detail.

7. Conclusions

EO for urban mapping, and, in particular, machine learning, is a rapidly progressing field, which also allows for mapping of urban deprivation. Although EO-based mapping of deprived living conditions can achieve promising results through a careful combination of features and classification algorithms, large variations in the performance of these combinations are observed due to the heterogeneous configuration of urban areas morphologies and the absence of one-fits-all features and algorithms. Deep learning has shown a great potential to map areas of deprived living conditions with the least human intervention, but the architecture of deep learning models and their transferability require further investigation. The accuracy assessment of results needs to be related to existential and extensional uncertainties. With the advancement of machine-learning techniques and the increasing availability of VHR data, the level of aggregation is shifting from pixel to object level or areal level. The resultant map of deprived areas is thus not pixel-based but is based on homogenous areas with similar spatial configurations. As upgrading strategies are conducted upon spatial units (e.g., neighborhoods), it is very important that classification results are at interpretable aggregation levels instead of at the pixel level.
The next step has to be taken, to upscale mapping to entire cities, and ultimately, to have a global layer of areas with deprived living conditions and related population estimates in support of the SDG indicator 11.1.1. To reach this goal, several bottlenecks need to be overcome. First, we need to agree on a clearer conceptualization of such areas and relate them to a robust set of indicators. Second, algorithms such as CNNs need to be improved to be able to process city-level data with a limited and realistic set of training and testing data. Third, we need to leave the binary vision of deprived versus non-deprived and understand deprivation as a continuous phenomenon, and develop machine learning based methods to estimate the degree of deprivation. Fourth, advanced machine learning algorithms need to be developed that can also capture the temporal dynamics of deprivation in a consistent manner. Fifth, the most suitable image data, in terms of accuracy, computational costs, and image costs, for each spatial level (from neighborhood to global scales), needs to be identified. Sixth, the validation of results needs to include a more holistic understanding of uncertainties and their impacts on results. Seventh, statistical modelling techniques need to be further developed that allow for the extraction of robust estimates of the population based on mapping outputs and household samples. Eight, the prime ownership of data should be in the hands of those who are concerned, including communities, avoiding the provision of unnecessary details to the general public and having clear ethical standards for data openness and sharing. Ultimately, for further research, the remote-sensing community needs to be better aware of local and global data requirements, producing open-source solutions in user-friendly mapping software. The knowledge generated within this application will also be highly relevant for other SDG indicators that are difficult to measure on the ground, particularly regarding developments in the field of advanced machine-learning demonstrating that policy-relevant information can be provided with this emerging technology.

Author Contributions

M.K., K.P., M.N., and R.S. conceived and designed the experiments; M.K. and J.W. performed the experiments; M.K., J.W., and D.K. analyzed the data; M.N., D.K., and C.P. contributed reagents and materials; M.K., J.W., M.N., K.P., D.K., and R.S. wrote the paper.

Funding

The research was partially funded by Dynaslum (Data Driven Modelling and Decision Support for Slums) project (contract number: 27015G05), which is managed by the Dutch national research council (NWO) and the Dutch organization for ICT in education and research (SURF). We acknowledge the European Space Agency (ESA) for providing the image data through its Third Party Missions.

Acknowledgments

We would like to acknowledge the support of the DYNASLUM project, which is managed by the Dutch national research council (NWO) and the Dutch organization for ICT in education and research (SURF) to provide resources for this research. We acknowledge the European Space Agency (ESA) for providing the image data through its Third-Party Missions. We acknowledge the support of DigitalGlobe providing the 8-band WorldView-2 images.

Conflicts of Interest

The authors declare no conflict of interest.

References

  1. UN-Habitat. Slums Almanac 2015–16. Tracking Improvement in the Lives of Slum Dwellers; UN-Habitat: Nairobi, Kenya, 2016. [Google Scholar]
  2. World Bank. Population Living in Slums (% of Urban Population). Available online: https://data.worldbank.org/indicator/EN.POP.SLUM.UR.ZS (accessed on 22 October 2018).
  3. UN-Habitat. Metadata: Indicator 11.1.1: Proportion of Urban Population Living in Slums, Informal Settlements or Inadequate Housing; UN-Habitat: Nairobi, Kenya, 2016. [Google Scholar]
  4. Veljanovski, T.; Kanjir, U.; Pehani, P.; Oštir, K.; Kovačič, P. Object-based image analysis of VHR satellite imagery for population estimation in informal settlement Kibera-Nairobi, Kenya. In Remote Sensing—Applications; Escalante, B., Ed.; InTech: Rijeka, Croatia, 2012; pp. 407–434. [Google Scholar]
  5. Karnataka Slum Development Board. Slum Details. Available online: http://ksdb.kar.nic.in/slums.asp (accessed on 1 October 2018).
  6. Roy, D.; Lees, M.H.; Pfeffer, K.; Sloot, P.M.A. Spatial segregation, inequality, and opportunity bias in the slums of Bengaluru. Cities 2018, 74, 269–276. [Google Scholar] [CrossRef]
  7. Taubenböck, H.; Wurm, M. Ich weiß, dass ich nichts weiß—Bevölkerungsschätzung in der Megacity Mumbai. In Globale Urbanisierung: Perspektive aus Dem All; Taubenböck, H., Wurm, M., Esch, T., Dech, S., Eds.; Springer: Berlin/Heidelberg, Germany, 2015; pp. 171–178. [Google Scholar]
  8. Nolan, L.B. Slum definitions in urban India: Implications for the measurement of health inequalities. Popul. Dev. Rev. 2015, 41, 59–84. [Google Scholar] [CrossRef] [PubMed]
  9. Kuffer, M.; Pfeffer, K.; Sliuzas, R. Slums from space—15 years of slum mapping using remote sensing. Remote Sens. 2016, 8, 455. [Google Scholar] [CrossRef]
  10. Taubenböck, H.; Kraff, N.J.; Wurm, M. The morphology of the Arrival City—A global categorization based on literature surveys and remotely sensed data. Appl. Geogr. 2018, 92, 150–167. [Google Scholar] [CrossRef]
  11. Baud, I.; Kuffer, M.; Pfeffer, K.; Sliuzas, R.V.; Karuppannan, S. Understanding heterogeneity in metropolitan India: The added value of remote sensing data for analyzing sub-standard residential areas. Int. J. Appl. Earth Obs. Geoinf. 2010, 12, 359–374. [Google Scholar] [CrossRef]
  12. Mboga, N.O.; Persello, C.; Bergado, J.; Stein, A. Detection of informal settlements from VHR images using Convolutional Neural Networks. Remote Sens. 2017, 9, 1106. [Google Scholar] [CrossRef]
  13. Duque, J.C.; Patino, J.E.; Betancourt, A. Exploring the Potential of Machine Learning for Automatic Slum Identification from VHR Imagery. Remote Sens. 2017, 9, 895. [Google Scholar] [CrossRef]
  14. Wurm, M.; Taubenböck, H. Detecting social groups from space—Assessment of remote sensing-based mapped morphological slums using income data. Remote Sens. Lett. 2018, 9, 41–50. [Google Scholar] [CrossRef]
  15. Statistic Devision (UN). Tier Classification for Global SDG Indicators; Statistic Devision (UN): New York, NY, USA, 2017. [Google Scholar]
  16. Lebuhn, H.; Holm, A.; Junker, S.; Neitzel, K. Wohnverhältnisse in Deutschland—Eine Analyse der Sozialen Lage in 77 Großstädten. Bericht aus dem Forschungsprojekt Sozialer Wohnversorgungsbedarf; Hans-Böckler-Stiftung: Berlin/Düsseldorf, Germany, 2017. [Google Scholar]
  17. Government of India. Population Census 2011. Available online: http://www.census2011.co.in/ (accessed on 7 June 2016).
  18. Urban Management Centre. City Health Plan Ahmedabad. National Urban Health Mission (NUHM); Health Department, Ahmedabad Municipal Corporation: Ahmedabad, India, 2013. [Google Scholar]
  19. Government of India. Slums in India a Statistical Compendium; Ministry of Housing and Urban Poverty Alleviation, National Buildings Organization: New Delhi, India, 2011.
  20. MPWH. The National Urban Slum Upgrading Program. Environmental and Social Management Framework; Ministry of Public Works and Housing Directorate General of Human Settlement (MPWH): Amman, Jordan, 2016.
  21. BBS (Bangladesh Bureau of Statistics). Bangladesh Population and Housing Census 2011; Statistics and Informatics Division (SID), Ministry of Planning: Dhaka, Bangladesh, 2012.
  22. Kenya National Bureau of Statistics. 2009 Kenya Population and Housing Census. Analytical Report on Urbanization; Ministry of State for Planning: Nairobi, Kenya, 2012; Volume VIII.
  23. National Bureau of Statistics. Basic Facts and Figures on Human Settlements, 2012. Tanzania Mainland; Ministry of Finance: Dar es Salaam, Tanzania, 2013.
  24. Ministry of Infrastructure. National Informal Settlement Upgrading Strategy; Republic of Rwanda: Kigali, Rwanda, 2015.
  25. Nadalin, V.G.; Krause, C.; Neto, V.C.L. Distribuição de Aglomerados Subnormais na Rede Urbana e nas Grandes Regiões Brasileiras; Instituto de Pesquisa Econômica Aplicada (IPEA): Rio de Janeiro, Brazil, 2012. [Google Scholar]
  26. Vuksanovic-Macura, Z. The mapping and enumeration of informal Roma settlements in Serbia. Environ. Urban. 2012, 24, 685–705. [Google Scholar] [CrossRef] [Green Version]
  27. Kuffer, M.; Orina, F.; Sliuzas, R.; Taubenböck, H. Spatial patterns of slums: Comparing African and Asian cities. In Proceedings of the Joint Urban Remote Sensing Event (JURSE), Dubai, UAE, 6–8 March 2017. [Google Scholar]
  28. Leonita, G.; Kuffer, M.; Sliuzas, R.; Persello, C. Machine Learning-Based Slum Mapping in Support of Slum Upgrading Programs: The Case of Bandung City, Indonesia. Remote Sens. 2018, 10, 1522. [Google Scholar] [CrossRef]
  29. Owen, K.K. Evaluating slum severity from remote sensing imagery. In Understanding Megacities with the Reconnaissance, Surveillance, and Intelligence Paradigm; Topical Strategic Multi-Layer Assessment (SMA) and U.S. Army Engineer Research Development Center (ERDC) White Papers in Support of National Security Challenges; Ehlschlaeger, C., Ed.; Strategic Multi-Layer Assessment (SMA) and U.S. Army Engineer Research Development Center (ERDC): Vicksburg, MS, USA, 2014; pp. 67–75. [Google Scholar]
  30. Hofmann, P.; Strobl, J.; Blaschke, T.; Kux, H. Detecting informal settlements from QuickBird data in Rio de Janeiro using an object based approach. In Object-Based Image Analysis; Blaschke, T., Lang, S., Hay, G., Eds.; Springer: Berlin/Heidelberg, Germany, 2008; pp. 531–553. [Google Scholar]
  31. Wang, J.; Kuffer, M.; Pfeffer, K. The role of spatial heterogeneity in detecting urban slums. Comput. Environ. Urban Syst. 2018. [Google Scholar] [CrossRef]
  32. Wurm, M.; Weigand, M.; Schmitt, A.; Geiß, C.; Taubenböck, H. Exploitation of textural and morphological image features in Sentinel-2A data for slum mapping. In Proceedings of the Joint Urban Remote Sensing Event (JURSE), Dubai, UAE, 6–8 March 2017; pp. 1–4. [Google Scholar]
  33. Kemper, T.; Mudau, N.; Mangara, P.; Pesaresi, M. Towards an automated monitoring of human settlements in South Africa using high resolution SPOT satellite imagery. In Proceedings of the 36th International Symposium on Remote Sensing of Environment, Berlin, Germany, 11–15 May 2015; Volume XL-7/W3; pp. 1389–1394. [Google Scholar]
  34. Wurm, M.; Taubenböck, H.; Weigand, M.; Schmitt, A. Slum mapping in polarimetric SAR data using spatial features. Remote Sens. Environ. 2017, 194, 190–204. [Google Scholar] [CrossRef]
  35. Schmitt, A.; Sieg, T.; Wurm, M.; Taubenböck, H. Investigation on the separability of slums by multi-aspect TerraSAR-X dual-co-polarized high resolution spotlight images based on the multi-scale evaluation of local distributions. Int. J. Appl. Earth Obs. Geoinf. 2018, 64, 181–198. [Google Scholar] [CrossRef]
  36. Kleynhans, W.; Salmon, B.P.; Olivier, J.C. Detecting settlement expansion in South Africa using a hyper-temporal SAR change detection approach. Int. J. Appl. Earth Obs. Geoinf. 2015, 42, 142–149. [Google Scholar] [CrossRef]
  37. Kit, O.; Lüdeke, M.; Reckien, D. Defining the bull’s eye: Satellite imagery-assisted slum population assessment in Hyderabad, India. Urban Geogr. 2013, 34, 413–424. [Google Scholar] [CrossRef]
  38. Gevaert, C.M.; Persello, C.; Sliuzas, R.; Vosselman, G. Informal settlement classification using point-cloud and image-based features from UAV data. ISPRS J. Photogramm. Remote Sens. 2017, 125, 225–236. [Google Scholar] [CrossRef]
  39. Gevaert, C.M.; Sliuzas, R.; Persello, C.; Vosselman, G. Opportunities for UAV mapping to support unplanned settlement upgrading. In Proceedings of the GeoTech Rwanda 2015, Kigali, Rwanda, 18–20 November 2015; p. 5. [Google Scholar]
  40. Huang, Y.; Zhuo, L.; Tao, H.; Shi, Q.; Liu, K. A Novel Building Type Classification Scheme Based on Integrated LiDAR and High-Resolution Images. Remote Sens. 2017, 9, 679. [Google Scholar] [CrossRef]
  41. Sliuzas, R.; Kuffer, M.; Pfeffer, K.; Gevaert, C.M.; Persello, C. Slum mapping: From space to unmanned aerial vehicle based approaches. In Proceedings of the Joint Urban Remote Sensing Event (JURSE), Dubai, UAE, 6–8 March 2017; p. 4. [Google Scholar]
  42. Kuffer, M.; Barros, J.; Sliuzas, R.V. The development of a morphological unplanned settlement index using very-high-resolution (VHR) imagery. Comput. Environ. Urban Syst. 2014, 48, 138–152. [Google Scholar] [CrossRef] [Green Version]
  43. Bechtel, B.; Alexander, P.; Böhner, J.; Ching, J.; Conrad, O.; Feddema, J.; Mills, G.; See, L.; Stewart, I. Mapping local climate zones for a worldwide database of the form and function of cities. ISPRS Int. J. Geo-Inf. 2015, 4, 199–219. [Google Scholar] [CrossRef] [Green Version]
  44. Stewart, I.D.; Oke, T.R. Local Climate Zones for Urban Temperature Studies. Bull. Am. Meteorol. Soc. 2012, 93, 1879–1900. [Google Scholar] [CrossRef]
  45. Arribas-Bel, D.; Patino, J.E.; Duque, J.C. Remote sensing-based measurement of Living Environment Deprivation: Improving classical approaches with machine learning. PLoS ONE 2017, 12, e0176684. [Google Scholar] [CrossRef] [PubMed]
  46. Pratomo, J.; Kuffer, M.; Martinez, J.; Kohli, D. Coupling uncertainties with accuracy assessment in object-based slum detections, case study: Jakarta, Indonesia. Remote Sens. 2017, 9, 1164. [Google Scholar] [CrossRef]
  47. Kohli, D.; Sliuzas, R.V.; Kerle, N.; Stein, A. An ontology of slums for image-based classification. Comput. Environ. Urban Syst. 2012, 36, 154–163. [Google Scholar] [CrossRef]
  48. Hofmann, P. Defining robustness measures for OBIA framework: A case study for detecting informal settlements. In Global Urban Monitoring and Assessment through Earth Observation; Weng, Q., Ed.; CRC Press: Boca Raton, FL, USA, 2014; pp. 303–324. [Google Scholar]
  49. Kuffer, M.; Pfeffer, K.; Sliuzas, R.; Baud, I. Extraction of slum areas from VHR imagery using GLCM variance. IEEE J. Sel. Top. Appl. Earth Obs. Remote Sens. 2016, 9, 1830–1840. [Google Scholar] [CrossRef]
  50. Kit, O.; Lüdeke, M.; Reckien, D. Texture-based identification of urban slums in Hyderabad, India using remote sensing data. App. Geogr. 2012, 32, 660–667. [Google Scholar] [CrossRef]
  51. Barros, F.; Sobreira, F. Assessing Texture Pattern in Slum Across Scales: An Unsupervised Approach; CASA Working Papers 87; Centre for Advanced Spatial Analysis (UCL): London, UK, 2005. [Google Scholar]
  52. Ella, L.P.A.; van den Bergh, F.; van Wyk, B.J.; van Wyk, M.A. A Comparison of Texture Feature Algorithms for Urban Settlement Classification. In Proceedings of the 2008 IEEE International Geoscience and Remote Sensing Symposium (IGARSS 2008), Boston, MA, USA, 7–11 July 2008; pp. 1308–1311. [Google Scholar]
  53. Graesser, J.; Cheriyadat, A.; Vatsavai, R.R.; Chandola, V.; Long, J.; Bright, E. Image based characterization of formal and informal neighborhoods in an urban landscape. IEEE J. Sel. Top. Appl. Earth Obs. Remote Sens. 2012, 5, 1164–1176. [Google Scholar] [CrossRef]
  54. Kit, O.; Lüdeke, M. Automated detection of slum area change in Hyderabad, India using multitemporal satellite imagery. ISPRS J. Photogramm. Remote Sens. 2013, 83, 130–137. [Google Scholar] [CrossRef] [Green Version]
  55. Sandborn, A.; Engstrom, R.N. Determining the relationship between census data and spatial features derived from high-resolution imagery in Accra, Ghana. IEEE J. Sel. Top. Appl. Earth Obs. Remote Sens. 2016, 9, 1970–1977. [Google Scholar] [CrossRef]
  56. Huang, X.; Zhang, L. An SVM ensemble approach combining spectral, structural, and semantic features for the classification of high-resolution remotely sensed imagery. IEEE Trans. Geosci. Remote Sens. 2013, 51, 257–272. [Google Scholar] [CrossRef]
  57. Liu, H.; Huang, X.; Wen, D.; Li, J. The use of landscape metrics and transfer learning to explore urban villages in China. Remote Sens. 2017, 9, 365. [Google Scholar] [CrossRef]
  58. Persello, C.; Bruzzone, L. Kernel-Based Domain-Invariant Feature Selection in Hyperspectral Images for Transfer Learning. IEEE Trans. Geosci. Remote Sens. 2016, 54, 2615–2626. [Google Scholar] [CrossRef]
  59. Persello, C.; Stein, A. Deep Fully Convolutional Networks for the Detection of Informal Settlements in VHR Images. IEEE Geosci. Remote Sens. Lett. 2017, 14, 2325–2329. [Google Scholar] [CrossRef]
  60. LeCun, Y.; Bengio, Y.; Hinton, G. Deep learning. Nature 2015, 521, 436. [Google Scholar] [CrossRef] [PubMed]
  61. LeCun, Y.; Kavukcuoglu, K.; Farabet, C. Convolutional Networks and Applications in Vision. In Proceedings of the 2010 IEEE International Symposium on Circuits and Systems, Paris, France, 30 May–2 June 2010; pp. 253–256. [Google Scholar]
  62. Roy, D.; Palavalli, B.; Menon, N.; King, R.; Pfeffer, K.; Lees, M.; Sloot, P.M. Survey-based socio-economic data from slums in Bangalore, India. Sci. Data 2018, 5, 170200. [Google Scholar] [CrossRef] [PubMed] [Green Version]
  63. International Growth Centre (IGC). Urbanisation in Tanzania. Population Growth, Internal Migration and Urbanisation in Tanzania 1967–2012: A Census-Based Regional Analysis; London School of Economic and Political Science: London, UK, 2014. [Google Scholar]
  64. UN-Habitat. Informal Settlements and Finance in Dar es Salaam, Tanzania; UN-Habitat: Nairobi, Kenya, 2010. [Google Scholar]
  65. Kohli, D.; Stein, A.; Sliuzas, R. Uncertainty analysis for image interpretations of urban slums. Comput. Environ. Urban Syst. 2016, 60, 37–49. [Google Scholar] [CrossRef]
  66. Powers, D.M. Evaluation: From Precision, Recall and F-Measure to ROC, Informedness, Markedness and Correlation. J. Mach. Learn. Technol. 2011, 2, 37–63. [Google Scholar]
  67. Cai, L.; Shi, W.; Miao, Z.; Hao, M. Accuracy Assessment Measures for Object Extraction from Remote Sensing Images. Remote Sens. 2018, 10, 303. [Google Scholar] [CrossRef]
  68. Persello, C.; Bruzzone, L. A Novel Protocol for Accuracy Assessment in Classification of Very High Resolution Images. IEEE Trans. Geosci. Remote Sens. 2010, 48, 1232–1244. [Google Scholar] [CrossRef]
  69. Fisher, P. Sorites paradox and vague geographies. Fuzzy Sets Syst. 2000, 113, 7–18. [Google Scholar] [CrossRef] [Green Version]
  70. Ministry of Public Works and Housing (Kemen PUPR). City without Slums (KOTAKU) Program Guide; Ministry of Public Works and Housing: Jakarta, Indonesia, 2016.
  71. Leonita, G. Evaluating the Performance of Machine Learning for Slum Mapping Using Very High-Resolution Imagery. The Case of Bandung City, Indonesia. Master’s Thesis, University of Twente, Enschede, The Netherlands, 2018. [Google Scholar]
  72. Pratomo, J.; Kuffer, M.; Kohli, D.; Martinez, J. Application of the trajectory error matrix for assessing the temporal transferability of OBIA for slum detection. Eur. J. Remote Sens. 2018, 51, 838–849. [Google Scholar] [CrossRef]
  73. Kuffer, M.; Sliuzas, R. Modelling day and night time population using a 3D urban model. In Real Corp 2014; Schrenk, M., Popovich, V.V., Zeile, P., Elisei, P., Eds.; CORP—Competence Center of Urban and Regional Planning: Vienna, Austria, 2014; pp. 397–405. [Google Scholar]
  74. Makau, J.; Dobson, S.; Samia, E. The five-city enumeration: The role of participatory enumerations in developing community capacity and partnerships with government in Uganda. Environ. Urban. 2012, 24, 31–46. [Google Scholar] [CrossRef]
  75. Lefebvre, H. The Urban Revolution; University of Minnesota Press: Minneapolis, MN, USA; London, UK, 2003. [Google Scholar]
  76. Monmonier, M. How to Lie with Maps; University of Chicago Press: Chicago, IL, USA; London, UK, 1991. [Google Scholar]
  77. Curry, M. Digital Places: Living with Geographic Information Technologies; Routledge: London, UK; New York, NY, USA, 1998. [Google Scholar]
  78. Wood, D.; Fels, J.; Krygier, J. Rethinking the Power of Maps; Guilford Press: New York, NY, USA, 2010. [Google Scholar]
  79. Kitchin, R.; Gleeson, J.; Dodge, M. Unfolding mapping practices: A new epistemology for cartography. Trans. Inst. Br. Geogr. 2013, 38, 480–496. [Google Scholar] [CrossRef]
  80. Borgmann, A. Holding on to Reality: The Nature of Information at the Turn of the Millennium; University of Chicago Press: Chicago, IL, USA; London, UK, 1999. [Google Scholar]
  81. Capurro, R. Digital hermeneutics. AI Soc. 2010, 35, 35–42. [Google Scholar] [CrossRef]
  82. Verbeek, P.-P. What Things Do: Philosophical Reflections on Technology, Agency, and Design; Pennsylvania State University Press: University Park, PA, USA, 2005. [Google Scholar]
  83. Floridi, L.; Taddeo, M. What is data ethics? Philos. Trans. R. Ser. A 2016, 374, 20160360. [Google Scholar] [CrossRef] [PubMed] [Green Version]
  84. Kitchin, R. The ethics of smart cities and urban science. Philos. Trans. R. Ser. A 2016, 374, 20160115. [Google Scholar] [CrossRef] [PubMed]
  85. Capurro, R. Intercultural information ethics: Foundations and applications. J. Inf. Commun. Ethics Soc. 2008, 6, 116–126. [Google Scholar] [CrossRef]
  86. Gevaert, C.M.; Sliuzas, R.; Persello, C.; Vosselman, G. Evaluating the Societal Impact of Using Drones to Support Urban Upgrading Projects. ISPRS Int. J. Geo-Inf. 2018, 7, 91. [Google Scholar] [CrossRef]
  87. Taylor, L. Safety in numbers? Group privacy and big data analytics in the developing world. In Group Privacy: New Challenges of Data Technologies; Taylor, L., Floridi, L., van der Sloot, B., Eds.; Springer: Dordrecht, The Netherlands, 2017; pp. 13–36. [Google Scholar]
  88. BBC News. Kenya Slum Demolished to Make Way for Road; BBC News: London, UK, 2018. [Google Scholar]
  89. United Nations. The world’s cities in 2016. In Data Booklet; Department of Economic and Social Affairs, Population Division: New York, NY, USA, 2016. [Google Scholar]
  90. Mittulah, W. The Case of Nairobi, Kenya; UN-Habitat: Nairobi, Kenya, 2003. [Google Scholar]
  91. Hutt, R. These Are the World’s Five Biggest Slums; World Economic Forum: Cologny, Switzerland, 2016. [Google Scholar]
  92. Desgroppes, A.; Taupin, S. Kibera: The biggest slum in Africa? Les Cahiers l’Afrique l’Est 2011, 44, 23–34. [Google Scholar]
  93. Patel, S.; Sliuzas, R.; Mathur, N. The risk of impoverishment in urban development-induced displacement and resettlement in Ahmedabad. Environ. Urban. 2015, 27, 231–256. [Google Scholar] [CrossRef] [Green Version]
  94. Githira, D.N. Growth and Eviction of Informal Settlements in Nairobi; University of Twente, Faculty of Geo-Information and Earth Observation (ITC): Enschede, The Netherlands, 2016. [Google Scholar]
  95. SDI. Strategic Plan 2018–2022; SDI: Cape Town, South Africa, 2018. [Google Scholar]
  96. Kuffer, M.; Pfeffer, K.; Sliuzas, R.; Baud, I.; van Maarseveen, M. Capturing the Diversity of Deprived Areas with Image-Based Features: The Case of Mumbai. Remote Sens. 2017, 9, 384. [Google Scholar] [CrossRef]
  97. Seidl, D.E.; Paulus, G.; Jankowski, P.; Regenfelder, M. Spatial obfuscation methods for privacy protection of household-level data. Appl. Geogr. 2015, 63, 253–263. [Google Scholar] [CrossRef]
  98. Subbaraman, R.; Nolan, L.; Shitole, T.; Sawant, K.; Shitole, S.; Sood, K.; Nanarkar, M.; Ghannam, J.; Betancourt, T.S.; Bloom, D.E.; et al. The psychological toll of slum living in Mumbai, India: A mixed methods study. Soc. Sci. Med. 2014, 119, 155–169. [Google Scholar] [CrossRef] [PubMed] [Green Version]
  99. Agarwal, S. The state of urban health in India; comparing the poorest quartile to the rest of the urban population in selected states and cities. Environ. Urban. 2011, 23, 13–28. [Google Scholar] [CrossRef] [Green Version]
  100. Agarwal, S.; Taneja, S. All slums are not equal: Child health conditions among the urban poor. Indian Pediatr. 2005, 42, 233–244. [Google Scholar] [PubMed]
  101. Nagle, N.N.; Buttenfield, B.P.; Leyk, S.; Speilman, S. Dasymetric Modeling and Uncertainty. Ann. Assoc. Am. Geogr. 2014, 104, 80–95. [Google Scholar] [CrossRef] [PubMed]
  102. Langford, M.; Higgs, G.; Radcliffe, J.; White, S. Urban population distribution models and service accessibility estimation. Comput. Environ. Urban Syst. 2008, 32, 66–80. [Google Scholar] [CrossRef]
  103. Mossoux, S.; Kervyn, M.; Soulé, H.; Canters, F. Mapping population distribution from high resolution remotely sensed imagery in a data poor setting. Remote Sens. 2018, 10, 1409. [Google Scholar] [CrossRef]
  104. Beukes, A. Making the Invisible Visible: Generating Data on ‘Slums’ at Local, City and Global Scales; International Institute for Environment and Development: London, UK, 2015. [Google Scholar]
Figure 1. Romani settlements in Europe: Novi Sad, Serbia (left) and deprived settlement in Paris (yellow outlines) using the abandoned Petite Ceinture railway (right) (Image source: Google Earth).
Ijgi 07 00428 g001
Figure 2. Overview of methodological steps and aspects to utilize remote sensing for the SDG indicator 11.1.1.
Ijgi 07 00428 g002
Figure 3. The ability of different sensor systems to capture a small slum pocket in Bangalore, India (image dimension: 400 × 200 m), with slum pocket in yellow (area: 2832 m2) (Image sources: DigitalGlobe).
Ijgi 07 00428 g003
Figure 4. Comparing VHR satellite imagery with UAV images for the case of Dar es Salaam: (1) and (3) show an informal settlement surrounded by formal areas ((1): VHR and (3): UAV image); (2) shows the level of detail available in VHR imagery; (4,5) show the level of detail available in UAV images (Image source: Google Earth and Ramani Huria).
Ijgi 07 00428 g004
Figure 5. Citywide-level mapping of deprived areas in Bangalore, India: (a) 8 km × 8 km coverage of downtown Bangalore with numbered sample areas for illustration; (b) reference data with sample areas highlighted by boxes; (c) predicted deprived areas with sample areas highlighted by boxes; (d) zoomed-in sample area containing the training samples; and (eh) zoomed-in sample areas of predictions with reference data superimposed (Image source: WorldView-2 images provided by DigitalGlobe).
Ijgi 07 00428 g005
Figure 6. Deprived area mapping in Dar es Salaam, Tanzania: (a) reference data of deprived areas showing the center and its adjacent western suburban areas; (b) deprived area mapping using training area 1 labelled in (a); (c) deprived area mapping using training area 2 labelled in (a); and (d) gradient of deprived area configurations from suburban to urban areas labelled in (a) by blue boxes from left to right (Image source: Pleiades image provided via the ESA Third Party data grant).
Ijgi 07 00428 g006
Figure 7. The complexity of drawing boundaries. (Left) the example of Rio de Janeiro, Brazil (red line municipal favela boundary in 2016); (Right) visual delineations of boundaries of deprived areas in Ahmedabad, India by several geospatial experts (different colors refer to different interpreters) (Image source: Google Earth).
Ijgi 07 00428 g007
Figure 8. Spatiotemporal dynamics of a deprived area in Bangalore (Image source: Google Earth)—the red boundaries represent the slum boundaries delineated in a city-wide mapping campaign by a local team in 2017 for the Dynaslum project.
Ijgi 07 00428 g008
Figure 9. Main groups of accuracy assessment methods, which are relevant to assess mapping results of deprived areas.
Ijgi 07 00428 g009
Figure 10. Difference between non-deprived (1) and deprived kampungs (2) (Image source: Google Earth image and ground photos J. Pratomo—adapted from [72]).
Ijgi 07 00428 g010
Figure 11. Difference between slum maps produced by the local mapping team of the Indonesian Government (left) and a combination of ground survey and image interpretation (right) [71] (Image source: Pleiades provided via the ESA Third Party data grant).
Ijgi 07 00428 g011
Figure 12. Modelling the urban population, Kalyan-Dombivali, India: (a) building footprints and slum boundaries, (b) DSM extracted from Cartosat-1 stereo-images (Image source: ISRO) combined with a Google Earth image, (c) estimated building height, and (d) estimated population density surface.
Ijgi 07 00428 g012
Figure 13. Disappearance and growth of deprived areas driven by infrastructure and formal housing developments (red dot: example of an evicted area causing the incremental growth of deprived areas in the surrounding—purple dot) (Image source: Google Earth).
Ijgi 07 00428 g013
Figure 14. Different spatial information levels of deprived areas: (a) deprived areas mapped together with other land cover/use; (b) detailed urban deprivation classes; (c) point locations of deprived areas and size; and (d) percentage of deprived areas within 200 × 200 m grid cells (Image source: WorldView-2 provided by DigitalGlobe).
Ijgi 07 00428 g014
Table 1. Comparing slum, informal settlement, inadequate housing indicators, and the potential of remote sensing to capture these indicators in images (adapted from [3]).
IndicatorSlumsInformal SettlementsInadequate HousingMapping via Earth Observation (EO)
(P: Indirectly Observable via Image Proxies, Combined with Survey Data)
Access to waterXXXP
Access to sanitationXXXP
Sufficient living area, overcrowdingX XDensity
Structural quality, durability of locationXXXRoofing material, locational and settlement characteristics (e.g., hazards, patterns)
Security of tenureXXXP
Affordability XP
Accessibility XEO as input to spatial analysis (accessibility modelling)
Cultural adequacy XP
Table 2. National slum definitions found in relation to the national census.
India 1Indonesia 2Bangladesh 3Kenya 4Tanzania 5Rwanda 6Brazil 7
Built-up density
Irregular layout
Road infrastructure
Water supply ✓ *
Sanitation ✓ *
Solid waste management ✓ *
Housing quality
Overcrowding
Electricity
Tenure
Environ/site conditions
Socio-economics of HH
Min. size
1 Ministry of Housing and Urban Poverty Alleviation National Buildings Organization (HUPA): ‘slums’ [19]; 2 Ministry of Public Works and Housing (MPWH): ‘slums’ [20]; 3 Bangladesh Bureau of Statistics (BBS): ‘slums’ [21]; 4 Kenya National Bureau of Statistics: ‘informal settlements’ (needs to meet at least two criteria) [22]; 5 National Bureau of Statistics: ‘slums and squatter settlements’ [23]; 6 Ministry of Infrastructure: ‘informal settlements’ [24]; 7 Instituto de Pesquisa Econômica Aplicada (IPEA): ‘aglomerados subnormais’ (* refers to basic services) [25].

