1. Introduction
A smart city uses technological infrastructure in every aspect of our lives in order to provide solutions to the citizens to make their life easier [
1,
2]. The way of communication of information is changing with the advancement in technology, which is an essential strategy of Smart Cities for transforming the city infrastructure and services with Information and Communication Technologies (ICT) [
3]. Comprehensively a city cannot be considered of being smart unless technology enhanced, ICT driven spatial enabled solutions are implemented for better public performance contributing to smart operations of cities [
4]. The implementation of a smart city is the optimization of the urban system with the use of new generation information technology, making the system more consummate, smart, coordinated and developed while improving the livelihood of the people enhancing their intelligence and live harmoniously [
5]. The usage of mobile applications has become essential for the cities to become a smart city, with the rapidly evolving mobile technology.
As technology has advanced so has the way of visualizing simulations and information. Virtual Reality (VR) and Augmented Reality (AR) are great examples of such visualization methods which are booming in this digital era, either by being immersed in a simulated virtual environment or adding a new dimension of interaction between digital devices and the real world. Both methods have something similar, though slightly different and equally significant in their ways providing experiences and interaction being detached or blending with the real world, making real and virtual alike. The process of replacing and supplementing the real world according to the needs is what makes these methods more desirable and increasingly popular. From consumer application to manufacturers these technologies are used in different sectors providing huge benefits through several applications. A significant achievement in the emergence of low cost or freely available headsets has made possible the creation of such virtual exhibition within reach of many with even modest budget [
6].
“Augmented Reality” the term coined by researcher Tom Caudell, at Boeing in 1990, for guiding factory workers with improved diagrams and marking devices [
7]. AR can layer digital information to a real-world environment through a camera, creating a Mixed Reality (MR) [
8], with the intent of supplementing useful information. Advancement in mobile technologies and accessibility of online applications has made possible for AR system to provide service without restraining individuals’ whereabouts to an, specially equipped area [
9], adding a layer of information whenever desired, having potential to revolutionize the way of presenting information to the people [
10]. The year 2017 has seen significant advancement in mobile devices as Apple announced its support to advanced Augmented Reality with its A11 bionic neural engine and Apple’s ARKit [
11], while Google is partnering with the tech giant Samsung to bring Google’s new ARCore framework extending the strength of Android into AR market [
12]. The investment made by these two tech giants in AR inevitably prove to be a game changer for not only retail but also for travel and hospitality.
Navigation, an ability to travel to preferred location from the current location is crucial for adaptation in an unknown place [
13]. Mobile maps and travel guides have been popular among the people for identification of places, acquiring information and many more [
14]. Google maps, the best illustration of technology-enhanced life, as it is used far more than just for navigation, more as a facilitator for exploration of new places apart from driving directions powered by Google, the best search engine of all times. There are four types of functionality partially or fully incorporated within mobile applications for navigation and travel [
15].
These properties metaphorically provide travel experiences, insisting the user into a more simulated environment rather than interaction with the physical world, where users are immersed in acquiring and requesting digital content or information, paying less attention to the surrounding. Although users shell out 3G and Google maps, it takes a while to be accustomed to the surrounding. There are numerous times when a five minutes’ walk to the destination had taken 25 min to reach which is inevitable in a foreign place. Furthermore, the case worsens when language proves a barrier, with no possible way to be assured of the likely destination and ending in a constant dilemma. Digital information received at the individual physical point of view offers opportunities to access prompts and directions when needed [
16] providing a proper synchronization of real world and content specific information. The advent of Mobile Augmented Reality (MAR) has provided an opportunity to deliver information about the destinations in a much more natural and more straightforward way rather than checking online sources, maps and travel guides [
17]. Moreover, AR can help foreigners or tourists to become familiar with unknown places enjoyable and educationally [
18]. In a nutshell, AR can influence people in receiving information about the surrounding simply just by viewing it with a camera, making it useful technology for smart cities.
In this context, the research aims to investigate the use of AR to improve user knowledge and experience of a smart campus. The work proposes a functional mobile augmented reality guide application called ARUJI (Augmented Reality University Jaume I). It supports users on the move by displaying information about the surrounding Points Of Interest (POIs) when a user selects on the screen of their smart devices. More concretely, the main contributions of this work are: (1) Give an insight of AR applications in various fields in smart city context; (2) To identify the potentials of AR applications to know user’s surroundings; (3) Develop a prototype AR application for efficient and effective visualization of information; and (4) Investigate the performance, satisfaction and efficiency of AR applications over Google Map.
The rest of the paper is organized as follows:
Section 2 presents the background and fundamentals used as a basis of our work, some definitions such as Augmented Reality, Reality Virtuality continuum, Virtual Reality, Mixed Reality and Augmented Virtuality. The same section shows some different AR applications in different domains.
Section 3 presents a general overview of our approach and its study area.
Section 4 details how the system is developed showing its different parts.
Section 5 presents some experiments and results about the use of AR. Finally, conclusions and future work are presented in
Section 6.
2. Background
The Background part begins in
Section 2.1 by detailing a list of definitions about AR and variations. After that,
Section 2.2 shows some applications where AR approaches have been applied.
2.1. Concept and Definitions
2.1.1. Augmented Reality
Augmented reality is a technology that layers computer-generated enhancements atop an existing reality in order to make it more meaningful through the ability to interact with it [
19]. Janin et al. [
20] have defined AR with the use of Head-mounted Displays (HMDs), limiting AR to specific technologies. In order to broaden the vision beyond this definition Azuma [
21] defined AR as systems having the following characteristics: (1) combines real and virtual; (2) interactive in real time; and (3) registered in 3D, allowing other technologies, such as mobile technologies, monitor-based interfaces, monocular systems to overlay virtual objects on top of the real world. Today, AR application uses the camera in the mobile devices producing a live view of the real world in combination with relevant, context-appropriate information such as text, videos or pictures, among others.
There are lots of applications and systems in the market that provides AR functionality, making it difficult to classify and name it. Some of them are related to the real physical world and other with the abstract, virtual imagery world. Sometimes it is even difficult to figure whether it is an AR, as often AR is defined as Virtual reality (VR) with a transparent HMDs [
22]. In general, the concept is to mix reality with virtual reality including information and overlay over the real world through HMDs such as they seem apparent as one environment. The virtual objects react accordingly with the movement of the camera as it is registered concerning the real world, which is also the central issue of AR [
22].
2.1.2. Reality-Virtuality Continuum
Similar underlying technologies providing an enhanced experience with full entertainment is what makes people confuse about AR and VR, considering both technologies as the same [
23]. This confusion can be unveiled by the Reality-Virtuality Continuum proposed by Milgram in 1994. Milgram and Kishino [
8] introduced the Reality-Virtuality continuum which defines Mixed Reality and identified a range of variations of technology-altered forms of reality which corresponds to augmented and virtual reality technologies of today. If the real world is at one end of the continuum than the virtual world is at the other end, then AR is space closer to the real world. The closer the system towards the Virtual world, more increase in computer-generated content; hence reduction in real-world elements.
The diagram portrays the relationship of AR, VR, Augmented Virtuality (AV) and Mixed Reality (MR) with the real and virtual world for which it became a base for discussions, classifications, and comparisons between these technologies.
2.1.3. Virtual Reality
VR is an artificial, computer-generated simulation or recreation of a real-life environment or situation, immersing the user by making them feel like they are experiencing the simulated reality firsthand, primarily by stimulating their vision and hearing [
19]. Virtual Reality, the term coined by Jaron Lanier [
24], initially referred to “Immersive Virtual Reality” where the user becomes fully immersed in the virtual 3D world [
25]. The ultimate virtual reality is realized when the user is fully immersed in the virtual world with special VR headset and controllers to interact and get the information. Virtually simulating an environment is replicating its aspect more accurately in order to provide an illusion of the reality, where the degree of immersive can vary [
25]. VR can be classified into two different types: non-immersive and immersive. The former is a computer-based simulation of the real world, whereas immersive VR adds dimensions of immersion, interactivity and user involvement [
26] to the former, completely detaching the user from their surrounding into simulated reality with a head-mounted device replacing the actual world.
It is typically achieved through an HMD like Oculus Rift or Samsung Gear VR, among others, and is possible through a coding language known as Virtual Reality Modeling Language (VRML) creating a series of images, and specifying what types of interactions are possible for them. It is used prominently in two different ways [
19]: (i) To create and enhance an imaginary reality for gaming, entertainment, and play (Such as video and computer games, or 3D movies, head mounted display); (ii) To enhance training for real-life environments by creating a simulation of reality where people can practice beforehand (Such as flight simulators for pilots).
2.1.4. Mixed Reality
MR is defined as a hybrid reality, where real and virtual worlds merge to produce new environments and visualizations where physical and digital objects co-exist and interact in real time. MR not only takes place in the real and virtual world, rather is a mix of reality and virtual reality, encompassing both augmented reality and augmented virtuality. Instead of just a layer on top of the real world, MR brings the ability to combine digitally rendered objects into the real environment, also called holography [
27].
2.1.5. Augmented Virtuality
AV is the ability to explore interactively a virtual representation obtained from the real world. AV could be considered as a subcategory of MR which merges the real world objects into the virtual world. Mostly this can be achieved through streaming video from physical spaces (e.g., via webcam) or by using 3D digitization of physical objects. The videos or real objects are draped into virtual objects, somewhat making the virtual world seem like the real world to some extent, maintaining the flexibility of the virtual world [
28]. An example of AV is an aircraft maintenance engineer who visualizes a real-time model of the airplane engine in flight, as it occurs on a screen with real-world elements that are physically apart.
2.2. AR in Different Domains
AR is a useful visualization technique and can be used in many domains such as medical, robotics, military, navigation, traveling, education, entertainment, marketing, tourism, urban planning, manufacturing, product assembly and repair, architecture and so on [
29]. In this section, examples of AR applications in various domains are discussed.
2.2.1. Medical
AR can be used in wide range of medical practice ranging from pre-operative imaging training and education to image-guided surgery, as it provides the surgeon with a needed view of the internal anatomy and improved sensory perception, reducing the risk of an operation. The need for visualizing the patient and the medical information on the same physical space is why researchers thrive for AR, as it provides the real-time visualization of heterogeneous data required for guided surgery. Roberts et al. [
30] executed the first medical augmented reality system superimposing preoperative computerized tomography (CT) data in the proper position, scale, and orientation. Medical students use the AR technology to practice surgery in a controlled environment. Medical AR provided a useful tool for medical guidance, training, education, procedure, and workflow. AR helps to project anatomical information or image-guided surgical landmarks onto the patient [
31] which provides image guidance during surgical procedures decreasing risks associated with long procedure times [
32]. Such an operation support system with augmented reality technology reduces the cognitive load of doctors in the operation room [
33].
2.2.2. Military
A battlefield is a place of chaos and uncertainty where timely information decides the life and death of soldiers. Augmented annotated information in the real battlefield scenario with HMDs can be used with AR [
34]. The liteye company has researched and used HMDs for military purposes. Through innovative progress in AR, the US Army’s Land Warrior (LW) Program introduced an intelligent agent-based decision support system on LW’s wearable computer providing a perspective view in the weapon sight [
35]. The helicopter night vision system was developed by Canada’s Institute for Aerospace Research (NRC-IAR) using AR to expand the operational envelope of rotorcraft and enhance pilots’ ability to navigate in degraded visual conditions [
36].
Not only AR has been used for assisting military personnel is in the battlefield, but also provide training solution with Advance Helmet Mounted Display (AHMD) by overlaying actual, augmented and simulated visible environment [
37]. Champney et al. [
38] promoted discussion concerning the military training tradeoffs with mixed reality about its usability, simulator fidelity, and immersion.
2.2.3. Tourism
Tourism is another blasting industry where the use of AR has an imperative role in redefining the concept of traditional tourism through advanced technologies. Tourism becomes more intelligent and exciting by just overlaying intuitive data on the user’s screen. Vlahakis et al. [
39] presented the first Augmented Reality based Cultural Heritage on-site guide (ARCHEOGUIDE), to provide tourists with the reconstructed view of the cultural site and archaeological information related to it. Similarly [
40] used AR to provide an immersive experience of the historical scene reflecting needs of tourists improving the quality of the cultural tour. Cinotti et al. [
41] developed a wearable device called WHYRE, a context-aware MultiMedia Guides (MMG) to turn museums and archaeological sites into communicating machines. The success to this project created a milestone and perceived as novel approach with significant market potential. In order to minimize the time to visit a large scale museum or exhibition, Lee & Park [
42] proposed an AR-based guidance system for guiding the user with the relative orientation, distance, and visual cue to find the particular exhibits and multimedia information on that exhibit.
To embroil more tourists, simple, inexpensive, and sustainable AR application emerged due to development in handheld devices. Zoellner et al. [
43] presented the Cultural Heritage Layers, an approach to visualize historical media like paintings, photographs of buildings and a historic scene from the archives and seamlessly superimpose on reality at the right spot. With the evolving technology and development in more commercial mobile applications, the delivery in the content of AR has been a lot easier and superior [
44]. There has been lots of development in mobile AR applications of a guided tour to enhance the perception of the reality [
45,
46,
47,
48].
2.2.4. Navigation
Navigation in simulated environments has been tried and tested and is still in the research phase. Turunen et al. [
49] introduced a personal navigation system in urban areas with mobile augmented reality terminals based on the 3G cellular network. Mobile outdoor navigation systems for pedestrians and electronic tourist guides are already available on PDAs [
50]. Hu & Uchimura [
51] proposed a new concept of Direct Visual navigation (DVN), superimposing virtual direction indicators and traffic information into real road scene providing expert guidance to the drivers. However, this was limited to the mobile-based navigation system, and the driver had to gaze away from the road in order to visualize the navigation information, leading too much of the accidents. Thus, Nakatsura et al. [
52] proposed image overlay on optical see-through display on the front glass of the vehicle for navigation minimizing accident caused due to shifting of gaze from the road to the console. Increasing technologies and creation of gadgets for aiding drivers with navigations are a sort of distractions [
53]. The role of any navigation system is to support the driver to reach the destinations, the main thing to consider is how this navigation system impacts in achieving the driving goals. AR navigation provides better and faster support route decision making and is visually more demanding [
54].
2.2.5. Education
Research shows that Education with AR has proven to be extremely useful in increasing the students’ motivation in learning process [
55,
56,
57,
58,
59]. Imagine the size of the books if all the images were in 3D, it would seem impossible. The ability to supplement real-world objects with virtual objects coexisting in the same space [
60] with a seamless combination of virtual objects with the real world has made it possible. The addition of missing information with virtual objects to real scenes [
61], interaction with 2D and 3D virtual objects in the real world [
62] and superimposing the invisible phenomena in physics such as electromagnetic forces [
63] has improved academic achievements and increased content understanding resulting to long-term memory retention [
64].
2.2.6. Disaster Response
Disaster management is a complex process with lots of uncertainties, incomplete information and requires instant decision and action. During a disaster response situation, first responders require support and guidance for performing relief operations. AR can be a specific solution where computer-generated information is superimposed over the real world providing sufficient information and guidance required by the first responders to initiate the relief operation. Several systems are already addressing the use of AR in support of emergency response such as Augmented reality system for earthquake disaster response [
65], which overlays different invisible disaster-relevant information (e.g., people buried by rubble, simulations of damages and measures) and overlay it with the real environment. Brunetti et al. [
66] presented a wearable AR collaborative system, Smart Augmented Field for Emergency (SAFE) integrated with intelligent agents and multi-agent systems with the purpose of helping first responders and operators involved in a rescue mission. Providing first responders with information and skills to respond to health, security and managerial issues are key factors to be pursued during an emergency response. AR mobile interfaces help in enhancing training efficacy for on-site crisis preparedness activities [
67].
2.2.7. Games
Augmented Reality in games produces a real-time 3D display effect by superimposing virtual information on to the real world. The main motivation of such games is to involve teenagers more into sports and exercise [
68]. AR related games are not only for amusement but various fields such as education, medical treatment, tourism, and training. Unlike VR gaming which requires a separate room or confined area to create an immersive environment, AR gaming expands the playing field, making the game more interesting taking advantage of the diverse world. Also, AR games typically use mobile devices while VR games require individual headsets. Introduced in July 2016, Pokémon Go, a mobile location-based social game, is by far the most popular AR game involving the physical activity of gamer in the real world with potential and documented health benefit.
In a nutshell, Smart cities use ICT for enriching the quality and performance of mobile devices in the city, where AR can provide new solutions to various domains of a smart city. Speaking of AR, it is mostly used in mobile devices such as laptops, smartphones, and tablets to change how the real world and digital images, graphics intersect and interact. The use of AR in asset repair system providing pinpointing repair areas has allowed field technicians to quickly and efficiently query and update repair and customer-based information. Sightseeing has never been more exciting and fun than before, like the ability to augment facts and figures and relevant information as an overlay on the display of smartphone enhancing tourism. Navigation applications are probably the best fit of AR providing a user the best experience of driving a vehicle with a route over the view of the car. Apart from training, AR assists military personnel in the battlefield by displaying critical data as well as valuable information on the HMD. Medical students use AR technology to practice surgery in a controlled environment and also reduce the risk of operation providing a surgeon with improved sensory perception. Thus, with the help of AR, a city is smarter than ever.
3. General Overview
On the one hand, it is well-known that the use of apps such as Google Maps or Apple Maps is a popular trend when searching for places or facilities around a determined location. On the other hand, with the rise of AR and VR in the tech industry, a question emerges, what will be the impact of these technologies on the favorite and massive map apps?
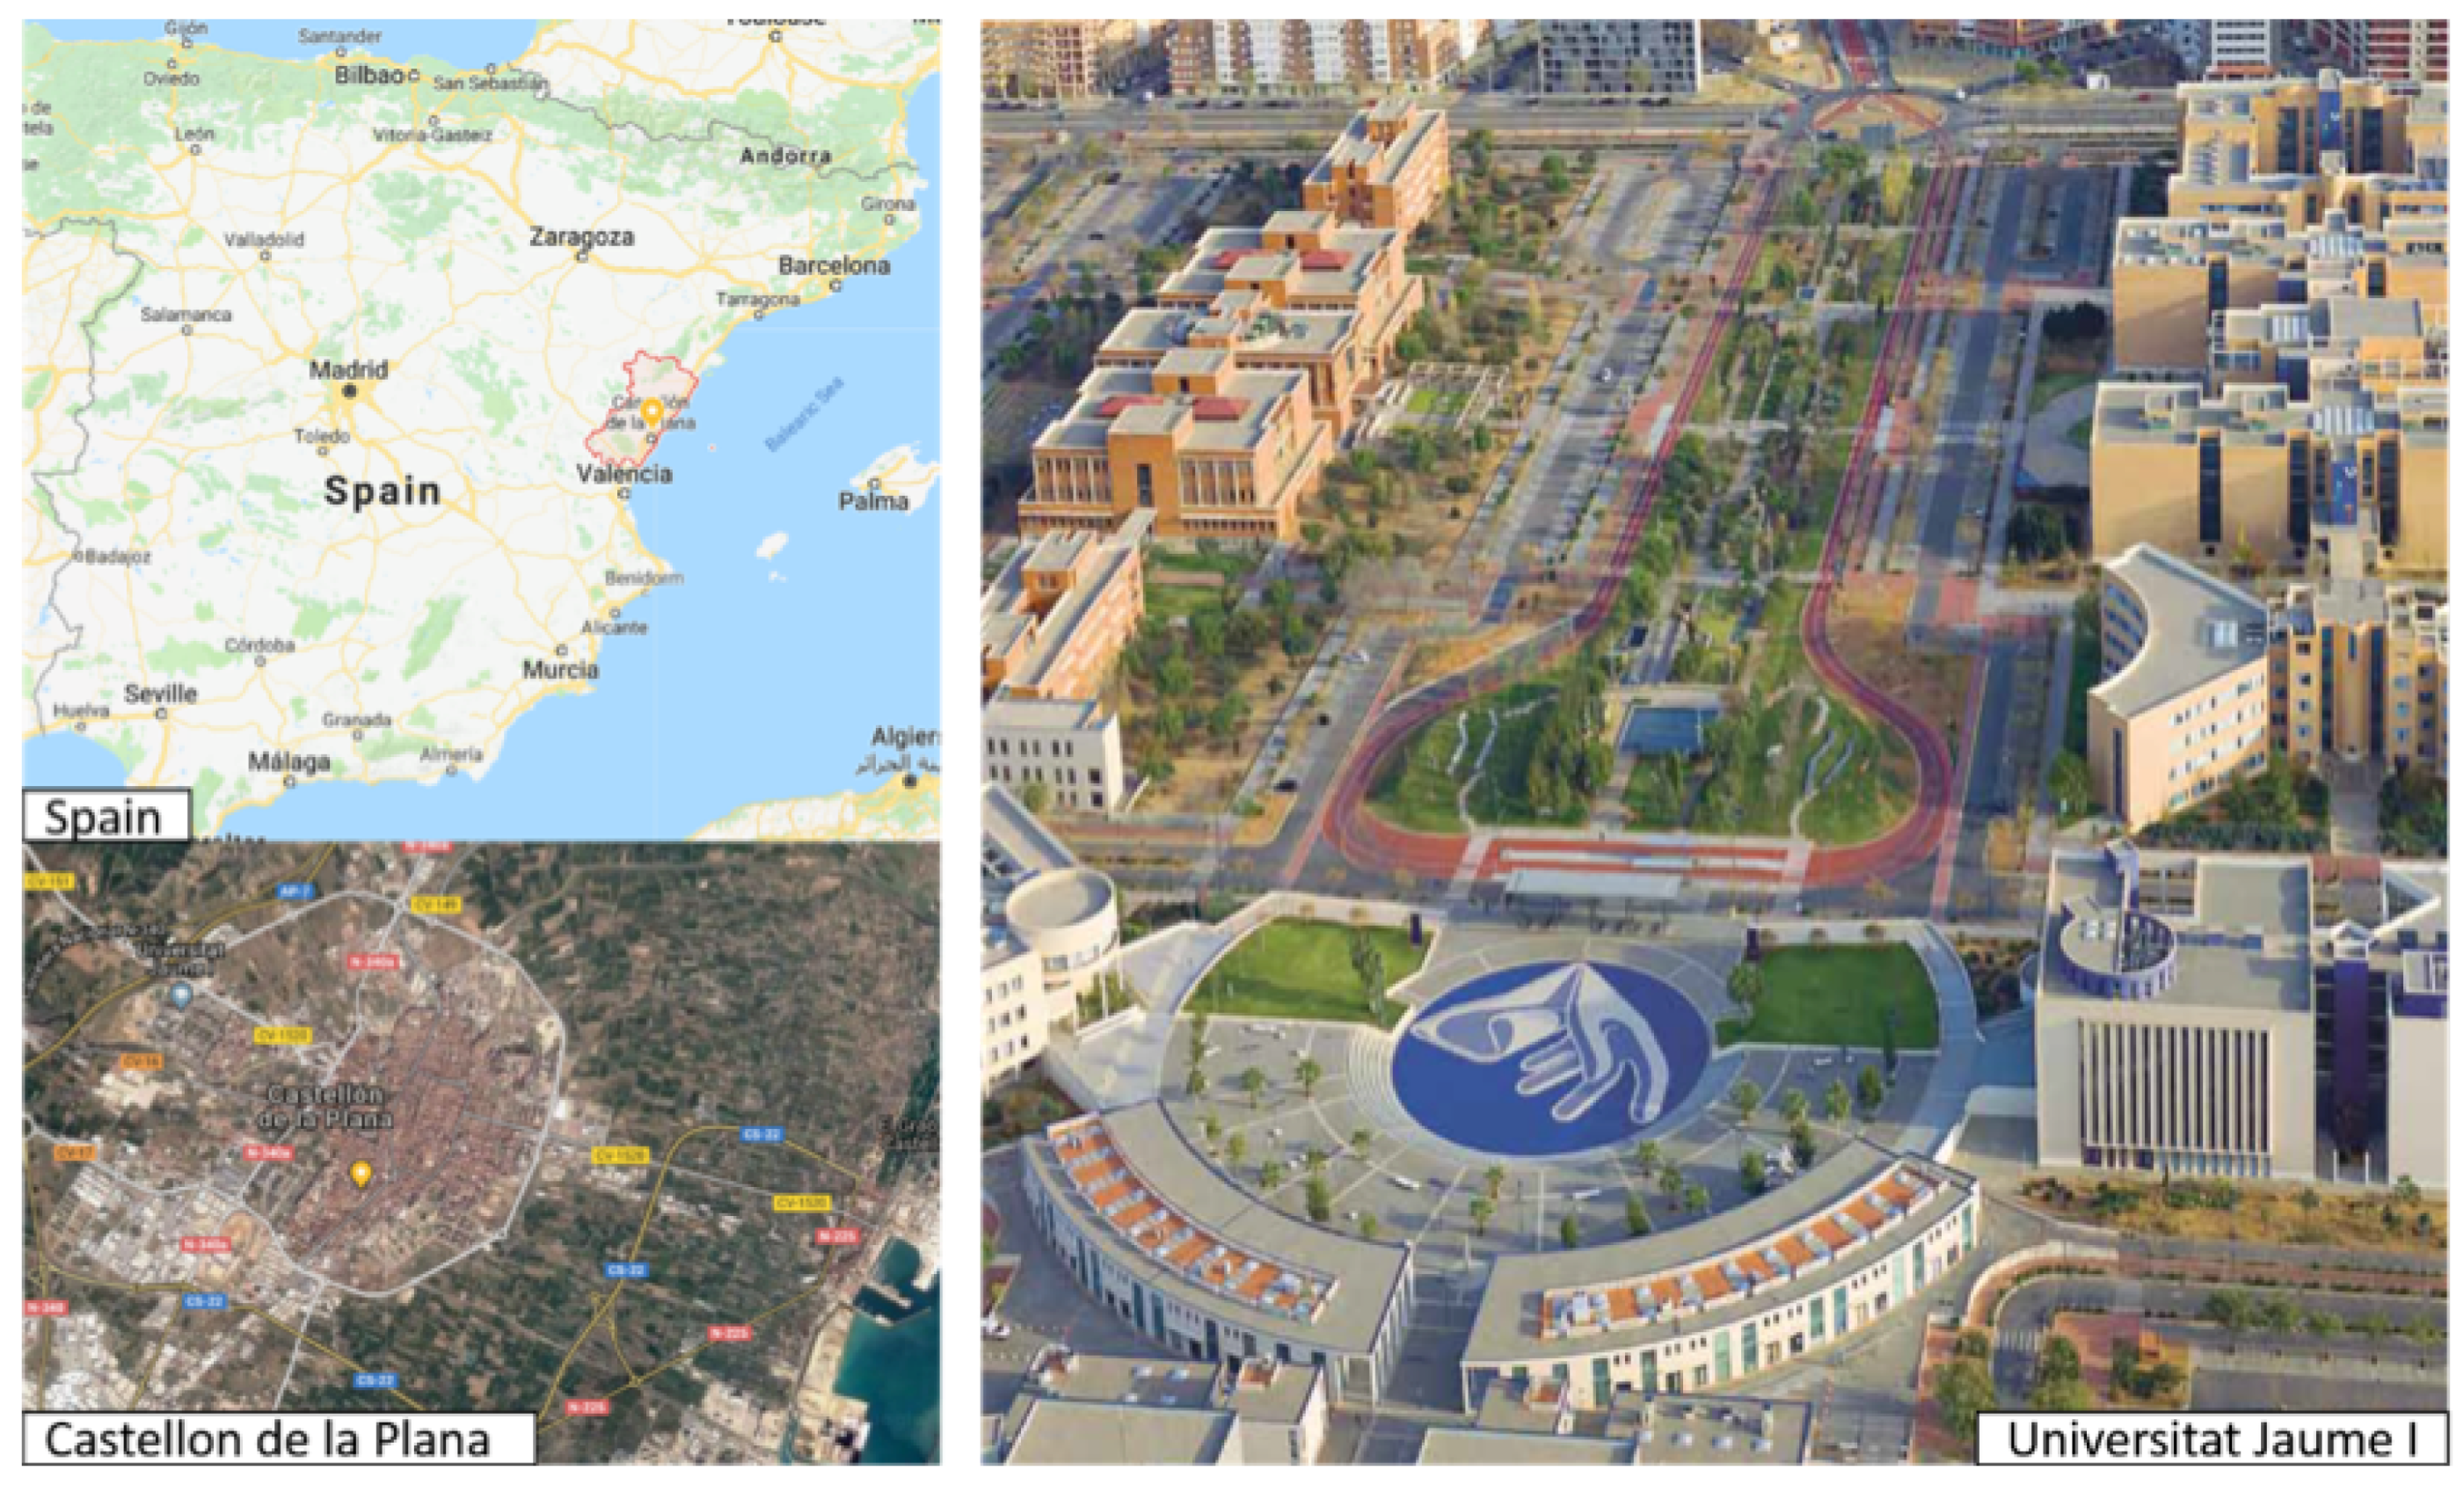
This work aims at providing an evaluation of the use of AR for finding places in a town and information regarding it as a substitution to web mapping services such as Google maps. The preliminary idea consists in developing an AR app of an area and evaluate it by a group of users. A qualitative approach was used where the user opts to view both the models and will answer questionnaires which are later used for the evaluation. This study was conducted among International students with inadequate knowledge of the environment, in our case the University Campus (see
Figure 1). The application features the facilities and services available in the Universitat Jaume I (UJI), Castellon, Spain. The user is presented with the AR application to perform specific tasks usually done with other 2D apps of his choice. Later, the users fill questionnaires related to the functionality of the apps and the willingness of the users to use the app soon with possible improvements.
The study area is the province of Universitat Jaume I of Castellon, Spain, a proactive public higher education and research center, welcoming a considerable number of national and international students every year. It is the northernmost university in the Valencian Community offering 31 undergraduate degrees, 47 official postgraduate master’s degrees, 16 UJI-specific master’s degrees and 39 specialization courses approximating 14,000 students. According to the university, nearly 600 international students, i.e., around 10% of the total students were welcomed in the academic year 2015. It provides an excellent platform for testing the application as many fresh students are new to the University with less knowledge about the surroundings.
4. Development
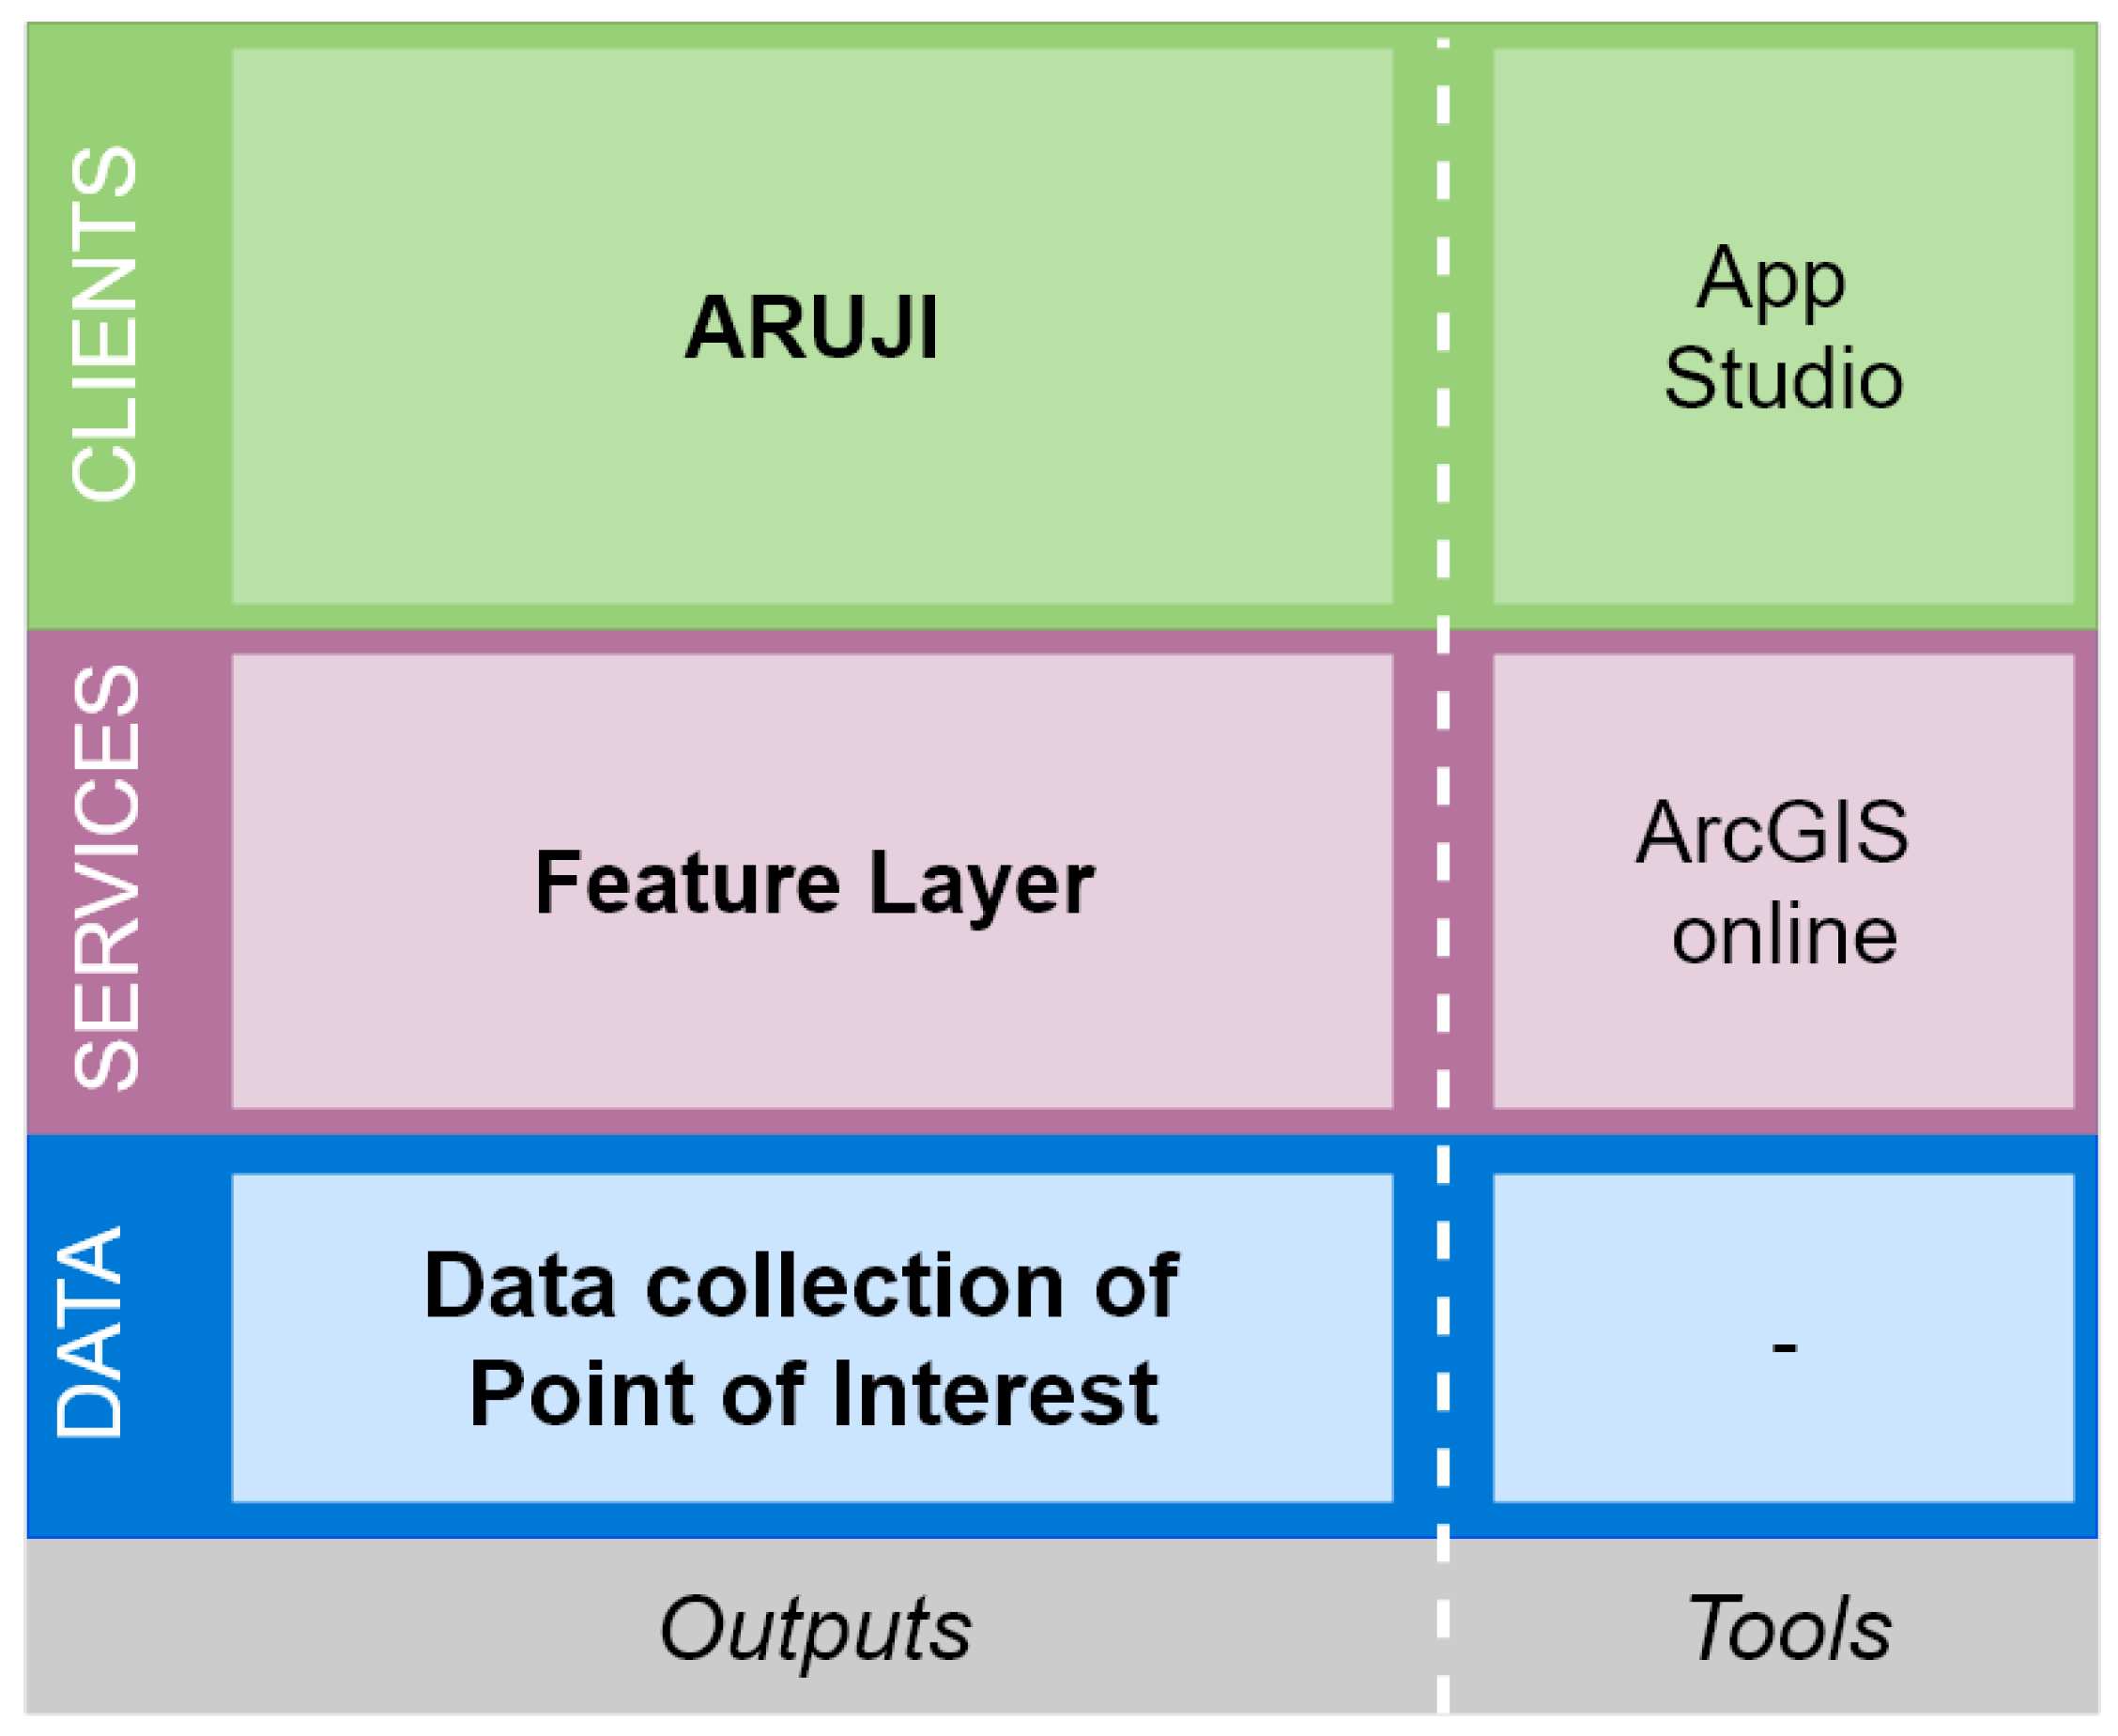
This section presents a general overview for our development framework (
Figure 2). Next subsections detail each piece that forms the framework.
A city can be seen as a dynamic and complex system which can be decomposed intro some subsystems by applying the systemic approach [
69]. Fistola and La Roca also identified the five main urban subsystems namely: the physical subsystem which is composed of spaces and the channels that connect them; the functional subsystem which is composed of the urban activities carried out into spaces or through the channels; the psycho-perceptive system which corresponds to image elaborated by the citizens by themselves; the geomorphological system which is composed of environmental elements); and the anthropic/human system which corresponds to the people giving a sense to the space.
In order to collect data required for the project and to consider most of the previous subsystems, the campus of University Jaume I was selected for the experiments. First, some base data was acquired from an existing research project, namely UJI SmartCampus Project (
http://smart.uji.es), from University Jaume I, Castellón, Spain [
70]. Some previous works suggest that there indeed exists a strong overlap of the priority areas and dimensions that define a city [
71,
72,
73] and a campus [
74,
75,
76,
77]. The tests were carried out in a university campus, which is a place where thousands of people go about their daily activities, resembling a surrogate small city or city neighbourhood.
For the AR App, a point layer with relevant information is published in the ArcGIS online portal as a hosted feature layer (services layer), which is further accessed by the native app Augmented Reality UJI (ARUJI).
As a client, the ARUJI app is build using the AppStudio for ArcGIS, a tool for creating cross-platform native apps, based on AuGeo template which is edited with Qt creator for customisation and configuration of the apps. AppStudio for ArcGIS, it is a tool that converts maps into mobile apps for various platforms such as Mac, iOS, Android, Windows, and Linux and publishes them into the app stores. Depending upon the type of the license, the user can customize and configure the apps. Basic License gives the user, the ability to build apps using configurable app templates, whereas, with a Standard license, the user can create custom apps using own developer skills to extend the configurable templates app and distribute within the enterprise. A standard ArcGIS Online account holder is provisioned with the necessary license only.
Qt Creator is a cross-platform integrated development environment, included in AppStudio for ArcGIS for modifying, editing or creating new apps. Qt Creator uses the Qt Modeling Language (QML), a user interface specification and programming language where JavaScript is used as a scripting language. AuGeo template is a template provided by the ESRI labs as noncommercial offerings for developers to dive into Augmented Reality, so any developer with a standard license can use the source code to embed the AuGeo functionality into their applications.
ArcGIS Online is a collaborative web GIS allowing the user to use, create and share maps, layers, data, apps, scenes, and analytics. It is accessible through web browsers and mobile device through an organizational account or a public account. This project uses an organizational account with a standard license for AppStudio for creation, and maintenance of the app.
4.1. Mobile App (ARUJI)
With the standard license of ArcGIS Online account, a cross-platform Augmented Reality application was created configuring the AuGeo template with custom settings and displays.
ARUJI is a Native app, an AR guiding app for the students and visitors around the University of Jaume I and available for Android devices as an unsigned application. Generally, the system provides the basic functionality of a location-based Augmented Reality application using ArcGIS point feature layers in order to quickly locate assets around the user location through the lenses of the mobile’s camera. It displays information about the POI as a pop up with icons or media designating the location and some quick info.
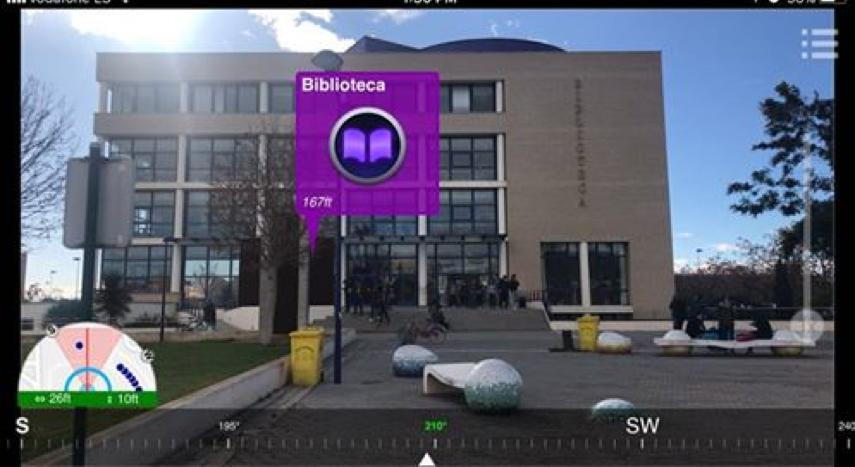
Figure 3 shows an example of POI visualization, where the application displays an interactive pop-up in front of the building with an estimated distance. Each pop-up uses a different color and icon depending on the POI category.
This application has been developed using the AuGeo template, a non-commercial platform into Augmented Reality by Esri Labs for developers, built on AppStudio for ArcGIS which uses QML for modifying and editing the functionalities of AuGeo. The POI comes from a GIS point shapefile with information as its attributes and is accessed from the ArcGIS online. The point shapefile is displayed as a pop up on top the camera with information about the real world infrastructures.
4.1.1. Functionality
Initially, the ARUJI starts by downloading a hosted feature layer, a collection of point features of all the buildings and services available in UJI, from the ArcGIS online portal. Once the feature is downloaded, it can also be used in an offline mode. The application performs the compass calibration of the mobile and determines the user location, which is the essential requirement to determine the accuracy of the application. The higher the compass calibration and accurate location determination, the more the accuracy of the point feature locations. The services available in UJI are categorized in
Table 1.
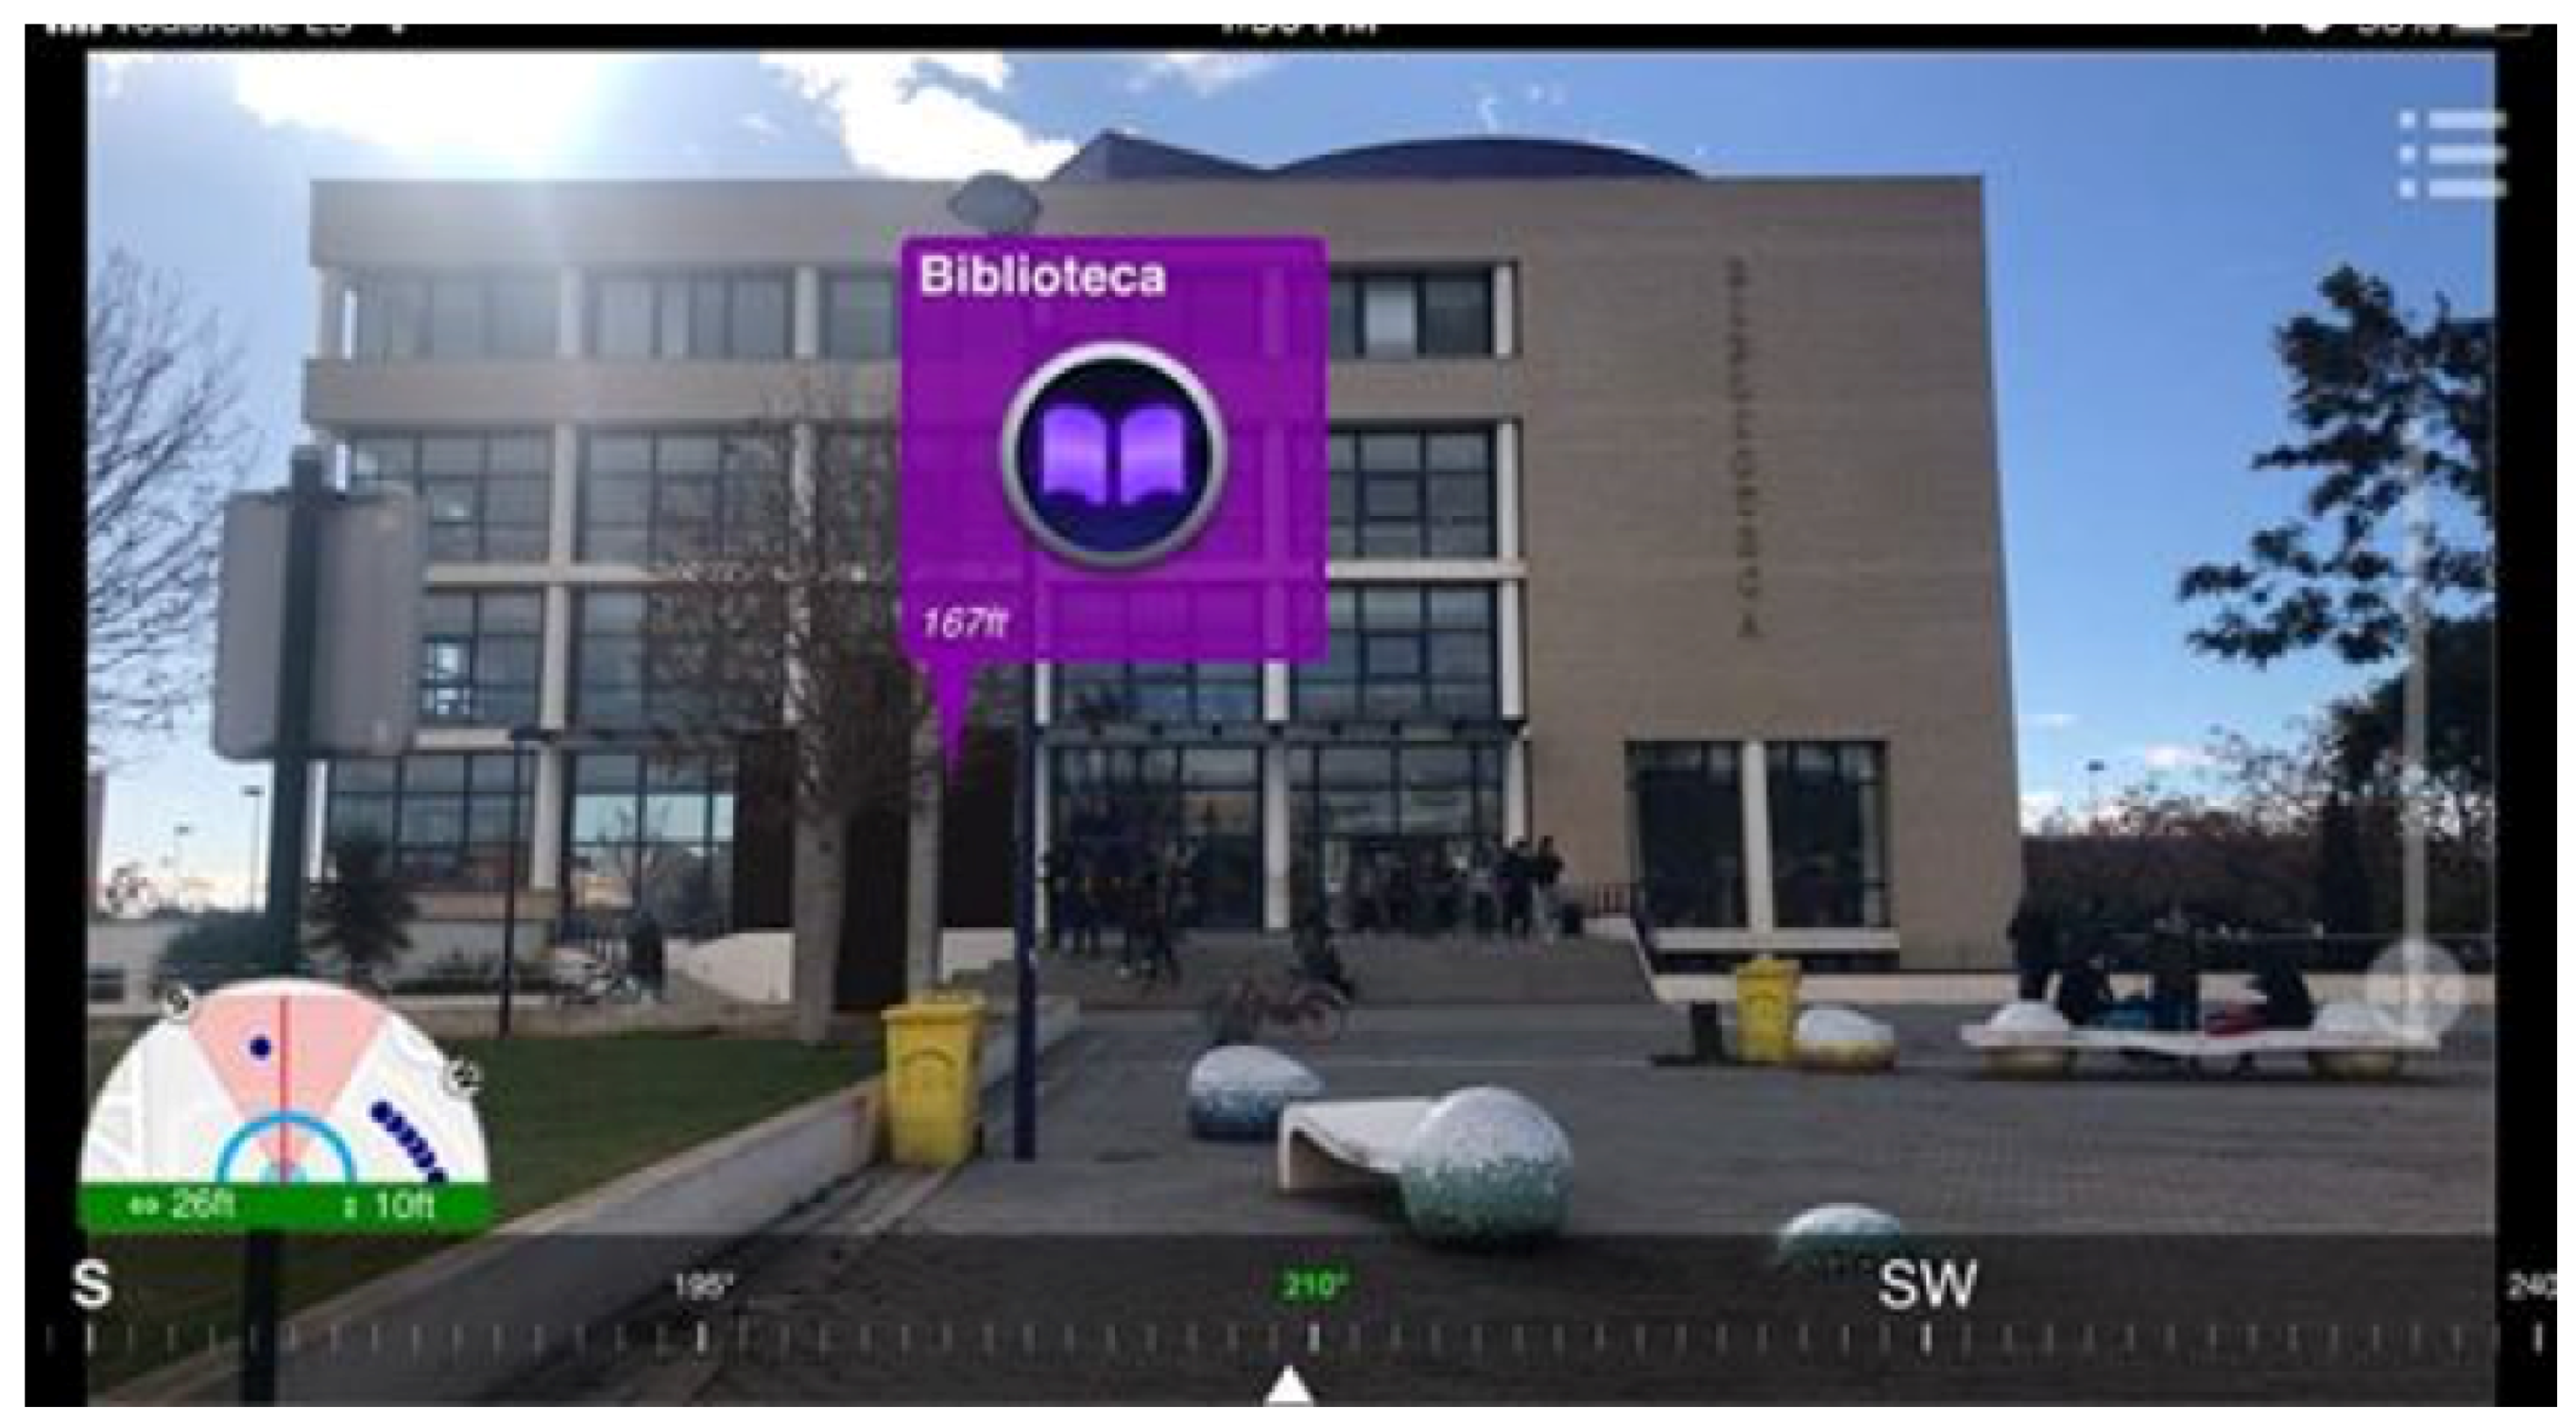
The main window of the application also supports two different types of functionality. First, users can receive more information from the displayed POIs by selecting them in the screen of their mobile device (such as opening hours, phone numbers, etc.). Second, users can navigate to the 2D map view mode by clicking on the circular radar at the bottom left corner of the screen.
Naturally, both marker-based and geo-based AR are prone to the “occlusion problem”, i.e., the real world, as well as the AR contents itself, may visually conceal the display AR contents hiding valuable information. Indeed the ARUJI app is not an exception, with the possibility of displaying POI icons on top of each other for distant POIs. However, these occlusion problems can be solved to some extent with extra options provided to the user. The user can configure the maximum extent for displaying the POIs from the user location, excluding POIs far away causing extra noise in the display screen. Furthermore, the user can zoom in the camera to increase the precision in displaying POIs. Besides, users can select, or deselect, the properties that are displayed in the data popups, reducing the size of them.
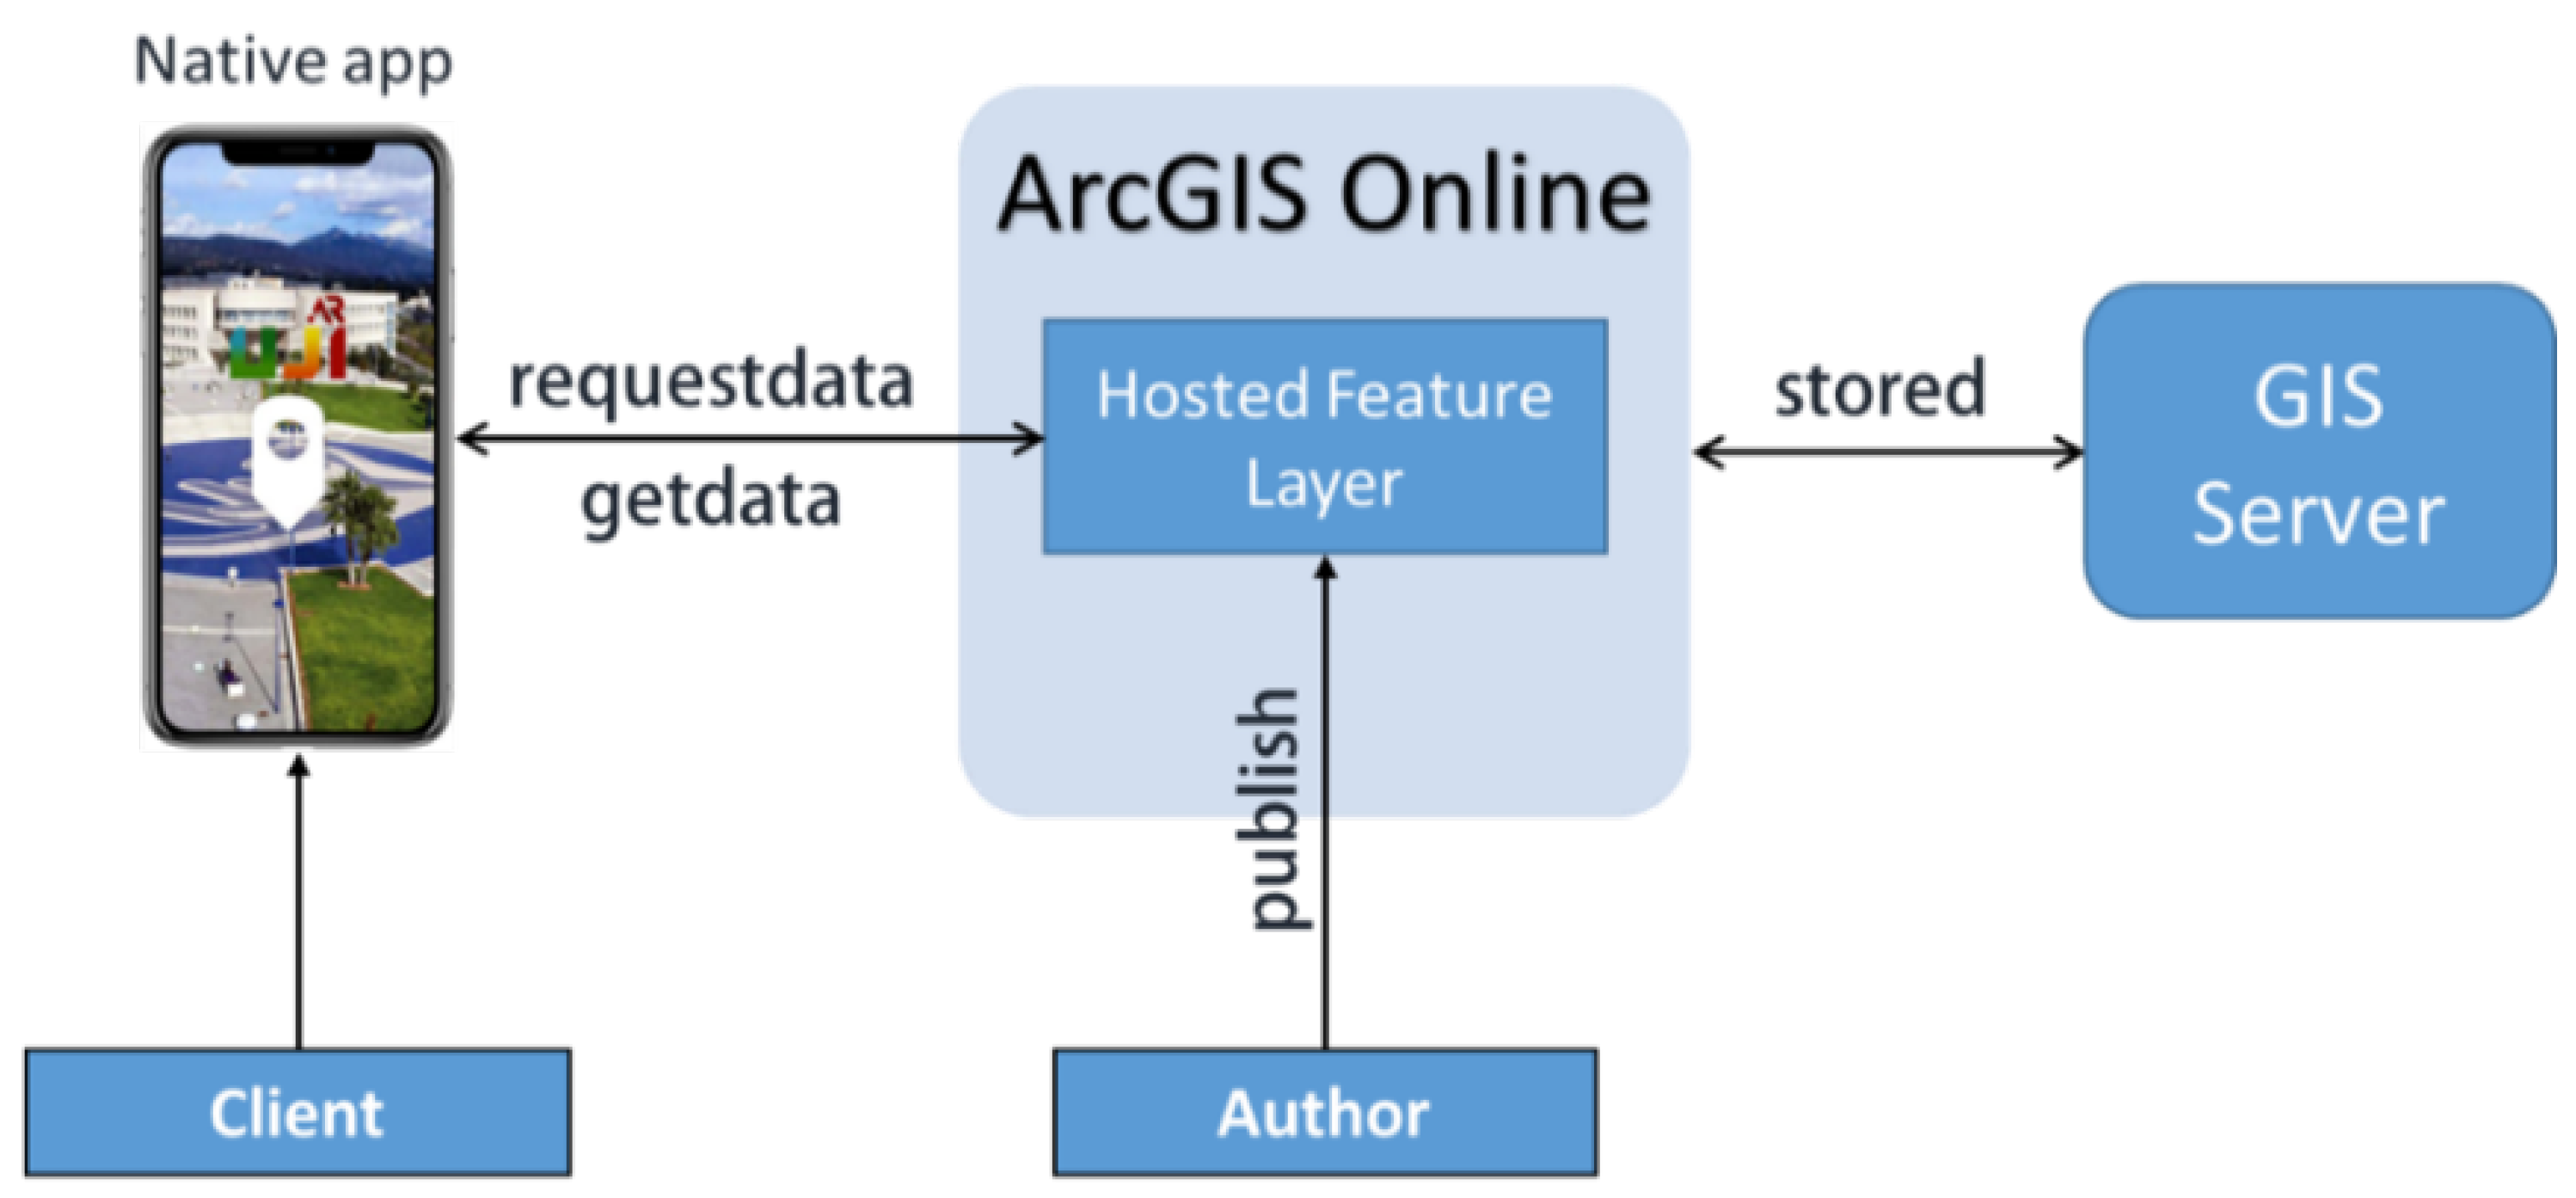
4.1.2. Architecture
According to the system architecture shown in
Figure 4, when a user opens the ARUJI application, it requests data from the hosted services published, or shared, in the ArcGIS Online platform by the provider of the app. The ArcGIS online platform validates the request and provides access to data to be downloaded in the form of ArcGIS point feature layers, which visualizes the content into an augmented reality environment in the mobile device. The point feature layer contains all the information about the feature, ensuring its availability in offline mode as well. All features are previously added (published) in the layer by an author user. A location, category and icon compose these features.
One of the fundamental differences in using the inbuilt AuGeo app from the AuGeo template and ARUJI app is that in AuGEO users need to sign in using the ArcGIS account and set all the variables after signing in and download the data required to run the application. However, the ARUJI app runs without the user to sign in to the ArcGIS account as the credentials are stored within the application. Moreover, the variables are set to default use, appropriate for the users with the data already downloaded for use.
5. Experiments and Results
The research was designed to response the research questions in
Section 1. Initially, a prototype of an AR guided application is tested among a group of international exchange students. The problems and difficulties associated with the spatial knowledge and skills of the students were being acknowledged in the unfamiliar urban dynamics and existing issues with the linguistic difference, in order to provide a solution with AR guided maps service. The study lies in between research and usability study, to provide a better solution to the confronted problem among the international exchange students. This study is designed to improve user knowledge and experience on AR apps for guiding and providing information in a smart city. First, the trend in using of AR guided applications over other map services apps is determined with questionnaires related to the user’s knowledge and experience in AR applications. Later propose a prototype of AR application for use in the vicinity of the University for Users Experience with AR.
5.1. Experimental Setup
The proposed study comprises the type of View (2D Map view and the AR view) as an independent variable, whereas the dependent variables are Effectiveness, Efficiency, and Satisfaction. As the study included only one independent variable, a basic design was approached [
78] with two conditions in the experiment (with and without AR view), i.e., experimenting with Map View and AR View. The successful completion of two searching tasks (See
Table 2) determined the effectiveness of using as Map View application (Google Maps) and an AR View (ARUJI application). Similarly, the Efficiency was determined by the time taken for successful completion of the task with Google Maps and AR View application.
The satisfaction in using the ARUJI application in this study was determined through a questionnaire. The indirect assessment of the users’ satisfaction included questions categorized into five groups: Ease of Use (gracefulness), Clarity of information, Controllability, Helpfulness, and Fun. The questionnaires also involved a more direct approach in the sense that the application users were explicitly asked about the comfortability and satisfaction in using the ARUJI application compared to other mapping applications.
Universitat Jaume I has around 15,000 students, 10% of them enrolled in a Master post-degree degree. The participation to this study was announced to students through the mailing lists. The final participants consisted of 20 random international individuals who showed their interest in participating, were new to the University and with prior experience in using mobile applications. This procedure was carried out in order to avoid bias, ensure the credibility of the results and balance gender, education and age among participants.
Table 3 provides the demographic information of the study participants. The sample comprised of equally distributed men and women. Furthermore, the participants were selected from the local Bachelor and Master Degree programs. The bachelor students were between 19–25 years old, and Master level students were above 26 years old.
The main objectives of the study were explained to the randomly selected participants, who were requested to download the ARUJI application. As the application was developed for the Android platform, we verified that participants owned an Android device. In case they did not own an Android device or their device was not compatible with the application, a Samsung Galaxy Tab was used for testing purposes. The study was conducted with a modern Android-based Samsung Galaxy Tab S (SM-T700) which has the computational resources and the embedded sensors required to run the ARUJI application smothly.
After the participants were given the tablet, they were instructed on its usage (a first-use tutorial) and were given simple and easy tasks to locate services and places and facilities (such as restaurants, cafeterias, departments, classrooms etc.) around them with an application of their choice (e.g., Google Maps) and later perform the same task with the ARUJI application. They were assigned to every participant in order to enhance the understanding of the research question and easement in answering the questionnaires, as detailed in
Table 2. The time taken for each task was recorded for evaluating the efficiency of the applications.
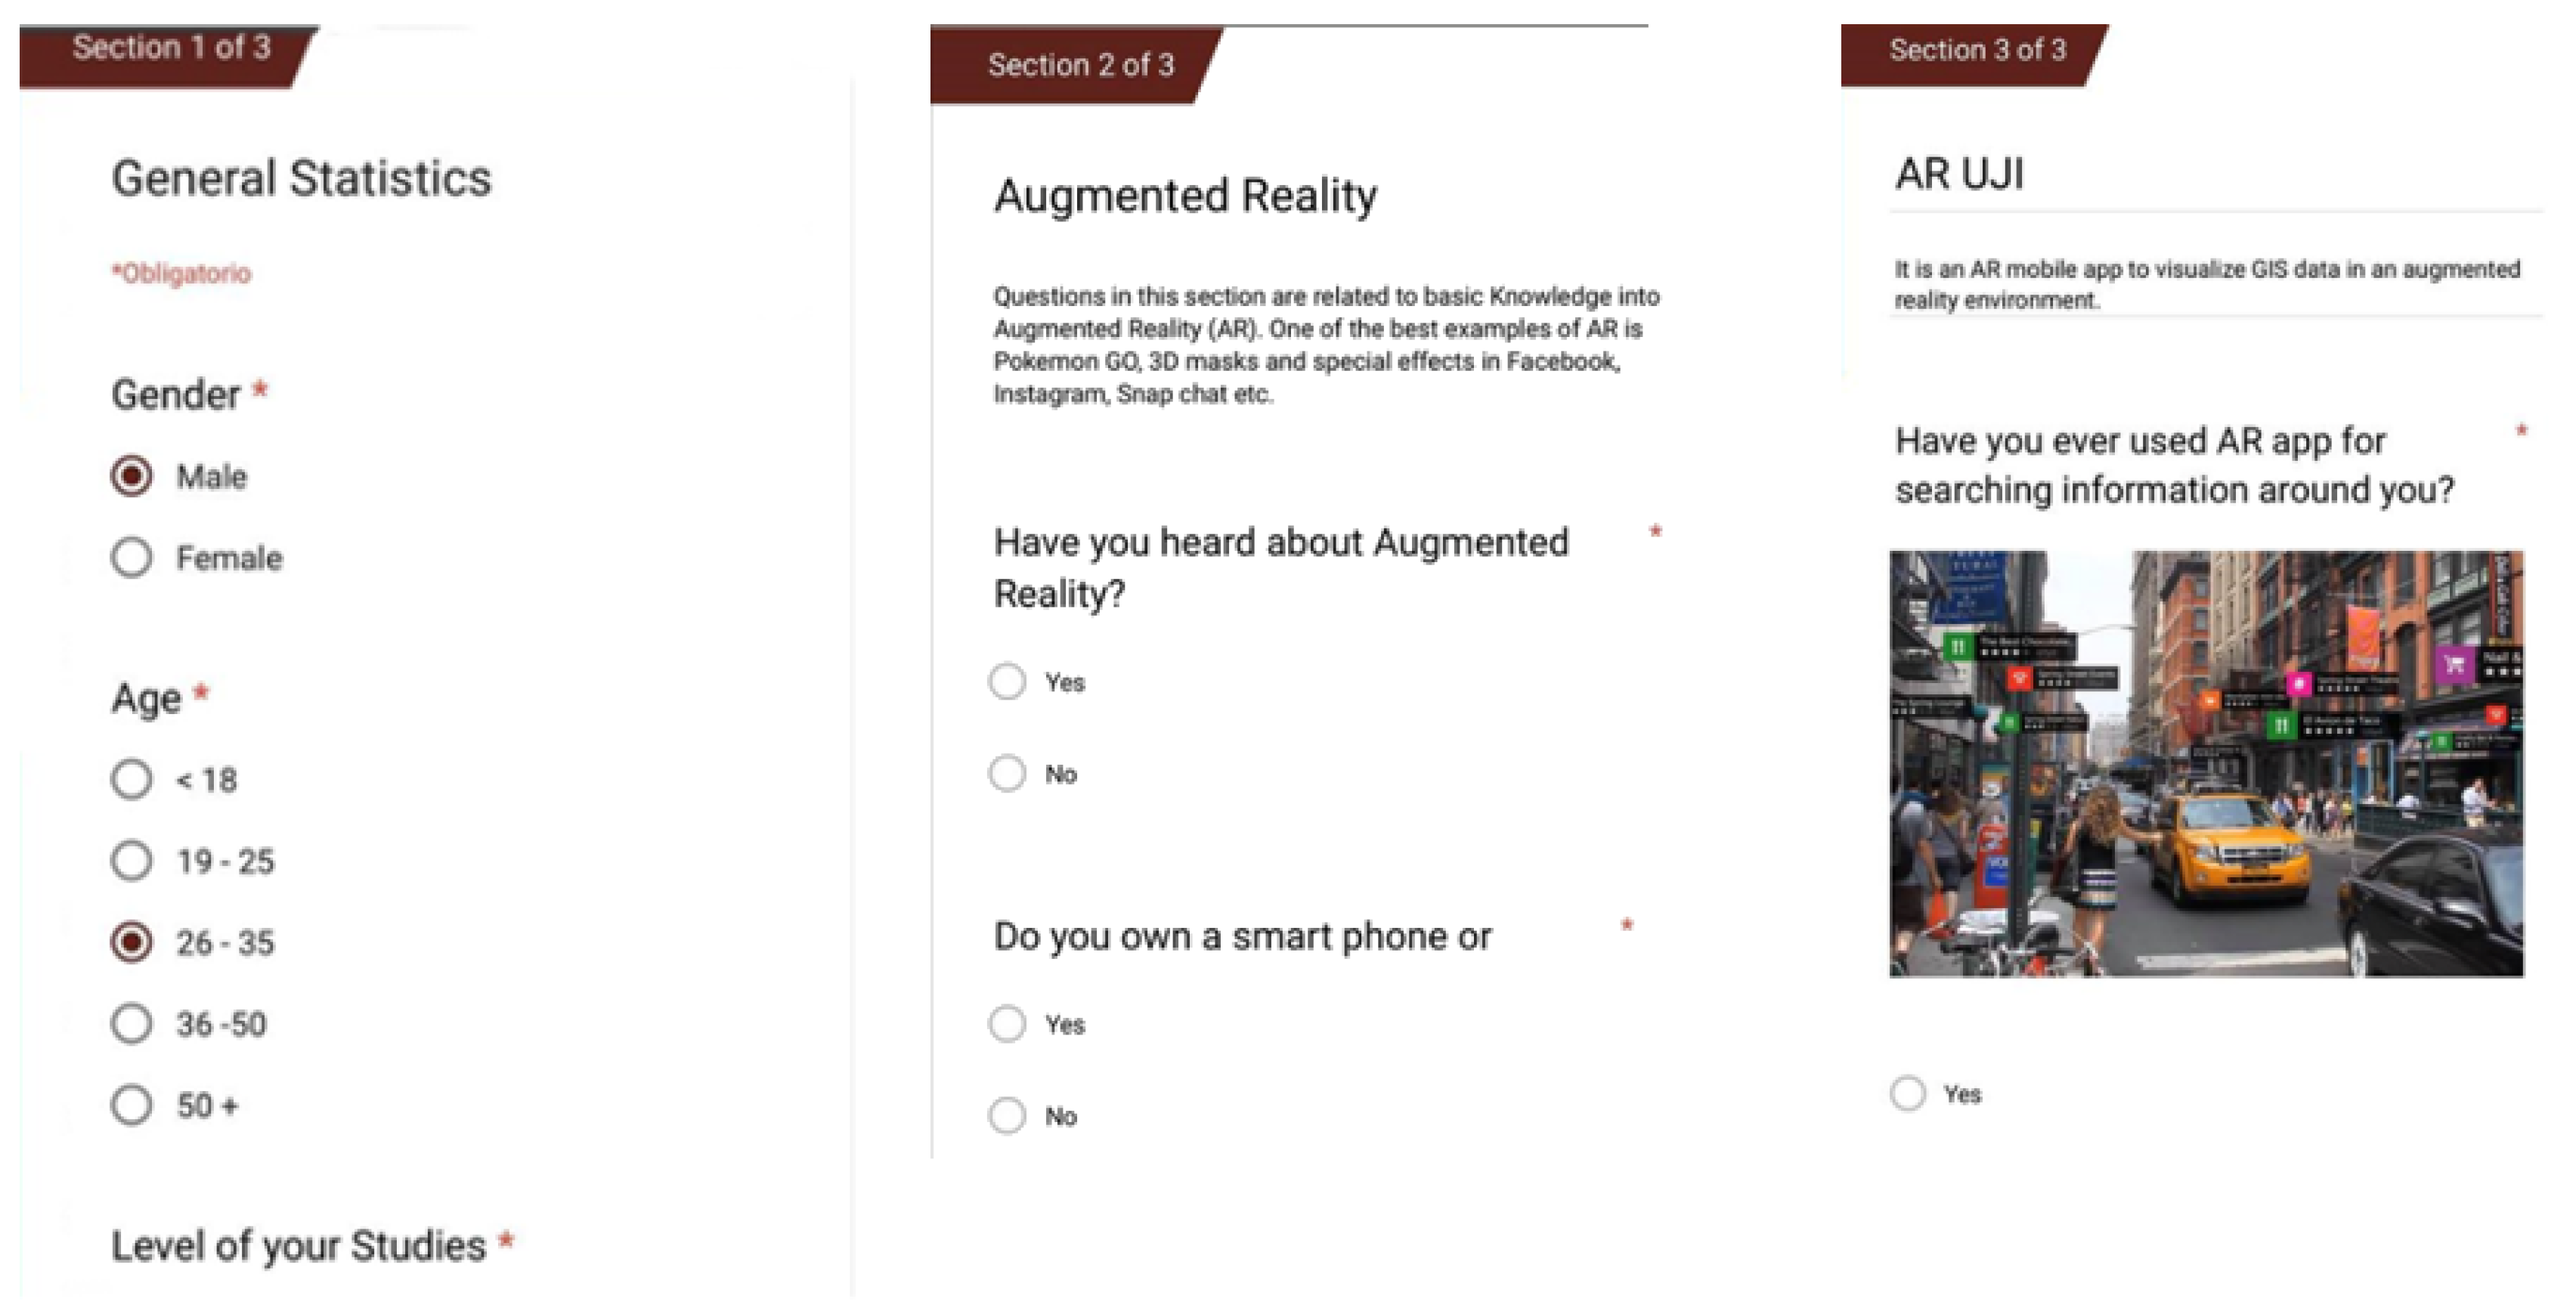
As a final request, the participants were asked to fill in the questionnaires for evaluation to measure the performance, usability, controllability, comfortability, clarity in information, helpfulness, and satisfaction in using the application (see
Figure 5). The questionnaire form was prepared with Google forms and presented to the users for their experiences using the ARUJI app. The questionnaires were developed using the 5 points Likert scale, for better understandability and the results can be easily quantifiable. The 5 points Likert scale was preferred as possible over a binary choice (Yes/No) or a 3 point Likert scale, as it provides the only direction rather than providing a level of perception. Also the 10 points Likert scale was not favorable for participants, creating difficulties in choosing the options giving insignificant results [
79]. The questionnaires are segmented into 3 phases as follows:
Demographic statistics: This section includes general questions related to the user such as age, gender, qualification, technology interest, and so on.
Knowledge about the AR technologies: This section of questionnaires is to measure user’s knowledge in these technologies and the existing apps being used by the users relating to these technologies.
Proposed AR app: This section includes questions related to the experience of the AR app developed for the experiment. Users are prompted with various questions regarding the easiness, difficulties, understanding, controls, information provided, discomforts and helpfulness of the proposed system.
5.2. Results
After the app ARUJI was developed for the Android platform, its performance, usability, effectiveness, and satisfaction were tested among some international students in UJI for a comprehensive and unbiased evaluation. The results were derived from the success and time required to complete the tasks, and from the responses to the questionnaires.
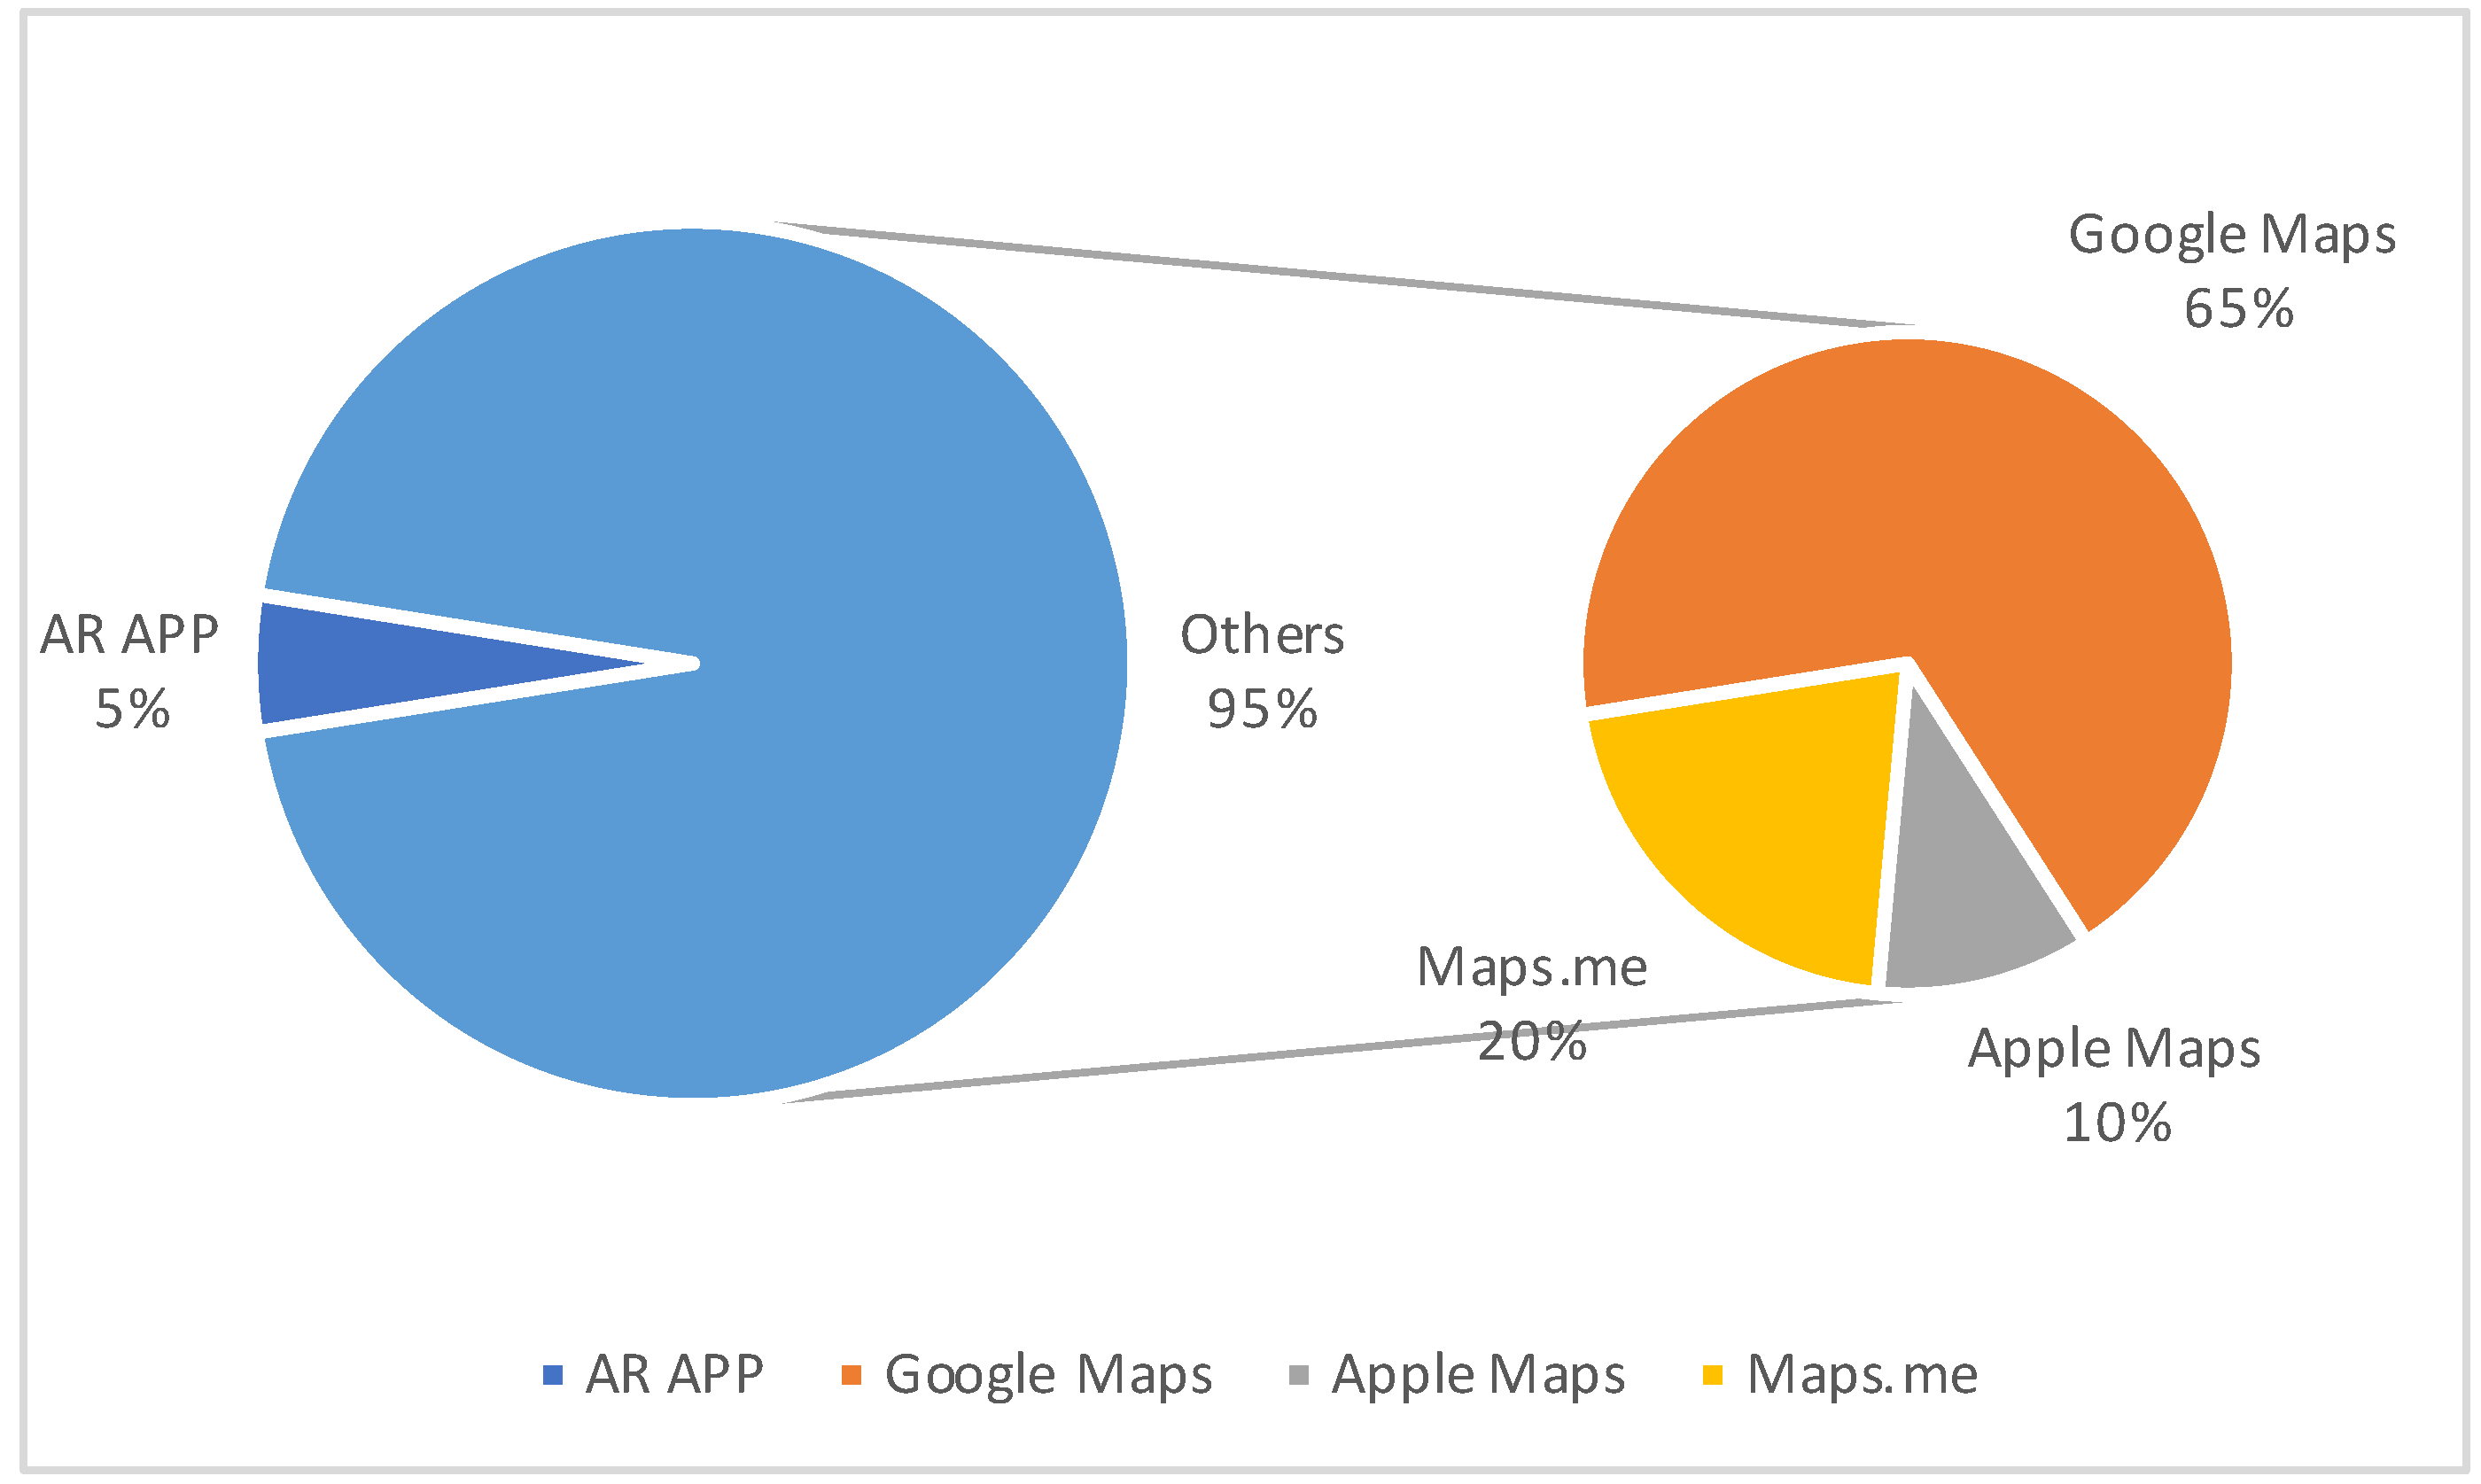
Almost all of the participants relied on 2D map based applications (like google maps, apple maps, and Maps.me) for searching and navigating around, with maximum adhering to Google Maps with 65% (See
Figure 6). Only a few participants have used AR for searching information.
It was also found that 95% of the participants never heard of AR applications similar to ARUJI, providing augmented reality solutions for searching places and information. Remaining 5% participants have used Google AR translate for translating languages on boards while searching for places. This portrays that there has been lack of knowledge about such AR applications, related to navigation and tour guide.
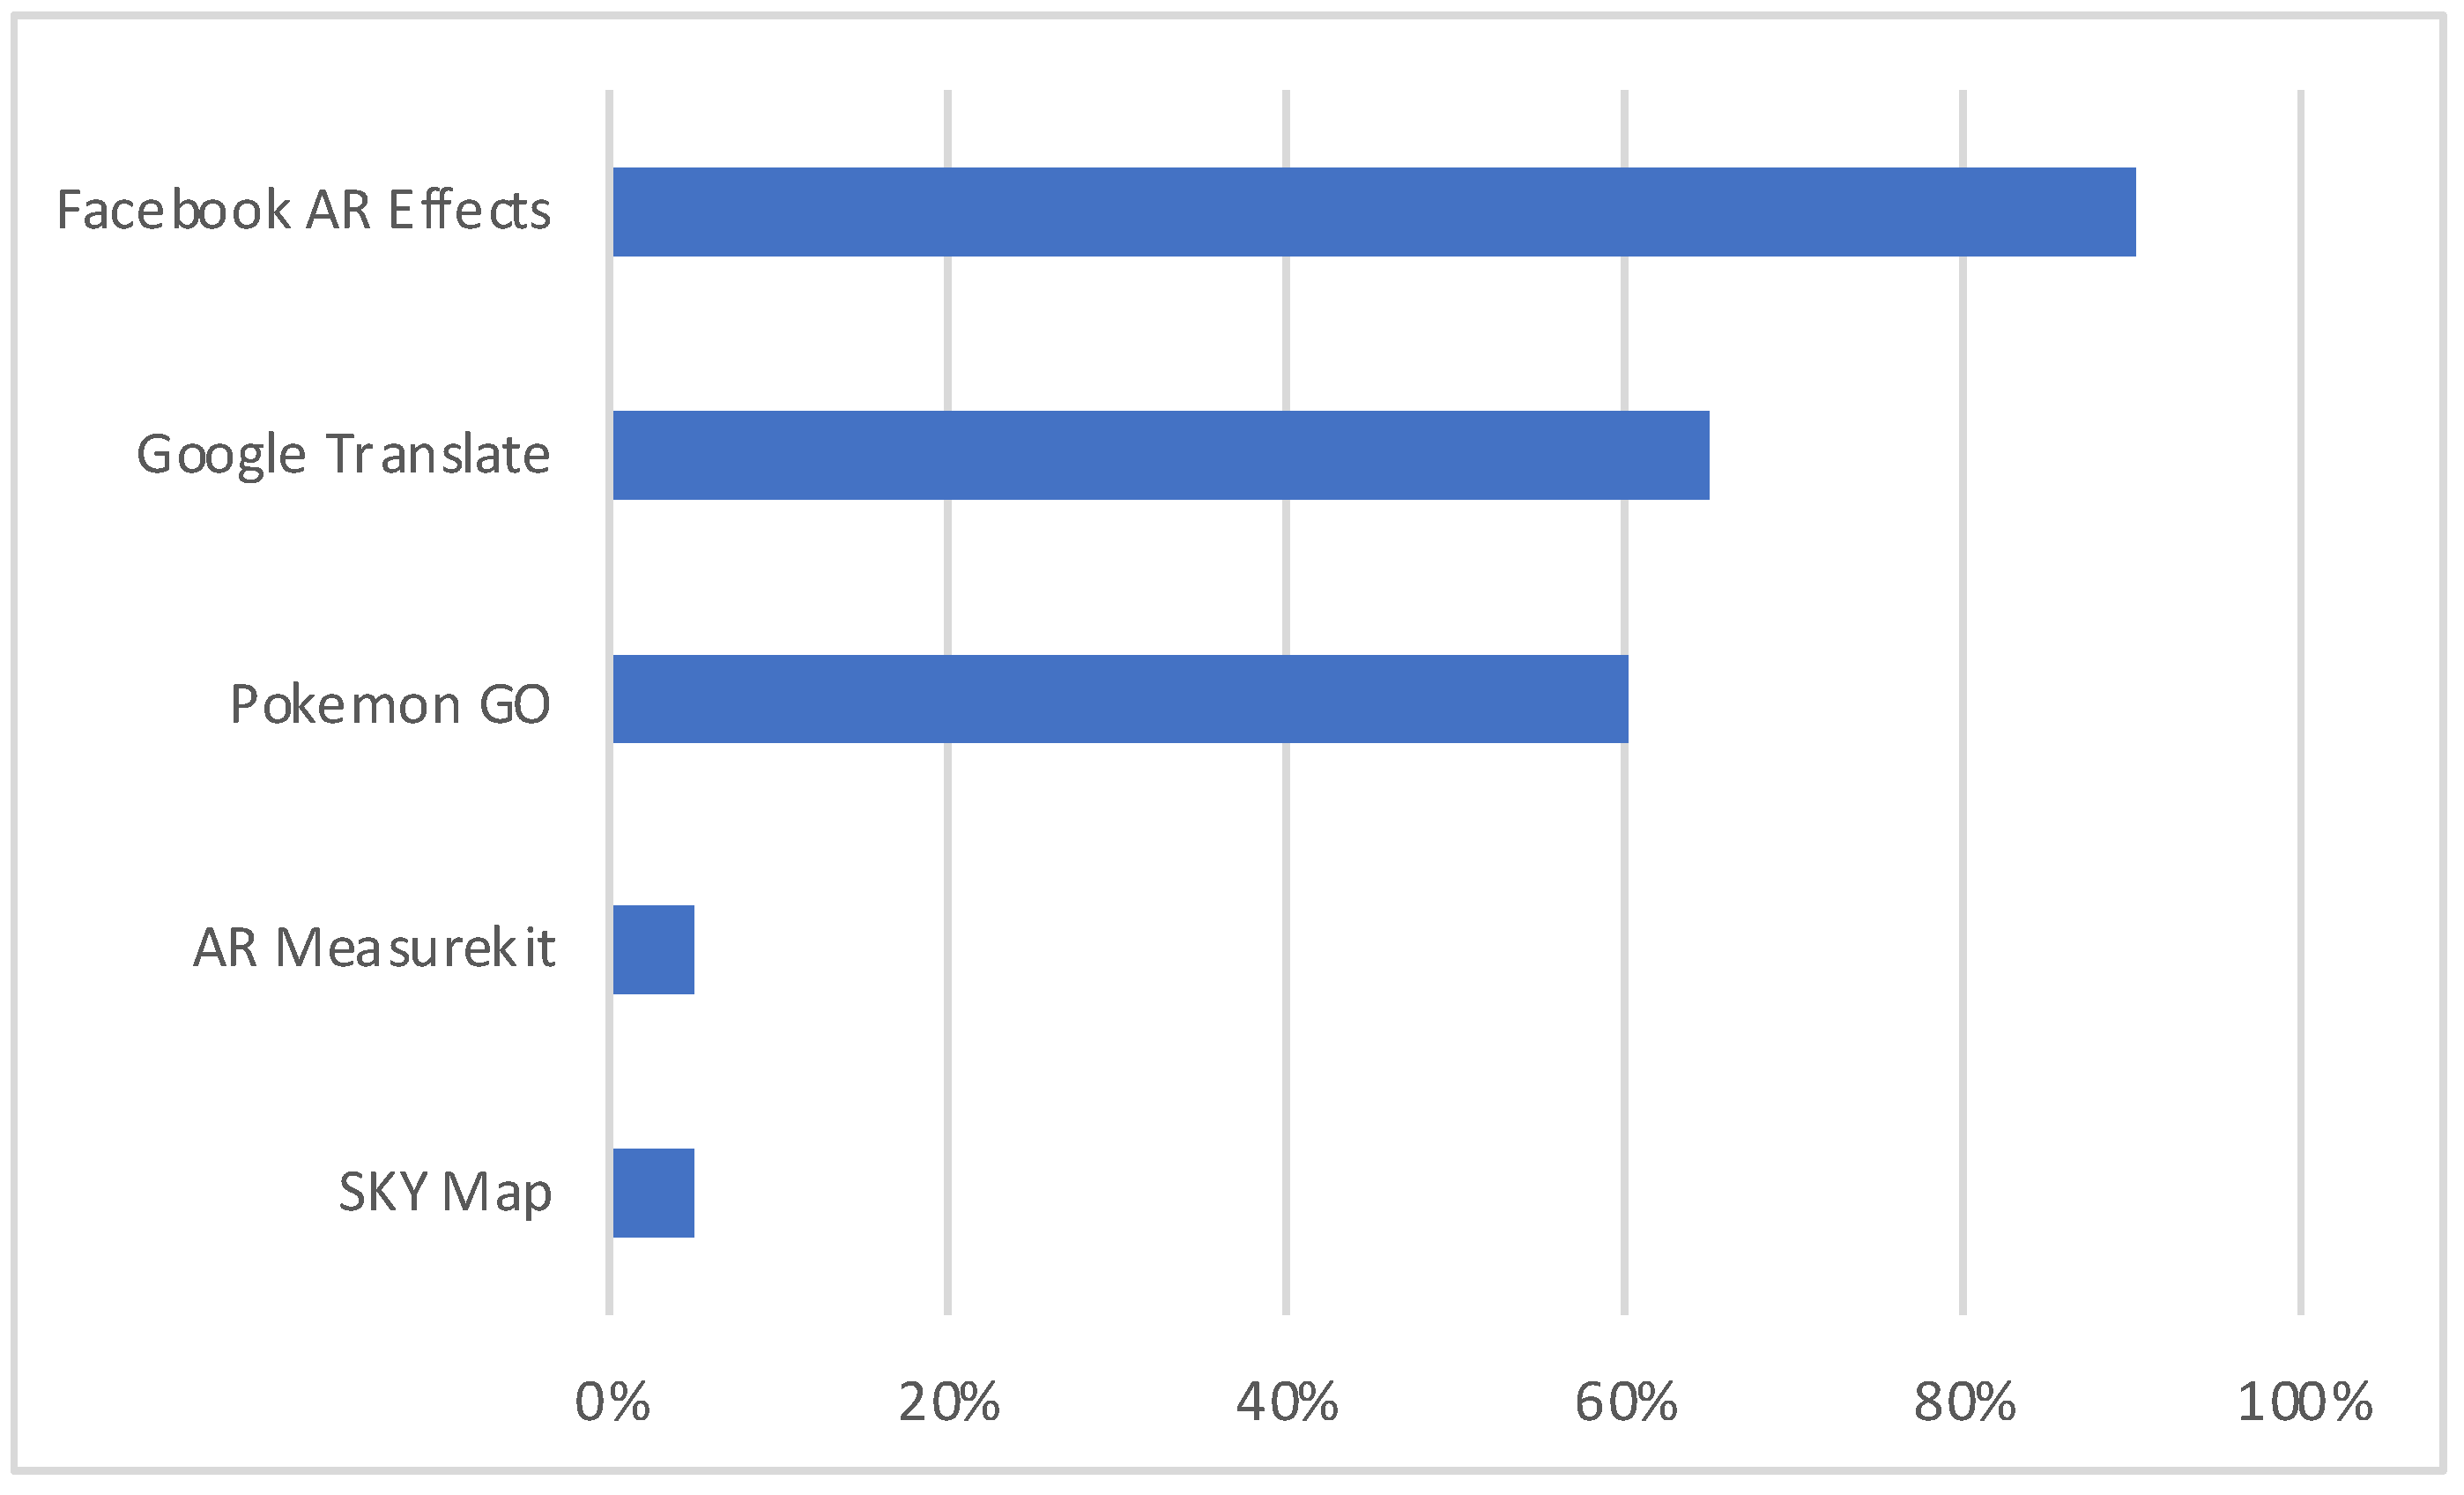
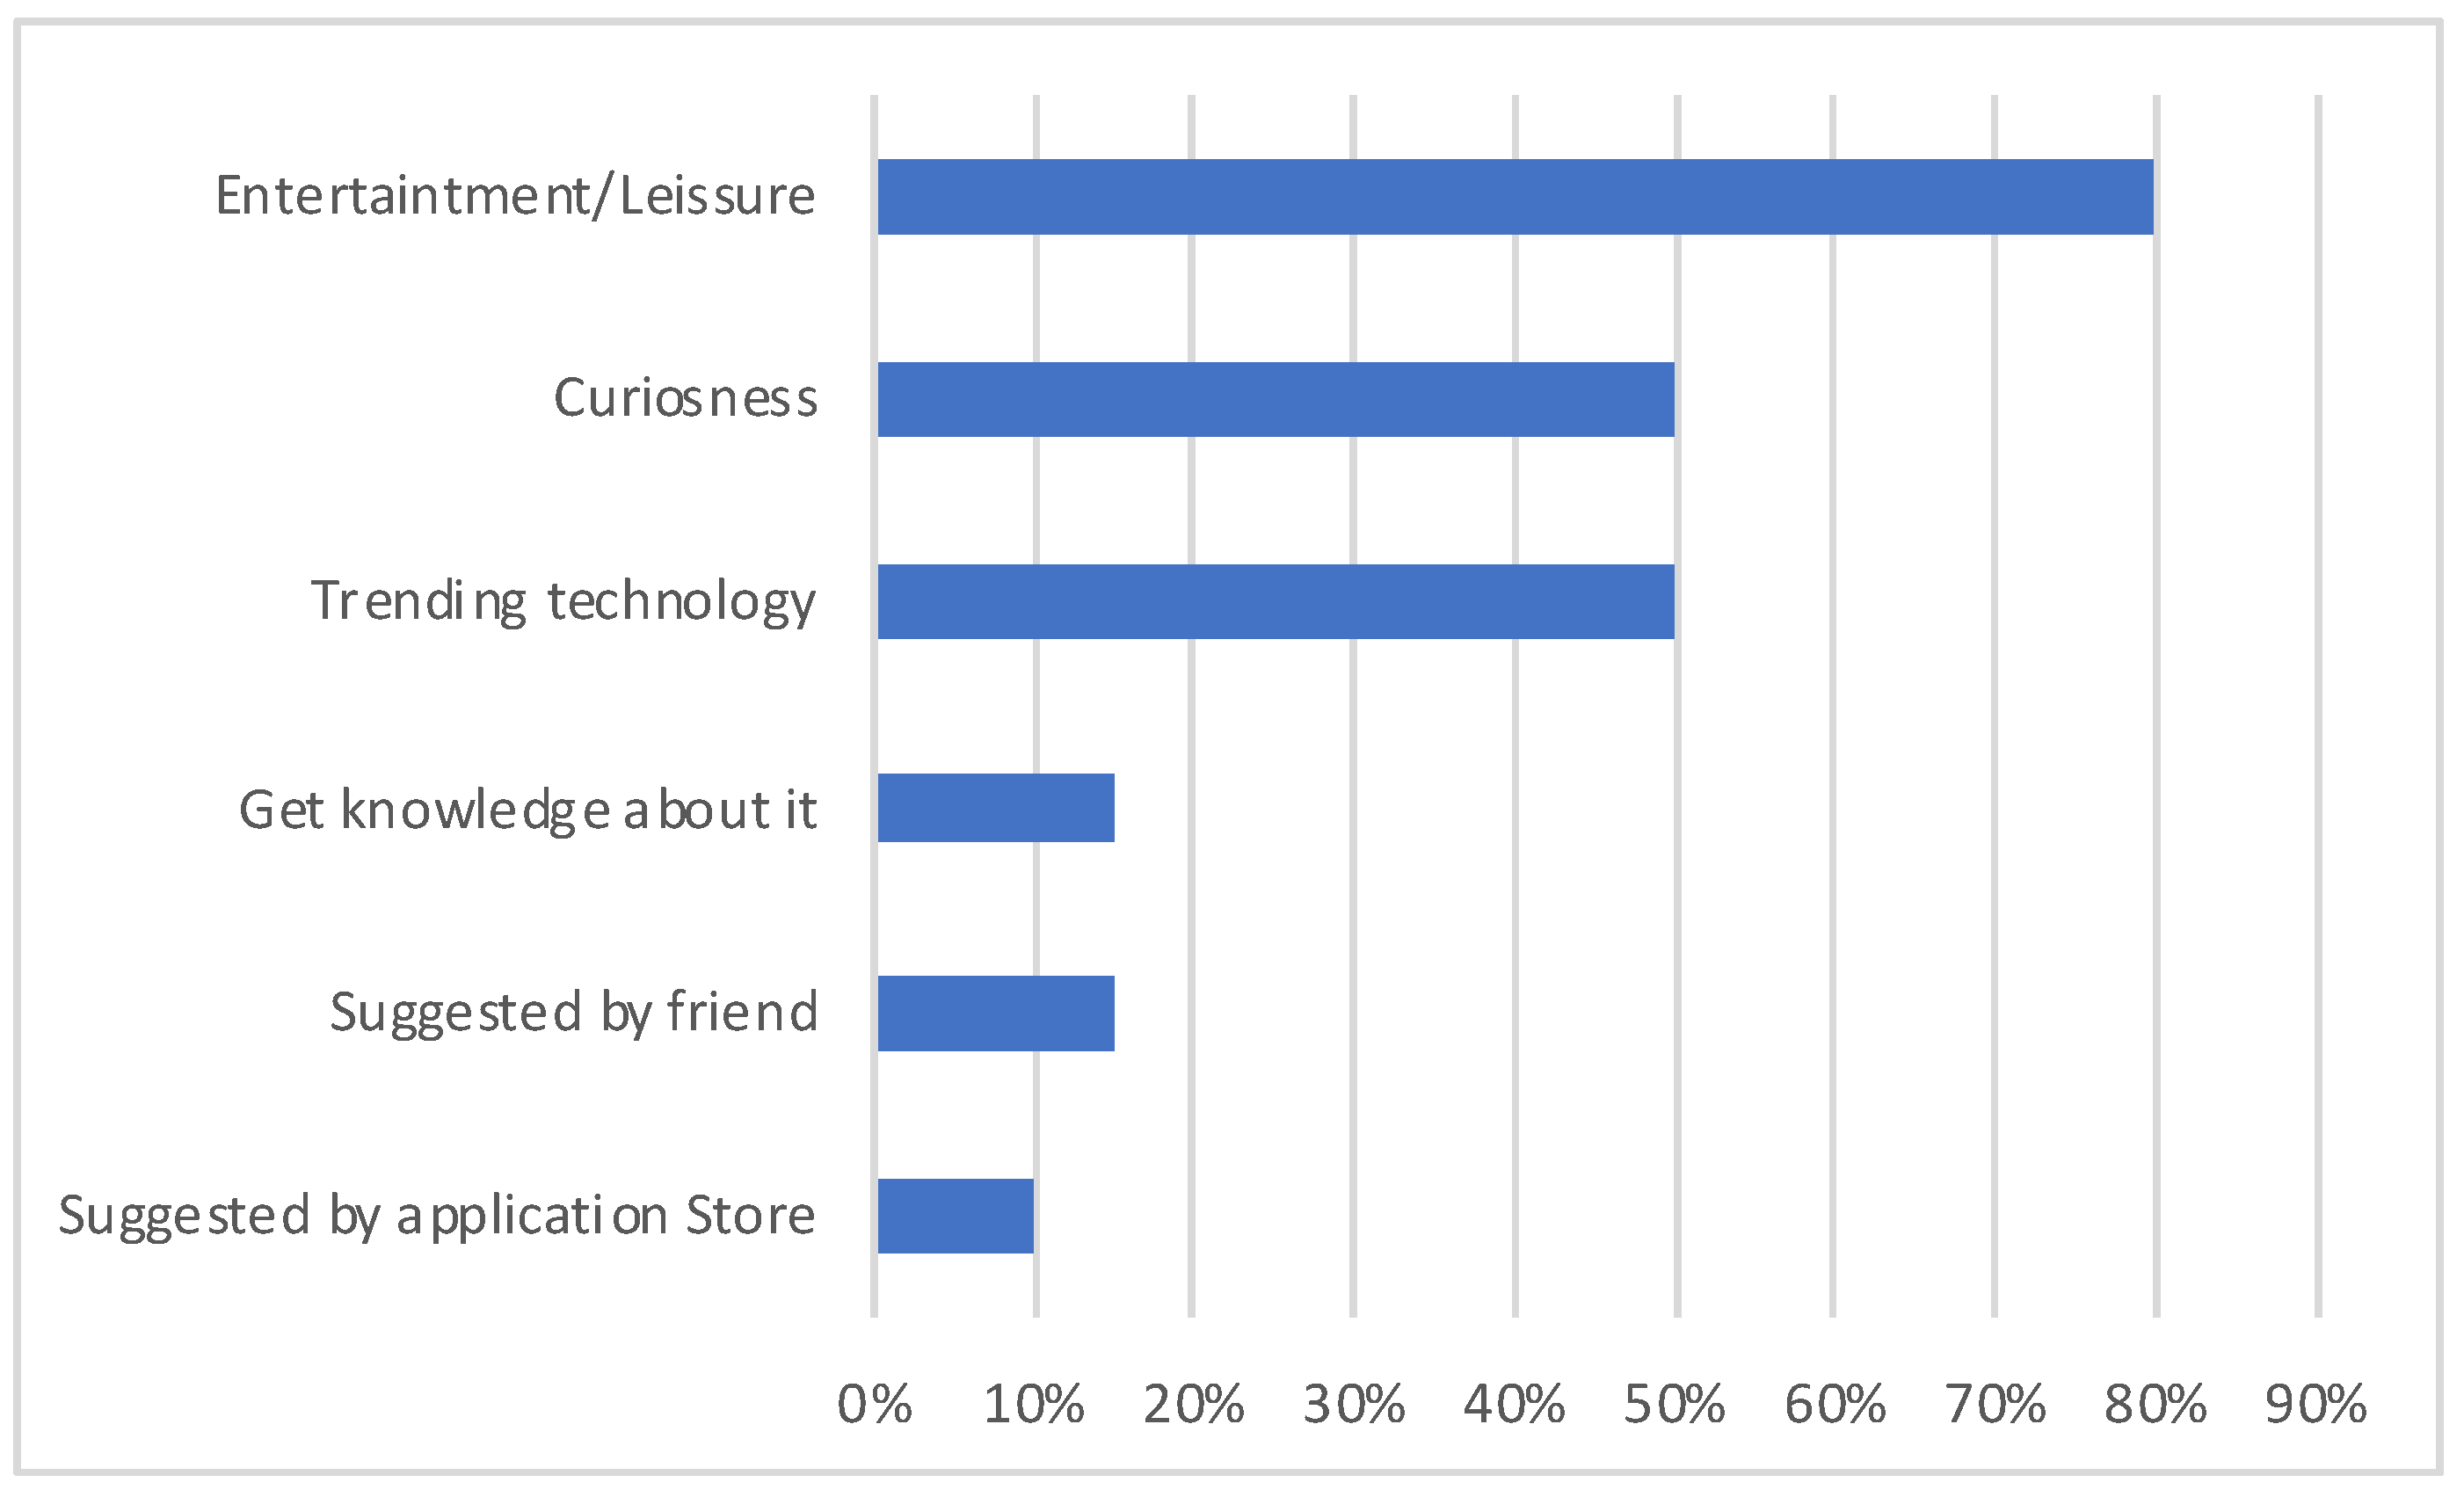
Figure 7 shows the graph of AR applications used in the past by the participants for general purpose (not only searching for places). The results show that the AR usages are mostly related to entertainment (Facebook AR Effects, Pokemon Go) and education (the world lens translations through the augmented reality feature in Google Translate) domain, which can be justified from the graph in
Figure 8, which shows the main reasons for using such AR app.
The main reason why the AR applications have been used in the past by the users was leisure and entertainment, with 80% of participants. The secondary reasons have been curiousness about the application or the technology, both with an affirmative answer from 50% of participants. It is possible that AR solutions have not yet been well presented in these scenarios in order to see its popularity in such sectors. The graph can further support these facts in
Figure 9, which shows the search trends in AR applications over the past few years. The search trends for AR apps had been in a decreasing trend for many years until it excited drastically after the lunch of Pokemon GO on July 6th, 2016, which remained for some months and declined to its previous state. However, the interest in AR apps can be seen increasingly progressive and picked up the pace after the release of ARKit for iOS and Google ARCore near the end of 2017.
It depicts the reason for non-interest in AR apps among users, due to lack of AR developing platforms and its support in mobile devices. The recent development in the AR sector with its support in mobile devices has led in the rise of interest in AR apps but is still limited to specific domains such as entertainment. According to some market studies, Pokemon Go, an AR game application generated revenue more considerable than the value of the entire VR software market in its first three months after its launch. Thus with the recent launches of ARKit and ARCore, 2018 will be a momentous year for AR technology, becoming a mainstream commercial application.
5.2.1. Assessment of Effectiveness
The effectiveness of the application measured from the successful completion of both the tasks (Task 1 & Task 2) in Map View and AR View was 100%. All the participants were able to complete the task without any problems. The participants found the ARView more effective in finding information and services of nearby surroundings more than the Map View, with some participants commenting AR View to be more fun and extraordinary experience in the map sector. The participants have valued, more the interface with information in the pop-ups providing better perceptions of the surrounding vicinity compared to that conveyed by Map View.
Table 4 below shows that almost every participant found AR View to be very much useful and helpful in locating services nearby. In particular, 14 subjects rated the effectiveness of the ARView compared to the map view with the highest rate, which is reflected in the highest possible value (5) as the median value.
5.2.2. Assessment of Efficiency
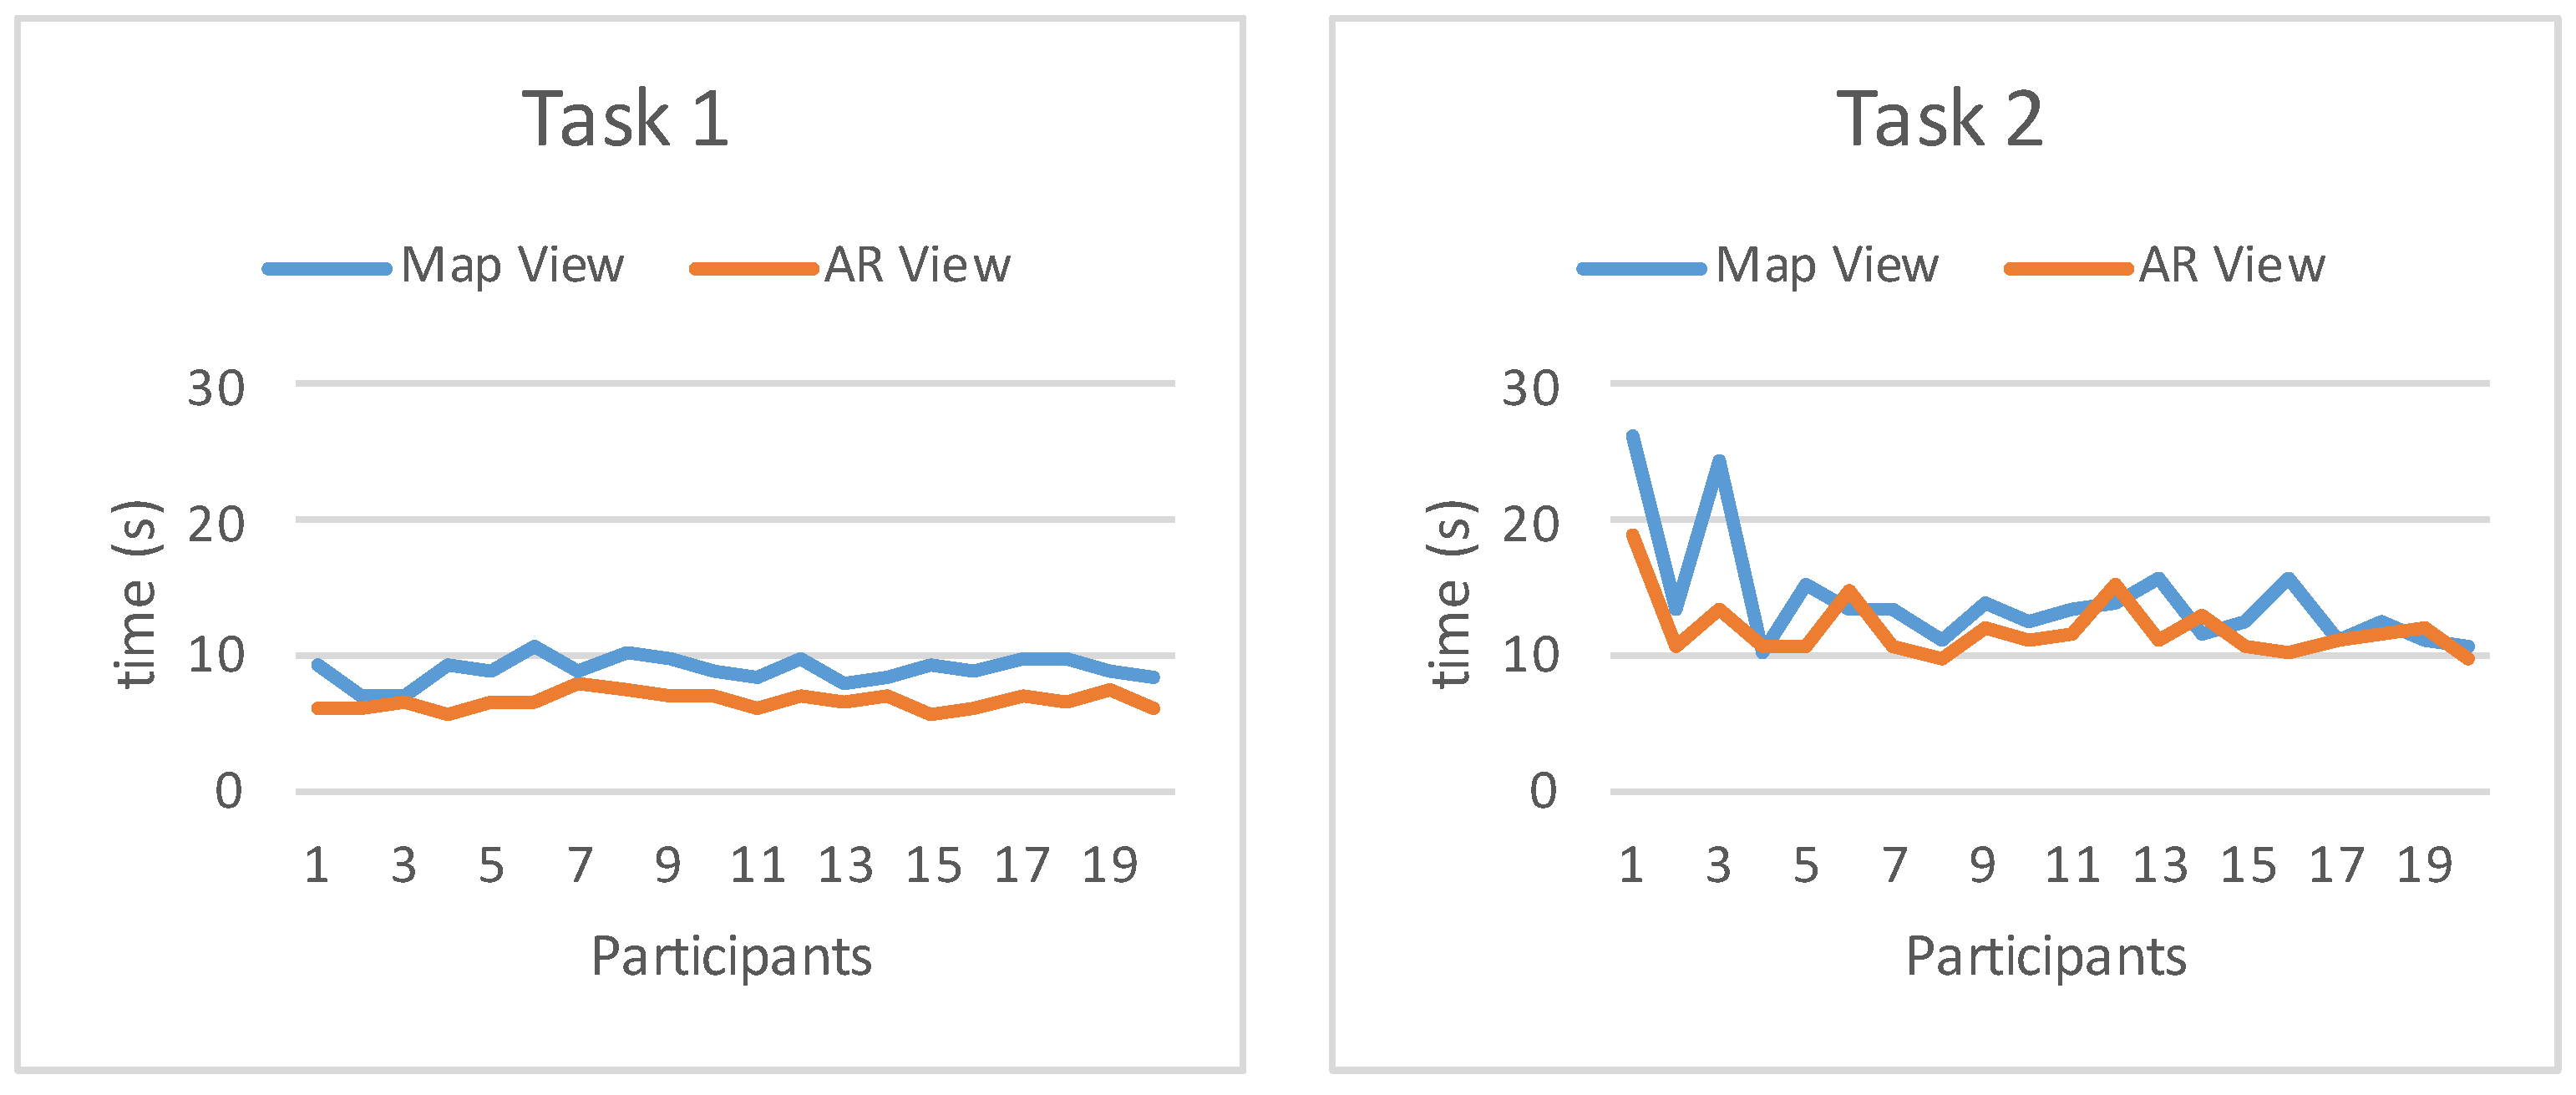
The time taken to complete the tasks using the Map View and AR View can be seen in the graph (
Figure 10) below. To ensure an independent test, 10 participants were randomly selected to perform the first search with the Map view, and the remaining 10 participants performed the first search with the AR view. For Task 1, it can be indubitably said that AR View is more efficient than the Map View. However, Task 2 illustrates few fluctuations where Map View proves more efficient. This is due to the nature of the task and users ability of fast reaction to the question. As it was observed during the experiment, for task 2, almost every participant was typing the sentences or words nearest
coffee shop,
coffee or
cafe, for finding the nearest cafeteria in the university. The efficacy in typing the correct keys and the concise keyword(s) might have been the reason behind the efficiency of Map View in some observations. The average time taken by AR View to complete both tasks is slightly less than that of the Map View. The difference in the completion of both task with AR view and Map View is around two secs (
Table 5). Hence, AR View is slightly efficient than the Map View in locating services around the surrounding area.
5.2.3. Satisfaction
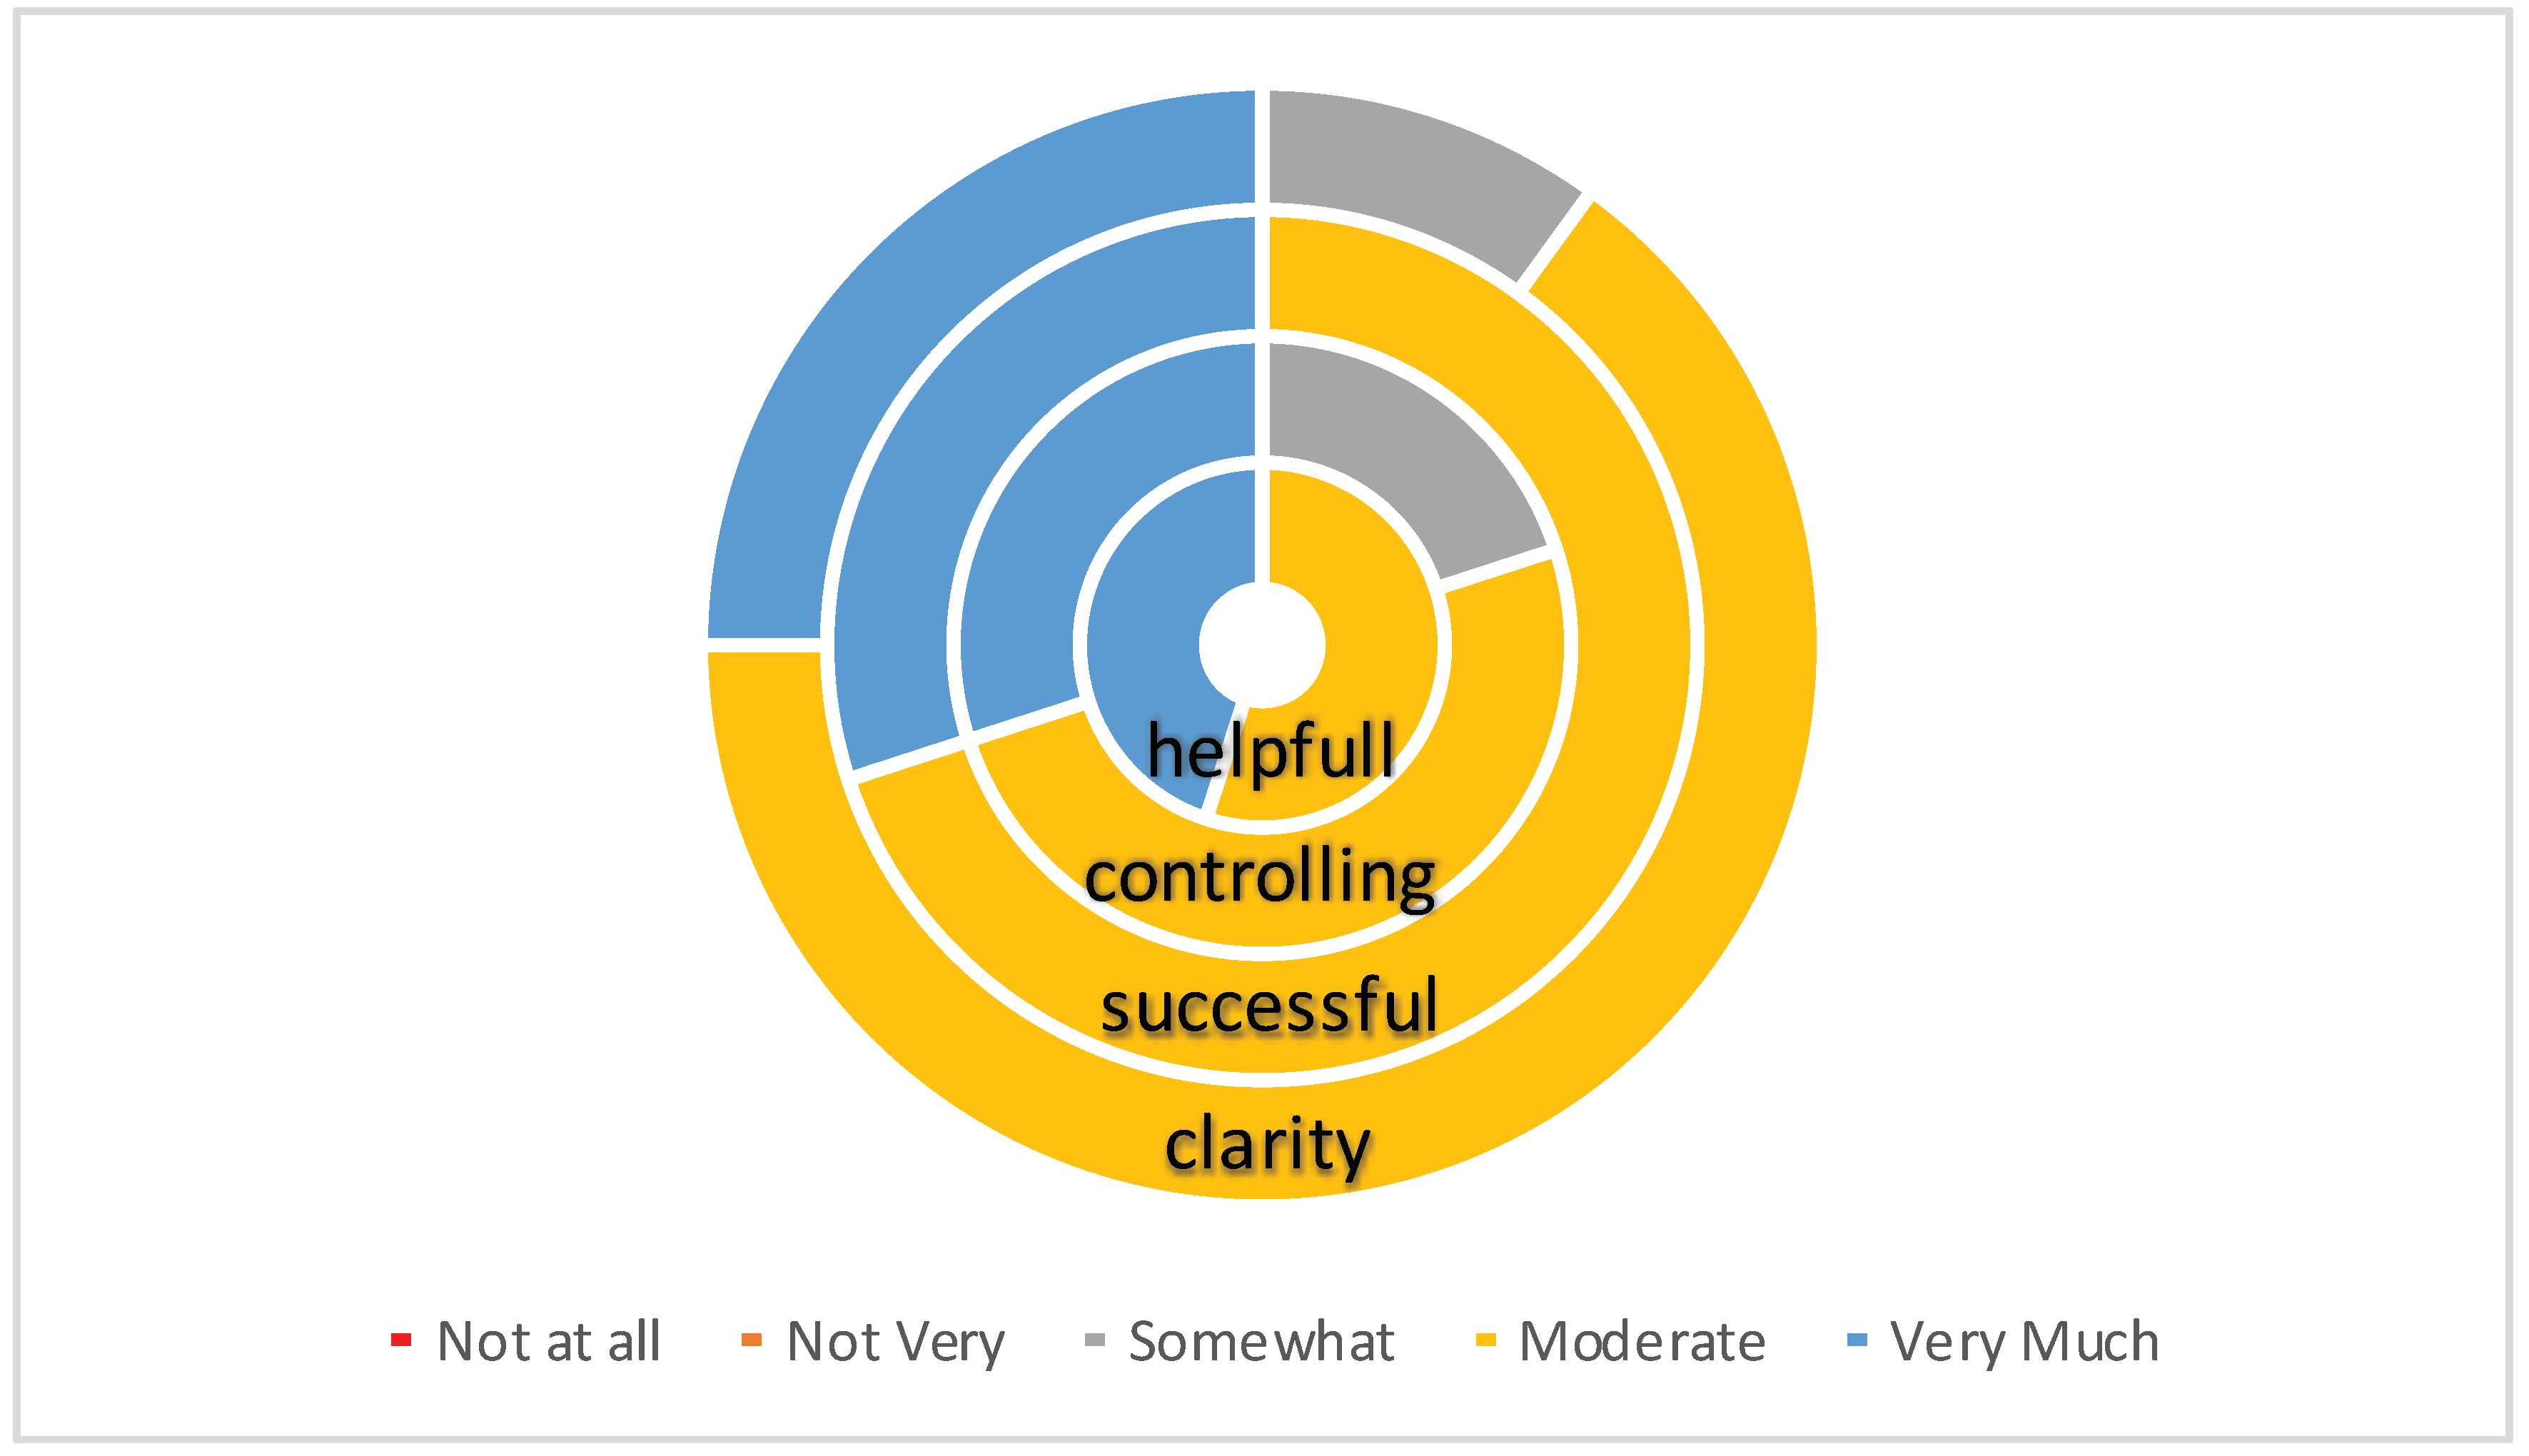
The satisfaction of the users was evaluated in two phase, indirectly and directly. Firstly, the participants were asked questions related to ease of use, controllability, clarity, and successful maneuver of the application that served as an indirect means of evaluating satisfaction.
In
Figure 11, we can see that almost all the participants are somewhat clear about the information displayed in the application, and able to control and successfully get information from the app, with minority of the participants i.e., 20% trying a bit hard in controlling and finding problem in clarity of the displayed information. This is mainly due to fast movement of the mobile and relatively slow processing of the mobile, which effects in the oscillations of the pop-ups causing difficulty in controlling the app. The secret to perfect control lies in the slow and steady handling of the mobile. The graph (
Figure 11) depicts that participants were able to complete the assigned task effectively where more than half participants are positive towards its usefulness, and the rest agrees it to be beneficial for searching places and services around. While using the application, the expression of the users was positive, and everyone was enjoying the application with satisfaction.
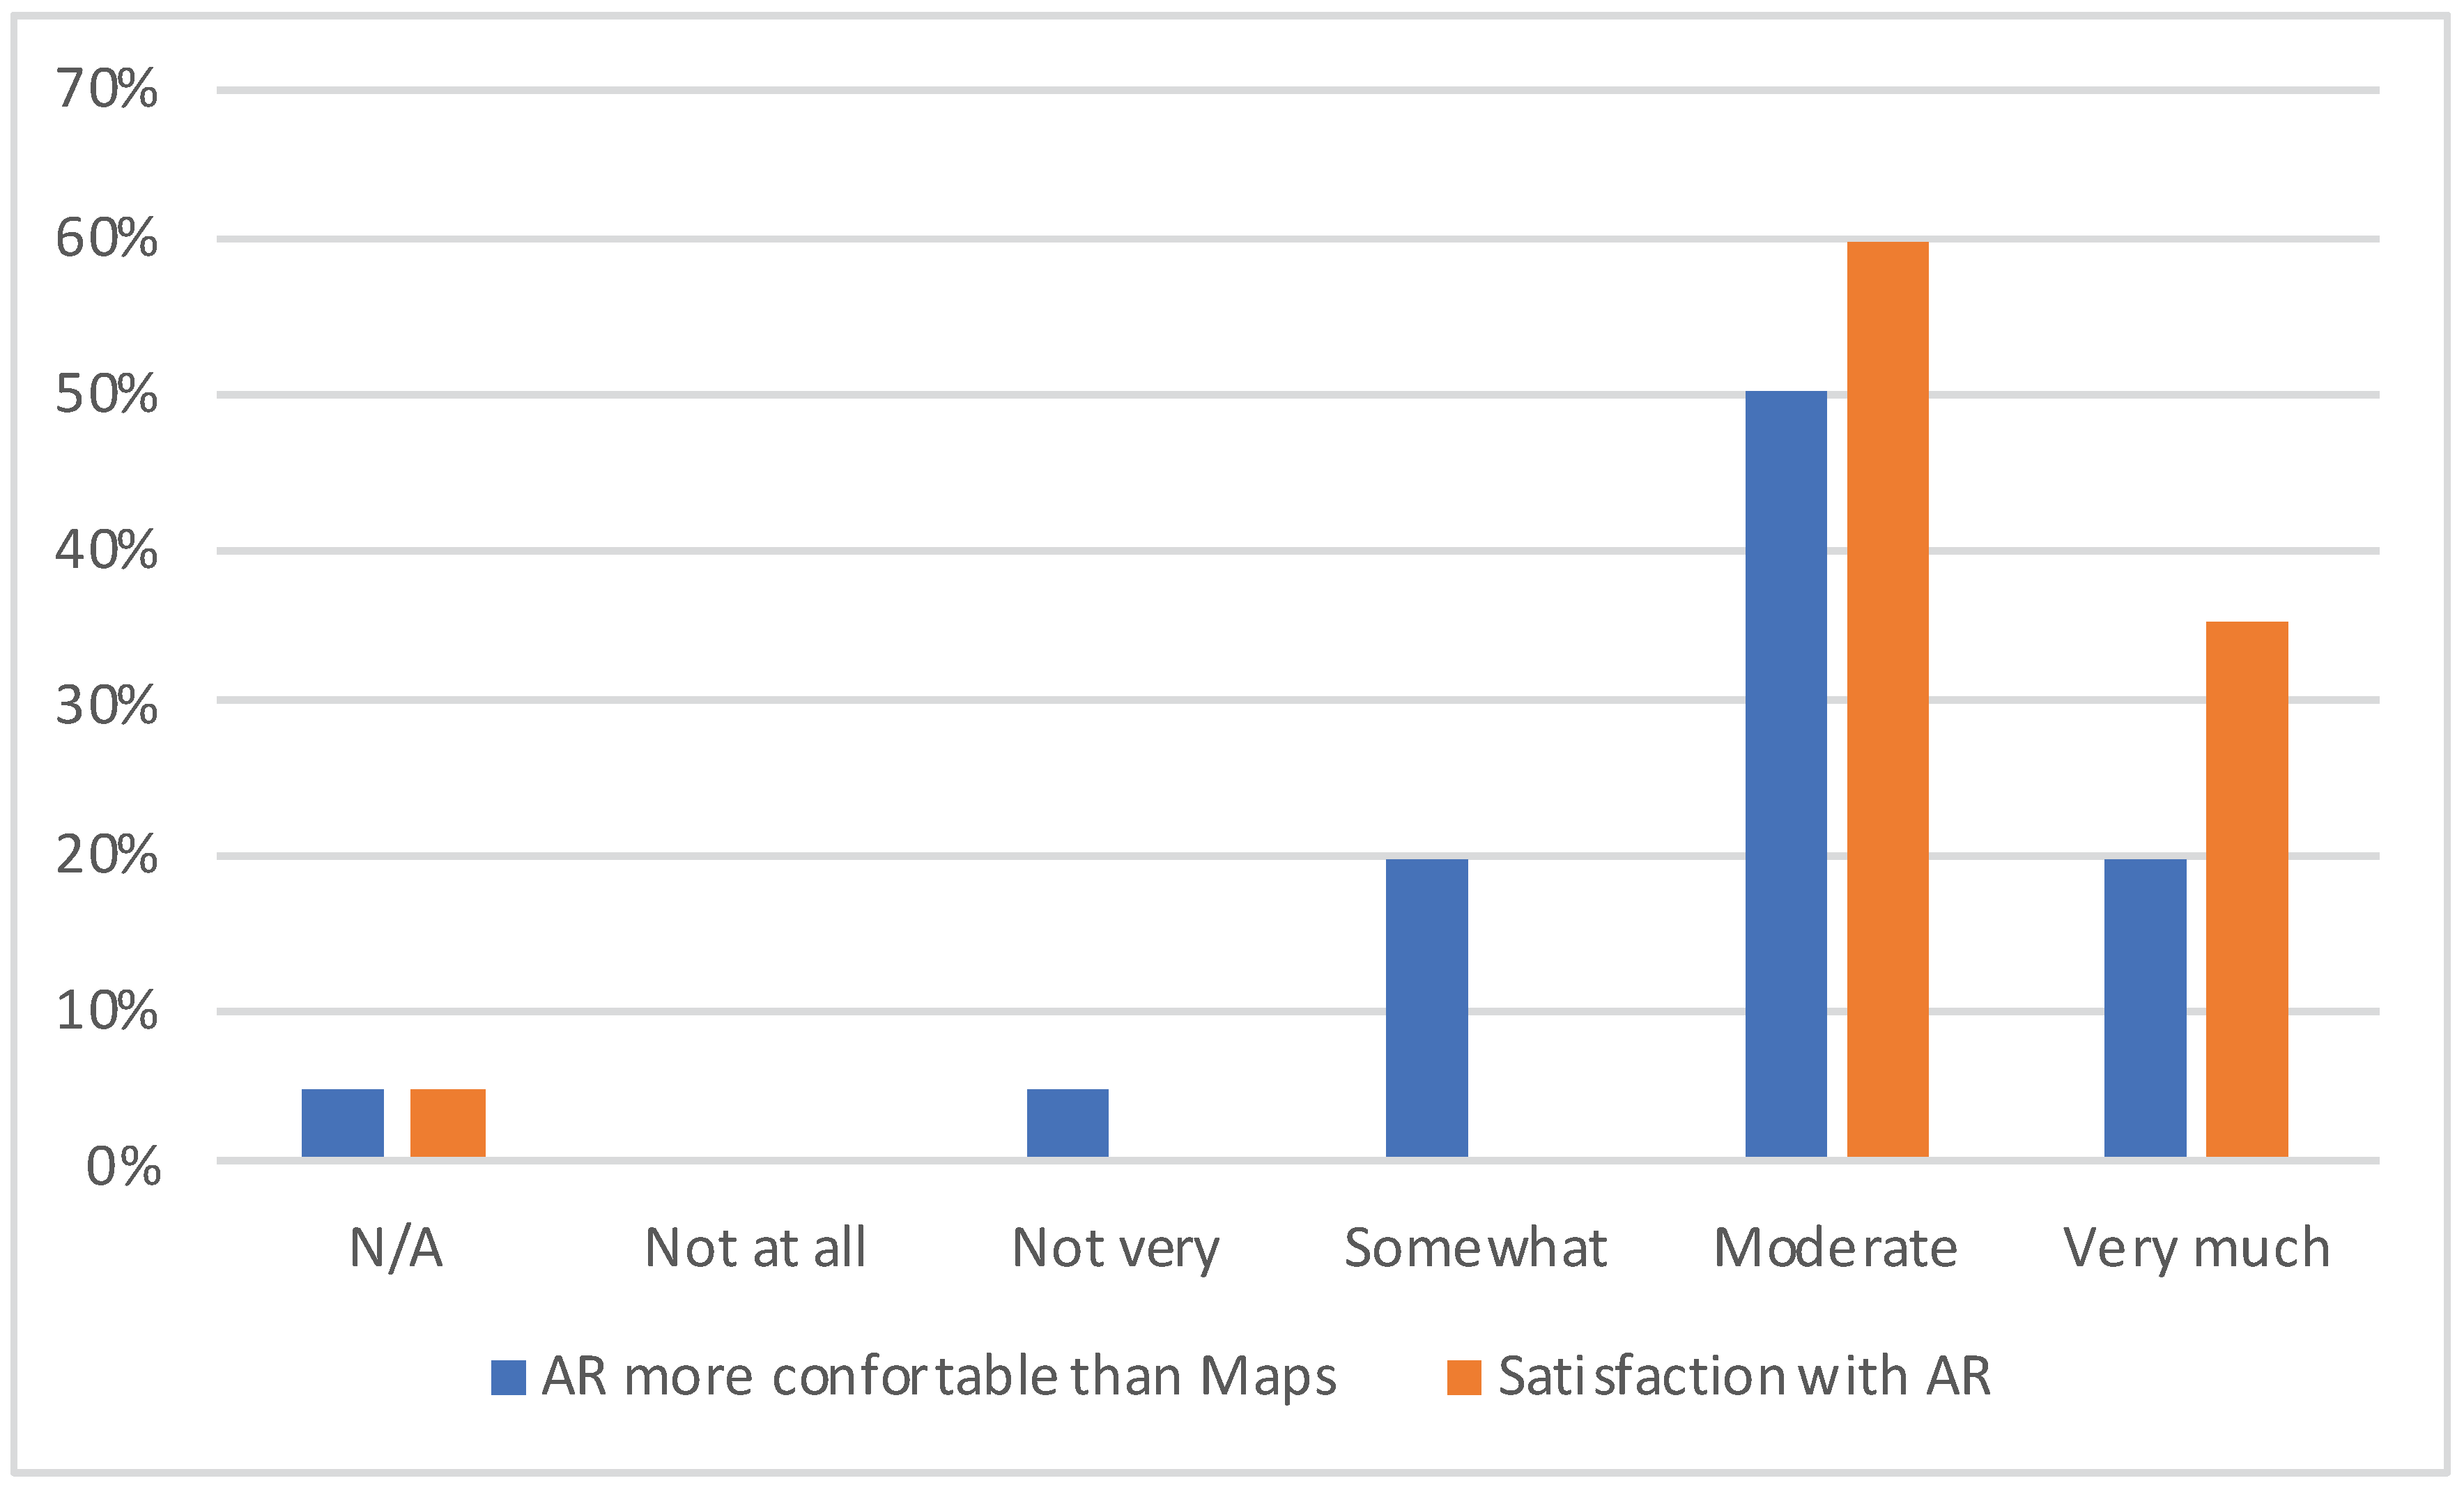
The second evaluation of users satisfaction involved more direct questionnaires related to comfortability and satisfaction in compared to Map View (see
Figure 12). With the proposed AR application acquiring information and finding a place around was more natural and more efficient than using the map-based application, and almost all of participants reported a moderate (60%) or high (35%) satisfaction with the ARUJI application (red bar). Only one person (5% of total participants) did not answer those two questions since it was not very familiar with AR applications. POIs are displayed as pins with interactive information through phone’s camera which is informative and beneficial in searching the place of interest around.
Furthermore, the blue bar chart in
Figure 12 shows that 75% of the students were comfortable using the proposed ARUJI app with no difficulties in controlling the app, with 20% being somewhat comfortable about its controllability, compared to their usual 2D apps. One participant (5% of total participants) explicitly answered that the AR application was not very comfortable compared to the map based one, and the participant (5% of total participants) who had never used AR applications did not answer this question. The reason behind is the frequent crashing of the application due to low memory space. Better the technical specification of the smartphone smoother the performance of the application. Students found the app to be more entertaining, informative, and efficient for searching information in the vicinity, with one-fourth participants willing to use the app for further searches and three fourth participants to use the app after slight updates and fixes (
Figure 13). Every participant was enjoying and perceiving information through the use of the AR app which depicts that there has been a lack of awareness about the real potential of AR apps.
6. Conclusions and Future Work
In this paper, we first studied the application of AR in different contexts, mainly focused on Smart Cities, which showed significant advances due to the use of AR as a visualisation tool besides to new challenges in this field. As a result, we identified new challenges in order to improve the user knowledge of nearby locations, an essential aspect in Smart City contexts.
According to these previous challenges, we specifically created and built a multiplatform mobile app by integrating AR components connected to GIS services, which led us to offer a location-based solution that was continuously improved by users feedback. As the last step, we analysed different features such as performance, usability, effectiveness and satisfaction of our mobile app. In summary, results show that, due to the limited knowledge of users about AR technology, they picked specific apps based on their popularity. On the other hand, tests showed that users purpose are leisure and entertainment. Moreover, we demonstrate a better performance when compared to typical 2D mapping apps in some specific tasks.
As a Future work, a within-group design and quantitative methods such as in-depth interviews and observations can be implemented to get more statistically and intriguing results, since the findings are based on self-reported data. Also, the study was only focused on international students. However, during the debriefing session, it was noticed that other students were equally in need of such applications, as mostly relied on the perspective drawing of the University for searching departments and location of classes. At times, the occlusion problems lingered, where the facilities were close to each other, despite defining less distance for displaying data. More works can be done on self-adjusting popups for minimizing the occlusion problems in future work. The application is supported only in Android devices, which can be extended to work with iOS and windows mobile. Besides, an extra social media feature like rating the POI can be integrated into the app for recommendations to other users making it more interactive. More work can be done on AR navigation replacing the same old 2D navigation system, to provide full AR experience to the users. Nevertheless, the ARUJI app is only supported inside the periphery of the university, which can be further extended to the city in the future. Finally, another future step in our roadmap is to offer an open-source solution, to achieve that, there are some AR libraries, like ARToolKit, AR.js or Android ARCore and we can use to load feature layers created by Quantum GIS.

 ,
, 


