1. Introduction
Governments, think-tanks, commercial organisations, and consultancies invest substantial resources and expertise in technology forecasting, but it remains a highly imprecise process. On which technologies should a government focus its research budgets? How might technological change result in the need for major or long lead-time infrastructure changes? Where will the technical and commercial challenges to an established market leader come from? What technology developments might become a threat to the defence or security of a nation and how might a government mitigate against such threats? There is an element of both corporate and inter-nation competition, with different countries taking the lead within certain technologies, and potentially gaining significant advantage from disruption compared with other incumbents. Meanwhile, specific commercial innovation centres, such as Silicon Valley, cultivate different specialisms of disruptive technology. Geography, and specifically the spatial concentration of knowledge for a given innovation, are also significant to disruption (Martin, 2015 [
1]; Nathan and Vandore, 2014 [
2]; Schmidt, 2015 [
3]).
Many studies of technology consist of future predictions of a single or small set of most probable outcomes and can have significant influence on Government investment strategies. Yet they have a poor track record of successfully defining future outcomes. There is a highly respected body of literature from economic and business process modellers which questions whether it is possible. For example, both Christensen (1997) [
4] and the National Research Council (NRC) Working Group on Persistent Forecasting of Disruptive Technologies (2009, 2010) [
5,
6] argue that the stochastic nature of factors influencing development and the exploitation of new technology makes effective forecasting impossible. However, others (for example, Arthur, 1994) [
7] acknowledge the seemingly random nature of problems and unpredictability of outcomes at the early stage of evolution of a new technology but argue that unpredictable and external influences induce a process known as path dependency whereby the later stages of evolution become locked-in and increasingly deterministic.
Accepting Arthur’s view of technology evolution, the challenge becomes one of being able to monitor and measure this transition from randomness to determinism in as timely a manner as possible, or even know when the state is transitioning. So doing might enable public policy makers and commercial organizations to incrementally reduce the envelope of uncertainty and increasingly narrow their focus for policy intervention or investment and plan for the consequences of an emerging technology outcome from the earliest possible time. The financial and wider benefits that may result from earlier identification of the winning outcome from the disruption could provide significant commercial advantage.
There is also a geographic element to the potential disruption; it may be possible to predict the progression of disruption in one geographic region by looking at indicators (retrospectively) in another which has already been disrupted (exploiting the footprint of existing information on the disruption). An example of how this might be done in practice is developed in part 4 and 5 of the paper. It is the pursuit of the objective of assessing potential disruption, and its likely geographic and temporal scope that is the subject of this paper. The proposition is that a big data approach could be applied to technology disruption forecasting, and this paper takes some initial steps to establish to what degree this is possible in practice.
The remainder of the paper is divided into five parts and is organized as follows. part 2 reviews models of technology structure and change focusing on the work of Christensen and Arthur as overarching concepts, and drawing-in specific work from other researchers to support a more detailed unified model. part 3 discusses the development of an overall model of technology composition including considering both time and space as variables. To provide a consolidated model of technology growth against which technology progress can be assessed there is a need to try and capture key elements of the various proponent’s models described above and provide an integrated conceptual framework for measurement. part 4 considers the characterization of technology change; that is, the extent to which it can be modelled, and the range of technological outcomes be narrowed, making policy intervention or further research and development more informed. It examines the proposition that early indicators are potentially possible because of the unprecedented level of information available via the Internet and the availability of big data analytics. It outlines an initial experiment to demonstrate the idea of indicators and proposes an initial experimental architecture to do this. part 5 presents a case study (Uber) looking at the evolution of the smartphone platform and how it then supports a disruptive application. It looks specifically at the aspect of platform establishment and then the resulting disruption, in this case played out geographically. Part 6 exploits this case study to describe an experiment and its results in measuring disruptive application deployment geographically over time and its correlation with smartphone deployment. part 7 concludes the paper, summarizing the various models of technology progression and considers the next steps in developing a broader set of indicators of likely technology progression.
2. Understanding Technology Change
In two reports on the Persistent Forecasting of Disruptive Technologies (2009, 2010) [
5,
6]. The US National Research Council assessed the landscape of technology forecasting, summarizing the main theoretical approaches in this field. Whilst it identified potential analytical tools, no significant level of experimentation was noted. At the time the Internet did not provide pervasive data and big data tools were embryonic. Almost a decade later, this paper reports new research which addresses the issue of forecasting from different perspectives and then considers potential measurement approaches.
We present an approach which incorporates a range of measures to give an integrated and automated index of technology progression. The approach draws on two key theories, Arthur’s model of technology’s structure (2009) [
7] and Christensen’s model (1997) [
4] of dynamic behaviour in technology related markets. It is underpinned with the work of Mazzucato (2015) [
8] on the foundational role of government institutions in supporting disruptive technology evolution, of Arthur (1994) [
9] on path dependence, Mokyr (2016) [
10] on ‘tinkering’, and an emerging body of work on the economic role of digital platforms (for example, Langley and Leyshon (2017) [
11], Srnicek (2017) [
12] and McAffe and Brynjolsson, (2017) [
13]. Work from Martin (2005) [
1] suggests the geographic aspects of knowledge development. Lastly the model draws on under-pinning practical approaches to measuring technology progression including approaches drawn from the big data domain. Christensen’s theories have seen significant criticism over the past decade, most recently Lepore (2014) [
14], arguing his characterizations are too simplistic and not representative of real situations, albeit that at a macro level his key concepts are useful.
2.1. Technology Anatomy and Ecosystems
Arthur (2009) [
7] describes technology’s anatomy and ecosystem offering some general unifying concepts. He classifies technologies as follows: fundamental, based on their defining physical properties, compositions (domain clusters) of other technologies and, lastly, supporting (enabling other technologies to succeed). Arthur suggests key technologies characterise a design approach/viewpoint, and describes an ecosystem of producers (academia, government, industry) and consumers. We formalise Arthur’s concepts in information theory terms, as well as integrating key concepts in the other research. This enables the definition of a machine describable model and consideration of how it might be populated. Arthur suggests that as technology develops it drives a set of support tools, ways of thinking, and a form of grammar and expertise which reinforce a specific set of approaches in line with the technology’s capabilities. Institutions and corporations develop around a technology to deliver the skills and capability to support it. These aspects of Arthur’s description of technology provide a structural model which could be used to capture the state of technologies and is used in this paper to provide a potential framework for technology assessment. Disruption by a new technology typically results in not only the technology being replaced, but also the skills, ways of working and competitive advantage for specific organisations also becoming obsolete (a process particularly addressed by Christensen). Arthur’s macro-model of the technology ecosystem is explored in greater depth in part 3.
2.2. Business Models
Formative work on technological change by Christensen (Bower and Christensen, 1995) [
15], in the form of
The Innovator’s Dilemma (1997) [
4] and
The Innovator’s Solution (2002) [
16] identified two forms of technology evolution: sustaining and disruptive. Sustaining technologies are well understood by those using them and typically evolve slowly, developing on an incremental basis. Each stage provides a better version of the technology. A typical example is the development of the internal combustion engine which has been continually refined. Disruptive technologies, meanwhile, are initially characterised by significant limitations compared with existing technologies but have the potential for dramatic improvements in efficiency, cost reduction or other highly significant benefits. Electric cars, for example, currently are expensive, have a short range and require long charging times due to battery limitations. But once these issues are resolved they are likely to be cleaner, more efficient, and due to inherent simplicity (at least at a purely mechanical level), more cost effective.
Disruptive technologies often favour the newcomer over the incumbent, resulting in the displacement of existing organisations or ways of working. Christensen identifies the example of IBM (the mainframe computer manufacturer) being displaced from the 1970s by Digital Equipment Corporation (DEC) with new mini-computer technology. DEC were later displaced by a plethora of corporations (including a now smaller IBM) which developed the personal computer. Christensen undertakes an in-detail analysis of technology progression in the disk industry analysing how new technologies, adopted by new entrants, can quickly displace existing organisations using current technologies resulting in continual business emergence and business failure. Incumbents may see the new technology coming, but are often unable to sustain development in current and new technologies concurrently and so are unable to react in time (Schoenberger, (1997) [
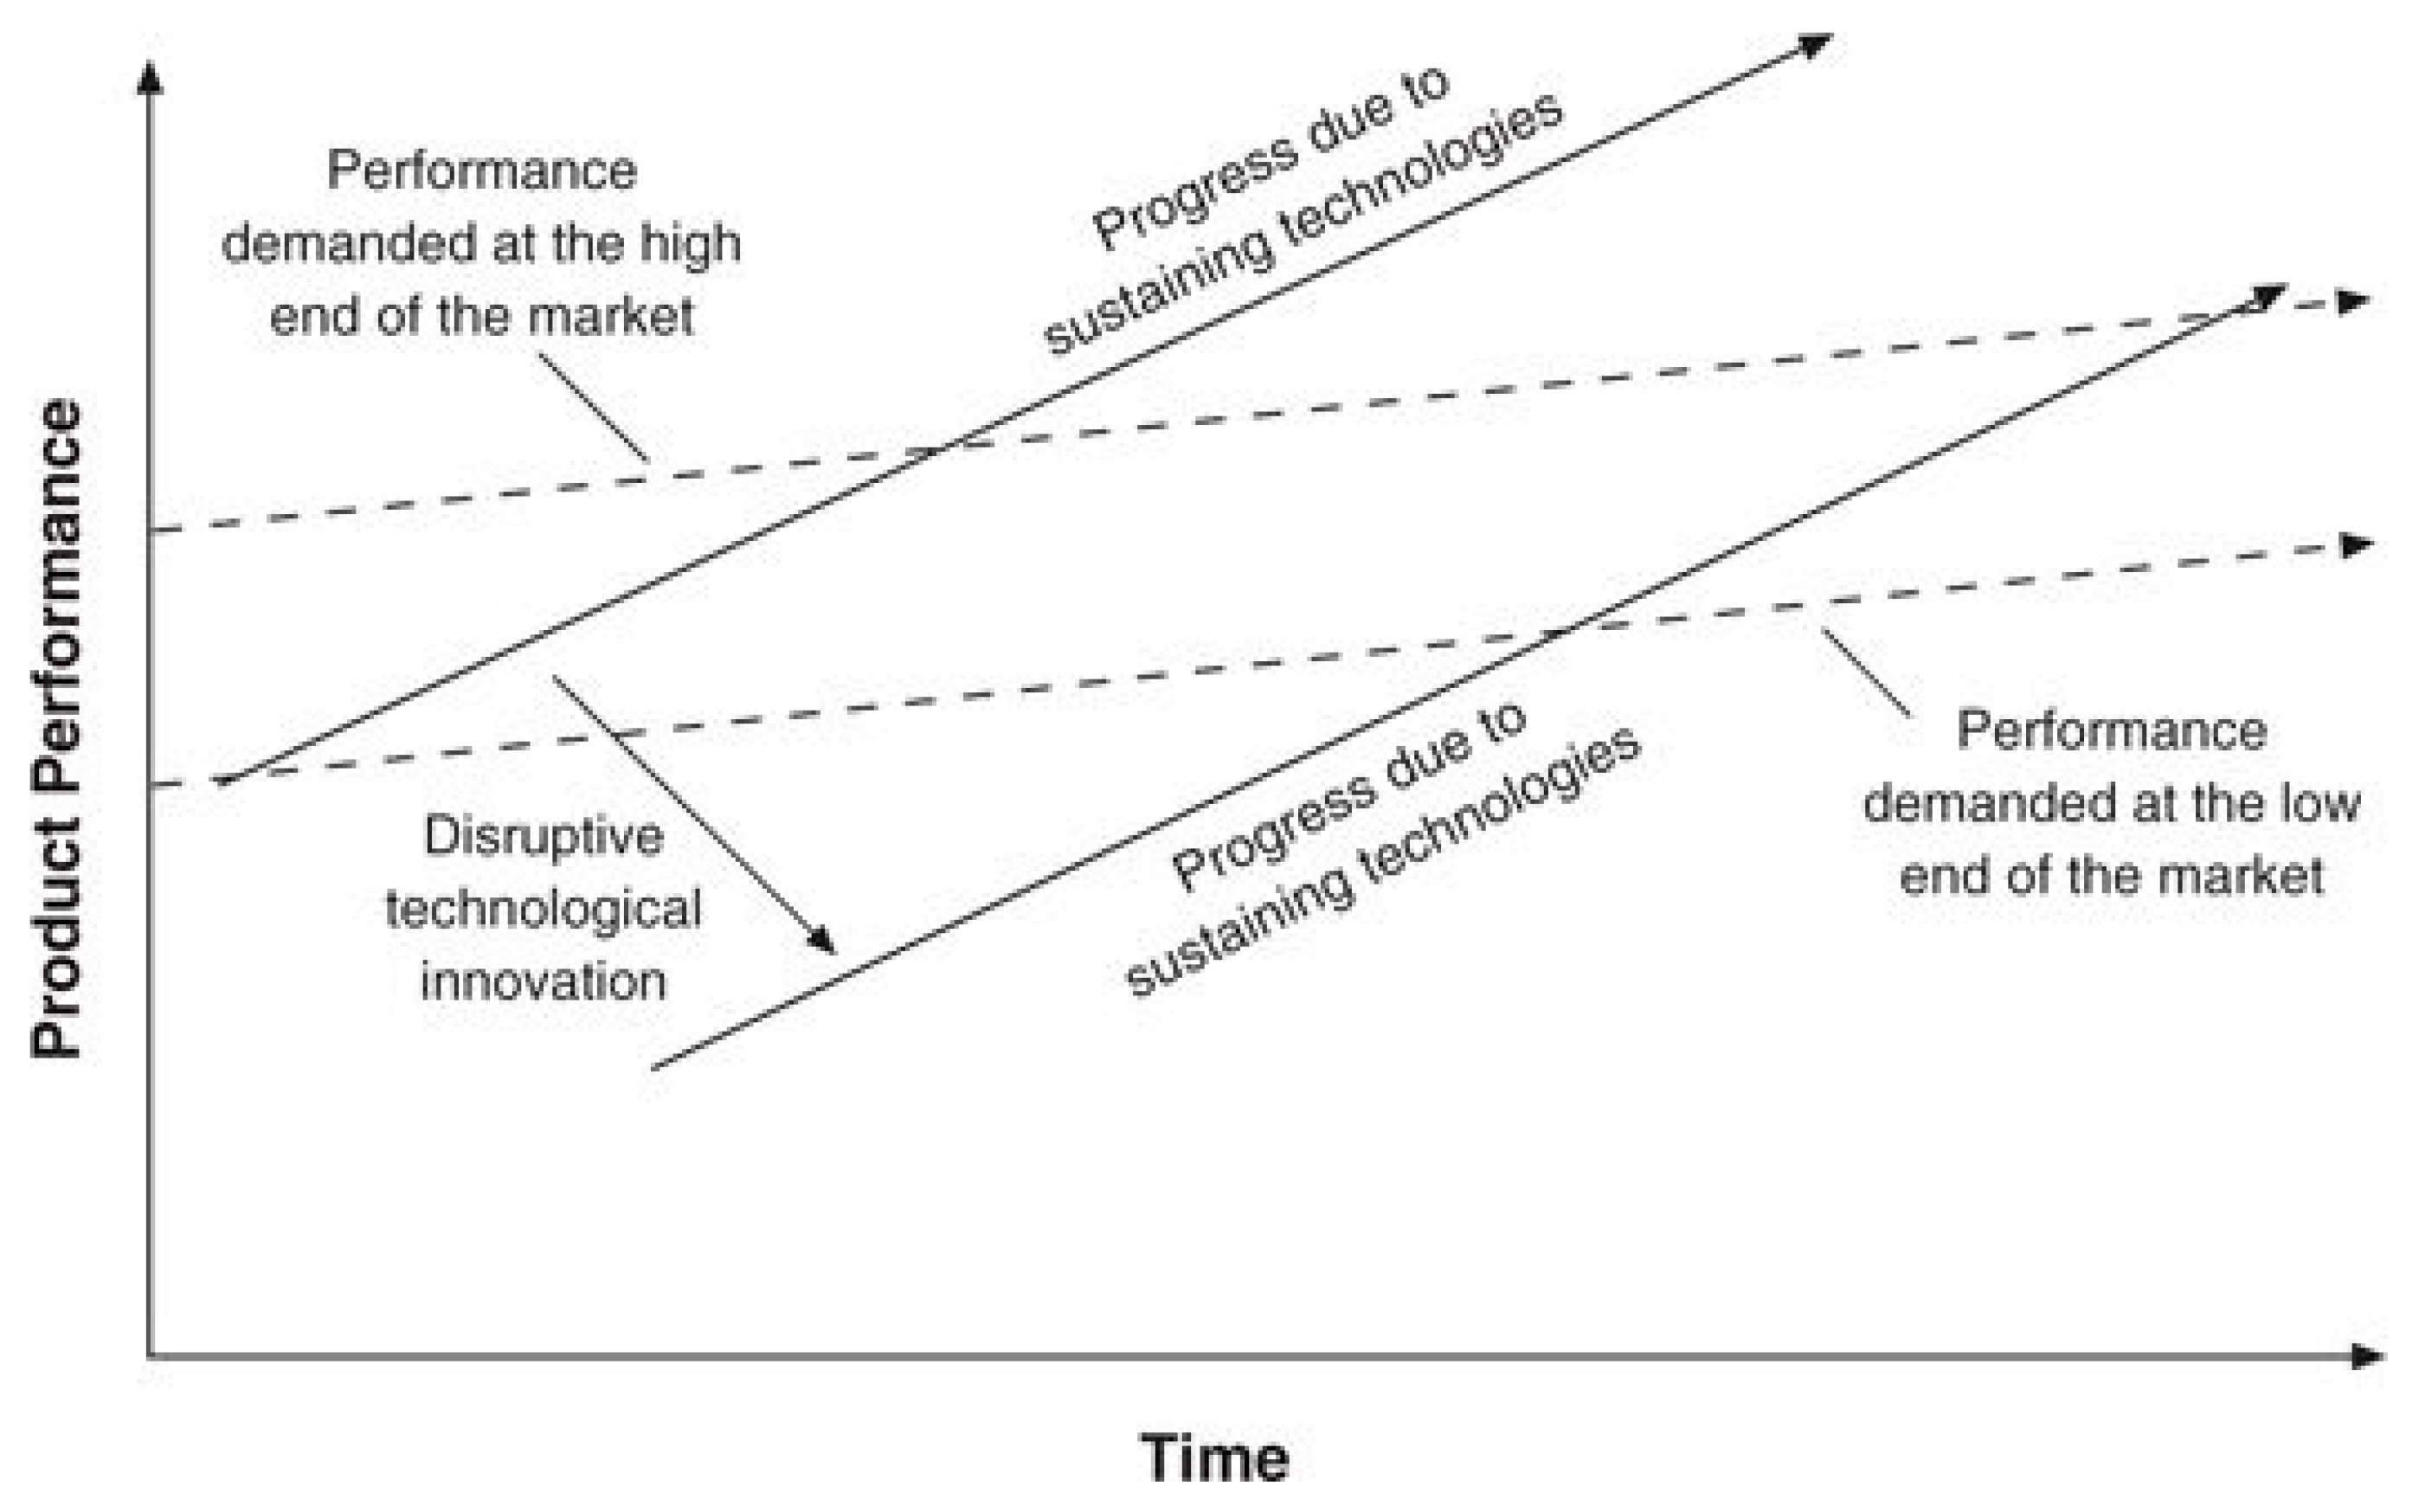
17]). Christensen’s model suggests that newer, cheaper alternative technologies initially have significant flaws preventing them from usurping extant technologies. As flaws are mitigated (perhaps with additional supporting technologies) the new technology quickly becomes disruptive, taking the bulk of the original technology’s applications (
Figure 1). An example is the demise of the high price 3D workstation: dramatically improving personal computer technology available at much lower cost meant the 3D workstation market receded as only exceptionally high performance warranted the price (for example in computer aided design (CAD) in architecture). Fixed infrastructure phones/landlines have been substantially replaced by mobile phones, as evidenced by the lack of public pay-phones available in most cities. The mobile phone was initially limited by range and battery life but when new battery technology became available and mobile transmission masts became more prevalent these disadvantages quickly were mitigated.
2.3. Institutional Influences
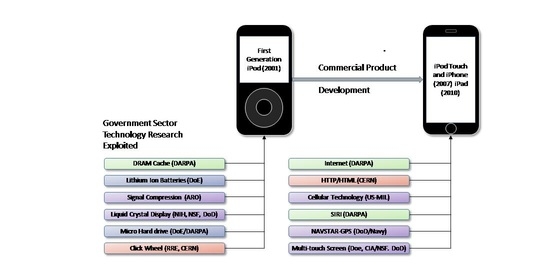
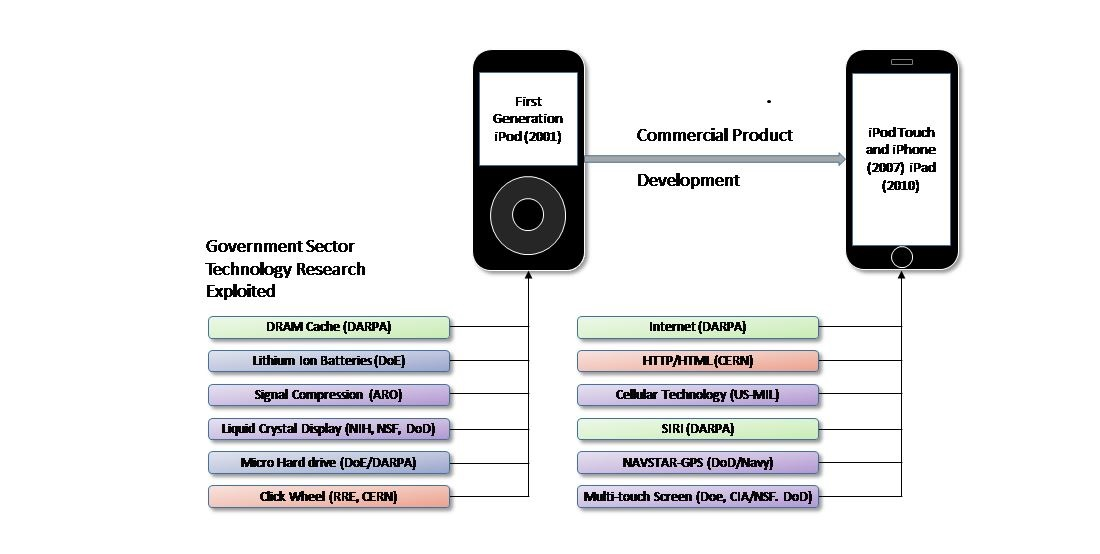
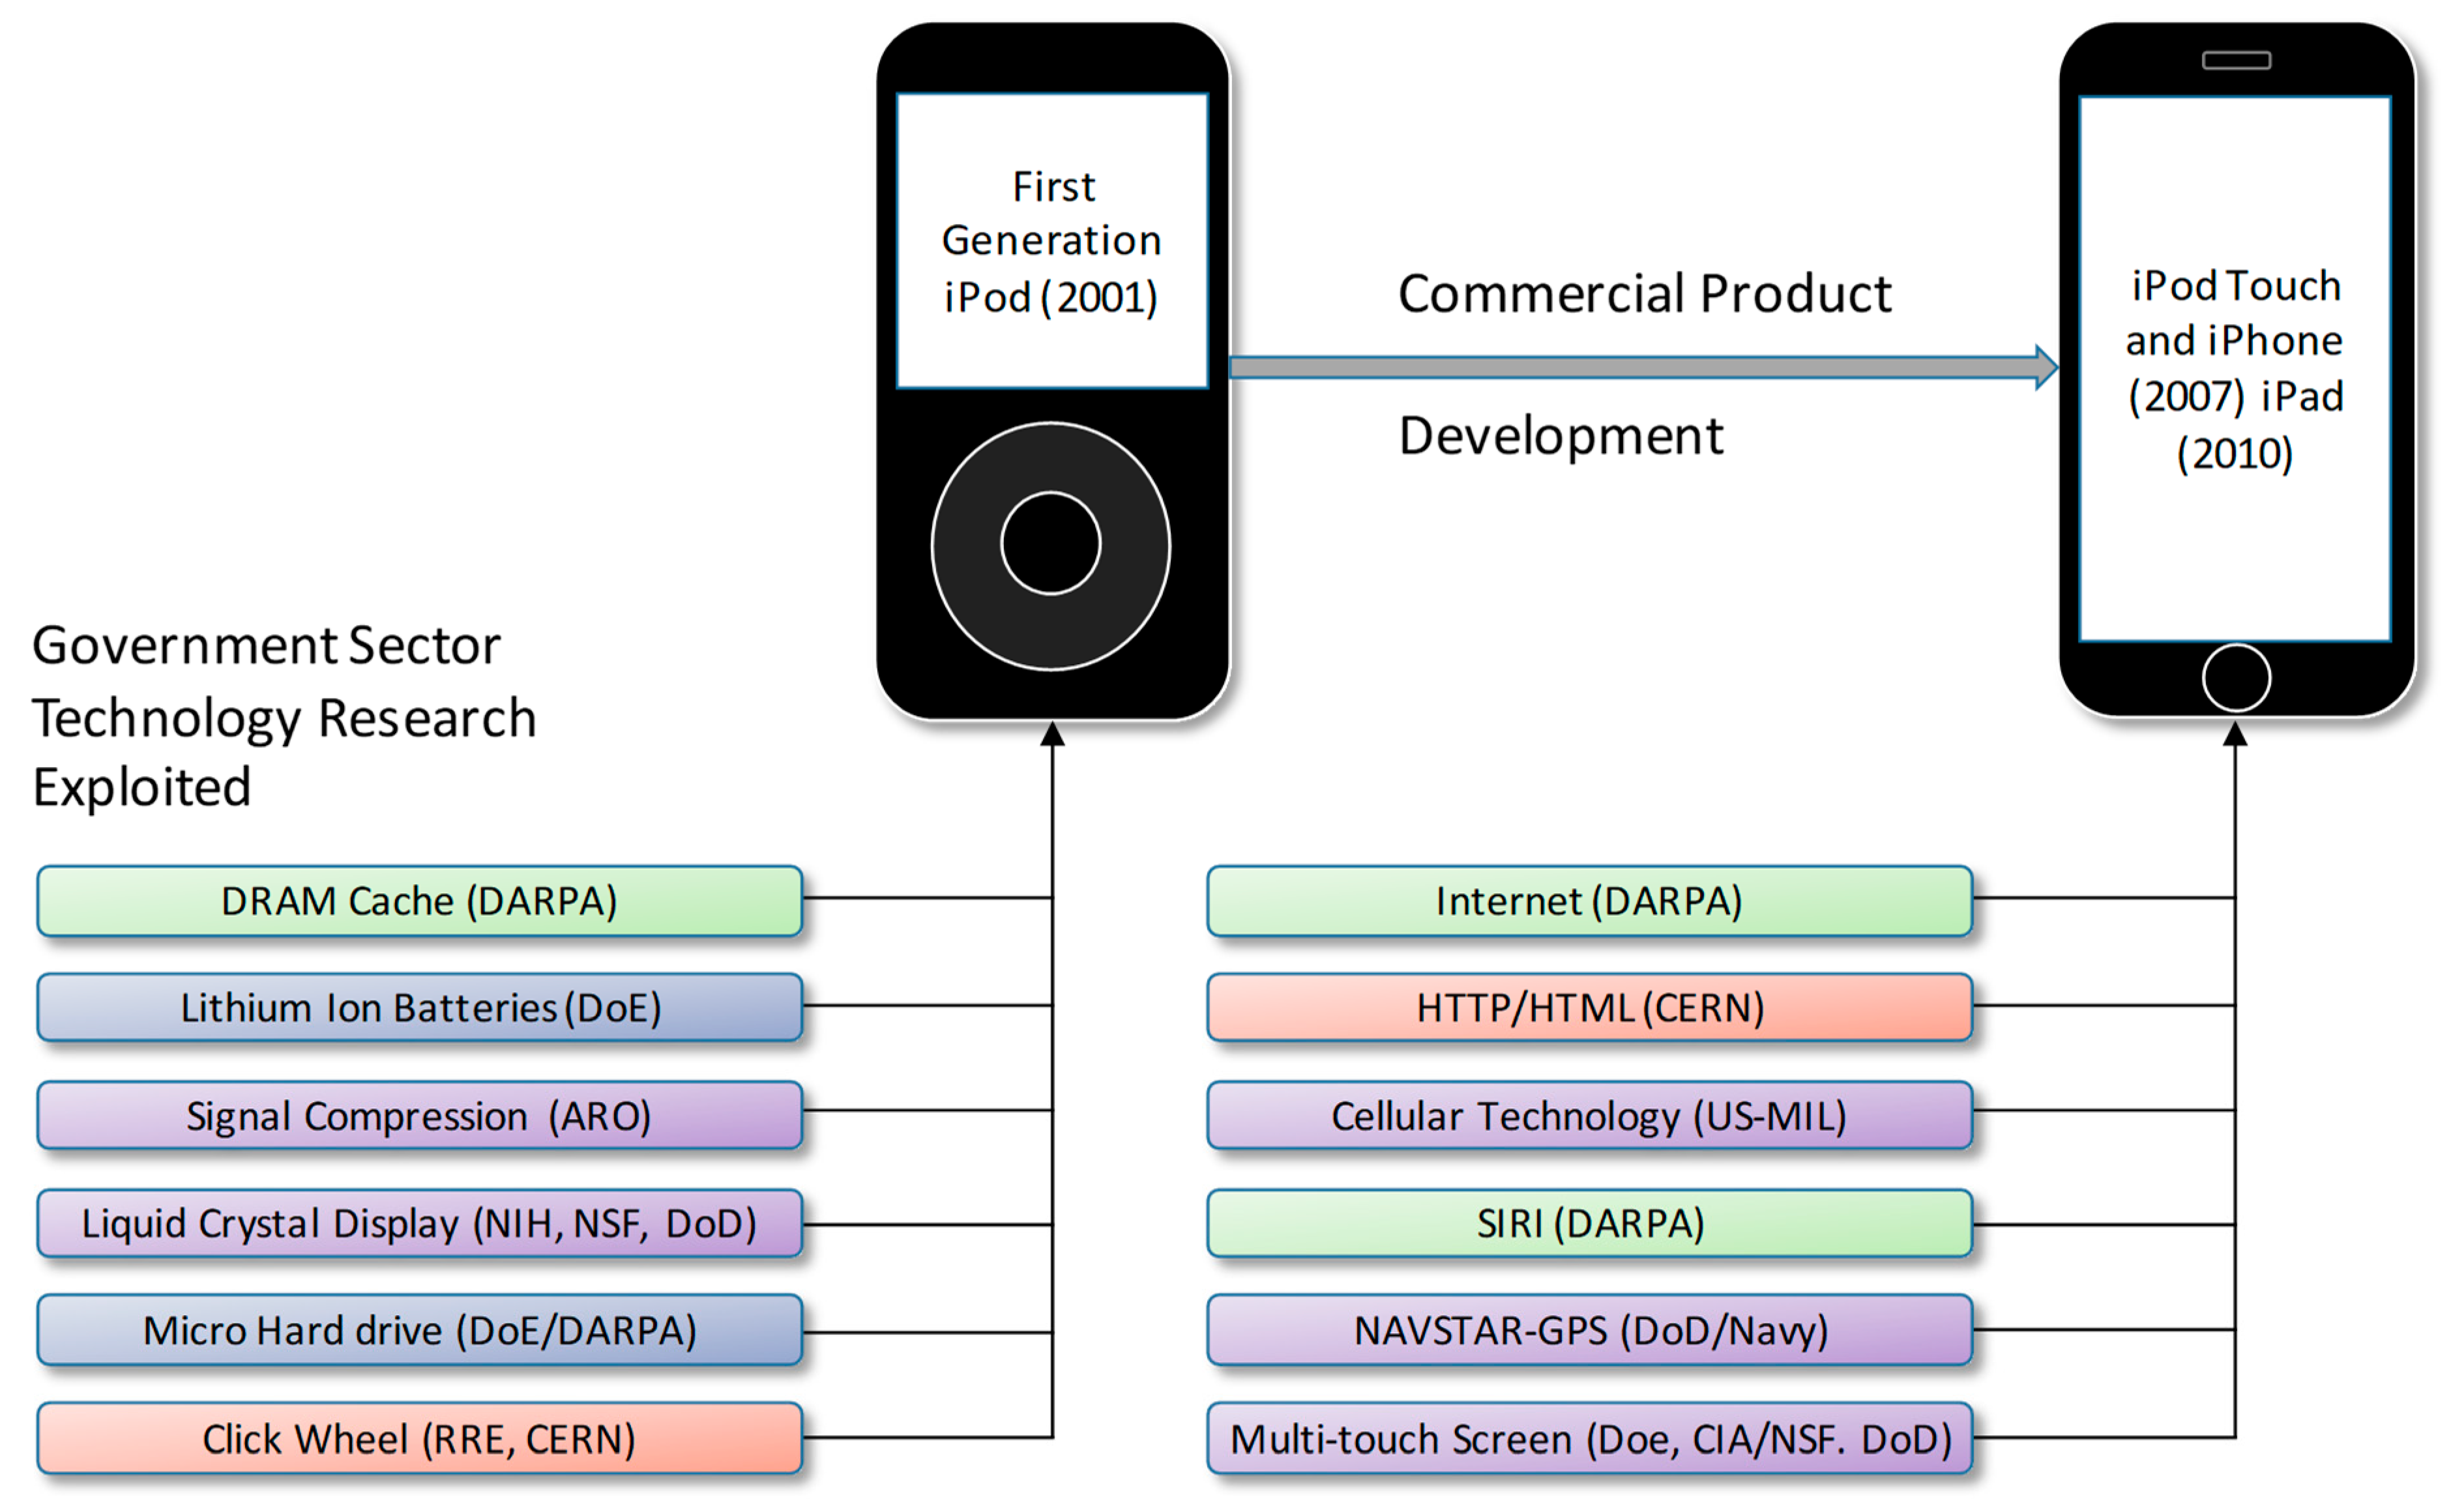
Mazzucuto (2011) [
8] has argued that technology is to a large degree driven by government funded research, citing the example of the iPhone which exploits and relies upon over 20 government funded technologies (e.g., GPS, high-performance batteries, microprocessors, solid state memory, etc.).
Figure 2 shows the amount of government funded research that went into the iPod/iPhone products delivered by Apple and considered commercially innovative.
However, to what extent is this still true? Historically governments funded ‘blue sky’ research whereas corporate organisations funded more applied research. While government funding of research organisations is significant, Big Tech companies such as Google, Amazon, Apple, and Microsoft are now running significant research organisations, undertaking fundamental science, but where not all research is publicly released. This development may lead to the emergence of oligopolies if not monopolies in line with the model of path dependence described by Arthur. Srnicek (2017) [
12] also addresses this issue describing the role of venture capitalists in providing successive funding rounds, or venture capital welfare, allowing technology companies undertaking complex research to survive longer and transition to financial viability.
Mokyr (2016) [
10] argues technology sometimes derives from ‘tinkering’ i.e. not all significant technology development is planned but can be the result of both accidental discoveries and ad-hoc innovation. This is consistent with all of the above models and may be considered an input into both the path dependent model and Christensen’s model of new technology development.
2.4. Path Dependence, Platform Development, and Technology Readiness Levels
Arthur’s (1987) [
18] work on path dependency describes a model of technology evolution where the chance of dominance increases with each successful deployment. Small early advantages increase the chance of one technology succeeding, and this small advantage then magnifies with further small gains and, therefore, increased chances of success (the path dependence). The premise is that a small lead can have an exponential effect. The initial technology dominance appears to be random but, at some point, path dependency becomes more deterministic and, therefore, predictable. Our suggestion is that this tipping point may be measurable; path dependence provides an explanation of the case of the VHS video format, which achieved greater success than the Betamax format, despite the latter being generally agreed to be the superior platform. VHS, mainly due to early content availability, eventually achieved complete dominance. In this case technological superiority was not the ultimate reason for success or failure but, instead, resulted from an early adoption by content providers.
A related model of technology exploitation is based around the concept of platforms. Langley and Leyshon (2017) [
11] identify specific socio-technological ecosystems which support and can accelerate technology growth. These platforms may be, for example, on-line exchange markets, such as the Apple or Android App stores, or finance related, such as crowd-funding platforms. Due to the nature of information technology development, the platform model is a key driver in technology adoption. Platforms often compete initially but winning providers gain significant advantage and contribute to path dependency. The implications of this transition to platform capitalism is described in Srnicek (2017) [
12].
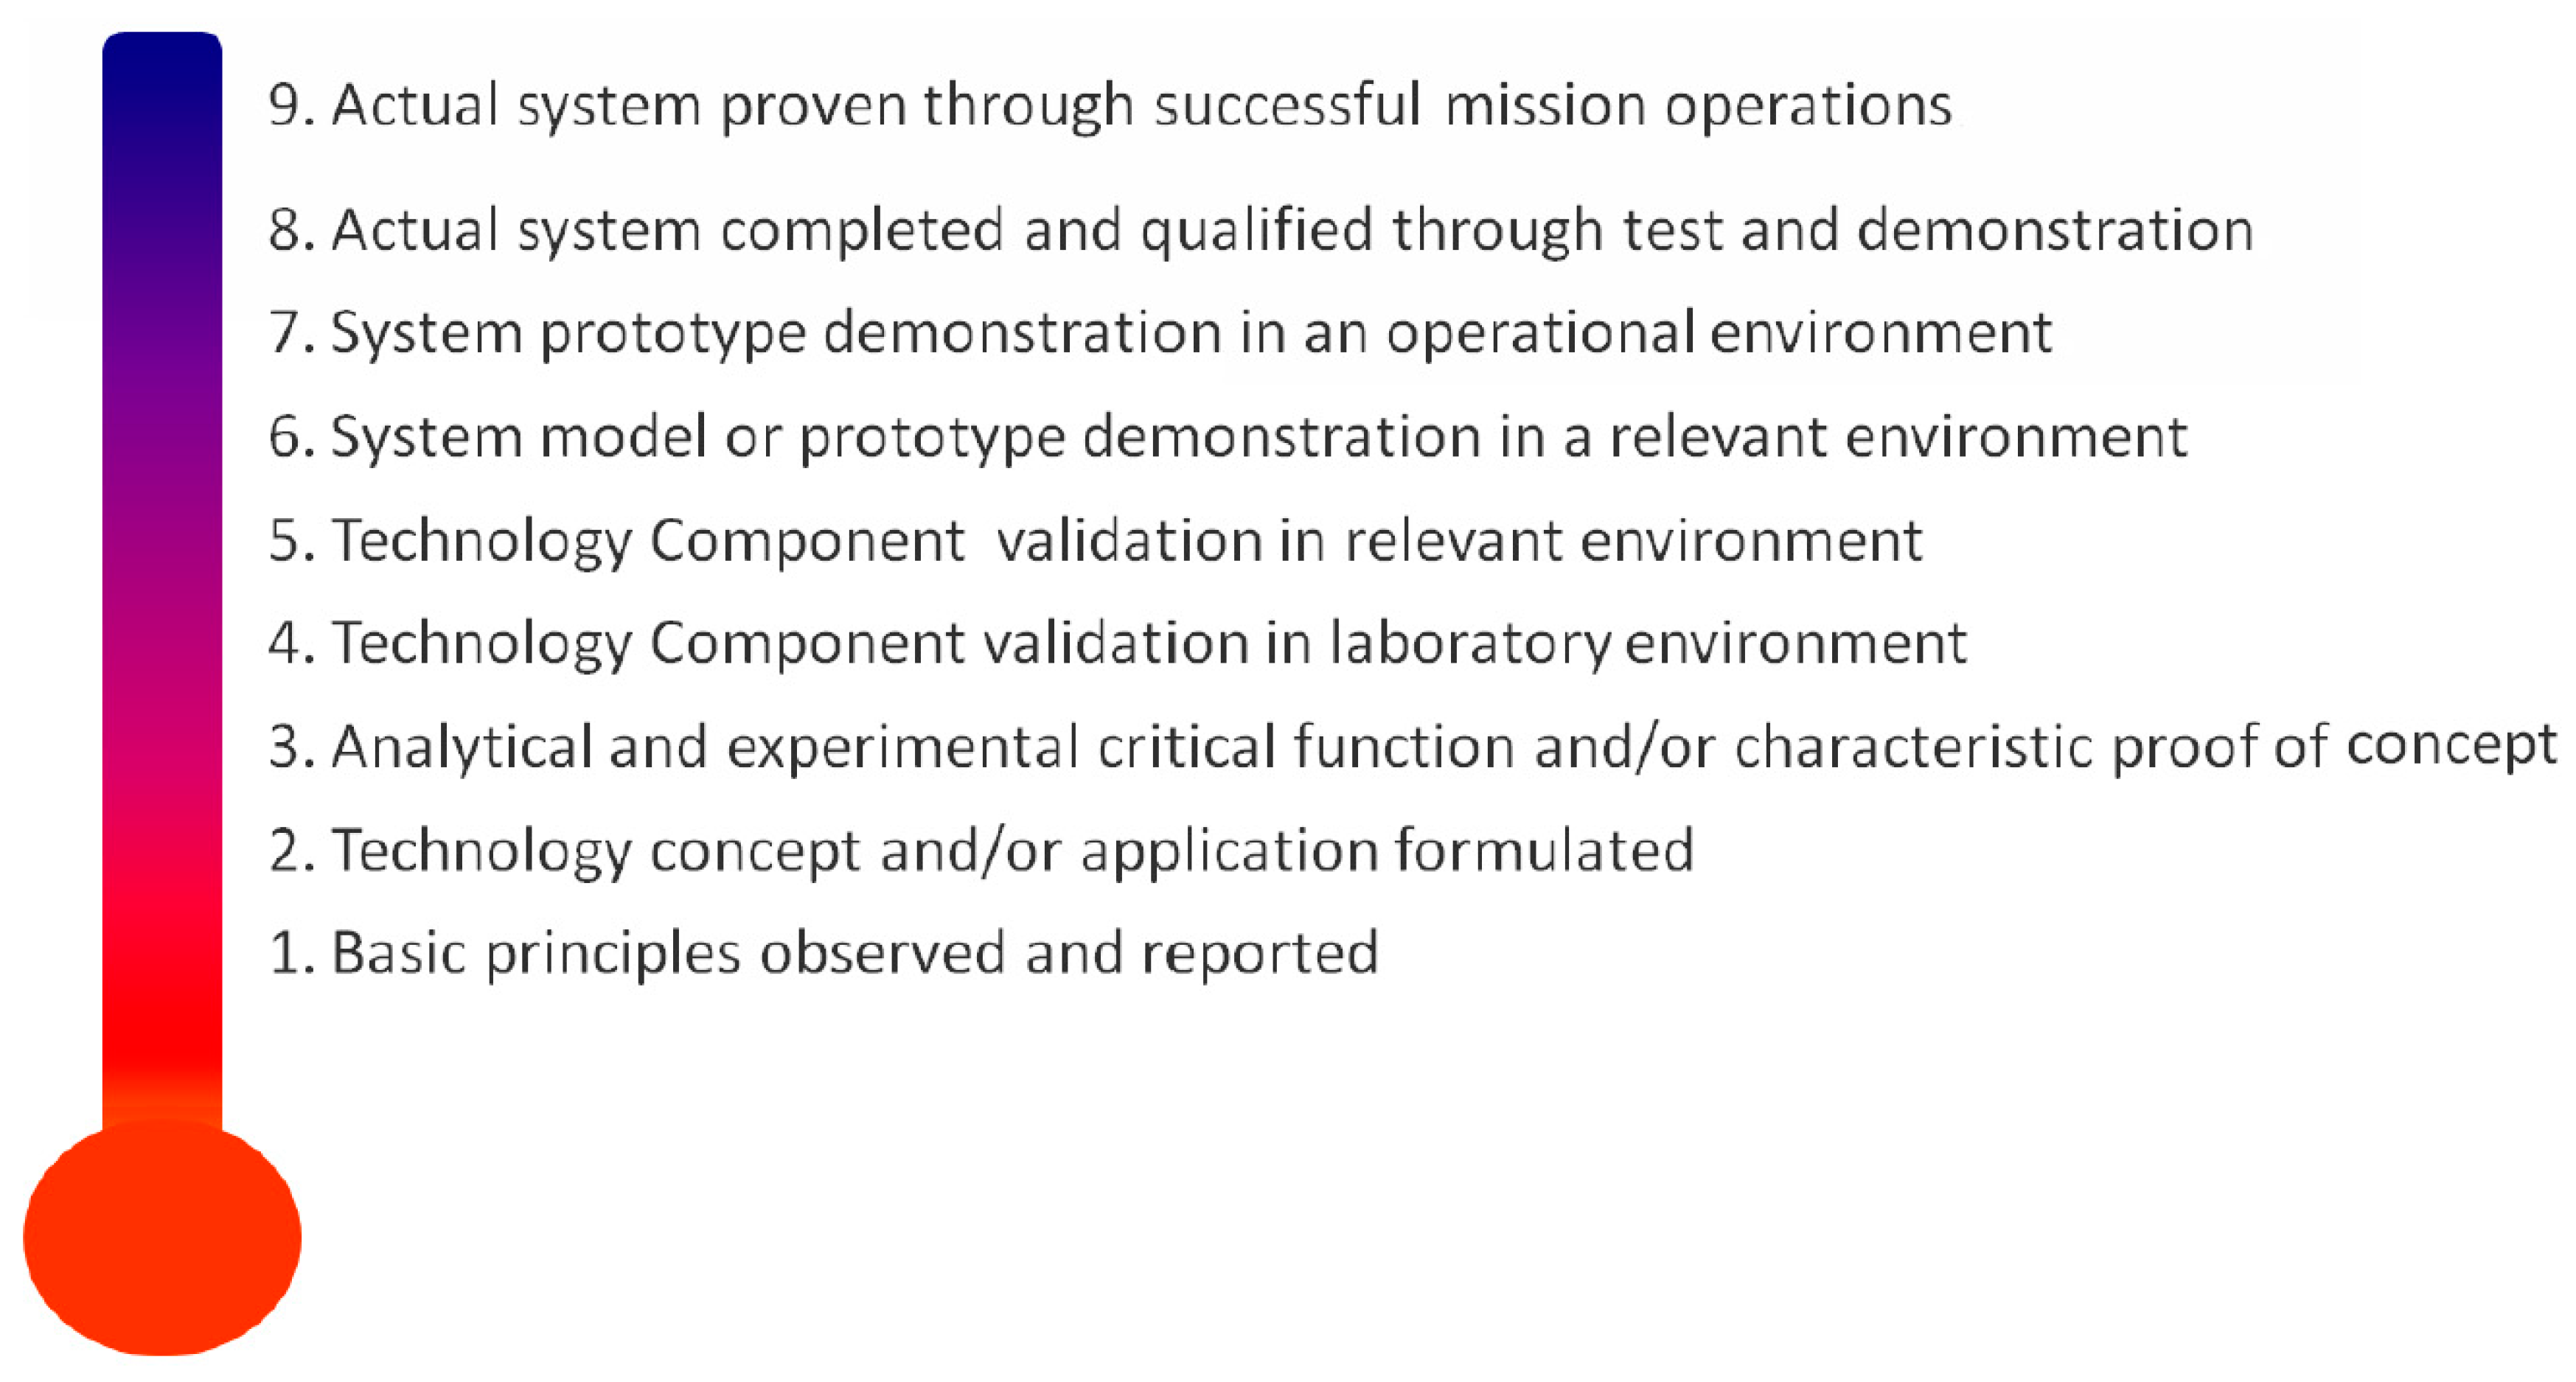
Objective assessment of progression/disruption requires measures of technology state/progress. One measure, Technology Readiness Level (TRL), was conceived by NASA to characterise technology status for use in space missions and is now supported by the European Association of Research and Technology Organisations (EARTO). It includes well defined characterisations and associated measures of technology state in a domain. The measures are shown in
Figure 3. As a well-recognised, domain-specific quantization of a technology state, it is relevant to this paper’s goal. It does not, however, address the issue of disruption itself or rate of change of technology state, which could be added by considering for example technology cost in a domain (say TRL/£) or TRL change over time.
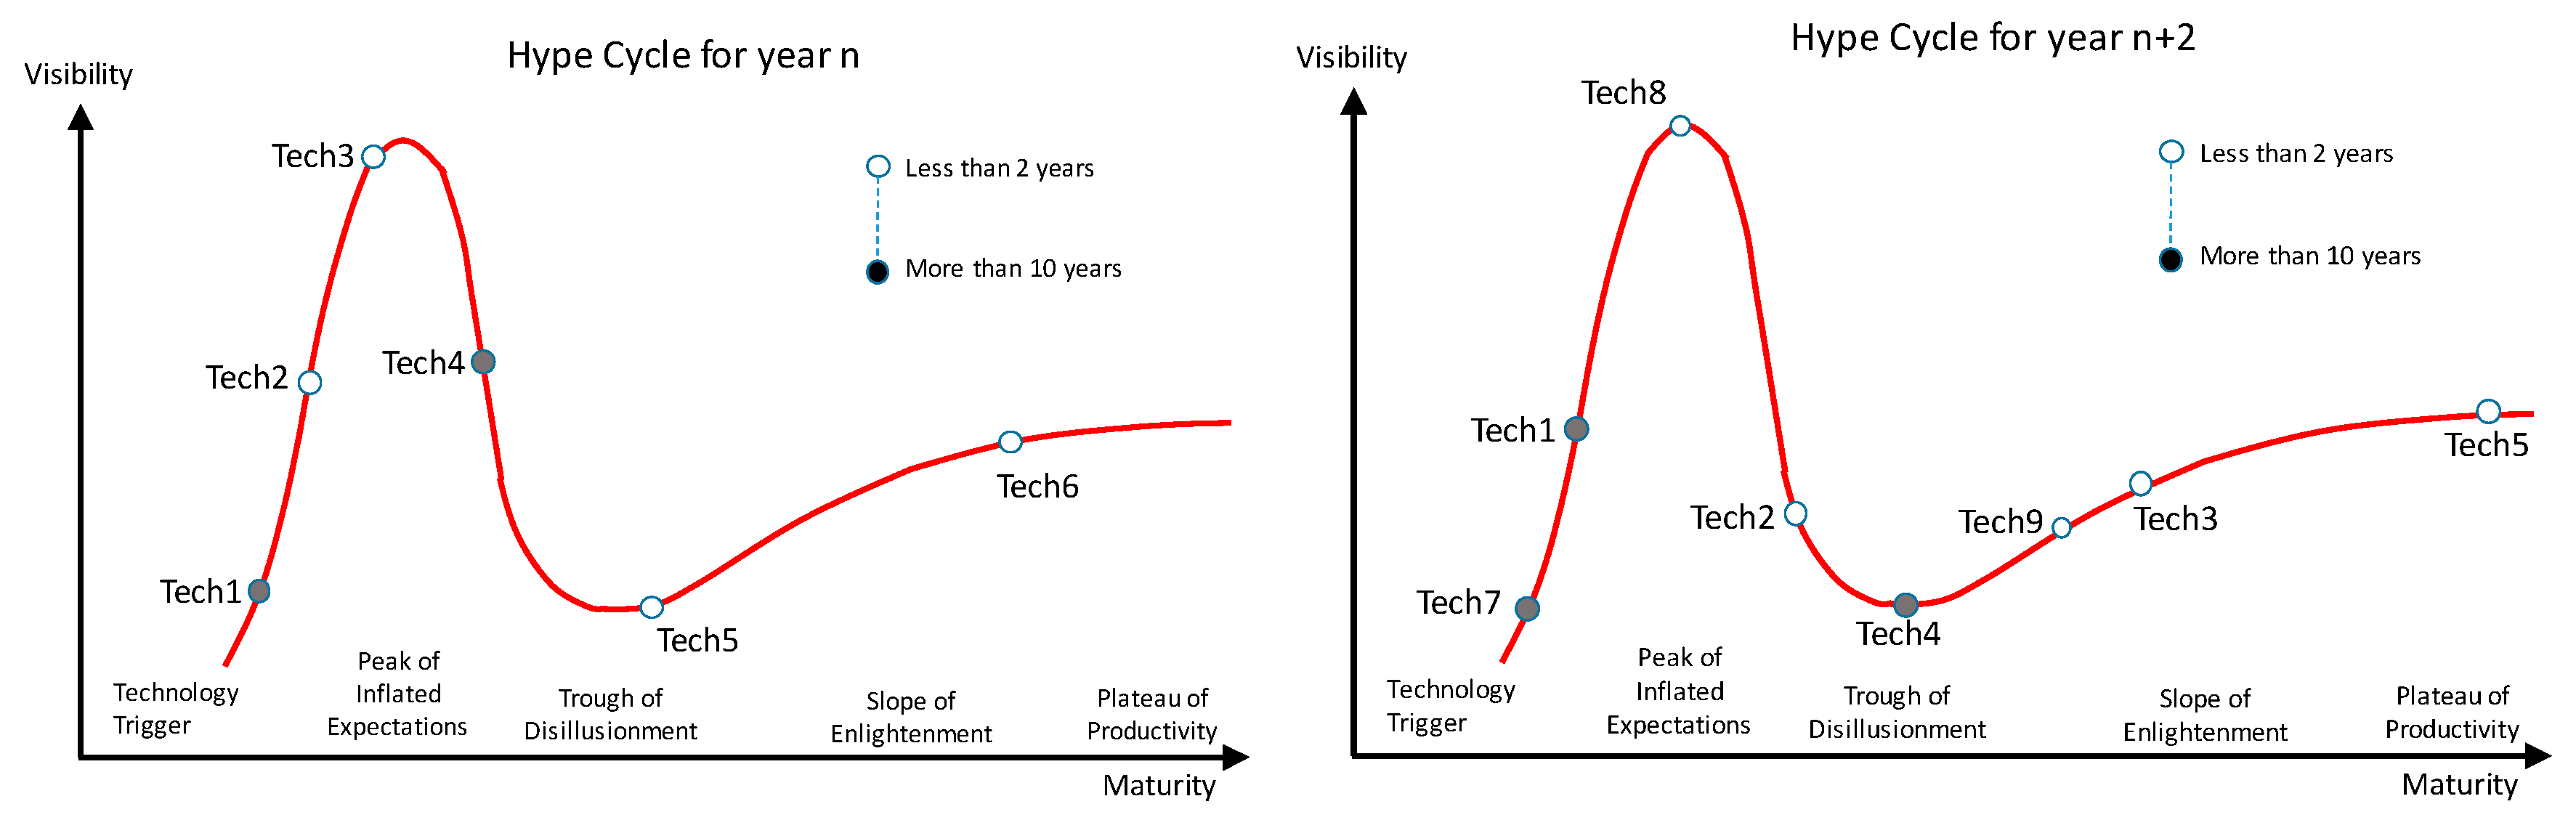
2.5. The Gartner Hype Cycle
Gartner (see Linden A and Fenn J, 2003) [
19] postulate that the progression of technology can be depicted as the ‘Hype Cycle’ (
Figure 4) with technology becoming ‘hyped’ and then falling back as it fails to broadly deliver, but finally achieving utility in a limited domain. Published by Gartner annually for more than 15 years for a range of sectors it is a potential benchmark of technology disruption Gartner (2017) [
20].
The hype cycle model measures more than TRL, indicating status in relation to adoption. While an absolute numerical measure is not available, the region of the graph in which the technology exists is a potential measure (e.g., building to peak of expectations, falling to trough of disillusionment, etc.). There is also a relative measure possible in that items are before or ahead of other items in progression along the curve.
A good example of progression is Augmented Reality, which over 10 annual cycles has moved progressively through the cycle. AR became ‘hyped’ with the release of the Google Glass AR glasses, but widespread experimentation revealed problems with hardware maturity, lack of accurate, very high resolution mapping, etc., and was not widely adopted. However, AR is now delivering in specialist areas where data quality is high and the weight of better hardware is less of an issue than in wearable technology, e.g., in automotive design. In this case the hype cycle was a good predictor, although Gartner does not promote it as such. Nevertheless, for our purposes it does offer a useful measure of technology progress and it remains a potential benchmark for comparison of our work.
2.6. Big Data Analytics
Big data analytics offers the prospect of supporting current manual methods of technology trend assessment with automation. Within this paper, we adopt the description of big data from Mayer-Schoenberger and Cuckier (2013) [
21] which defines big data in terms of approach. They outline four essential elements of the big data approach we can exploit for technology progress analysis. First,
datafication, identified as the process of producing structured observations from unstructured data (an early 19th Century example was analysing the narrative in the archive of ship’s logs to provide better navigational maps/tables). Second, the use of all the data rather than sampling, made possible by improved computing and storage capacities. Third, accepting that large amounts of data are typically of highly variable quality, but quantity helps mitigate variability problems. Fourth, and finally, the idea that where a desired measure cannot be made, proxy measures can substitute. For example, it is difficult to remotely measure the state of maintenance of properties and, therefore, their fire risk, but if the state of repair of the front of a building (which can be captured by bulk photography) correlates well with maintenance state (and through historical data be proven to correlate), it can be used as an effective future measure. We apply this approach to technology disruption measurement (see part 4).
The various technology progression/disruption perspectives discussed above, are summarised in
Figure 5 which conceptualises the research interplay. The research topics are organised horizontally based on their relevance to technology development or technology effect, and vertically based on their scope. Arthur’s and Christensen’s models offer overarching viewpoints. More specific research, such as that on institutional influences or platforms, falls into more specific categories. The specific measures and tools are then grouped below. This organisation then allows the consideration of an integrated model (part 3).
In summary, each of the above approaches offer a viewpoint on how technology can be assessed, modelled and potentially measured and trends predicted. There are more candidate theories that may be useful in building a consolidated model/forecasting system, but the set above is considered sufficient in describing an approach to unified technology forecasting based on big data techniques.
3. Developing the Overall Model of Technology Composition
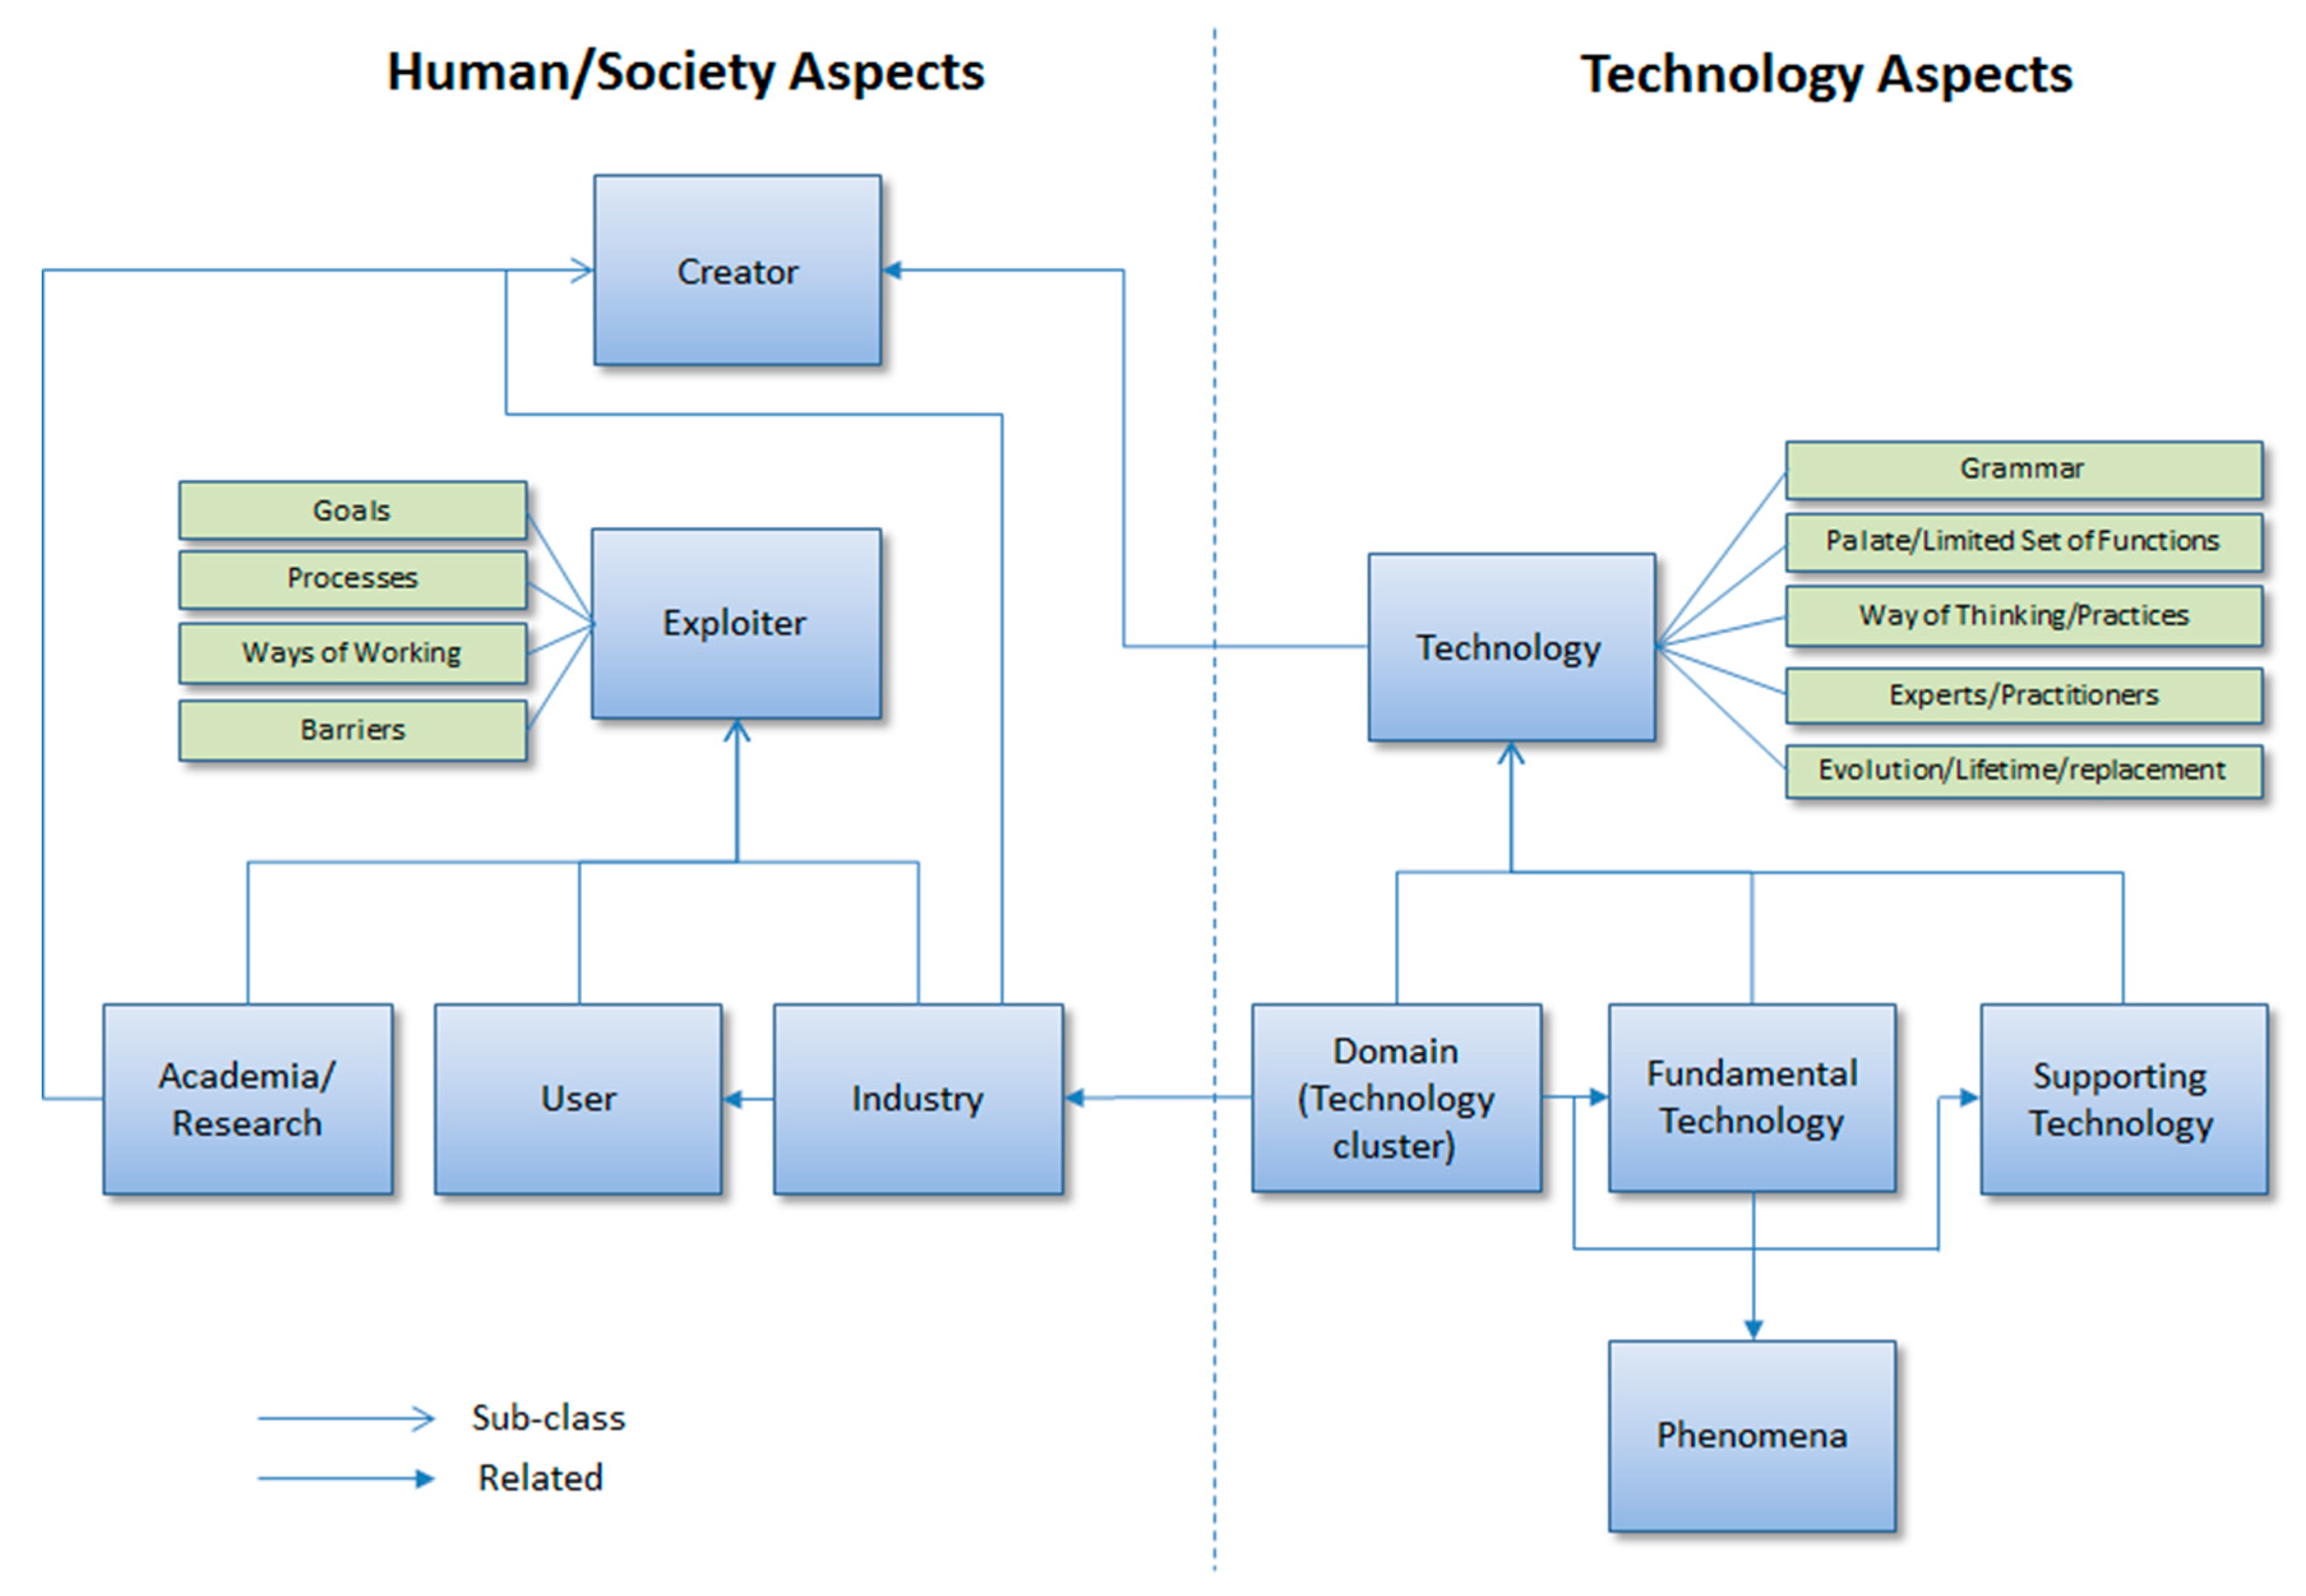
To provide a consolidated model of technology growth against which technology progress can be assessed we need to capture key elements of the research described in part 2. An integrated framework for measurement is also needed. This work is ongoing but its progress to date is addressed here. Key elements of technology are described in Arthur (2009) [
7]. We conceptualise this using Unified Modelling Language (UML), summarised in
Figure 6. Arthur identified technology anatomy as well as human/society interaction with technology.
Arthur proposes three primary types of technology; fundamental technology, based on a phenomenon (e.g., lithium’s properties for high performance batteries); supporting technologies, often needed to make a fundamental technology work (e.g., battery charging or cooling technologies) and a cluster of technologies which together become identified as a technology (e.g., the smartphone). He suggests that technologies also develop technical languages, provide a palette of tools/functions and develop clusters of expertise; in combination all these elements evolve.
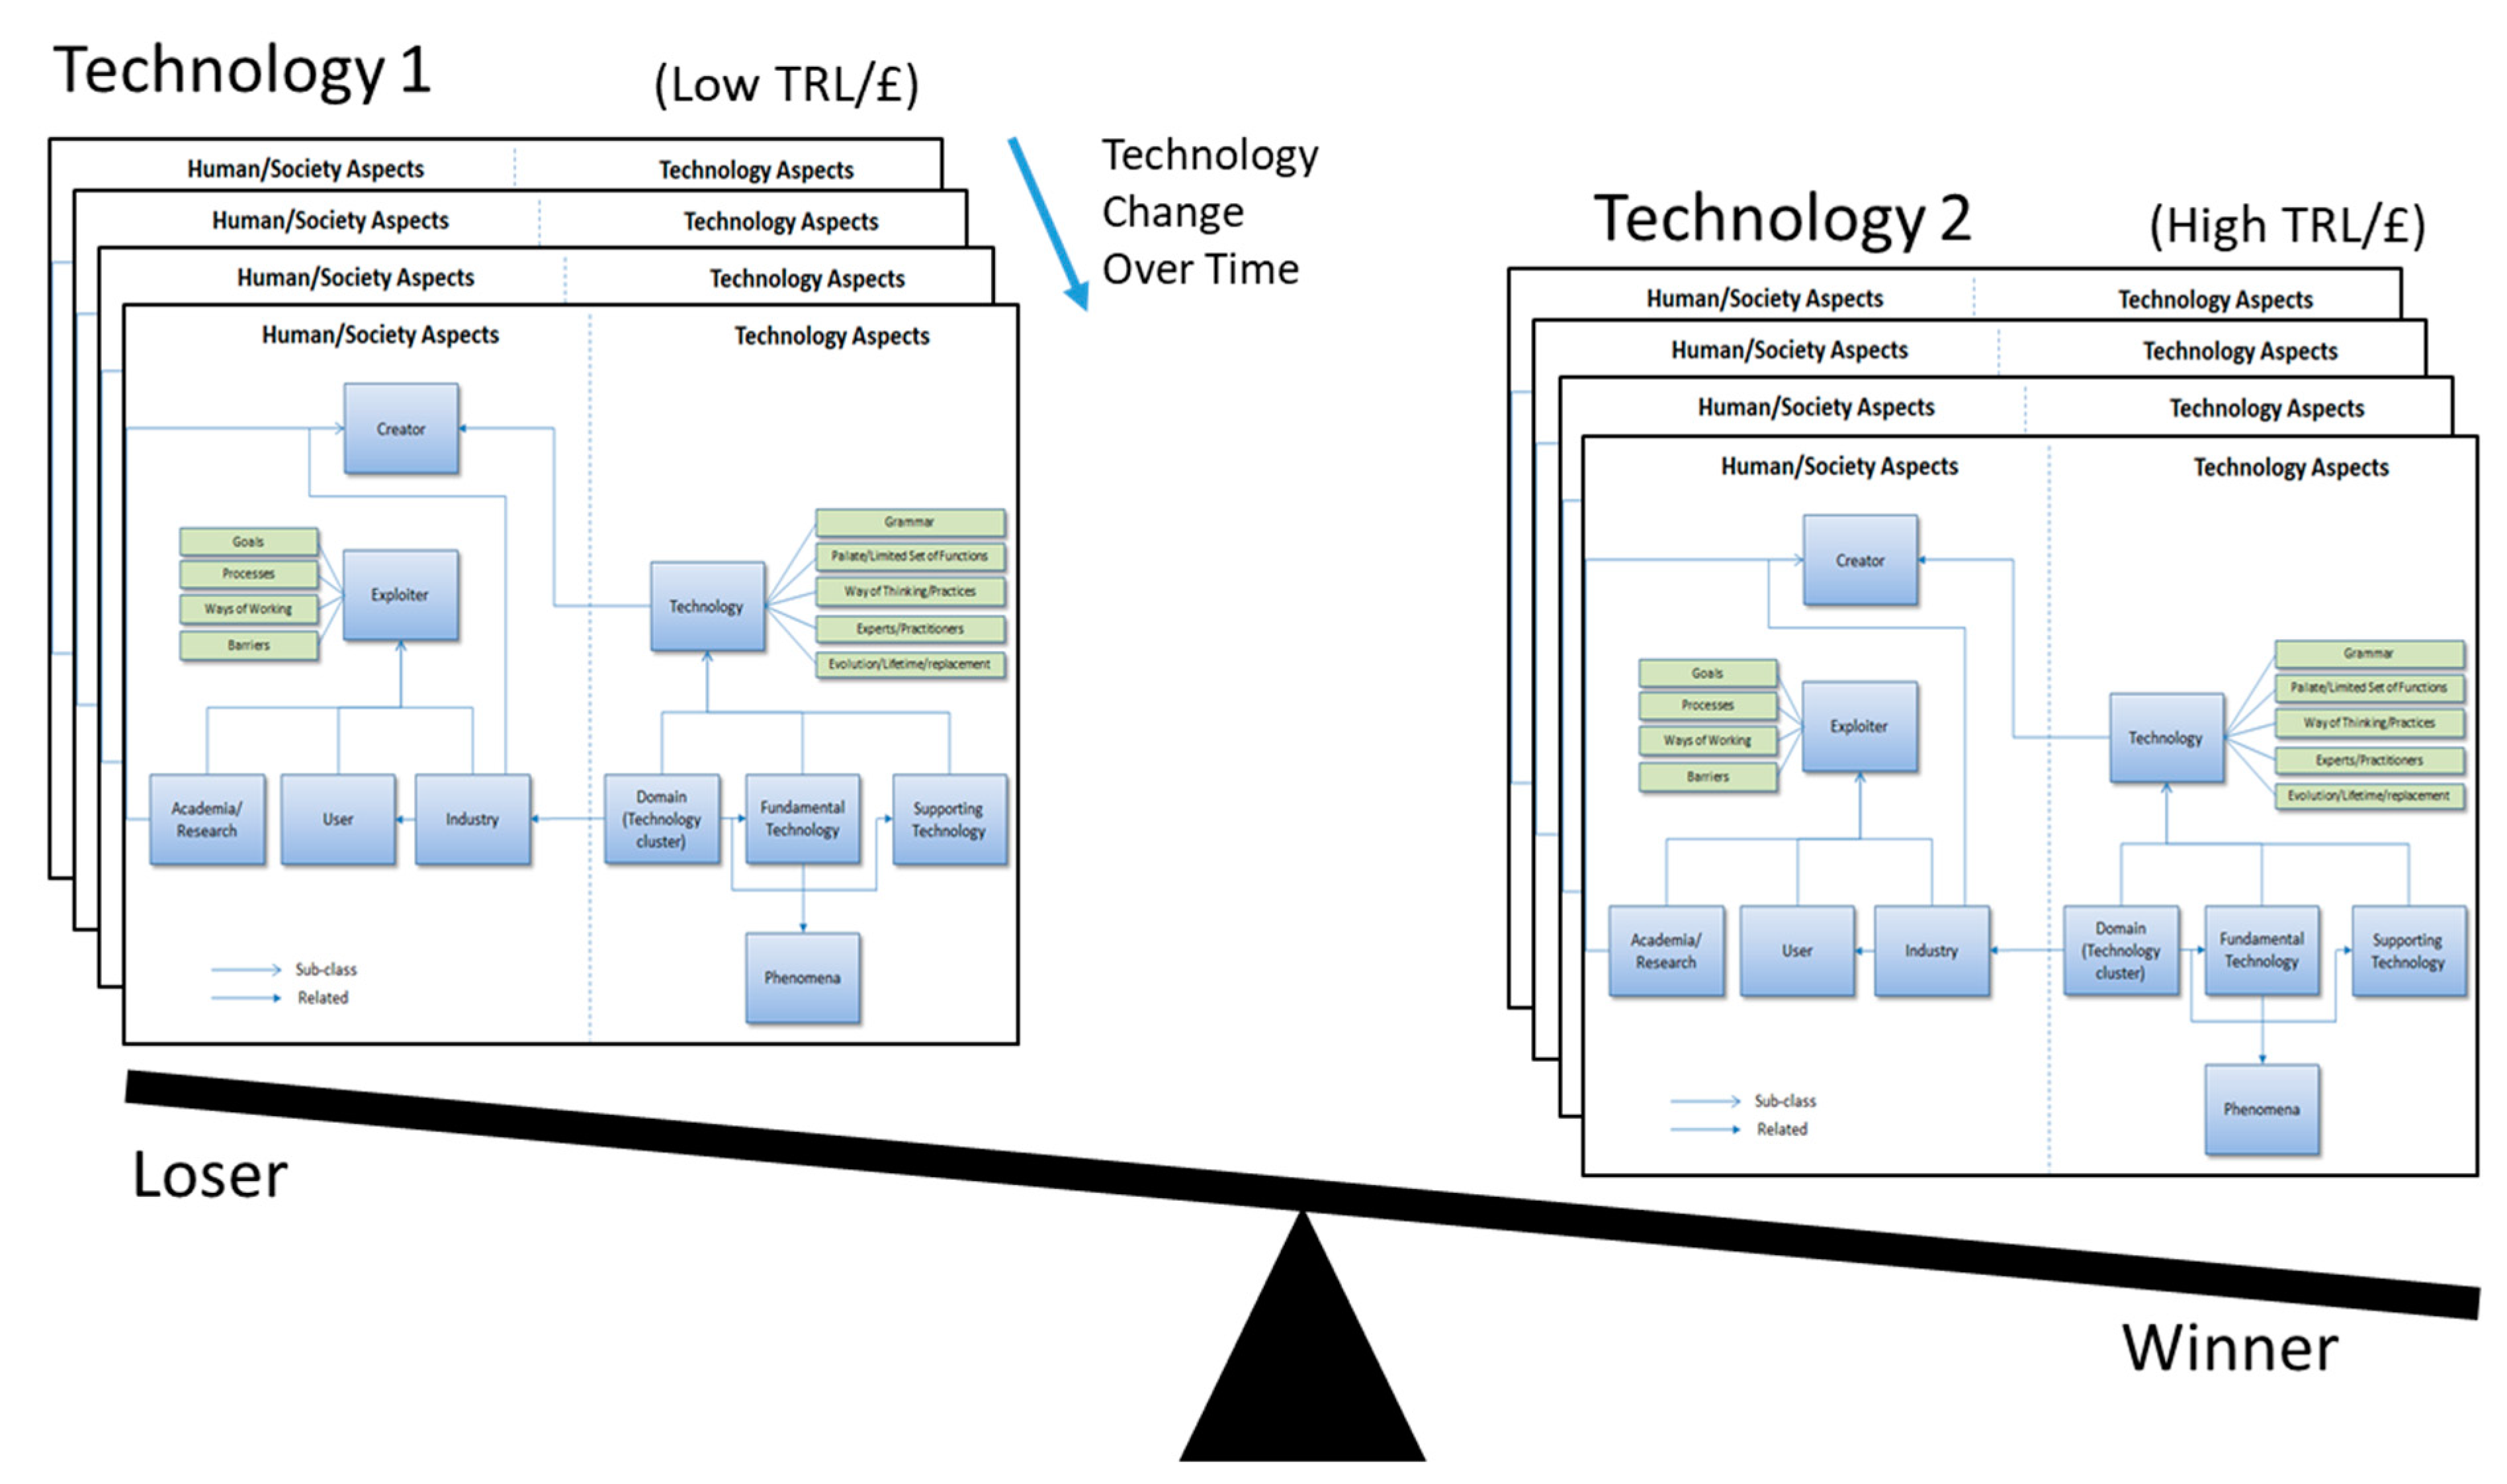
In the human/societal factors of Arthur’s model, there are societal groups interacting with the technology such as the creators, (individuals, academic institutions, and commercial organizations) and exploiters. Exploitation is characterized by both need and barriers. If we capture the state of various technology ecosystems over time using our formalization of Arthur’s model (
Figure 6) we can potentially compare them using Christensen’s model (measuring their utility/readiness against cost) (see
Figure 7). For each technology, we can add information related to its potential disruptive effect (as characterized by TRL/£, position on the Hype Curve, or potentially other indicators such as its geographical spread). If
Figure 6 is considered as a snapshot in a time series, then we have an integrated model which represents both the nature of technology, Arthur (2009) [
7] and technology disruption, Christensen (1997) [
4]. Further work is in progress to generate such an integrated model described in UML.
With the above model we consider how indicators may characterize progression of a technology. TRL may be used as a measure of technology against an exploiter domain. The concept of technology domain is implied rather than explicitly discussed by Arthur but is an important aspect of technology readiness. For example, a technology may be small and light but not robust enough to satisfy the satellite domain, but adequate in another. Arthur’s model does not describe the driving need for the technology. It does not, for example, define a model for domain or market specific need which would drive the evolution of the technology or cause practical disruption. However, we believe this area needs modelling to address the disruptive effect.
Time is not the only parameter in the state of a given technology’s disruptive effect; geographic location (including regionality, proximity, etc.) is also a parameter. This is evident in multiple elements in the Arthur ‘Anatomy’. Institutions are geographically located, as are technology providers. Arthur (1994) [
9] describes the effect of proximity on path dependence. Martin and Moddysson (2011) [
22] and Strambach and Klement (2012) [
23] look at the effect of location on knowledge propagation. Ultimately measuring the state of knowledge related to a potentially disruptive technology over place and time would help identify potential disruption and this has been identified as a key topic for further investigation. There is also the issue of disruption through ‘dispersion’. Christensen (1997) [
4] and Arthur (1997) [
9] both view disruption as starting in a limited scope then dispersing (moving into new application areas or spreading geographically), catching incumbents unaware. While there are arguments that domain and geographic dispersion of disruption is not the same, this paper argues that they are part of the same ecosystem. Disruption in effect has to be felt in a ‘place’. While technology development might happen at a single location the disruptive effect is geographic (it happens in different places at different times).
Mazzucato suggests that technology growth is significantly driven by government funded research. If so, by examining the progression of government research and considering it in relation to domain specific gaps provides a potential indicator of future disruption. Research on platform capitalism (Langley and Leyshon, 2017 [
11]; Srnicek, 2017 [
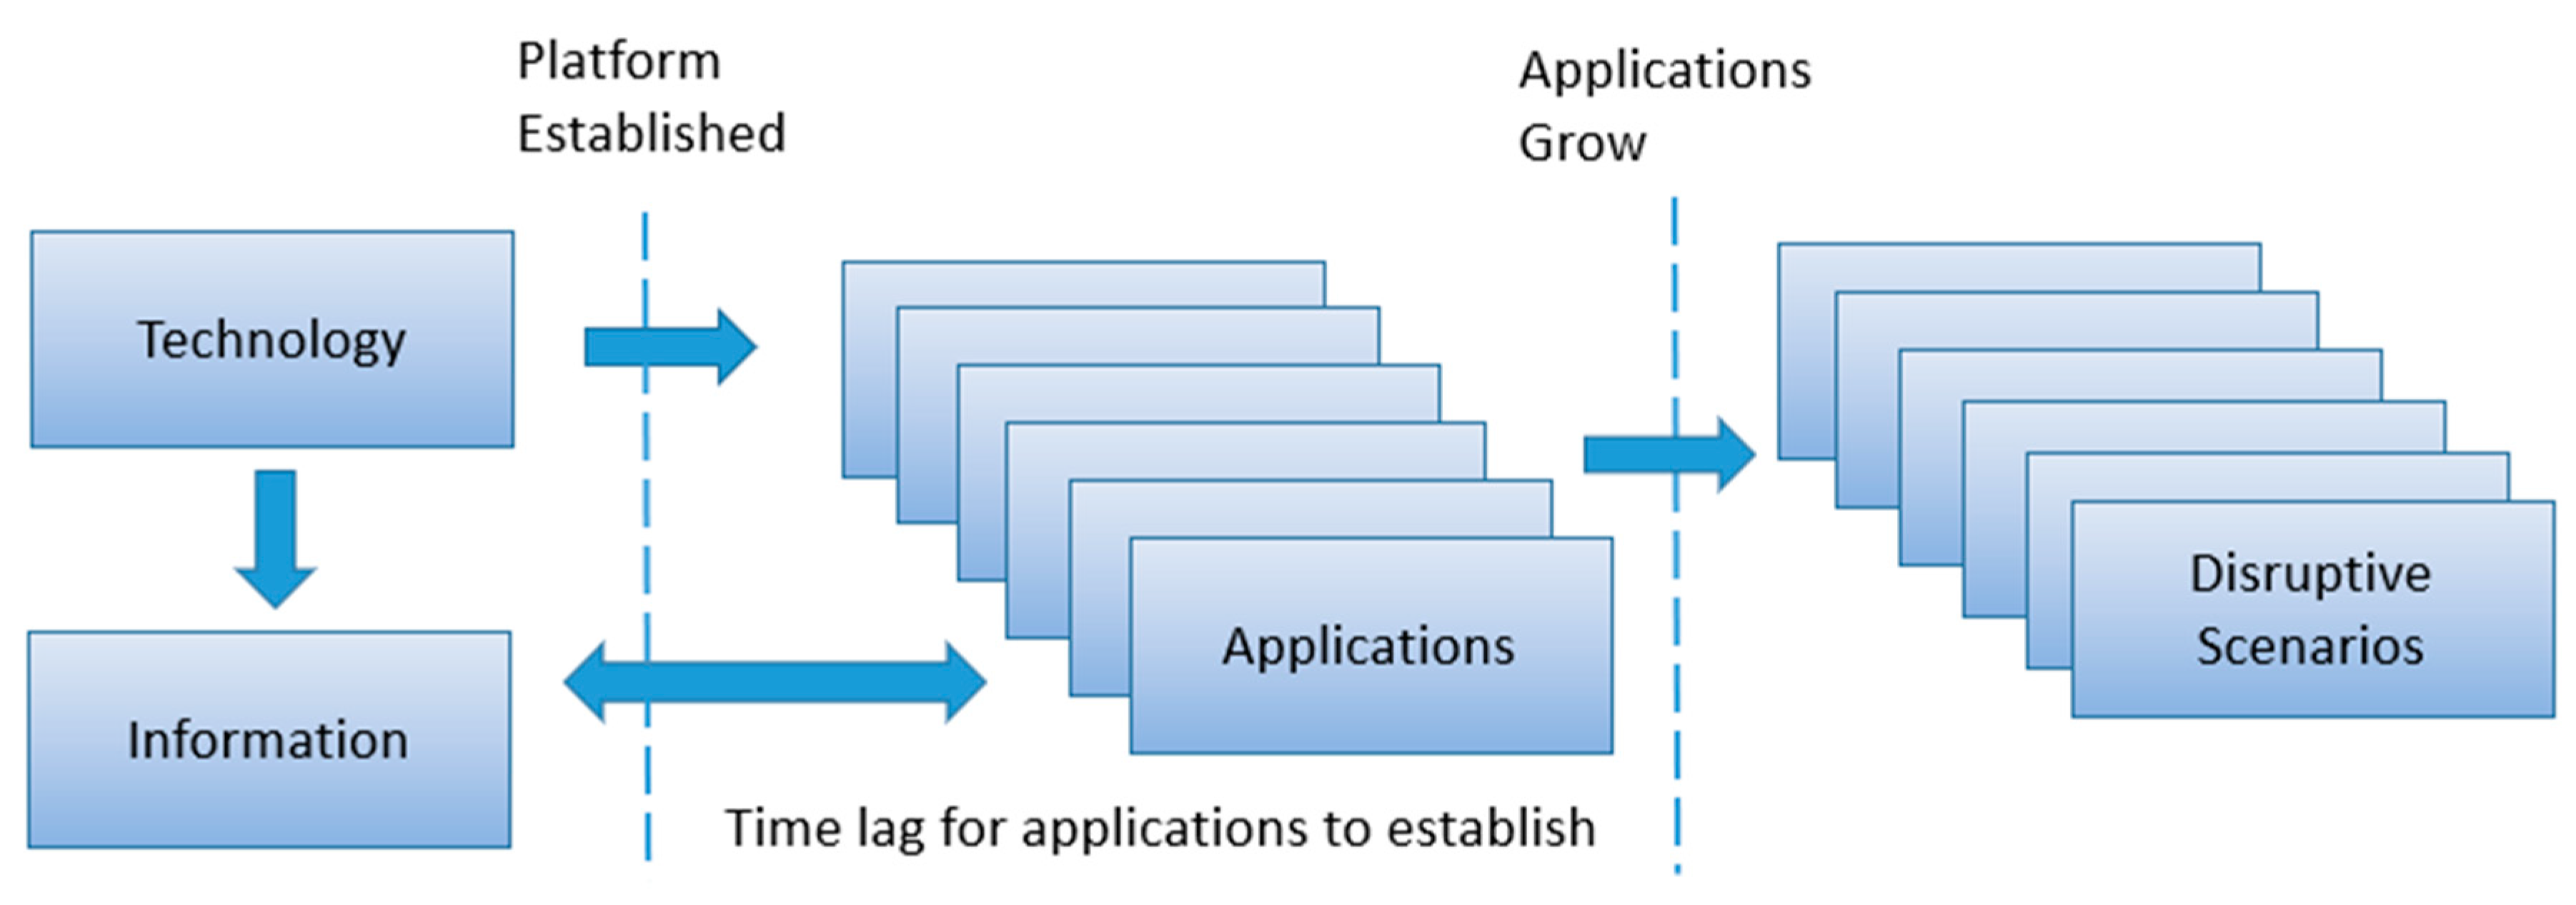
12]), suggests that technologies have an ecosystem (processes, practices and tools and even terminology/language). A platform is an incarnation of the Arthur cluster technology model. There are several platform types including technological (e.g., music media platforms, app-stores) and financial (e.g., crowdfunding models). It is viable to identify metrics (level of adoption, level of funding, etc.) which allow some form of analysis of the progression of these platforms. Brackin, et al (2014) [
24], suggested that, in the case of smartphone evolution, the platform is typically a second phase in a technology evolution, where the first phase is the establishment of a sufficient group of technologies to provide the platform (
Figure 8).
Once established, a platform facilitates easy/fast entry for developers and, thus, a significant level of exploitation because the cost of developing new apps is relatively low and there is a wide market for the apps created.
This model suggests that while single fundamental technologies may have a significant disruptive effect so may combinations of technologies (e.g. the smartphone platform). The growth of such derived technologies is potentially easier to monitor. In Part 4 we consider how it might be possible to monitor an evolution of such component technologies into a new, disruptive composite or domain technology.
4. Harnessing the Power of Indicators
Above we have considered possible models of technology evolution. Now we consider whether the range of technological outcomes—specifically technology success in terms of adoption—can be narrowed, making targeting or further research and development more informed and allowing risk mitigation in terms of uncertainty. Based on the models in part 3, we consider how to produce measurable indicators that might reduce technology outcome uncertainty, providing indicators for policy intervention and allowing earlier exploitation or mitigation. Many previous attempts to predict technology success exist and success has been no better than random (for example, the industrial strategy of ‘Picking Winners’ pursued by the UK Labour government of the 1960s and 1970s of, which in the event it has been suggested, largely picked losers (HM Government Green Paper 2017, p. 9) [
25]). We describe why our approach, whilst not promising prediction success at all stages of the technology evolution cycle, does offer the potential to reduce risk and envelope of uncertainty in forecasting at all stages from the point that path dependency starts to become established.
General approaches to technology forecasting (e.g. expert committees) are well established. This paper suggests that more automated, domain specific identification of a range of trends over a longer term may provide indicators of the range of likely outcomes and therefore assist in strategy. The NRC reports, which are the most extensive review of the subject of prediction focus on a wide range of prediction methodologies, and identify some tools, but do not focus on objective measures of technology progress or potential indicators thereof, delivered using big data analytics. The research aims to address this omission.
In many fields of data analytics, the use of indicators is possible because of the unprecedented level of information available via the internet and the availability of big data. Mayer-Schoenberger and Cuckier (2013) [
21] argue that big data provides an analysis via indirect measures. For example, monitoring the progression of an influenza epidemic by the geographic disposition of search queries from potential victims (people with symptoms googling to see if they might be affected, located using their network (IP) addresses). The key benefit of this over government figures was the speed of indication. In effect it provided almost a real-time monitoring capability (a virtual sensor) to measure the geographic spread of the virus.
We suggest that a big data analytics approach can be applied to technology disruption forecasting. The measures possible include identifying or ranking a set of most likely disruptive technologies in a set of domains or the likely disruption of a given technology over time and space. The research aims to exploit both direct causative and indirect correlated but non-causative indicators. The prediction precision may only allow narrowing of the potential set of disruptive technologies rather than a specific prediction but still has value through directing focus on to those specific technologies in a domain. This is consistent with other big data analytics strategies.
We consider the opportunity of using big data analytical techniques from three aspects. Firstly, a key element of developing and exploiting indicators is to have a sufficient model of the system being measured so that indicators can be put into context and exploited (see part 2, above). Secondly, the potential indicators that could be produced are then considered. Using big data techniques and internet sourced data, it is unlikely that such indicators will provide a direct causal measure. Thirdly, and finally, a method to validate the indicator approach.
This paper does not try to fully describe an experimental architecture to provide a range of indicators to populate the models described above. The development of a platform to do this is in progress and will be the subject of future papers in this field by the authors. However, we consider it useful to at least examine a practical example of using public data to assess disruption in relation to one aspect of the above model. Some of the big-data techniques are applied (proxy measures in particular) but we do not consider this experiment to be an application of ‘big data’ in its true sense. It is a pre-cursor proof of concept demonstrating indicators can provide insight into disruption.
To do this the example of the development of the smartphone platform as a test case is considered (part 5, below) and its relevance to the particularly to the model shown in
Figure 8. The smartphone platform is a technology and ecosystem which is within the timeframe of available data (i.e. information is still available on the progression of smartphone technologies on the Internet to allow backtracking) and it also provides a full cycle model, from original technology through to the development of a platform and the subsequent development of technologies using that platform in the explosion of Apps we see today. There are also strong links back to institutional research, as identified by Mazzacuto (2011) [
8].
Two key elements need to be measured. The first is the evolving state of the model of technology and its influence (disruption). The second is the dynamics of the model; how does it evolve as time passes and what clear patterns can be used to narrow the range of possible directions it could take. These are key elements of any ‘monitoring system’ for technology evolution. The indicators may be subtle and almost certainly indirect. There is also a geographic element to technology development (its effect is not only progressing in time but also in location). Each of these aspects is considered.
As a first experiment to identify if the approaches of Mayer-Schoenberger and Cuckier (2013) [
21] were applied to technology forecasting, specifically: using data/analytics rather than subjective measures to characterize disruption; analysing all the collected data from a source (in this case Apple and Uber), and; using a proxy measure where a direct measure is not possible, an initial experiment was undertaken. This was not an extensive experiment exploiting the entirety of the model described in part 2 but, instead, a proof of concept run using historical data where the outcome is already known, thus offering a test case.
The question posed was, ‘Is it possible to identify if the geographic spread of disruption is measurable over time from websites which exploit a given technology’? In particular, we considered whether we could use indicators to validate the model shown in
Figure 8 which suggests a time lag from technology availability to disruptive effect from an exploiting application. The technology chosen was the smartphone to determine if we can correlate the geographic distribution of smartphones over time against an exploitation/disruptive effect, again geographically varying over time, of a well-recognised application (in our case the taxi management application Uber).
5. Technology Progression: A Case Study
The following case study considers two elements of the progression of the smartphone. First, smartphone evolution as a technology and how it developed into a platform, and second, the platform effect resulting in individual disruptive applications exploiting the technology (and particularly their geographic spread).
Today’s smartphone platform meets Arthur’s (2009) [
9] criteria for a technology domain. It is a collection of technologies which in combination provide a powerful platform. It also follows the platform pattern described in Langley and Leyshon (2017) [
11] and Srnicek (2017) [
12]. The smartphone platform is more than the technology in the phone itself; this was true even of previous generations of mobile phone (which were dependent on the cell network). The smartphone platform includes the internet, the app store infrastructure supporting it, m-commerce, social media, underpinning mapping and routing information, and on-line sources of sensing. See
Figure 9.
These technologies break down into further clusters, and eventually into specific fundamental technologies (such as the use of Lithium chemistry to construct more efficient batteries).
There was also a competition between putative platforms, in line with Arthur’s premise that initially a wide range of technologies have the chance to succeed. At the beginning of the smartphone era, between 2000 and 2006, there were a range of companies active in this market, including Nokia, Motorola, Blackberry, Sony, and Microsoft. It was not until the 2006–2007 that smartphones, with sufficient display quality and interactivity became available (for example, Apple’s iPhone and iOS operating system, and the manufacturer, HTC’s phones using the Android operating system) to support advanced apps, that the market developed.
Apple’s uniquely integrated two-sided platform (involving iPod/iPhone hardware, the easy to use user interface and the iTunes platform), moved seamlessly into the role of providing the primary smartphone capability. As it became established, its probability of success moved from low, as one of many, to a dominant position. The success of this platform was its integrated nature, so the actual phone hardware was not necessarily critical. More important was the web integration. Apple also made the experience more seamless with its own stores offering products and on-the-spot support. This in itself was a notable business disruption, moving control of the platform from the network operators to Apple and the smartphone system providers. Smartphones are not yet globally available with some poorer countries still using the simpler feature phone technology. For smartphones to work it is essential that the communications/cell infrastructure is in place with sufficient data capability (e.g. 3G technology), plus there is price-point sensitivity in developing nations (individual wealth compared with the cost of smartphones at the time). Hence, smartphones fit the model of Arthur (2009) [
7] and Christensen (1997) [
4], that technologies are constrained by their weakest link (in this case availability of communications infrastructure, and cost of production).
Over time, smartphones have become more viable because of technologies such as lithium batteries and other fundamental developments which reduced weight and increased run-time improved usability in a broad consumer market. As a result, smartphones reached a tipping point (Gladwell, 2000) [
26] to become firstly disruptive, but then an incumbent technology, supporting many applications (phone, navigation, social interaction, photography, etc.). Once the smartphone developed as a platform there was an opportunity for external developers to exploit the platform (Simon, 2011 [
27]), but this process takes time. Early smartphones were limited to basic web browsing and navigation, but after series of iterations of the platform and business models, more complex apps such as Airbnb and Uber developed. The ability to exploit the platform may not be simply technological; it is also related to available data (social media, mapping data, etc.), or market need (financial viability) by the platform. A key element of the progression is the significant drop in the cost of entry to provide a commercial offering because of the platform’s inherent level of support for easy distribution, payment system support, data, etc. This allows smaller innovative organizations to deploy as easily as existing businesses; Brackin, Hobona and Jackson (2014) [
24] have characterized this characterization shown in
Figure 8 (identifying a significant delay from platform deployment to application disruption. In this model the deployment time lag can also be due to regulatory, legal or safety constraints (as, for example, in the case of Uber).
The Global Positioning System (GPS) was not available in most smartphones until July 11th, 2008 when Apple released the iPhone 3G in the USA, which also promoted the capability of turn-by-turn navigation from the phone. We could, therefore, consider this date as the real birth of pervasive location-based services (LBS). Adoption was not synchronised globally. The release of the iPhone and the HTC Android phone three months later were received with very large levels of adoption in the USA. The adoption pattern was richer countries adopting quickly and countries in the third world catching up later. Several sources, (e.g., Ericsson Mobility Reports (2012–2017) [
28] show that in 2015, while over 75% of phones in the USA were smartphones, this was only true of 48% of phones in European countries, and for sub-Saharan Africa only 25%. The ability to deploy LBS-based taxi services (such as Uber) is facilitated by, but also limited to, the availability of the smartphone as an essential prerequisite.
As an example of a disruptive application (which is a candidate for the model shown in
Figure 8) we consider Uber (the smartphone-based taxi app). A start-up as recently as 2012, Uber has progressed to being a global business operating in hundreds of cities across the world. Uber fits the model shown in
Figure 8 as it was not the ‘core’ target of the location-enabled smartphone technology (which was more focussed on applications such as navigation).
The Uber app has led to significant disruption in the taxi industry globally; it is disruptive because it addresses critical gaps in traditional taxi and minicab services, particularly in cities by providing an easily accessible service, availability/status information, and rapid payment, all achieved via the same platform. For drivers, it offers a flexible business model and access to a wider pool of customers than those approaching a taxi rank. It also guarantees payment and frees drivers from the need to carry cash (although this is ultimately dependent on the market in each nation—Uber has had to respond both to local taxi customs and the availability of credit cards for payment registration). Uber requires minimal direct physical or human resources in order to expand (it is in effect a concession model, based on owner/drivers) and the taxi ordering process is fully automated through the app, removing the need for call-centre staff. As a result, the business can ‘scale’ quickly.
There are jurisdictional issues (for example laws conceived before, and in conflict with new technology approaches) as well as direct opposition from incumbents but a key prerequisite for Uber deployment is the availability and adoption of the smartphone platform. In part 2 it was suggested that disruption from an application only occurs sometime after it is technically possible because of many factors. These are summarised in
Figure 10 for Uber.
Having considered the evolution of the location enabled smartphone platform and a key disruptive application is it possible to objectively measure and compare the progression of both the smartphone and disruptive application based on it? Uber is a disruptive application that evolved from a need (identified by the founders of Uber) which could be addressed by a newly available technology. A key question is whether there was a lag between the availability of location-enabled smartphone technology and the availability of Uber in the way that the model shown in
Figure 8 suggests, and, if so, is the lag measurable? This is the subject of the experiment described in part 6.
6. Experimentation: Smartphone Availability versus Disruptive Applications
In order to assess if the model shown in
Figure 8 is valid, and to try and obtain an objective measure of the time lag it predicts in a real situation, an experiment was devised undertaking a historical assessment of smartphone technology availability (both geographically and in time) against Uber deployment (the disruptive application). The goal was to answer the question ‘can we objectively and comparatively measure the progression of both over the last 10 years’.
The Ericsson data described in part 5 provided an indicator of the geographical expansion of the mobile platform over time, but the information is coarse. A more precise measure was needed. Thus, a proxy indicator was considered to measure the spread of smartphone technology in line with a big data approach (a correlated proxy measure). Apple has been a leading supplier of smartphones for over a decade and sells phones directly to customers, so an Apple Store presence might, as a proxy, also indicate the level of smartphone uptake by country or region. The postulate is that the presence of an Apple Store in a city is a good indicator of the widespread availability of smartphones in that location (or at least deployment will follow shortly afterwards); it will be an underestimate as iPhones are available from other sources, but it would be expected to have some correlation with phone purchases. Apple has, over many years, published a list of store locations on their website. The experiment exploited this by scraping these locations from the Apple web site and analysing them. The same approach was applied to Uber which publishes a list of locations where services are available on its web site. It is good practice to validate a proxy indicator against a real indicator. The best approach possible in this case was to compare the Apple prediction of spread against the Ericsson prediction. The two show similar deployment patterns and so it is suggested the Apple Store openings is at least no worse a measure and potentially offers more precision. There are other measures, for example mobile phone mast deployment but none that are as easily accessed.
The soundness of Apple stores as a valid measure of smartphone availability needs validation. Apple is only one supplier of smartphones. However, since the metric required was ‘are smartphones widely distributed in the city of interest’ and Apple accounts for a significant part of the market (close to 50% over the period of study), the availability of an Apple store is a valid measure of smartphone availability as it is unlikely that smartphone availability will be widespread without Apple’s presence. There are special cases but Apple store numbers is a measurable property and, as argued above, is a valid general proxy for smartphone availability.
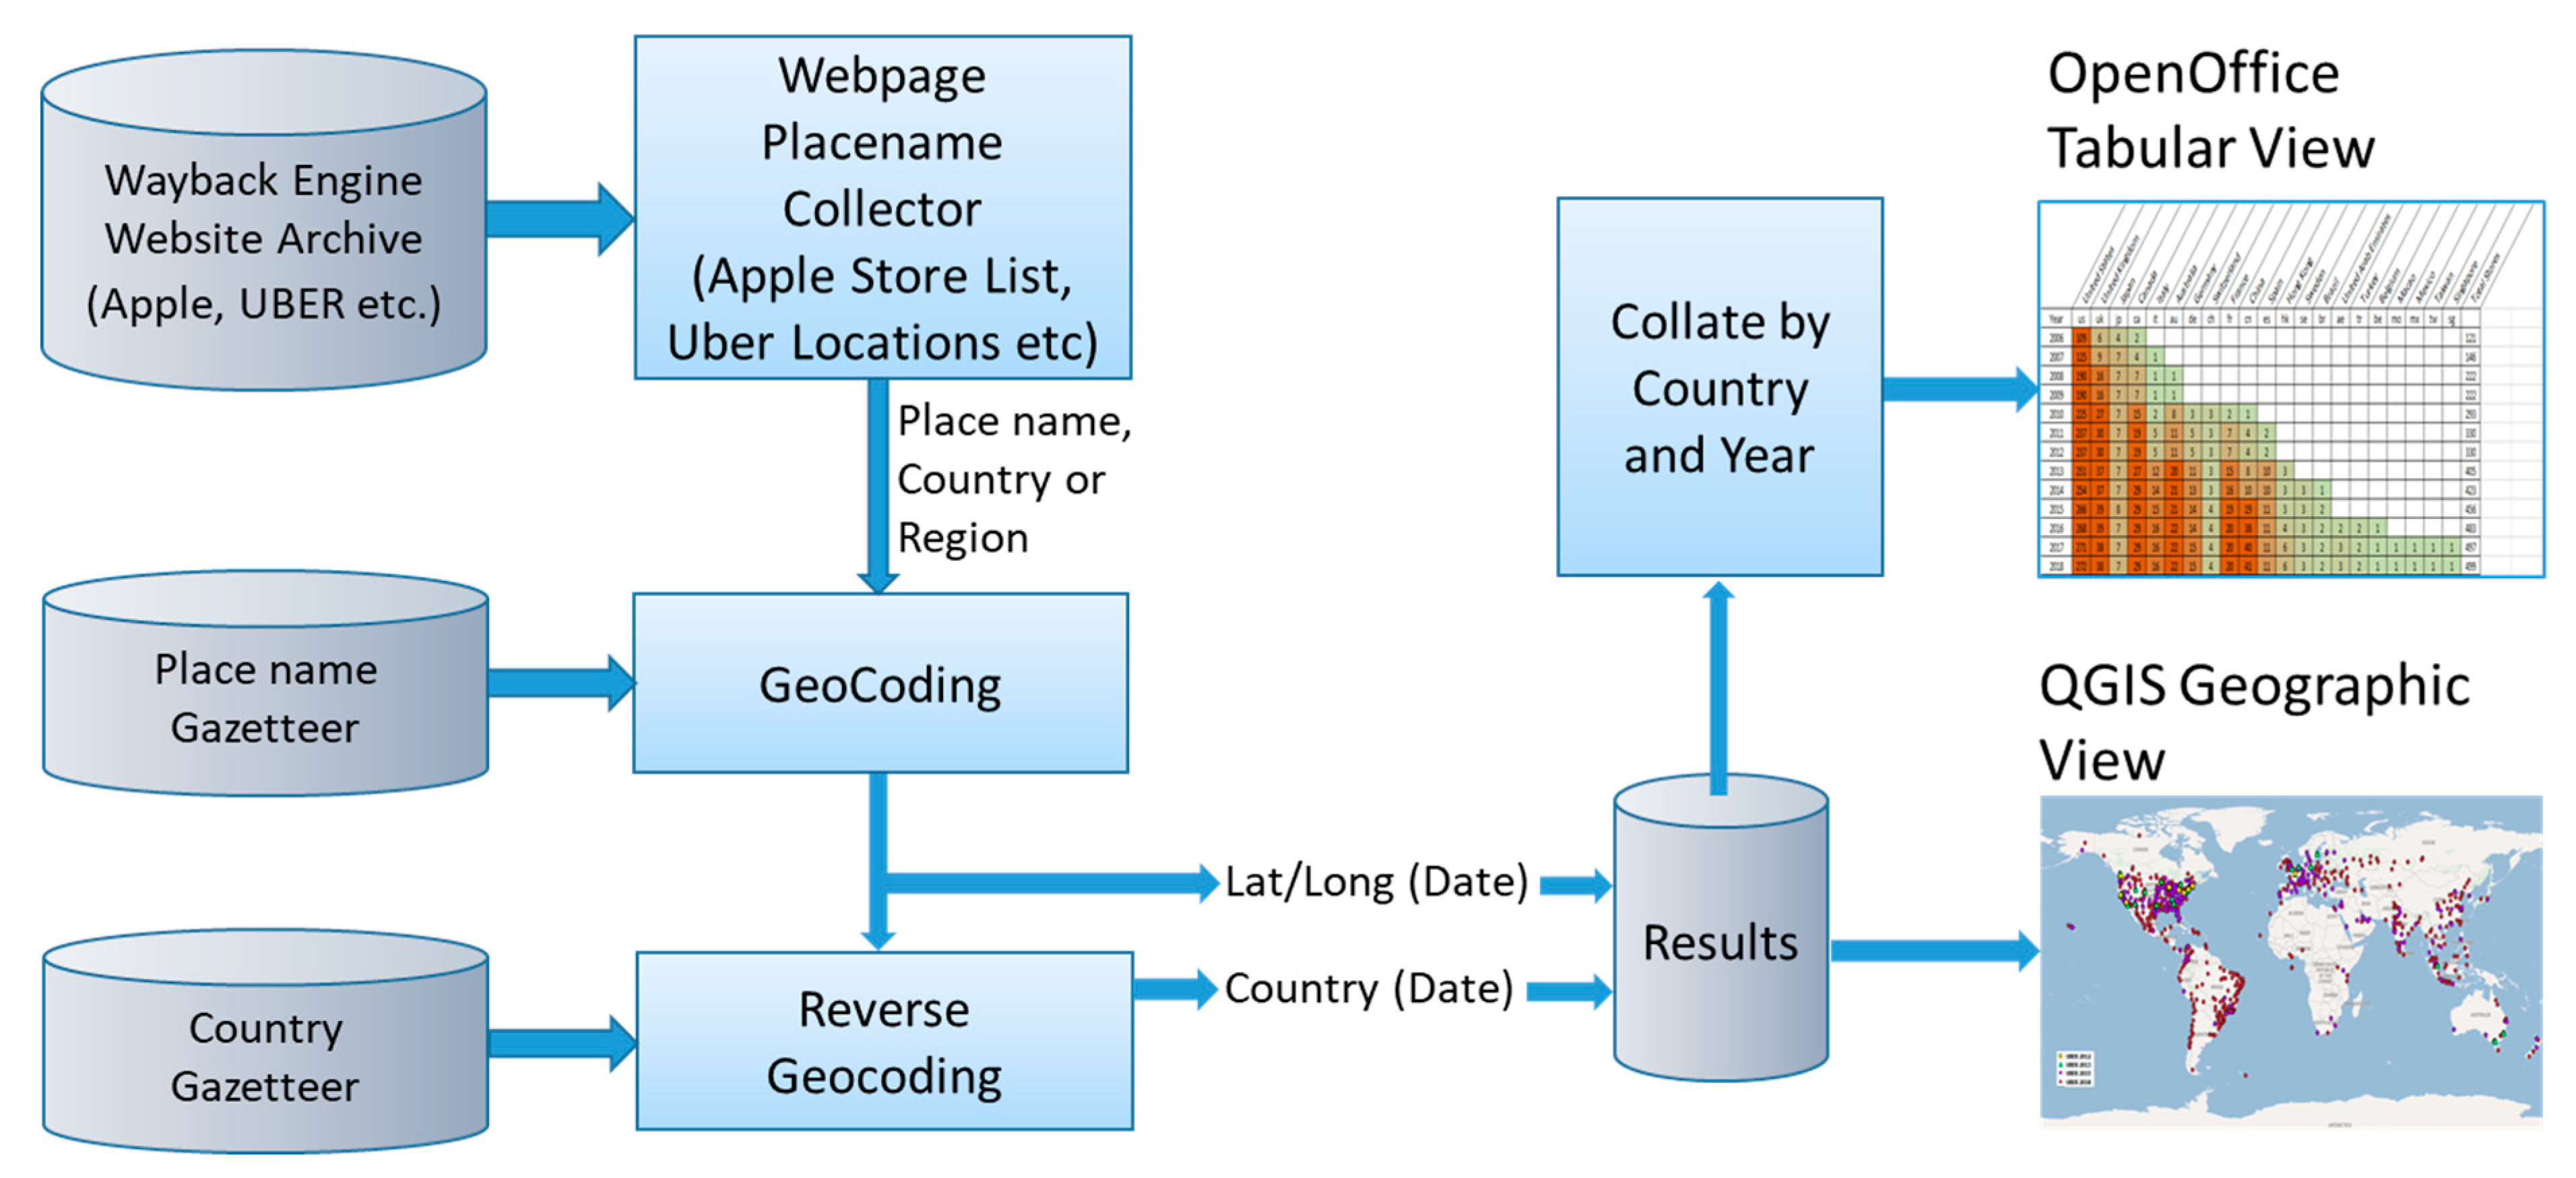
A similar approach to identifying occurrences was applied to both websites, Apple (store locations) and Uber (service locations). Both websites describe the current state of the service (stores or services), but to obtain details over a period (e.g. per year) the Internet Archive’s Wayback Engine was used which provides regular historical snapshots of existing websites (Apple and Uber). Data was available over the last 12 years. The pages for Apple and Uber over the last decade were automatically scraped for listed cities. Each city name identified was geo-coded (also using the country/region as a qualifier) with the GeoNames open source gazetteer. The results of the capture were imported into OpenOffice spreadsheet (to display the tabulated results) and by QGIS (an open source GIS package) to visualize the results geographically. The experiment architecture is shown in
Figure 11.
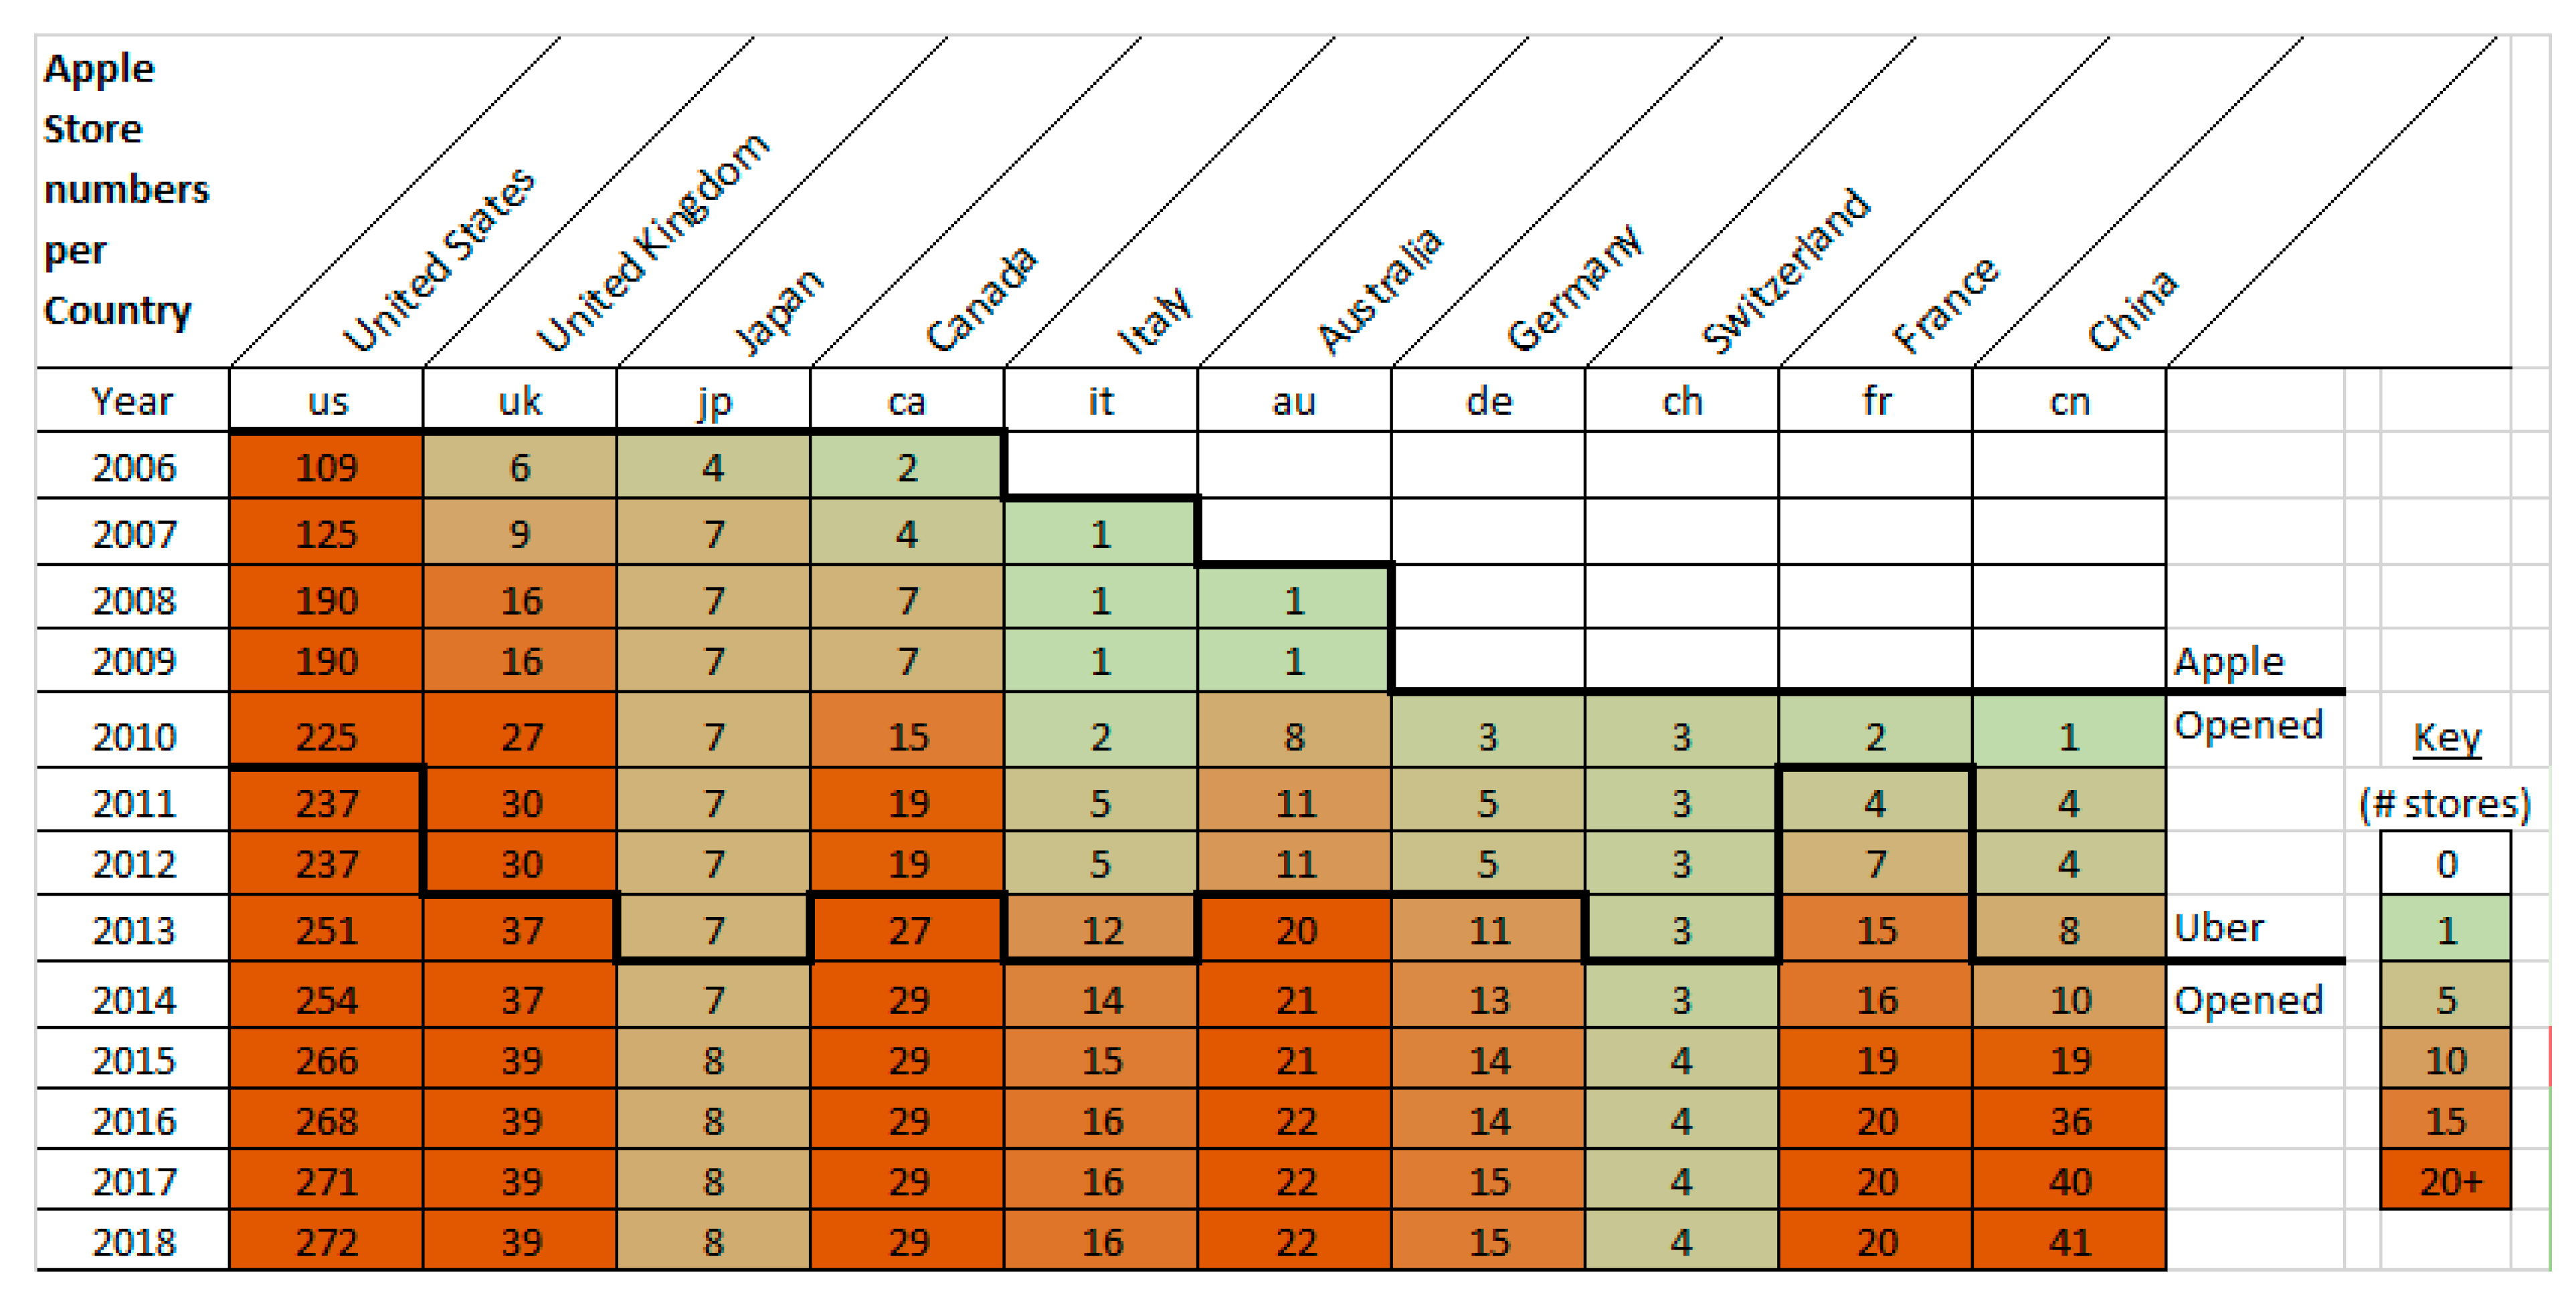
The store locations from scraping the Apple website archive over the last decade were tabulated and sorted, and displayed as tables and geographically. The tabular and geographic outputs are shown in
Figure 12 and
Figure 13, respectively.
The cell numbers show the number of stores open in that country in each year. This offers potentially a more detailed assessment of smartphone deployment. The measure indicates the level of adoption country, region and place.
Figure 12 shows the first stores outside the USA were in 2006 in London and Belfast, followed by a handful of locations in 2010, and then significant expansion in 2017.
The correlation of the number of stores with smartphone deployment can only be indicative because, firstly, Apple is not the only supplier of smartphones, and secondly iPhones are not only sold in Apple stores; but it does provide a relative measure of the levels of smartphone adoption in a country/location. The pattern of results does show strong similarities on a region basis with the Ericson Study, providing some validation of the Apple store-based measure of smartphone deployment.
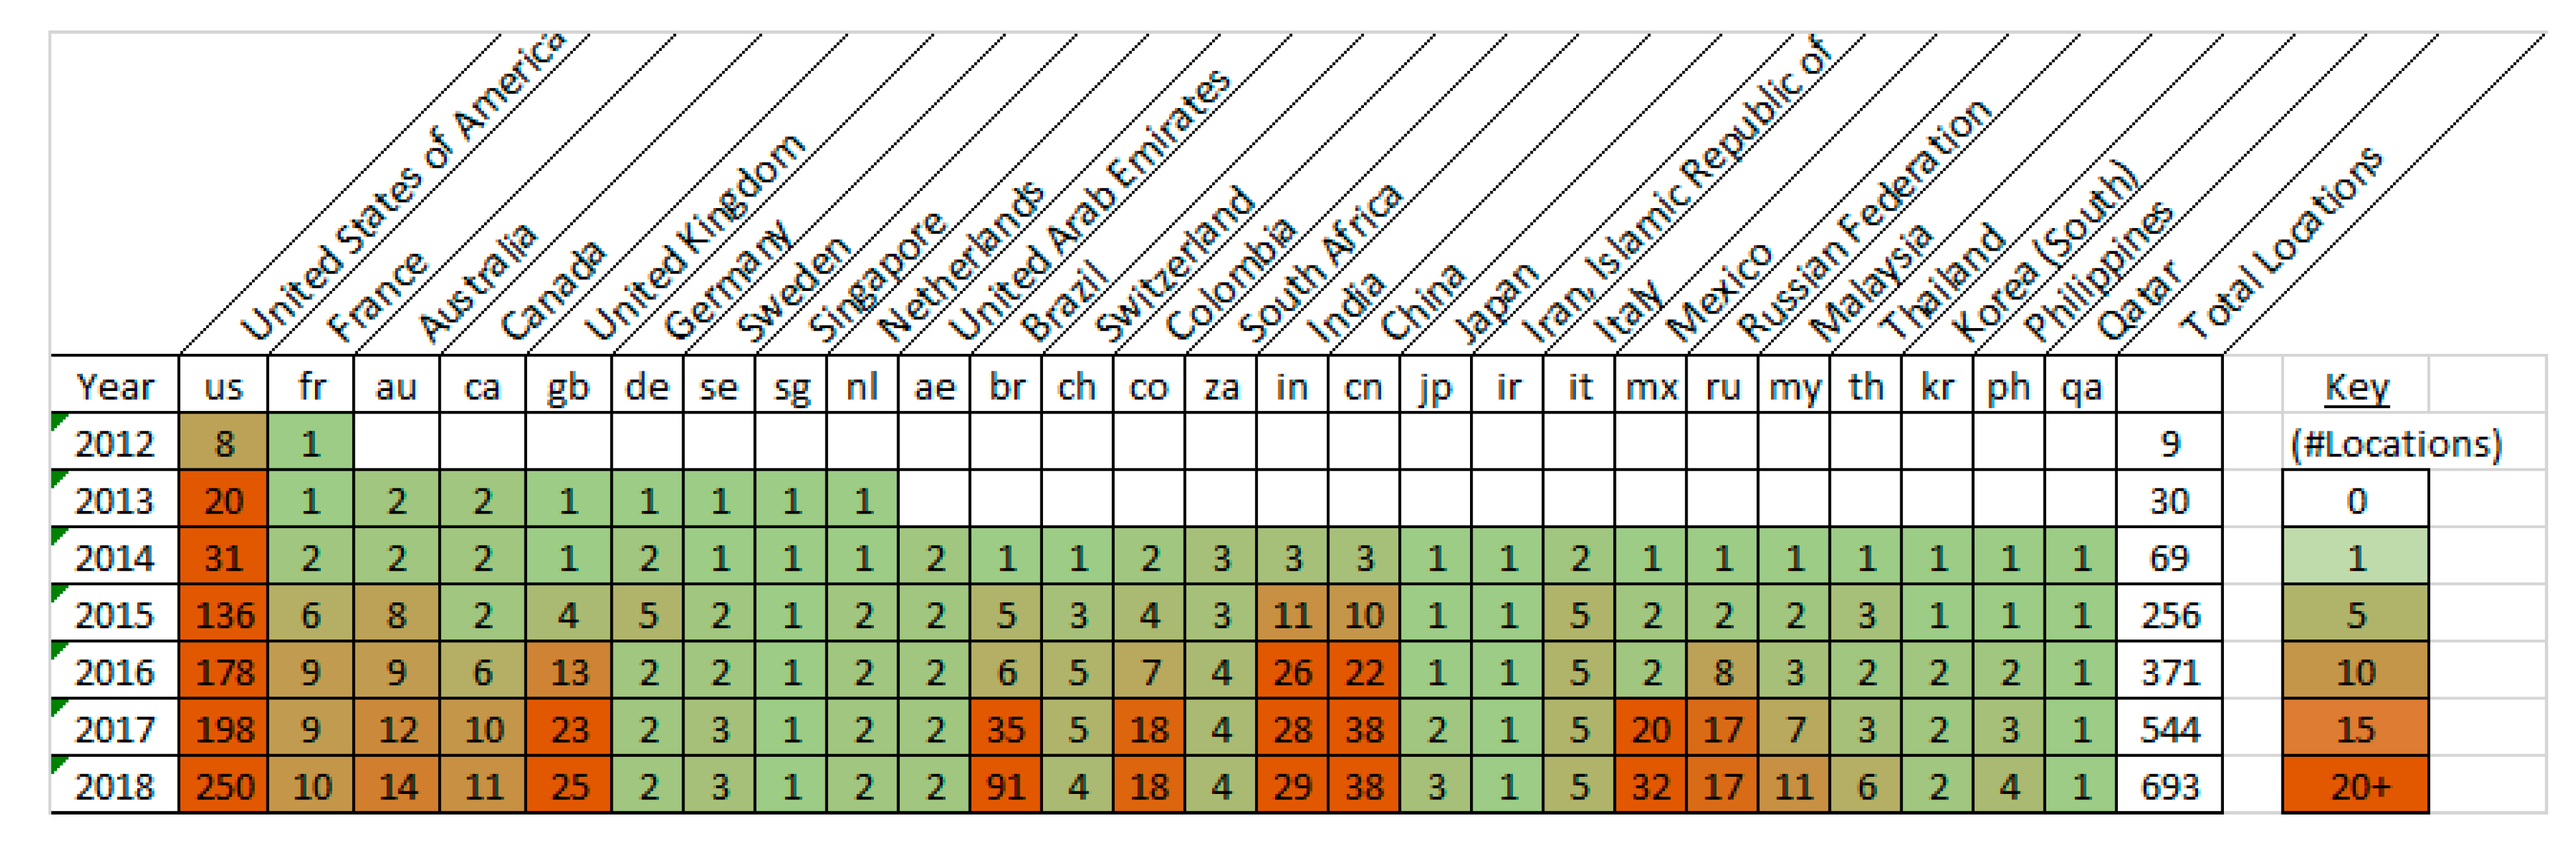
Similarly, the locations from the Uber website (as archived in the Wayback Engine) for each year since 2012 were gathered (by automated scraping) and collated. Results are presented in
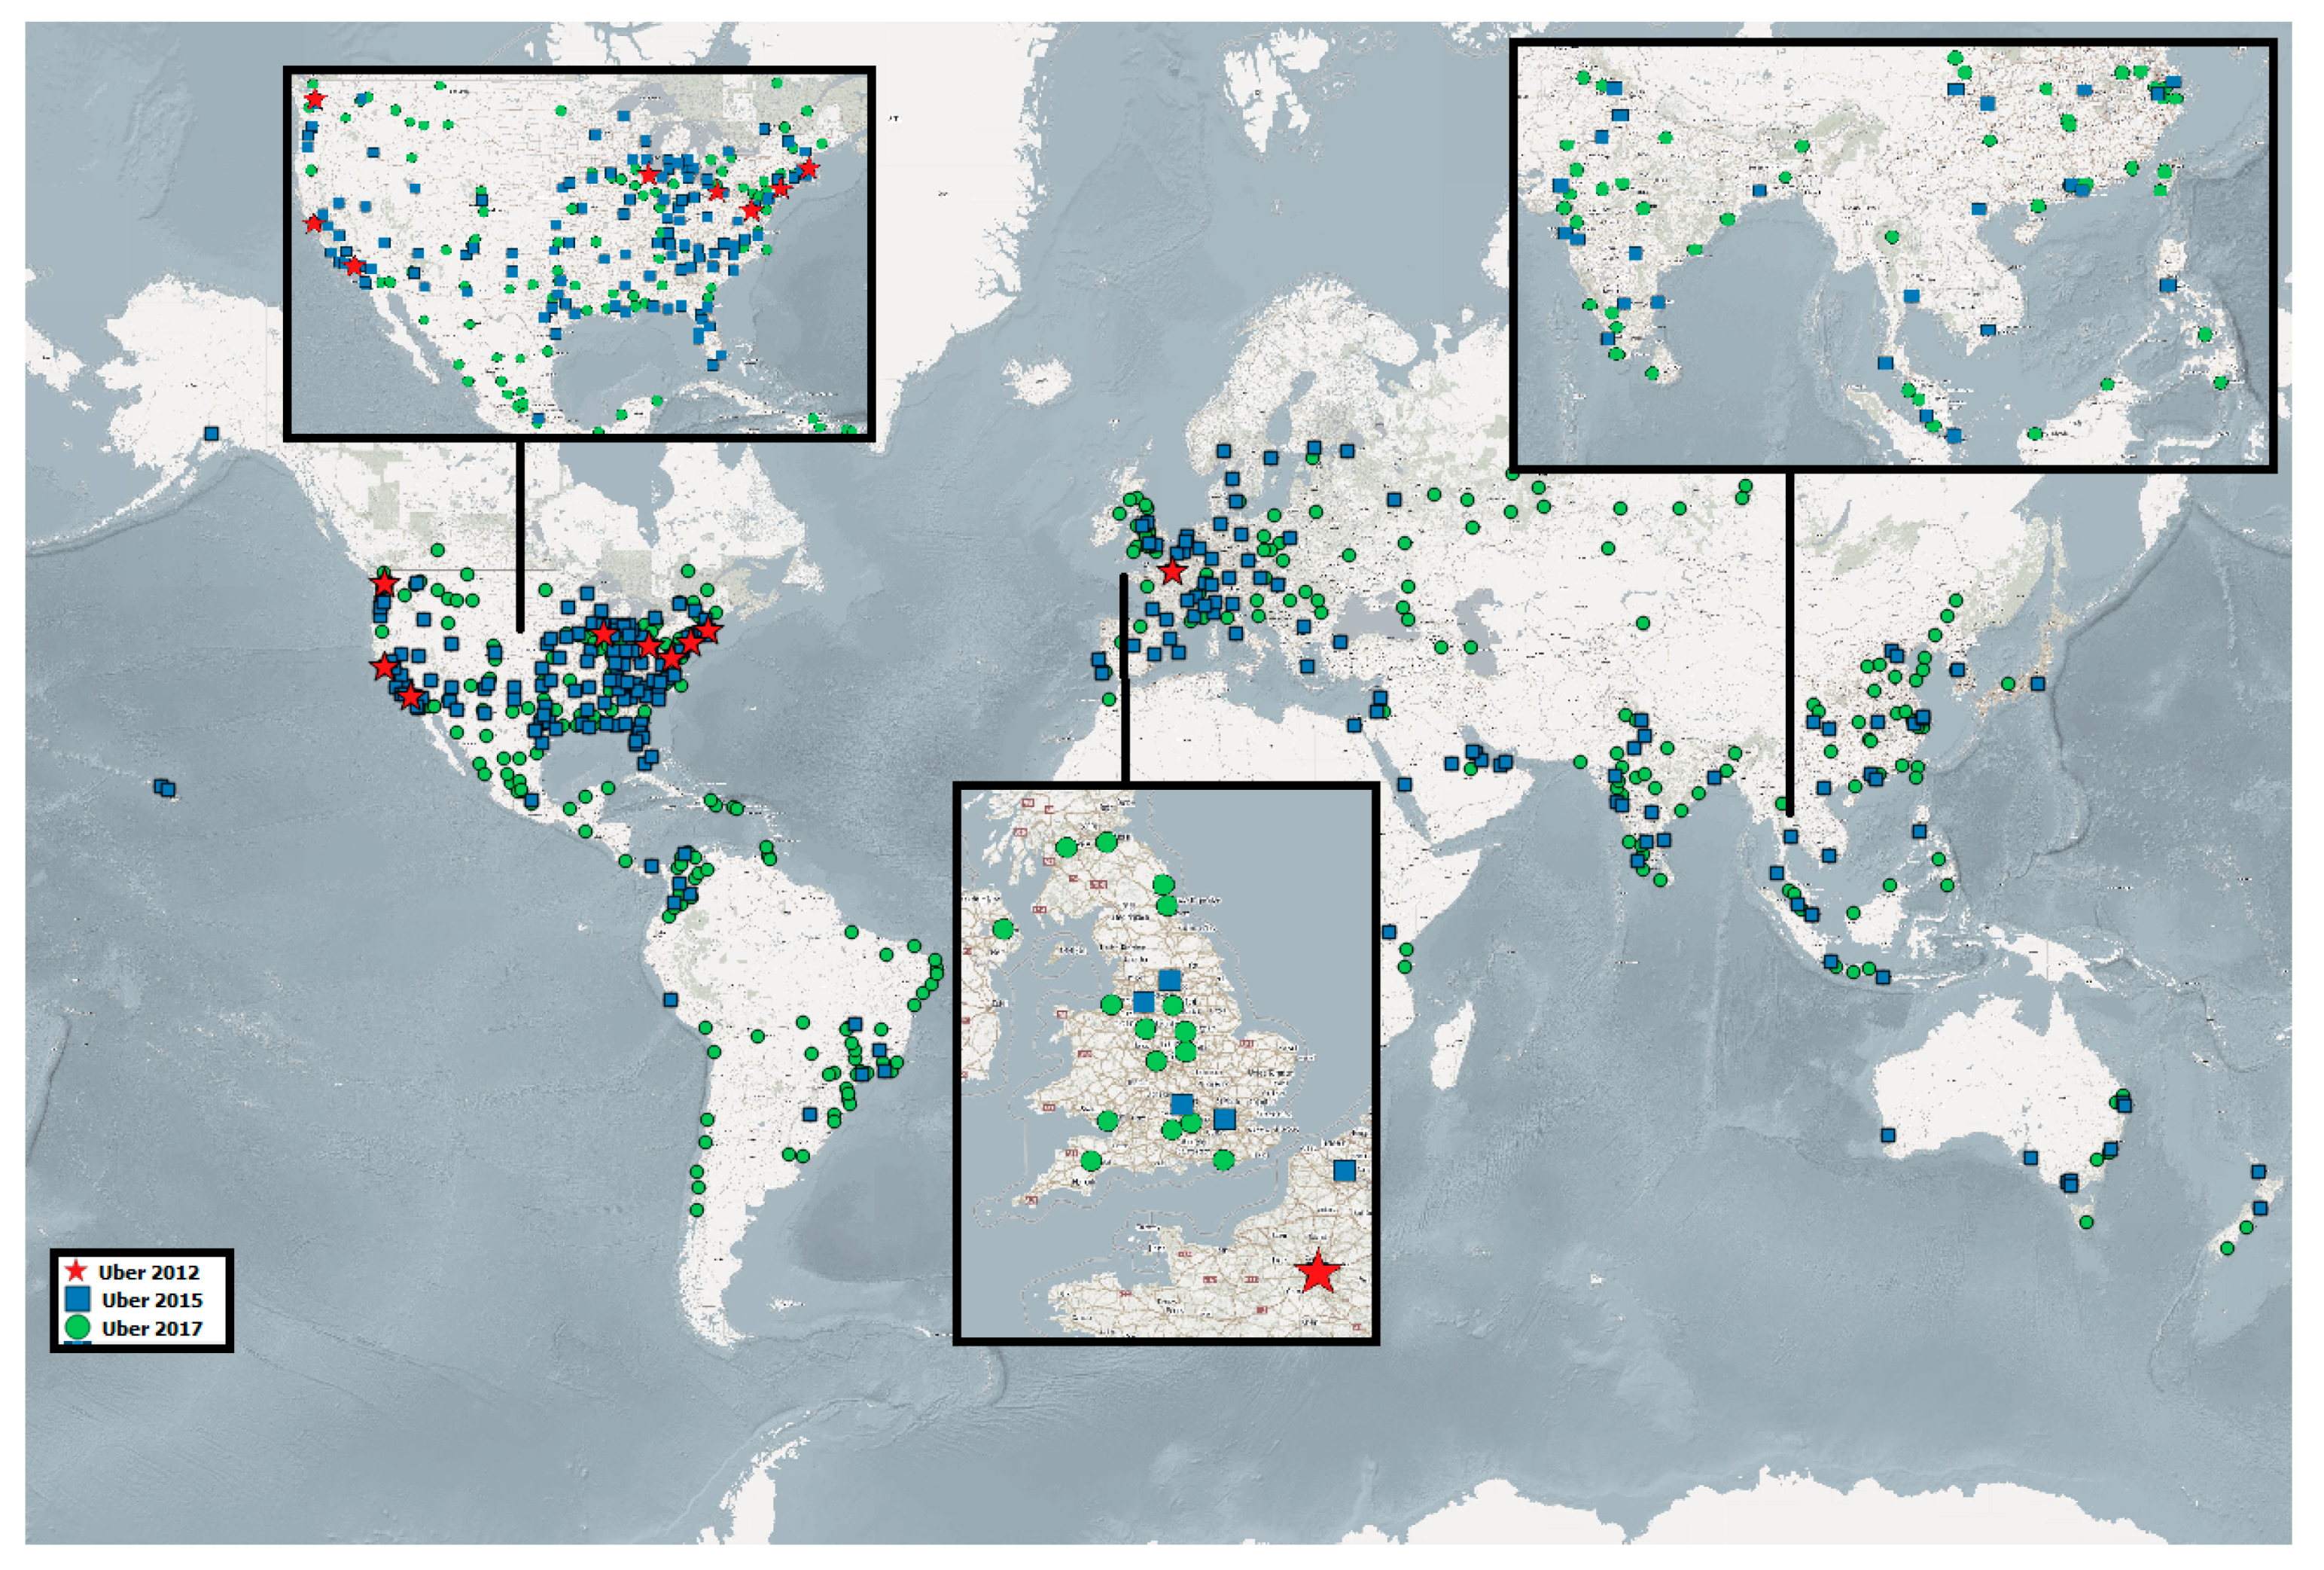
Figure 14 (tabulated) and
Figure 15 (geographically) for the top 20 countries where Uber deployed.
Results for three representative years from the above is shown plotted geographically.
The pattern of Uber’s geographic expansion suggests initial deployment in one or two cities (typically capital cities) in a given country and then expansion to other major cities in the following years. This may simply be because major cities are the most viable location in terms of potential customers, with critical mass, testing out the regulatory environment, but those living in cities are also likely to have the largest numbers of smartphones (in total, and per capita), due to high population density, high levels of wealth, and high availability of 4G and broadband hotspots.
The statistics for the regional deployment of Uber show that deployment is in line with, and lagging behind, the availability of smartphones (derived from the Ericsson Mobility surveys). After the USA, Uber placed its first services in France, but then quickly moved on to East Asia which shows the highest density of smartphone use outside of North America (results shown in
Figure 16). While more deployments, such as in Europe did follow, it appears that East Asia was given priority by Uber. Only in 2014/2015 is there any noticeable deployment into South America and this correlates with its low uptake of smartphones compared with standard devices in that area. Similarly, Africa has not been an early choice for deployment. However, comparing the Uber results to the Apple Store openings, the proxy measure (the results in
Figure 12,
Figure 13,
Figure 14 and
Figure 15), indicates there is a level of apparent correlation between an Apple Store opening in a country and Uber deploying its services using measures of order of city/country opening and delay in years. The first occurrence of both an Apple store opening in a country and Uber deploying in a country were tabulated. The results were both sorted by date. Initially Apple pre-dated Uber by a number of years. This gap reduces over time.
Figure 16 shows the correlation for the top 10 countries with Apple stores and Uber services. The deployment year for both Apple and Uber in each country is shown by a black line. The top 10 Uber and Apple stores correlate with deployment (100%) with Uber lagging apple by between two and eight years.
There is also a time lag (consistent with the proposition illustrated in
Figure 8), with Uber following on several years after the Apple Store has opened in a city (and typically when the number of Apple stores in a country reaches double figures). Exceptions exist: Uber was deployed in France just two years after an Apple Store, potentially explained by Uber folklore. The availability of smartphones is not the only factor so complete correlation is not expected, but the results do demonstrate using a measurable proxy indicator approach taken from big data methodology (e.g., Apple Store openings as an indicator of smartphone deployment status) has potential as a technique and, as a predictor disruption level from an app (Uber deployments), does indicate the potential of this paper’s proposition.
Data gathered during the experimentation described herein and the analysed output (as spreadsheets/csv files) is available for review. Please see
Supplementary Materials below for details.
7. Conclusions
This paper has outlined research related to assessing future technology trends and looked at how these trends could be monitored using big data approaches. Part 2 described some of the key underpinning theoretical research, particularly from Arthur and Christensen on both the anatomy of technology and the typical developmental aspects of technology which cause disruption. Our research uses these as primary pillars, but draws in work from other researchers, in particular Mazzucuto, Mokyr, Srnicek, Langley, Leyshon, and Martin, all of which offer components to enhance the high-level models of Arthur and Christensen. The paper looked at both measures of technology progress (characterized by both the TRL Level (NASA) and the hype cycle (Gartner) as well as considering the state of research around big data which represents a method of assessing technology progress.
Part 3 described an implementable model based on the theories from Part 2. It described the underpinning framework for the various metrics/indicators which could be used in assessing technology progression. The model captures both the technological aspects and the eco-system in which the technology exists. It outlines the more specific model which describes the behaviour as a technology coalesces into a platform. The conclusion is that the various theories do interlink and together offer the potential to support a set of measures of disruption.
Part 4 examined those measures or indicators and suggested two specific indicators which can be generated using big data approaches and technologies. The first identifies that any new technology requires a range of supporting technologies, and if the progression of all the components can be assessed individually then an overall progress assessment can be made.
The empirical part of the paper described a measure of progress of a technology geographically and over time. This was an initial proof of concept, testing the idea of indicators in a limited scope example as a precursor to a broader set of experiments to be described in future papers (exploiting big data and predictive analytics). An implementation could scan a relevant website offering a technology which is identified as disruptive and assess its growth over time and geographically. The technology to support a broader set of indicators is under development and shows promise. The results will be the subject of a future paper. Research on the indicator described within this paper (measuring geographic expansion of a platform as an indicator of potentially disruptive geographic expansion of an app on the platform) also shows promise. Further work on parallel examples of this will also be undertaken for future papers.
Part 5 provided a case study of technology progression into a platform and the resulting disruptive application deployment. It considered the progression of the smartphone, which fits the model of a hybrid technology described by Arthur, and the platform concept. It also considered the model of the time-lag from underpinning technology deployment to disruption through new applications.
Part 6 described a practical experiment using historical data and looked at a macro level at the deployment of the smartphone platform over time and geographically, considering what indicators could be used. The first indicator was derived from Ericson reports on the smartphone market development. The second indicator was derived using the data-driven technique described in part 4 to generate indicators of smartphone growth, the premise being that Apple Store openings are a proxy for smartphone adoption; this provides a more geographically specific measure (country/town as opposed to region): while the correlation demonstrated here is against iPhone deployments as opposed to smart phones in general, the results show it is a potentially useful indicator. The second part of the experiment looked at the deployment of Uber and also used the experimental platform to derive indicators of Uber’s deployment through time and geographically. Lastly, the Apple and Uber examples were compared. Based on the results described herein, the premise described in part 2, that there is a significant and to some degree predictable lag between technology availability and applications exploiting it was shown to be valid. Results showed Uber deployments tracking Apple Store openings with a lag of approximately five years, and following the same geographic spread. This result indicates a level of prediction is possible using data analytics.
We conclude that while the research identified in part 2 offers different viewpoints that provide opportunities for measurement of technology progression/disruption, we have also shown that it is possible to develop measures and technology that support some of these indicators. Lastly, we have demonstrated that a degree of apparent correlation exists between such measures, suggesting, but not yet proving, the level of causality in the case investigated.
Future work will build on the consolidated model described in part 3 and will further develop both the analysis platforms and indicators which are more extensive than the initial example described in this paper. The goal is to assess if data-driven approaches, allied with a unified model, can provide automated indicators of technology trends which could make a useful contribution to current approaches in the fields of technology forecasting and business modelling. Whilst a completely automated, high-accuracy forecasting system for technology may not be possible, our approach can make a contribution to the improvement in the information available to forecasters and provide policy makers a more reliable basis on which to determine policy.


