Article

Revealing Spatial-Temporal Characteristics and Patterns of Urban Travel: A Large-Scale Analysis and Visualization Study with Taxi GPS Data

1
School of Environment, Beijing Normal University, Beijing 100875, China
2
Institute of Public Safety Research, Department of Engineering Physics, Tsinghua University, Beijing 100084, China
*
Author to whom correspondence should be addressed.
ISPRS Int. J. Geo-Inf. 2019, 8(6), 257; https://0-doi-org.brum.beds.ac.uk/10.3390/ijgi8060257
Submission received: 16 April 2019 / Revised: 26 May 2019 / Accepted: 28 May 2019 / Published: 30 May 2019

Abstract

:
Mobility and spatial interaction data have become increasingly available due to the widespread adoption of location-aware technologies. Examples of mobile data include human daily activities, vehicle trajectories, and animal movements. In this study we focus on a special type of mobility data, i.e., origin–destination (OD) pairs, and propose a new adapted chord diagram plot to reveal the urban human travel spatial-temporal characteristics and patterns of a seven-day taxi trajectory data set collected in Beijing; this large scale data set includes approximately 88.5 million trips of anonymous customers. The spatial distribution patterns of the pick-up points (PUPs) and the drop-off points (DOPs) on weekdays and weekends are analyzed first. The maximum of the morning and the evening peaks are at 8:00–10:00 and 17:00–19:00. The morning peaks of taxis are delayed by 0.5–1 h compared with the commuting morning peaks. Second, travel demand, intensity, time, and distance on weekdays and weekends are analyzed to explore human mobility. The travel demand and high-intensity travel of residents in Beijing is mainly concentrated within the 6th Ring Road. The residents who travel long distances (>10 km) and for a long time (>60 min) mainly from outside the 6th Ring Road and the surrounding new towns of Beijing. The circular structure of the travel distance distribution also confirms the single-center urban structure of Beijing. Finally, a new adapted chord diagram plot is proposed to achieve the spatial-temporal scale visualization of taxi trajectory origin–destination (OD) flows. The method can characterize the volume, direction, and properties of OD flows in multiple spatial-temporal scales; it is implemented using a circular visualization package in R (circlize). Through the visualization experiment of taxi GPS trajectory data in Beijing, the results show that the proposed visualization technology is able to characterize the spatial-temporal patterns of trajectory OD flows in multiple spatial-temporal scales. These results are expected to enhance current urban mobility research and suggest some interesting avenues for future research.

1. Introduction

Cities are concentrated areas of human activities, and urban spatial structures are closely related to the intracity travel patterns of their residents [1]. Identifying the patterns of intra-urban residents’ trips will help us better understand urban structures and reveal the driving social factors, such as gender and occupation [2]. As questionnaire-based methods are limited by a lack of data, it is difficult to use this traditional method to explore human mobility deeply and accurately. With the rapid development of location-based service (LBS) and information communication technologies (ICT) such as Global Positioning System (GPS) receivers and mobile phones, these technologies support the convenient collection of large volumes of individual trajectory data [3,4,5]. Currently, such data have been widely applied in human mobility pattern research [6,7,8,9,10,11,12,13,14]. The widespread adoption of big data provides unprecedented opportunities to study various mobility patterns from trillions of trails and footprints. Much research has been conducted to investigate the spatial-temporal patterns of human motion in urban centers including studies in cities such as Rome [15], and Tallinn [16], in addition to Hong Kong [17], Shanghai [1,18], Wuhan [19,20], and Shenzhen of China [21].
Vehicles equipped with GPS provide an important type of footprint, given that public and private vehicles are the main transportation means for a city’s population. People use vehicles for commuting to and from work, for regular and ad-hoc chores, and for leisure activities [22]. As a main part of the transportation sector, taxis provide accessible and flexible travel services for people living in urban centers. Although taxi trajectories are unable to reflect continuous displacements of specific people, which are crucial for a time geography framework, they describe collective human mobility patterns of intracity travels with accurate positions and time [1]. With information of when and where a customer is picked up or dropped off by taxi, meaningful trips corresponding to displacements between people’s consecutive activities are easy to extract. A careful analysis of these digital footprints from taxi GPS data can provide an innovative strategy to improve the quality of public transit services and facilitate urban public transit planning and operational decision-making [23]. This type of data has high accuracy and good continuity; they are acquired in real-time and support a high degree of automation. GPS taxi data can provide an excellent foundation for revealing urban residents’ travel behavior and analyzing spatial-temporal patterns [24,25]. Recently, GPS-enabled vehicles have been widely adopted to collect real time traffic data [26,27,28,29]. In addition to monitoring real-time traffic situations, a large volume of GPS-enabled taxi trajectory data has been used for travel time estimation, dynamic accessibility evaluation, and travel behavior analysis [30,31,32].
Trajectory and movement data have been studied with various approaches, including visual analysis [33], clustering [34], feature extraction [35], and movement pattern taxonomy [36]. Visual analysis tools enable interactive and intuitive data exploration. Visualization techniques have been used to reveal urban traffic patterns and explore commuting rules of urban residents, thus providing decision-making basis for smart city construction and urban traffic planning. Some scholars analyze and excavate residents’ travel patterns and patterns by visualizing origin–destination (OD) stream data of taxis [37,38,39,40]. A study by Yue et al. [37] uses the dynamic taxi data to reveal people’s travel demands and movement patterns in a deeper sense to serve transport management, urban planning, as well as spatial-temporal tailored location search and services. Guo et al. [38] presents a new methodology for detecting location patterns and spatial structures embedded in OD movements; this approach involves steps to group spatial points into clusters, derive statistical summaries, and visualize spatial-temporal mobility patterns.
The visual analysis of OD data is an important way to mine inter-regional flow patterns and analyze urban residents’ travel spatial-temporal patterns [41]. At present, there are mainly visual analysis methods for OD data of taxis, including Flow Map, OD Matrix, and OD Map [42,43,44,45,46]. Tobler [42] first used the arrow form of Flow Maps to represent the population migration flow data and to draw the population migration map of the United States. This kind of graph shows the flow direction and the width of the edge indicates the OD flow rate, but this often causes the OD flow line arrows to overlap each other, making the visualization confusing. It is more difficult to visualize the OD stream data of a large number of taxis under the spatial-temporal scales using the Flow Maps. Andrienko [43] first uses the OD Matrix to study the traffic conditions in Milan, Italy. In the OD matrix each row and column corresponds to a region; each cell corresponds to the flow of OD between a pair of regions. Although this method can express flow relations between different regions, it lacks spatial information (region to region) and is not intuitive. In order to compensate for the shortcomings of OD matrix in spatial information representation, Wood et al. [44] proposed an OD map method when studying the migration of the United States. The method uses a regular grid to divide the study region into a two-dimensional matrix. Next, a two-dimensional matrix is nested within each cell. The size of flow from one region to another is represented by the color of another area of the cell that is nested within the area. The depth of the color indicates the amount of flow. However, this method lacks the ability to express OD flow changes in the case of space-time multiscale. At the same time, domestic and foreign scholars have also built some visual systems to study the temporal and spatial patterns of trajectory data [45,46,47,48,49,50]. Guo et al. [45] presented an interactive visual analytics system—Triple Perspective Visual Trajectory Analytics (TripVista)—for exploring and analyzing traffic trajectory data. Hurter et al. [47] propose a brush–pick–drop interaction scheme. Their methods are general for 2D trajectory data, but with limited perspectives provided. Slingsby et al. [48] proposed a treemap cartography method to show spatiotemporal traffic patterns. Liu et al. [49] developed a comprehensive visual analytics system to study route diversity based on real trajectory data. Their system provides an intuitive way to compare and evaluate different routes. However, the above method is difficult to visualize trajectory big data in multiscale spatial-temporal, and it is more difficult to reveal the characteristics of OD stream data.
In this paper, a large scale study is presented that uses taxi GPS data collected from more than 25,000 drivers for seven consecutive days in Beijing, China. To support this study a new adapted chord diagram plot is introduced (refer to Section 2.3.2) that visualizes taxi OD flows at different granularities on a space-time scale. The new chord diagram plot is implemented using a circular visualization package in R (circlize). The study reveals the spatial-temporal characteristics and patterns of residents’ travel. The spatial distribution patterns of origins and destinations are analyzed first. Then, travel intensity, time, and distance on weekdays and weekends are used to explore human mobility by extracting taxi data. The findings of this study can assist transport managers to better understand spatial variability of resident travel flow across weekdays and weekends, which further provide additional comprehensive travel indicators to facilitate sustainable urban management. The remainder of this paper is organized as follows. Section 2 describes the study area, dataset, and methodology used in the paper. The results of travel spatial-temporal characteristics and patterns of urban human are analyzed and discussed in Section 3. Conclusions are presented in Section 4.

2. Materials and Methodology
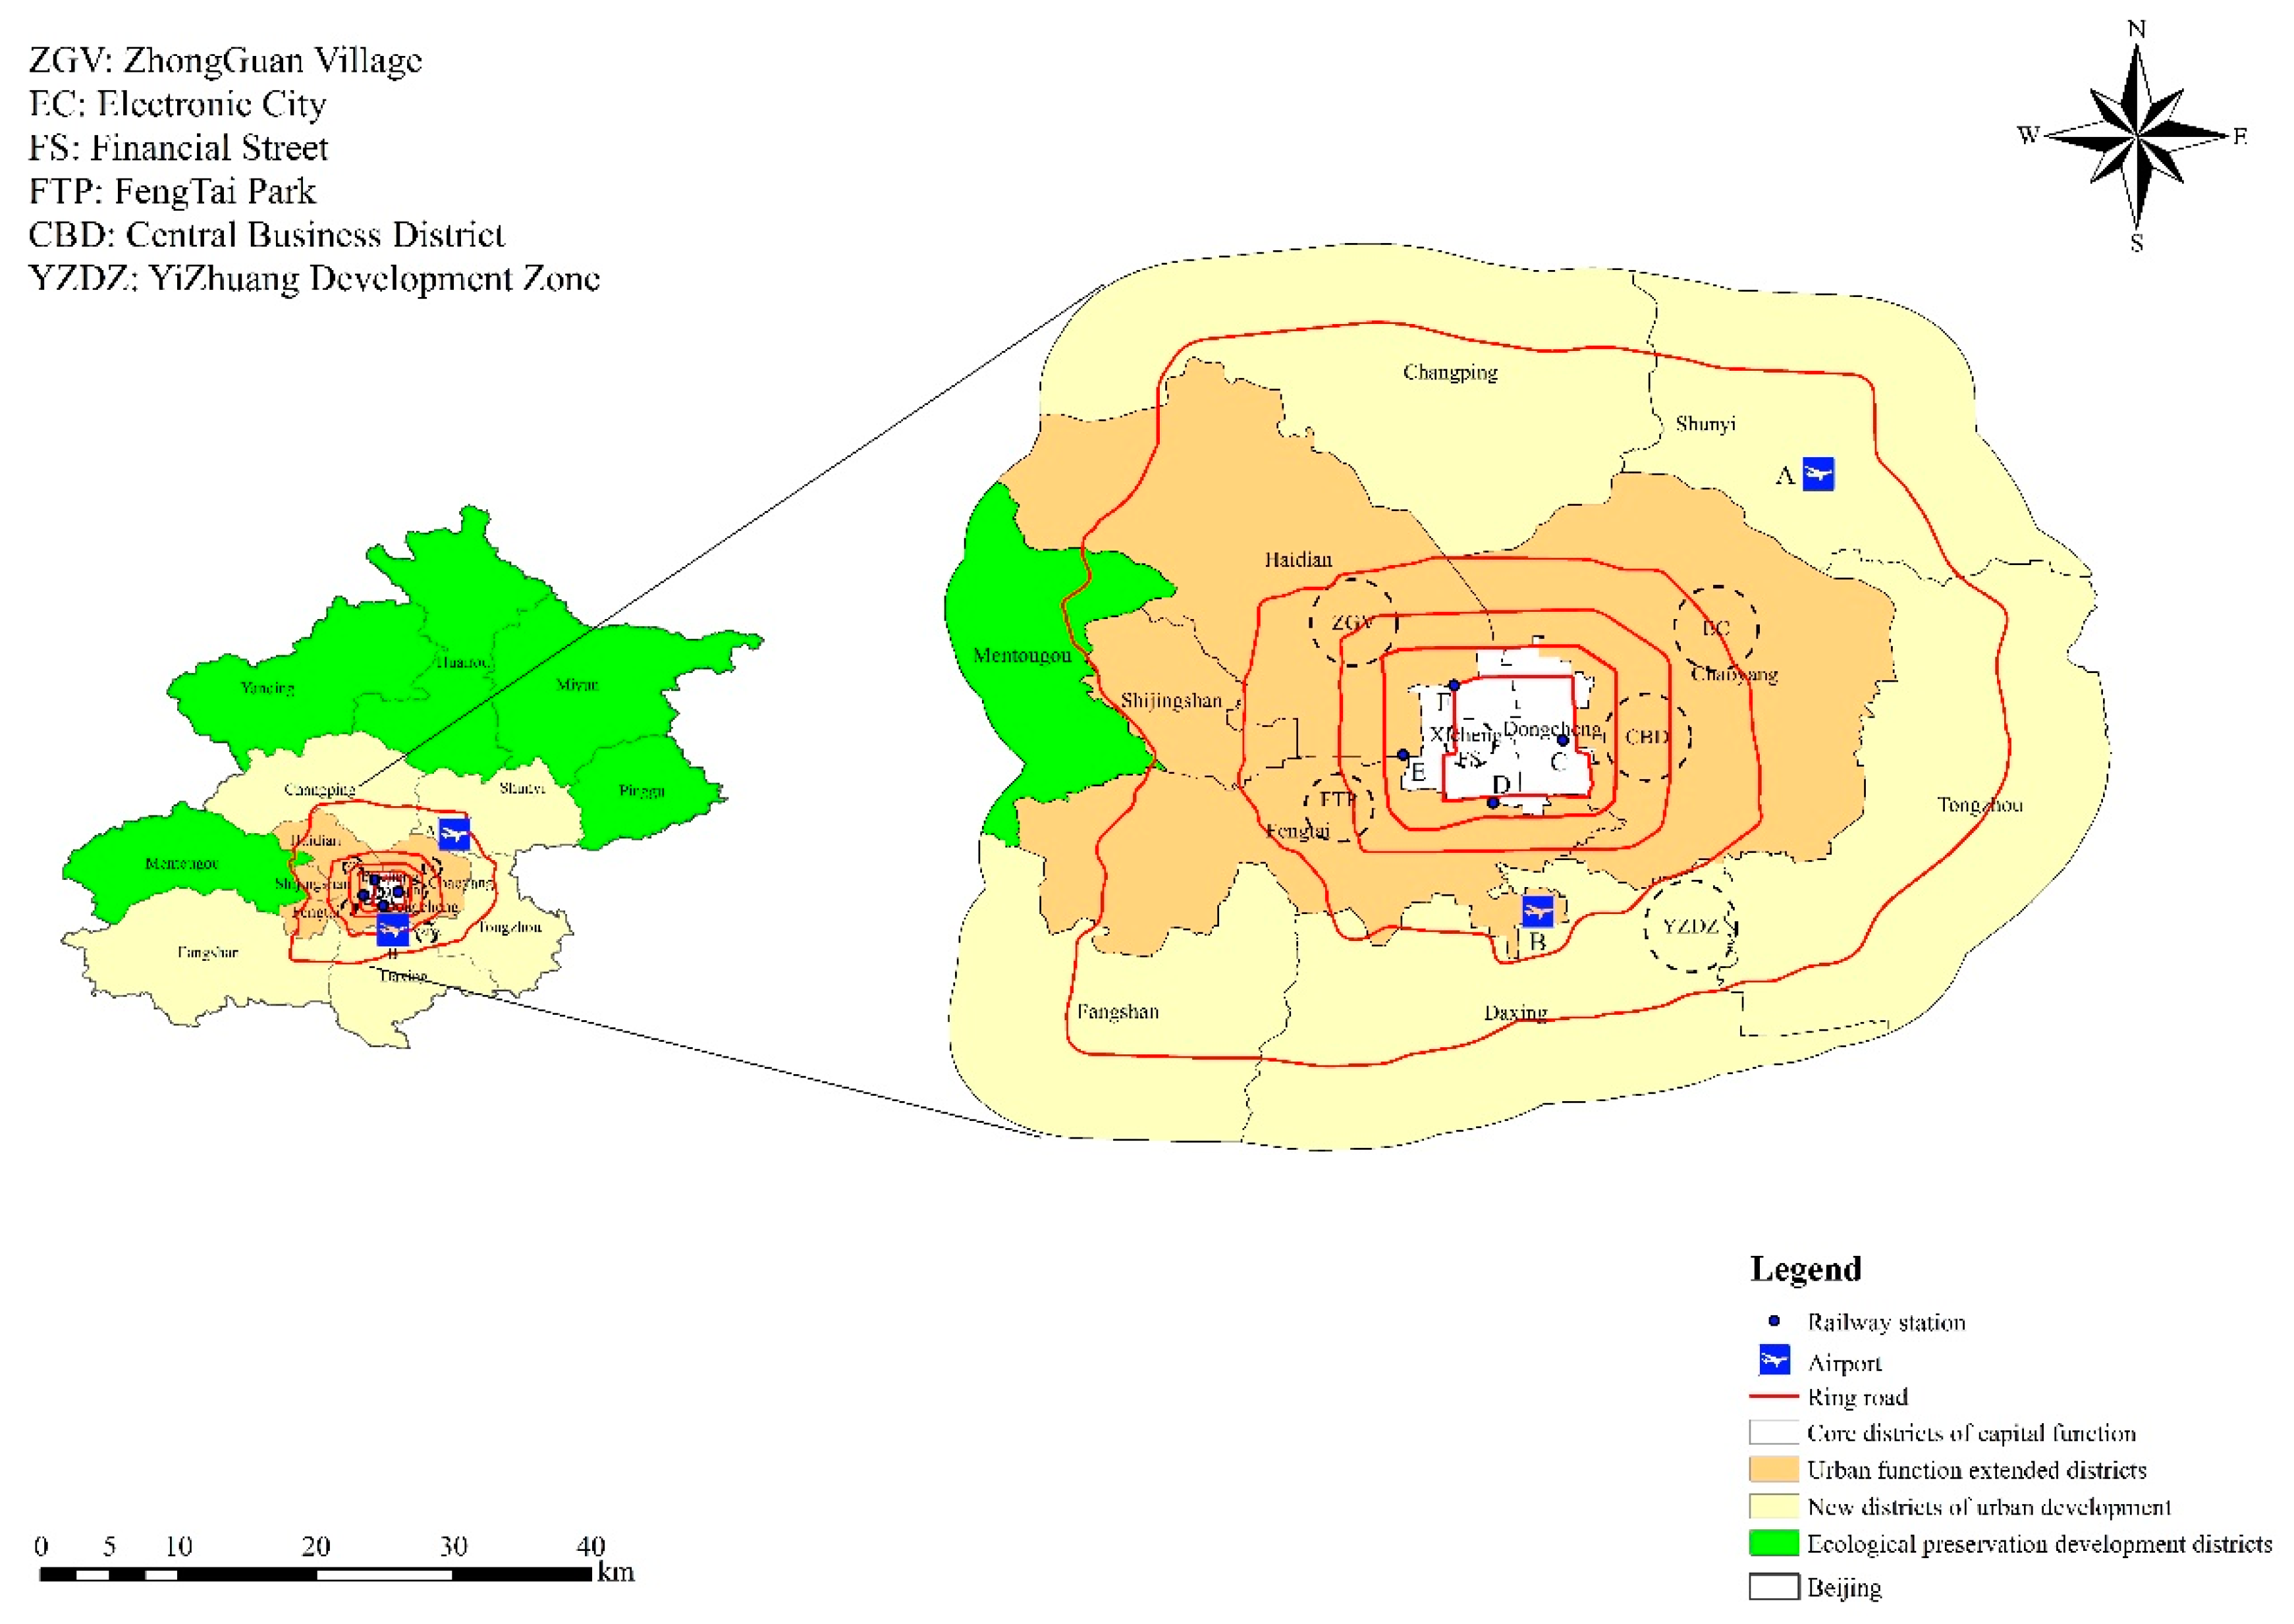
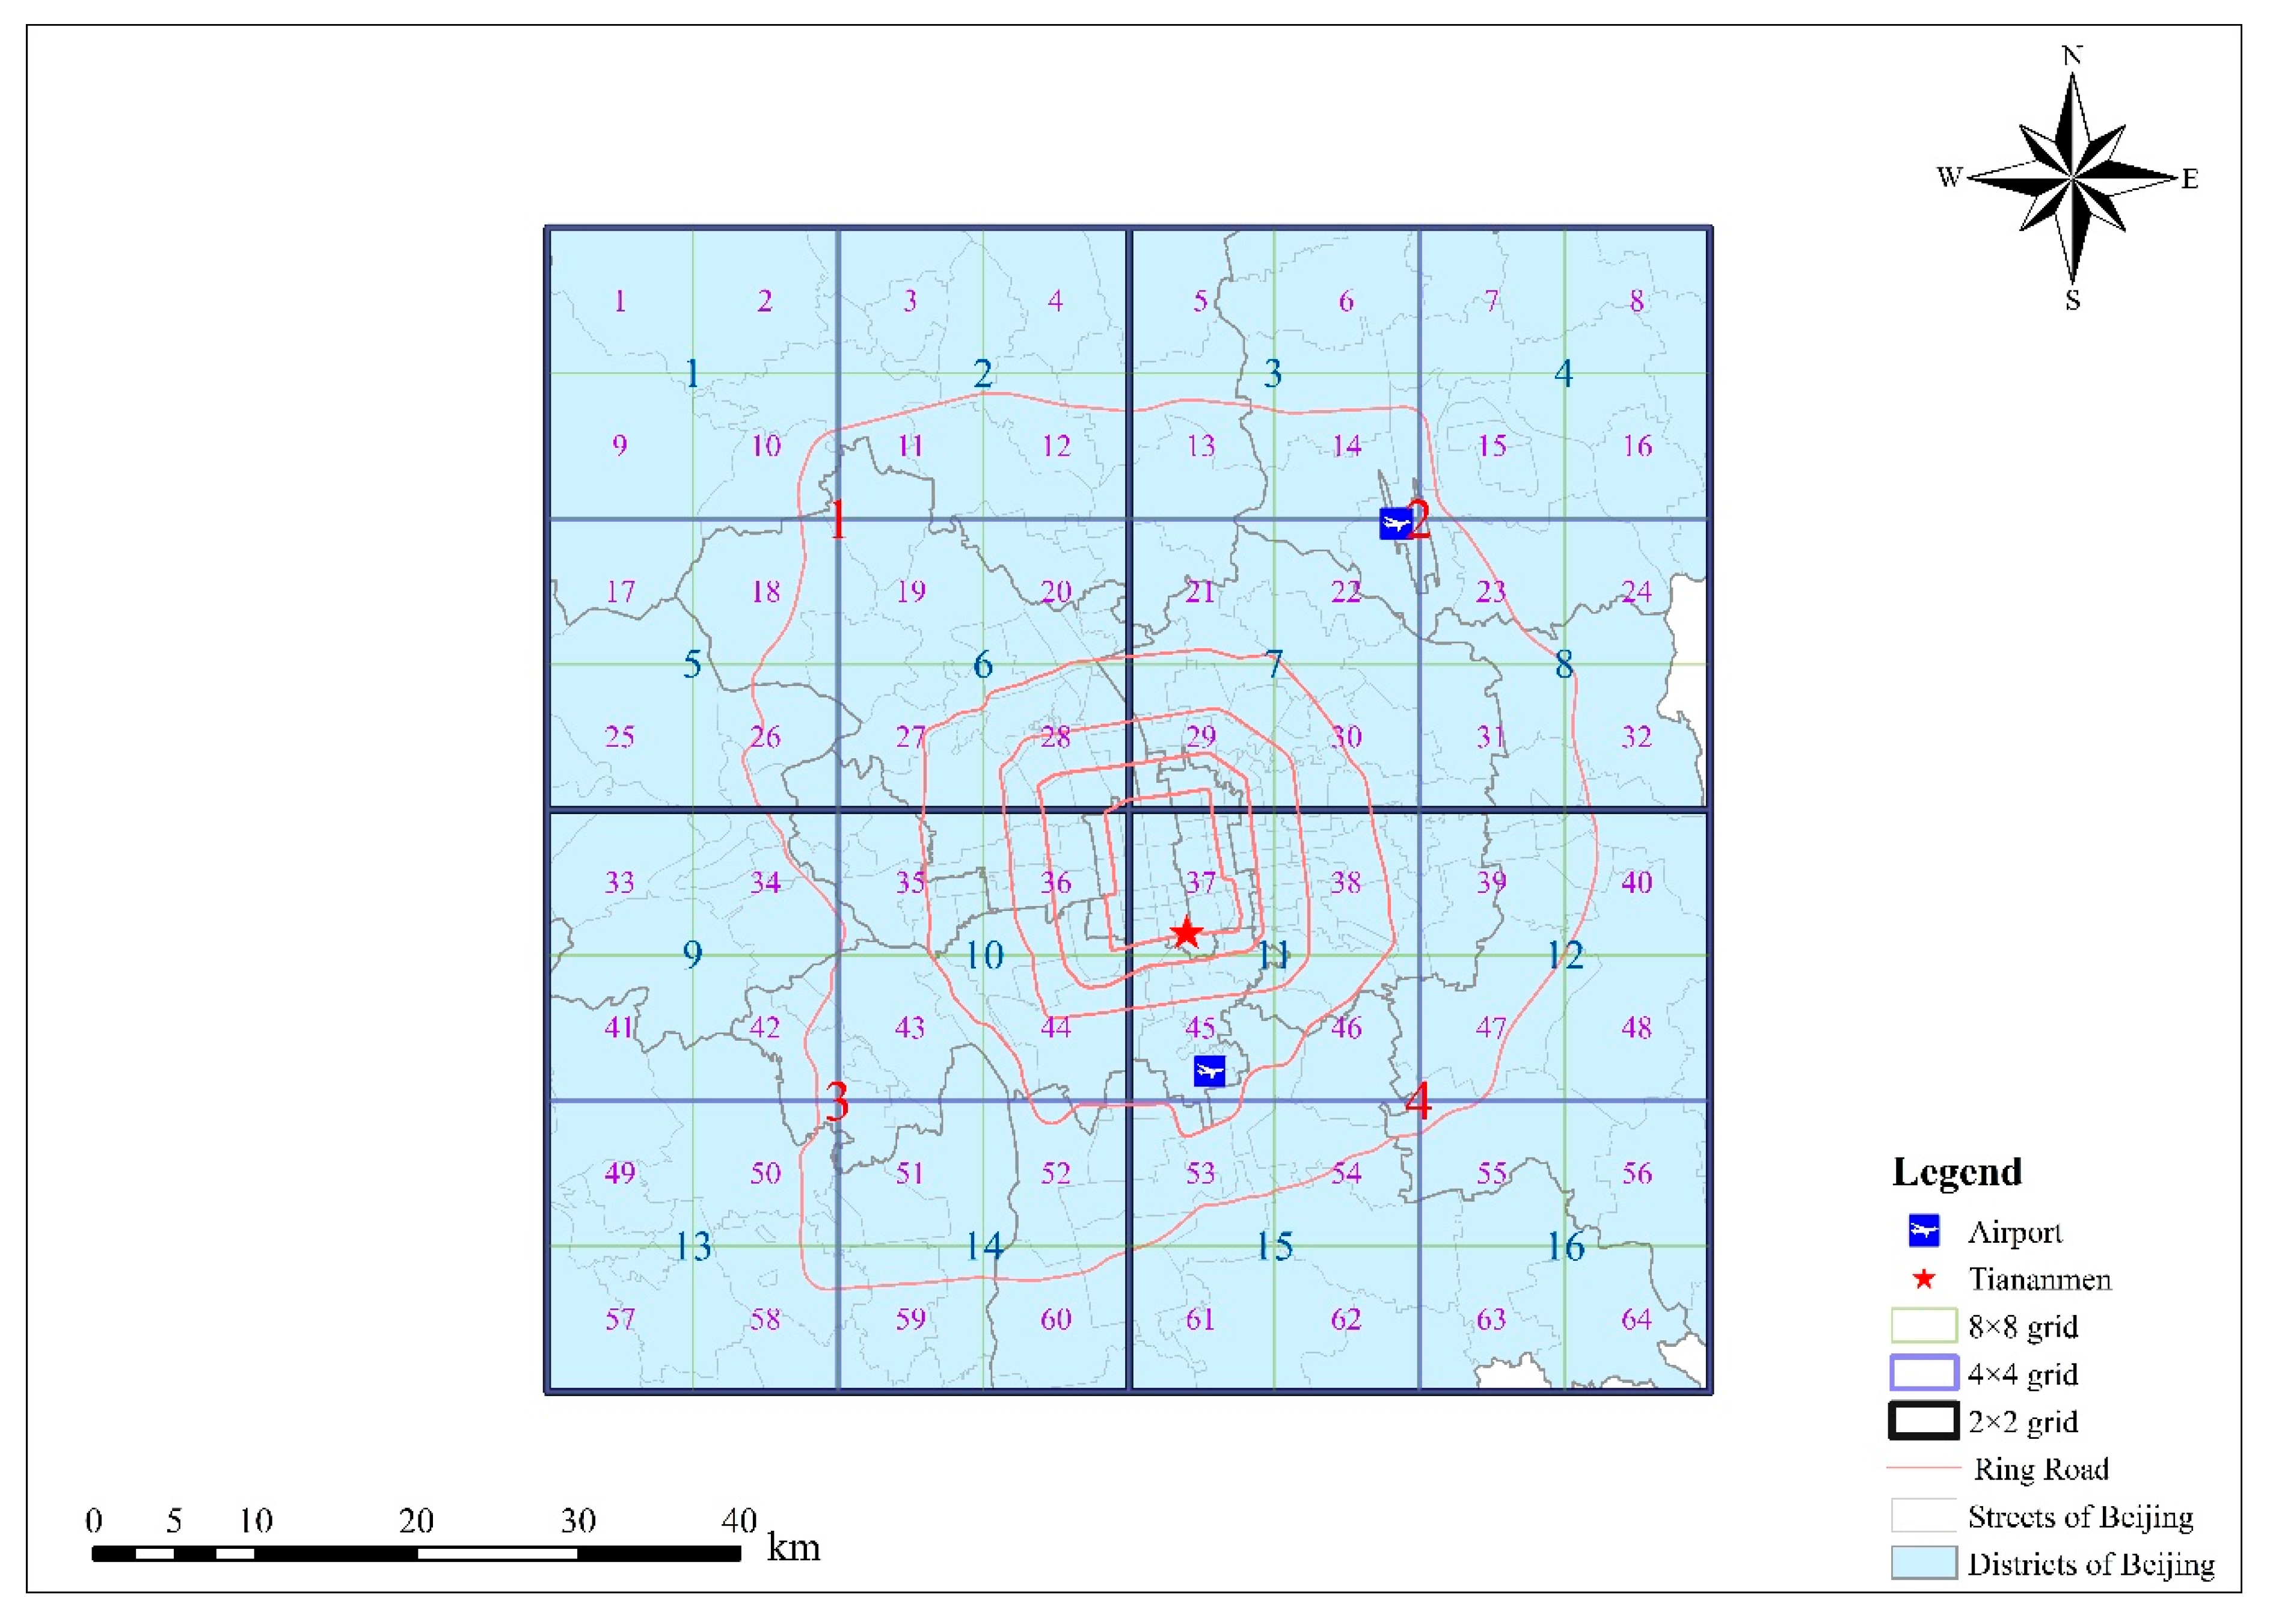
2.1. Study Area

The case study is carried out in Beijing, China, which is located in the North of the North China Plain (longitude 115.7°–117.4° East and latitude 39.4°–41.6° North). It covers an area of 16,411 km2 with the gradual declination of altitude from the Northwest to the Southeast. There are 14 districts and 2 counties in the administrative district of Beijing (Figure 1). The permanent population of Beijing increased from 15.4 to 21.7 million between 2005 and 2015, of which approximately 86.5% was urban. The GDP increased from 696.9 to 2301.5 billion CNY over the same period [51].
Beijing is one of the most dynamic economic centers in China. The public transit system in Beijing includes buses, subways, taxis, and bicycles. In 2014, the public transport system catered to 45.0% of travel in Beijing overall and, more specifically, 48.0% of travel in its core urban area; taxis provided about 10.0% of the intra-urban trips by transportation [52]. Even though the metro transit dominates Beijing’s public transportation, taxis play an important part in ground transportation in recent years. Traveling by taxi offers flexible routes and is more time-efficient than other modes of transportation. In China taxi trajectories provide a reasonable data source for urban studies, given their capacity to capture a large proportion of urban passenger flows. This research uses a large volume of trip data collected from location-aware devices to analyze the spatial-temporal characteristic and patterns of residents’ trip behaviors in Beijing.

2.2. Data Sources

Taxis play an important role in intra-urban transportation in Beijing. Many taxi companies have installed GPS receivers in their fleets to monitor the real-time movement of each taxi. This paper used a data set that contains the GPS trajectories of more than 27,000 taxis for seven consecutive days (from December 25th to December 31st in 2012) from an anonymous taxi company in Beijing. The data recorded each taxi’s location, velocity, timetable, and state (vacancy or occupancy), which is acceptable in investigating intra-urban travel patterns. Table 1 provides an overall description of taxi data. The ‘‘Time’’ indicates when the data are recorded, ‘‘Latitude’’ and ‘‘Longitude’’ provide the location data of the taxi vehicle, and ‘‘Speed’’ is the instantaneous velocity of vehicle, the unit is kilometers per hour. ‘‘Direction’’ represents the driving direction, which is based on North. ‘‘State’’ represents the whether or not the taxi is occupied by passengers, ‘‘0′’ represents the taxi vehicle is vacant and ‘‘1′’ means it is occupied. All the trajectories have been cleaned by removing invalid points caused by data recording or transfer errors. Based on the cleaned data, the locations where passengers were picked up (with subscript “O”) and dropped off (with subscript “D”) can be identified, and thus the origin and destination of a completed trip. Each trip can be simplified to be a vector from (Xo,Yo,To) to (Xd,Yd,Td), where (X,Y) denotes the location and T time of a pick-up event and a drop-off event, respectively. A total of 88,491,241 trips have been extracted from the data.
Naturally the trips are more concentrated in central urban areas than suburban or urban fringes. This can be demonstrated by the density analyses on pick-up points (PUPs) and drop-off points (DOPs). Figure 2 depicts the density estimations of all PUPs and DOPs in the seven days. In order to investigate the temporal characteristics of trips the seven days are discretized into 168 one hour intervals. PUPs and DOPs represent origins and destinations of various trips, and are critical for us to understand traffic patterns in the city.

2.3. Methodology

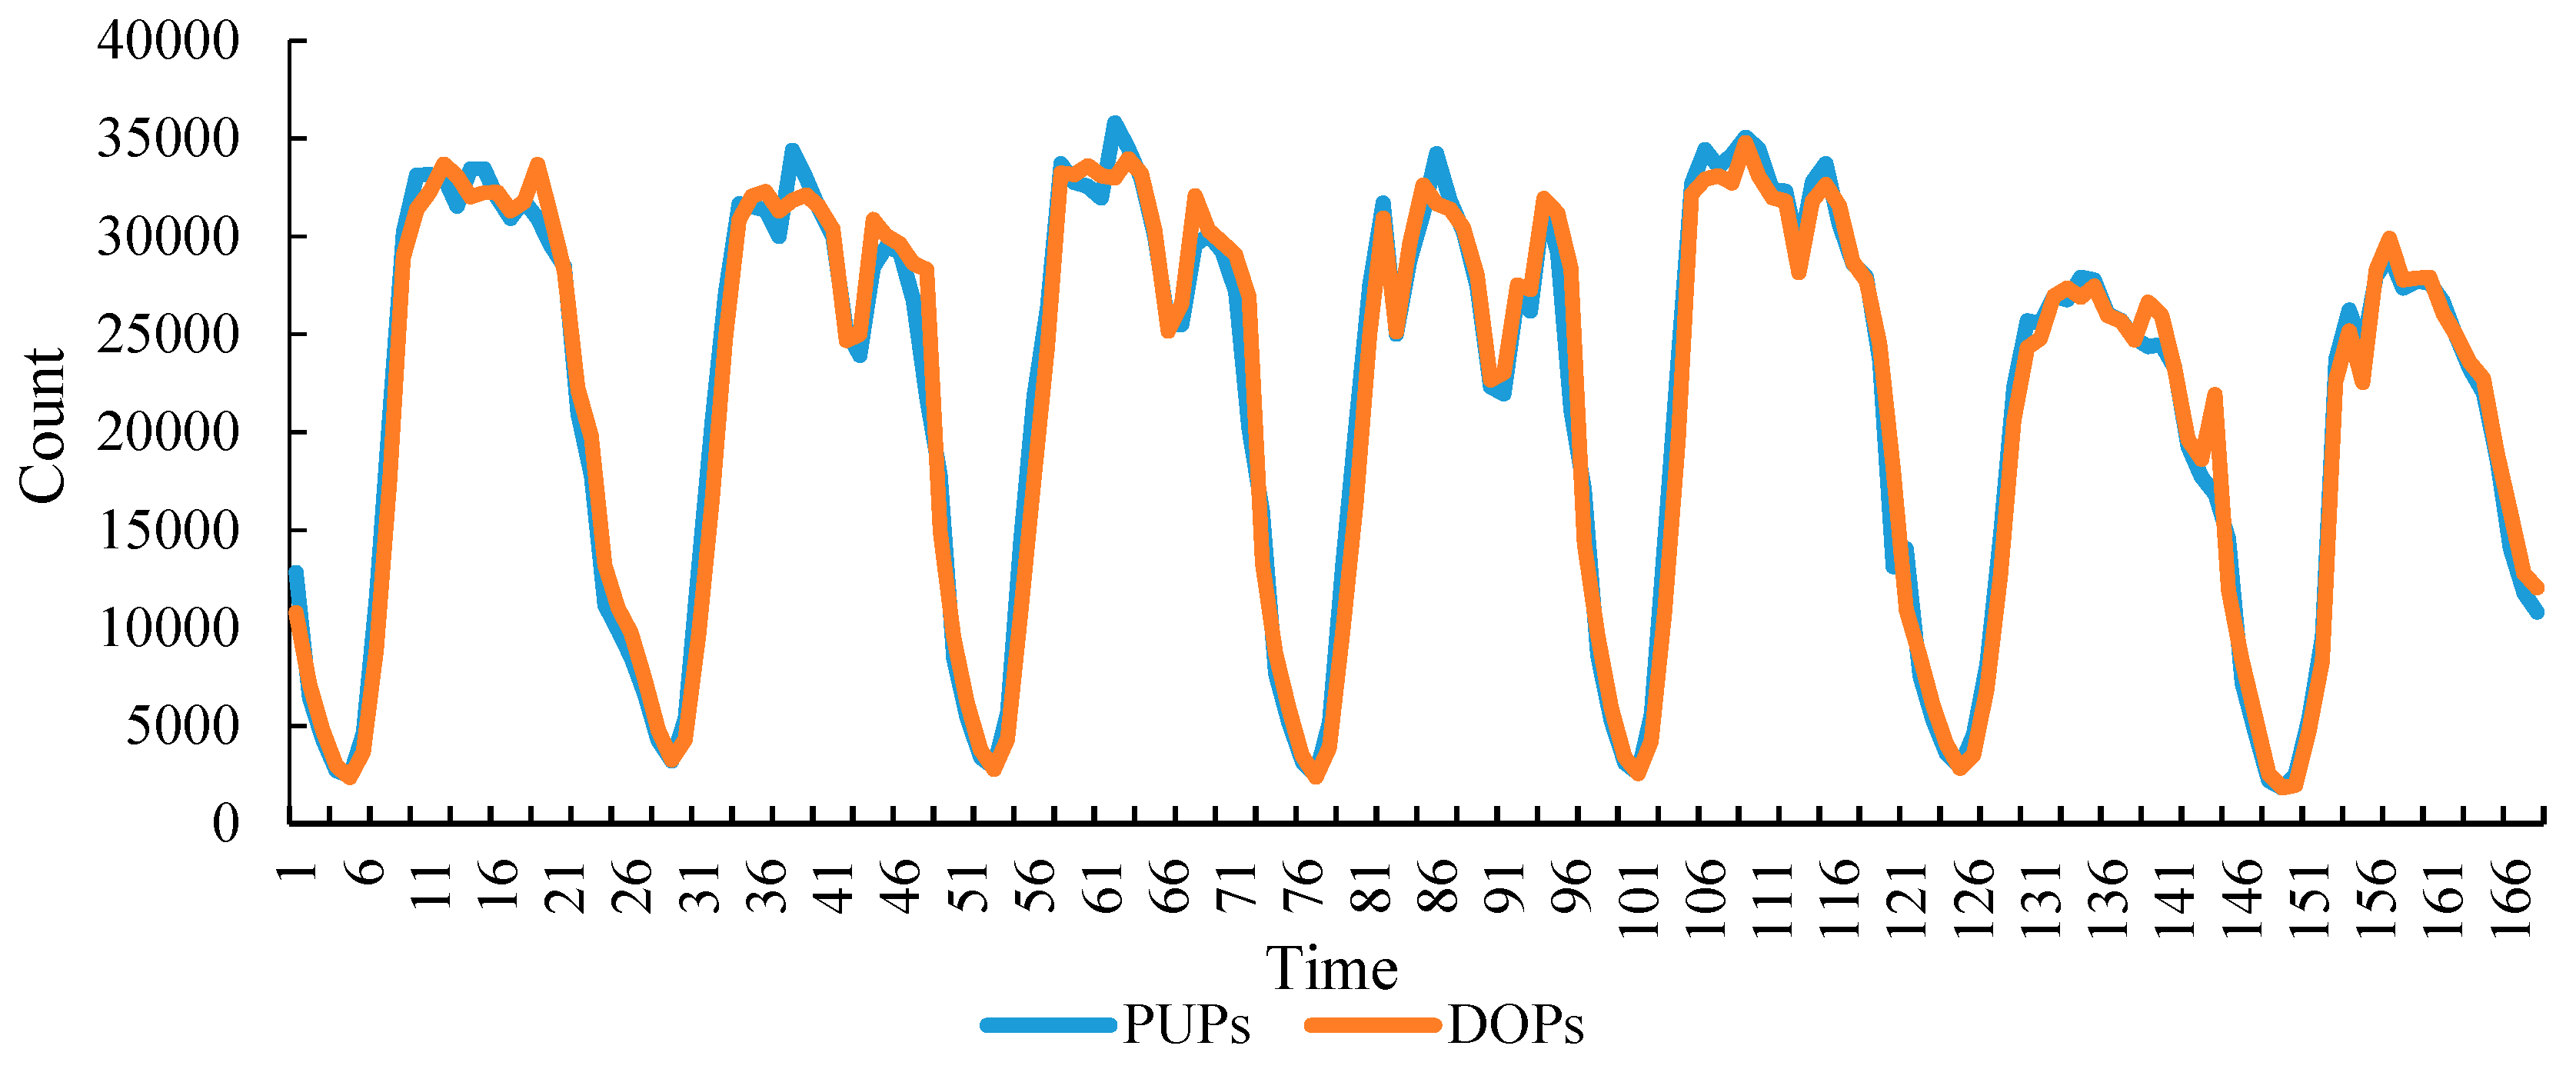
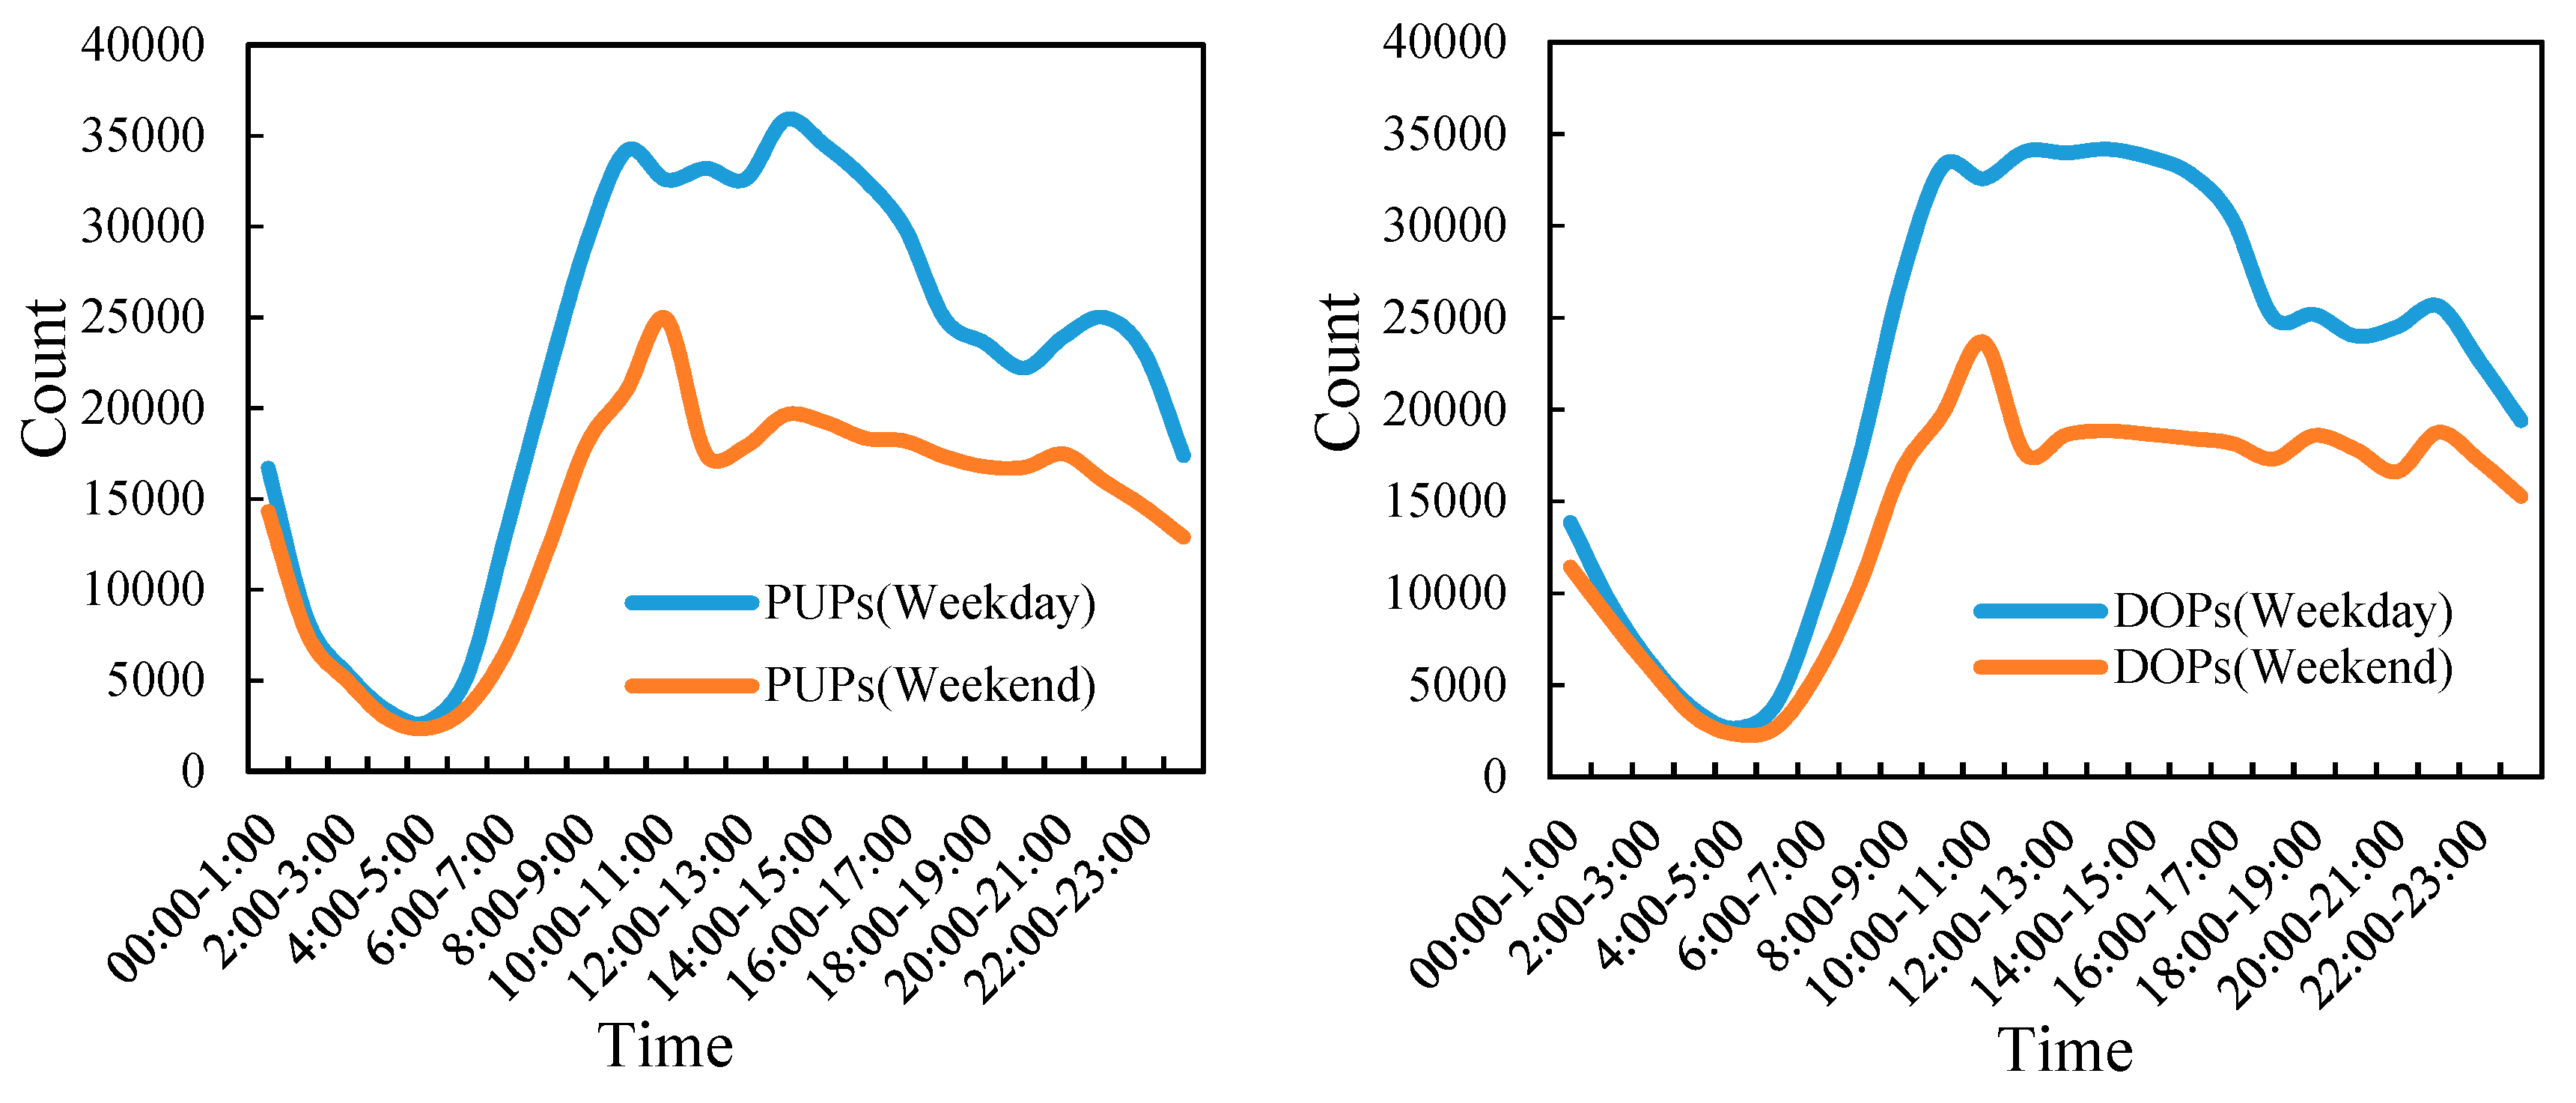
2.3.1. Temporal Pattern of PUPs and DOPs

In this study, the total numbers of PUPs and DOPs are computed for each hour in the seven days [3]:
S P [ t ] = i = 1 , j = 1 R , C P [ i , j , t ] , t = 1 , 2 , ... , T
S D [ t ] = i = 1 , j = 1 R , C D [ i , j , t ] , t = 1 , 2 , ... , T
where i and j specify the coordinates of a pixel.
For seven consecutive days, the dominant period length for urban mobility patterns has been verified to be 24 h by applying the discrete Fourier-transform (DFT) analysis on PUPs and DOPs [3]. Upon this premise, the hourly average activity number for both weekdays and weekends were calculated:
P d [ i , j , t ] = k = 1 5 λ P [ i , j , k × 24 + t ] 5   ( t = 1 , 2 , ... , 24 )
D e [ i , j , t ] = k = 6 7 λ D [ i , j , k × 24 + t ] 2   ( t = 1 , 2 , ... , 24 )
where i and j denote a pixel, λ denotes the type of the activity (Ro for PUPs and Rd for DOPs), k is the ordinal number in a seven-day week, and the superscript d and e specify weekdays and weekends, respectively.

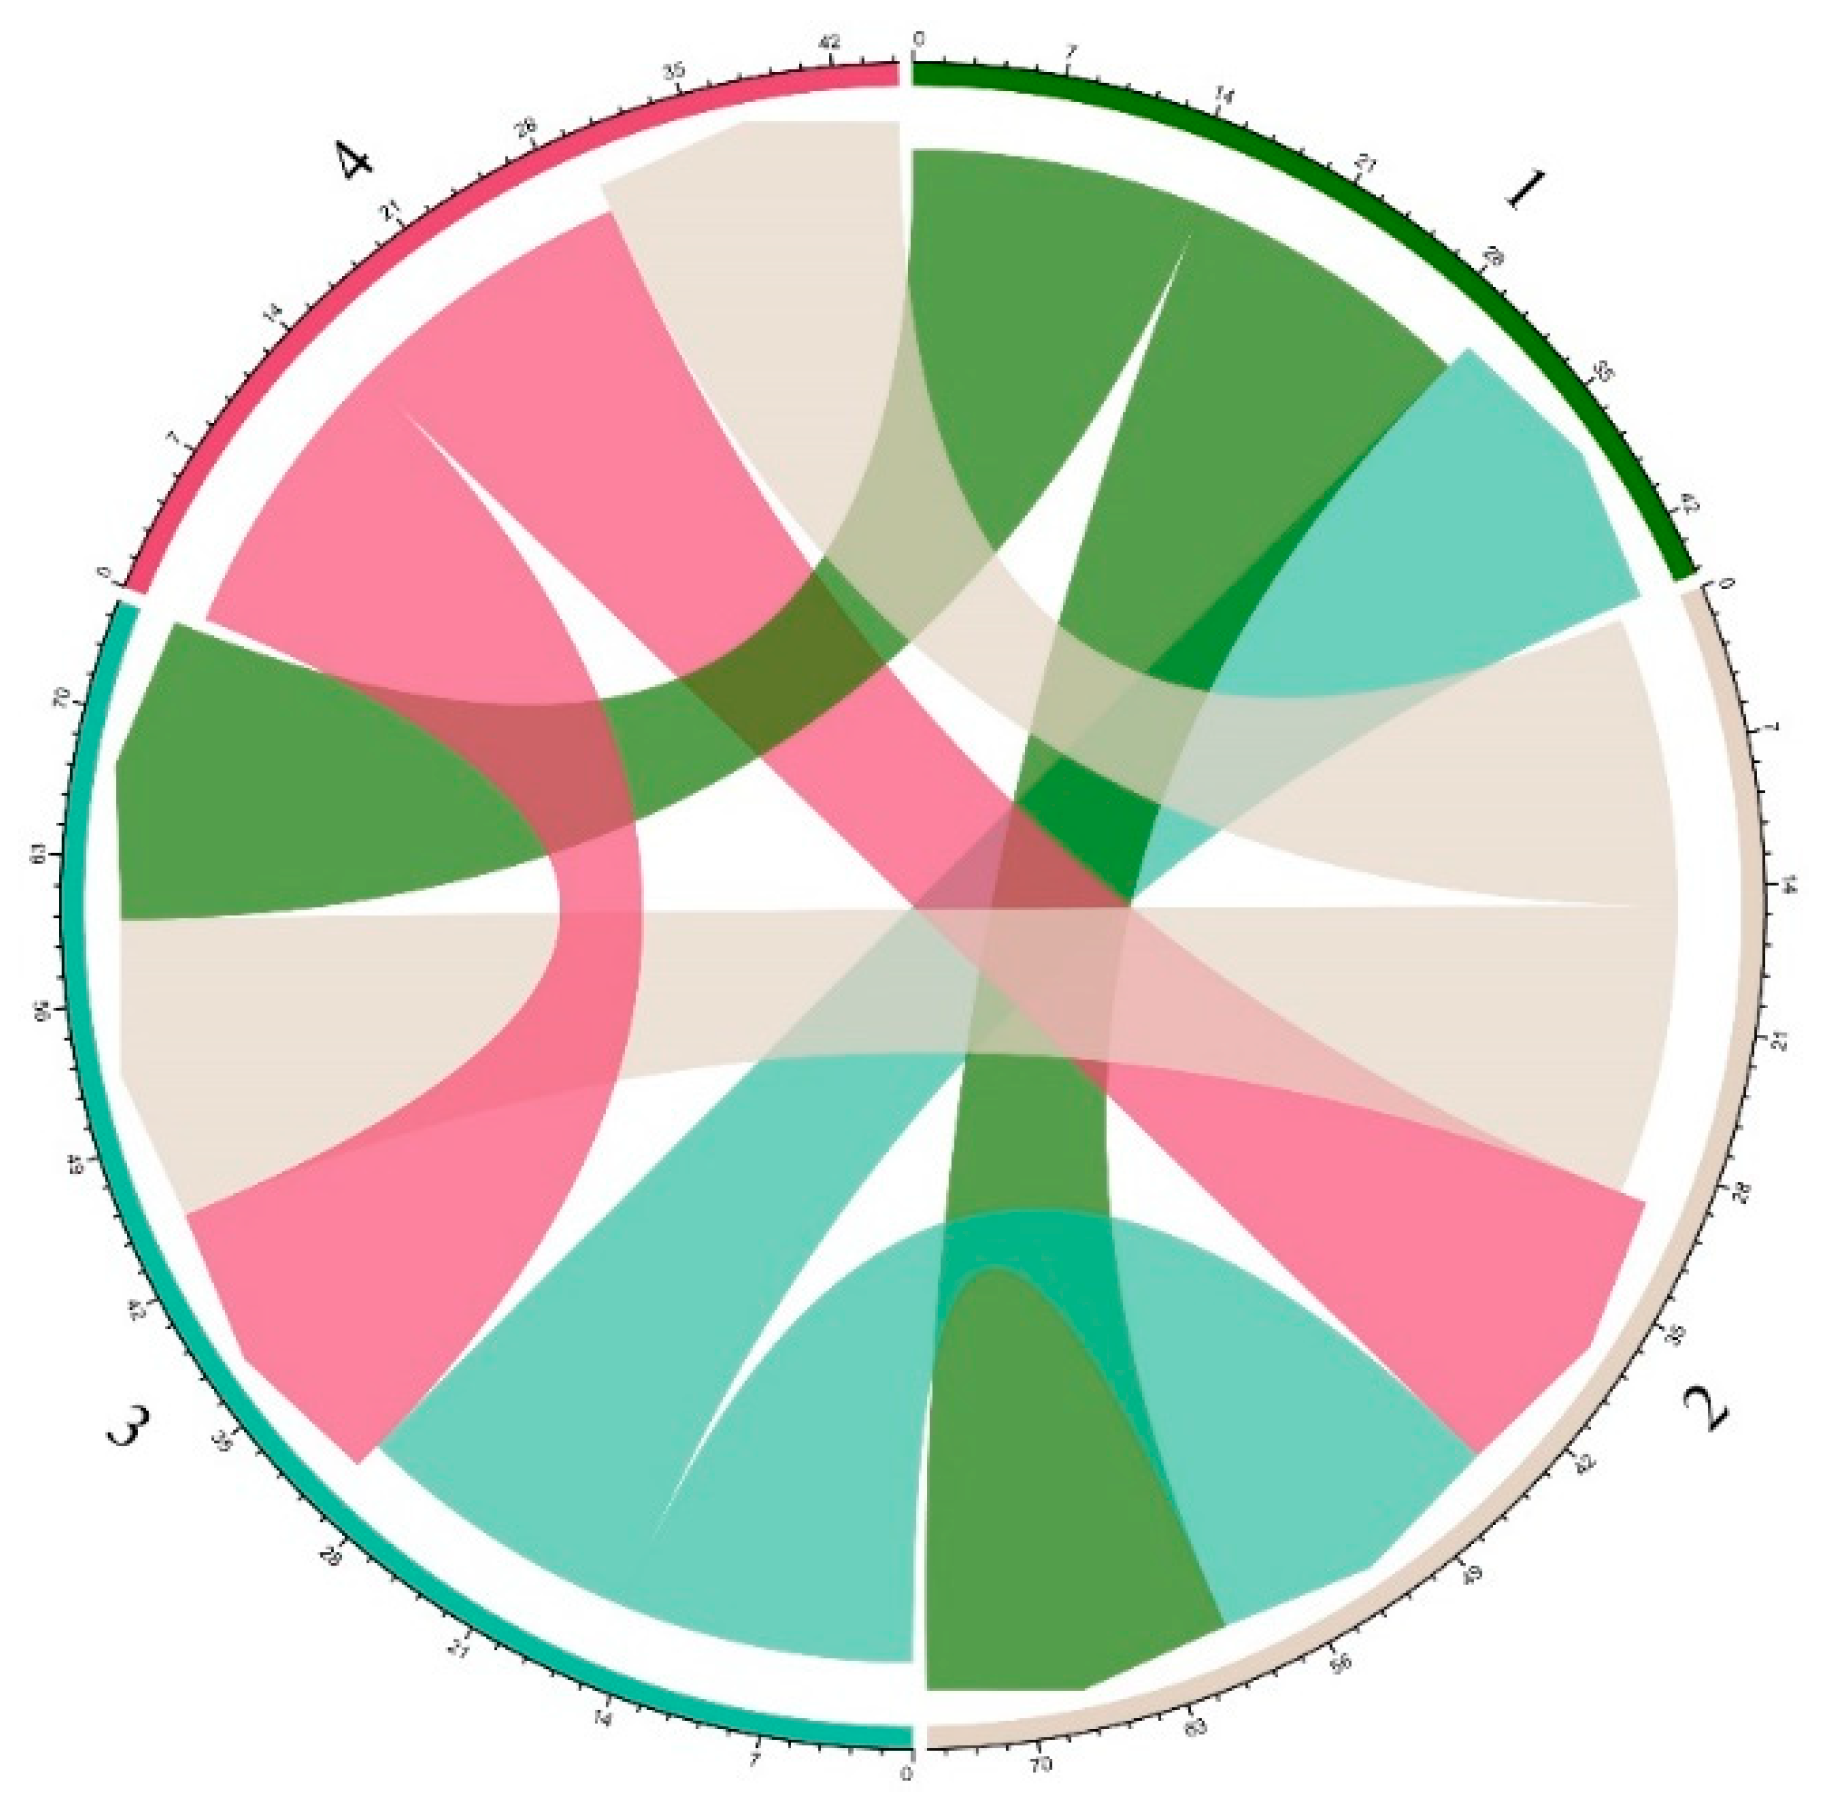
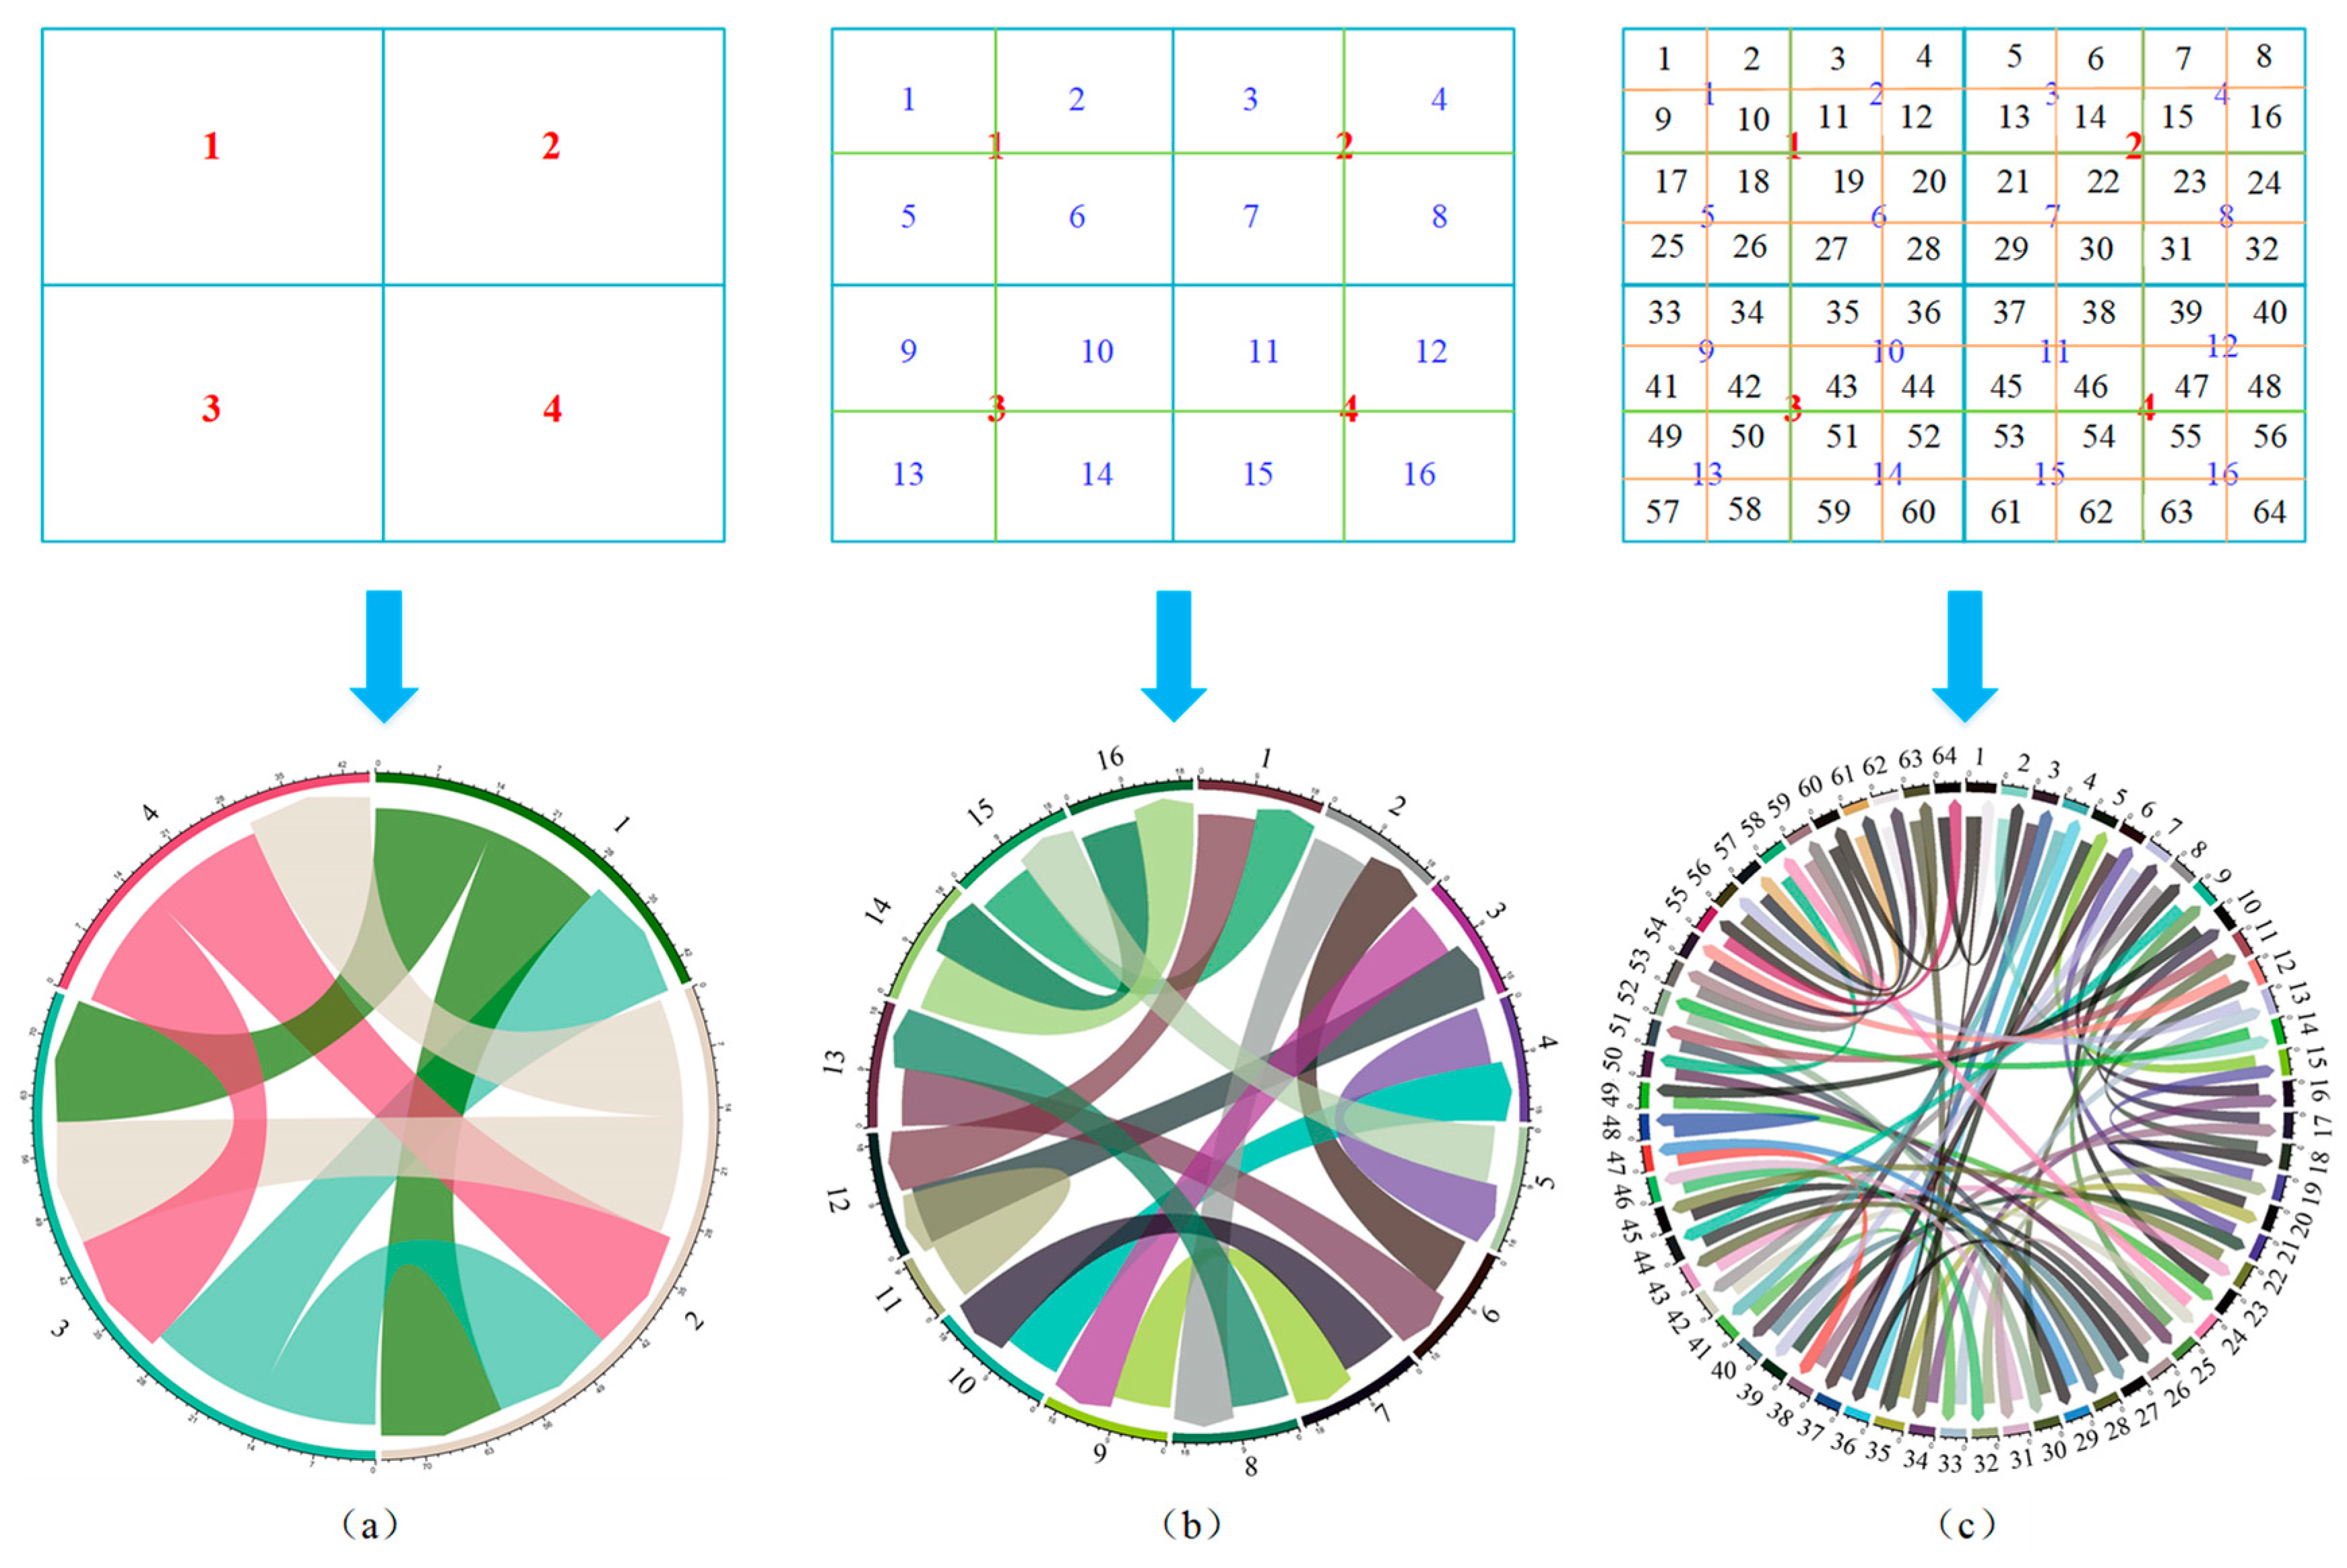
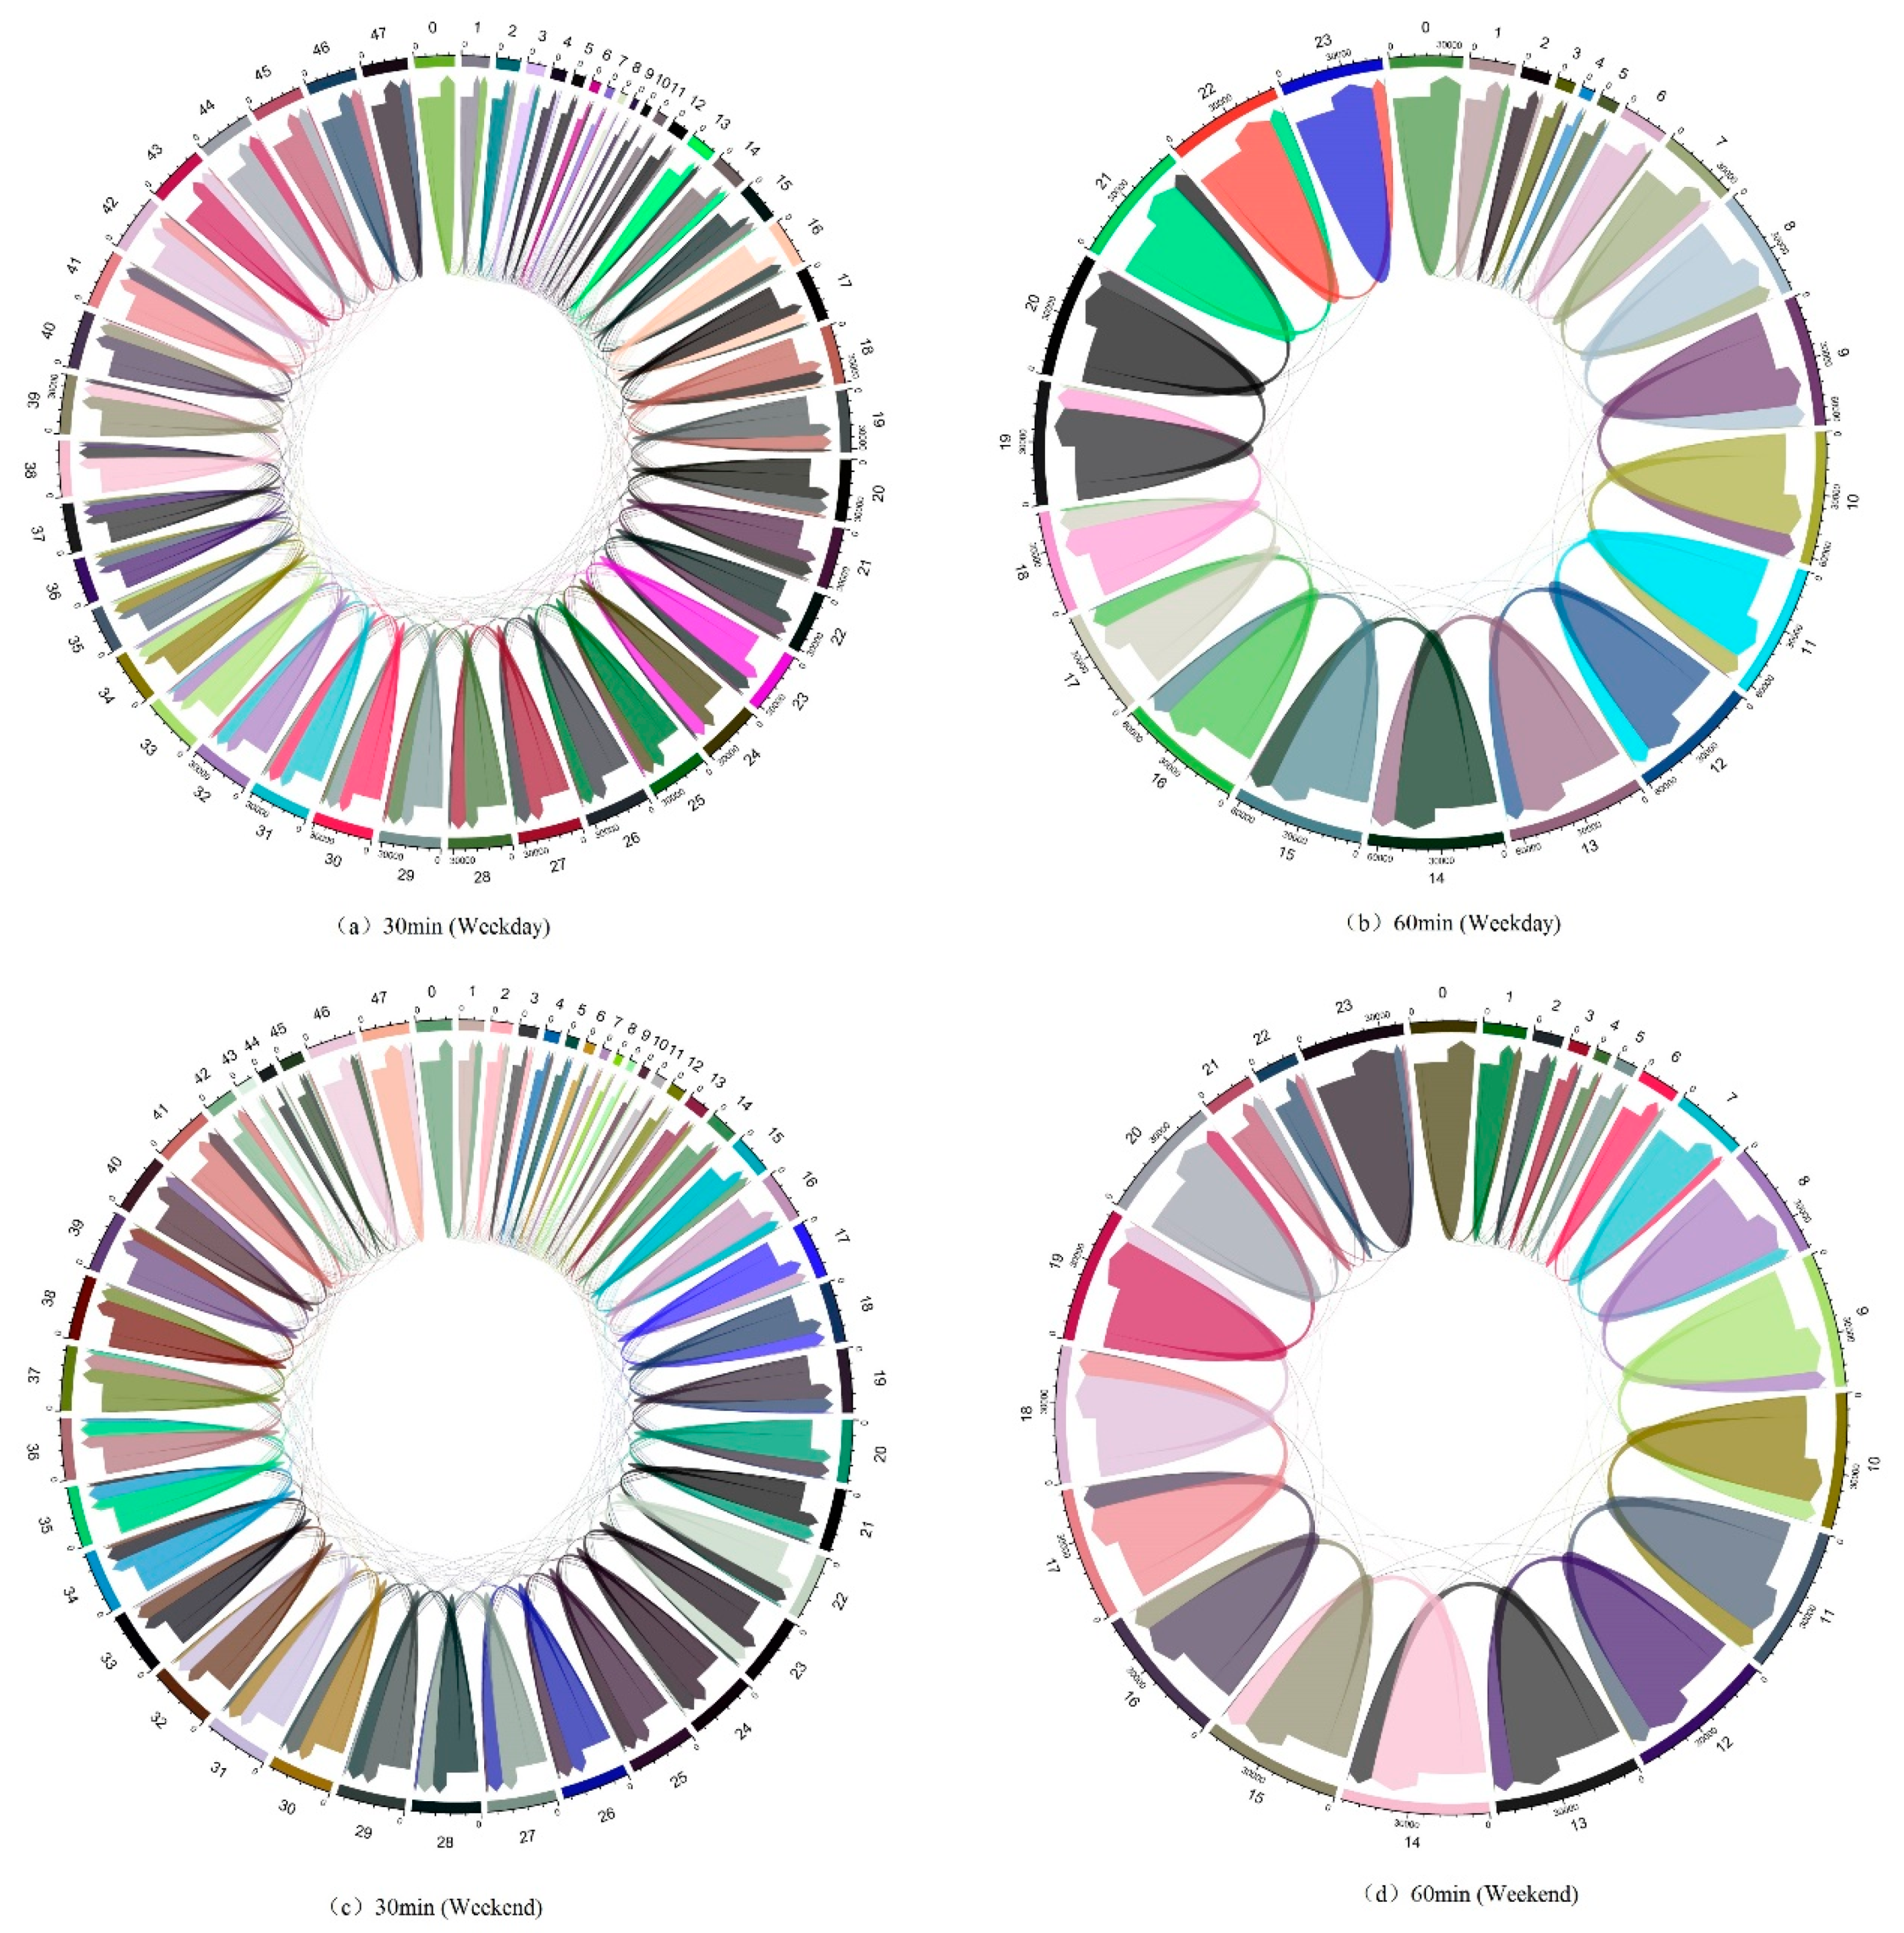
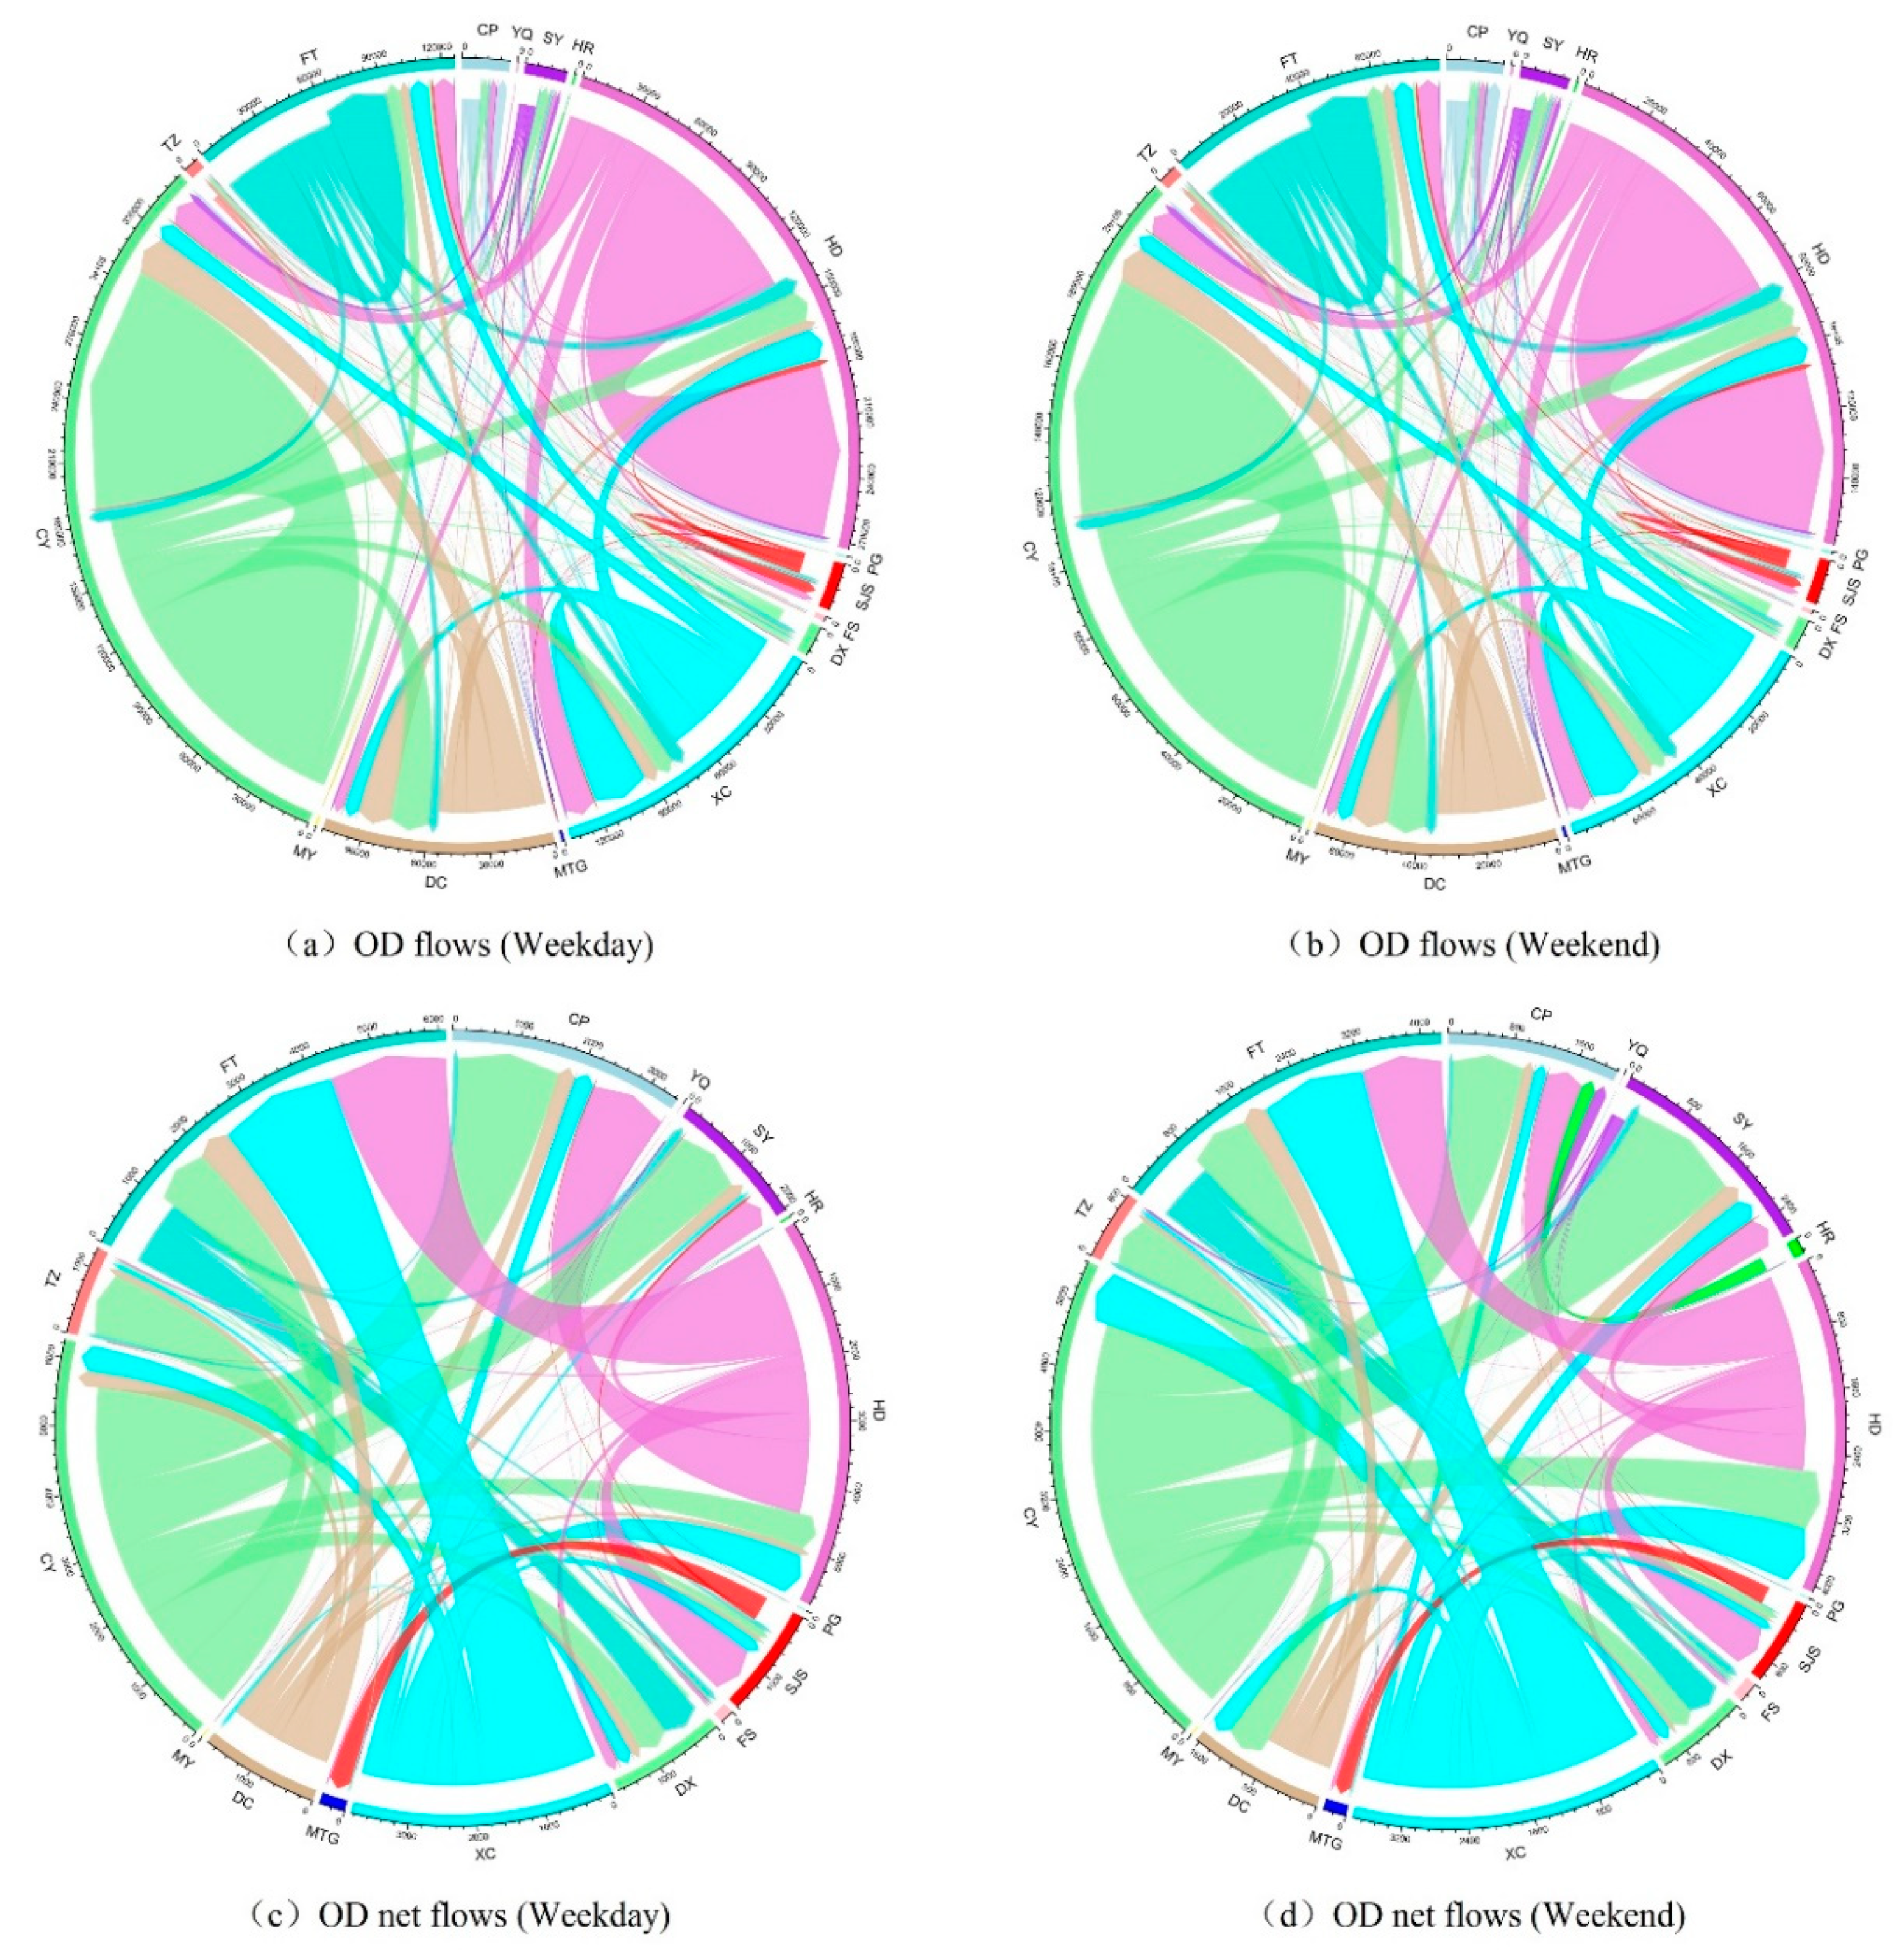
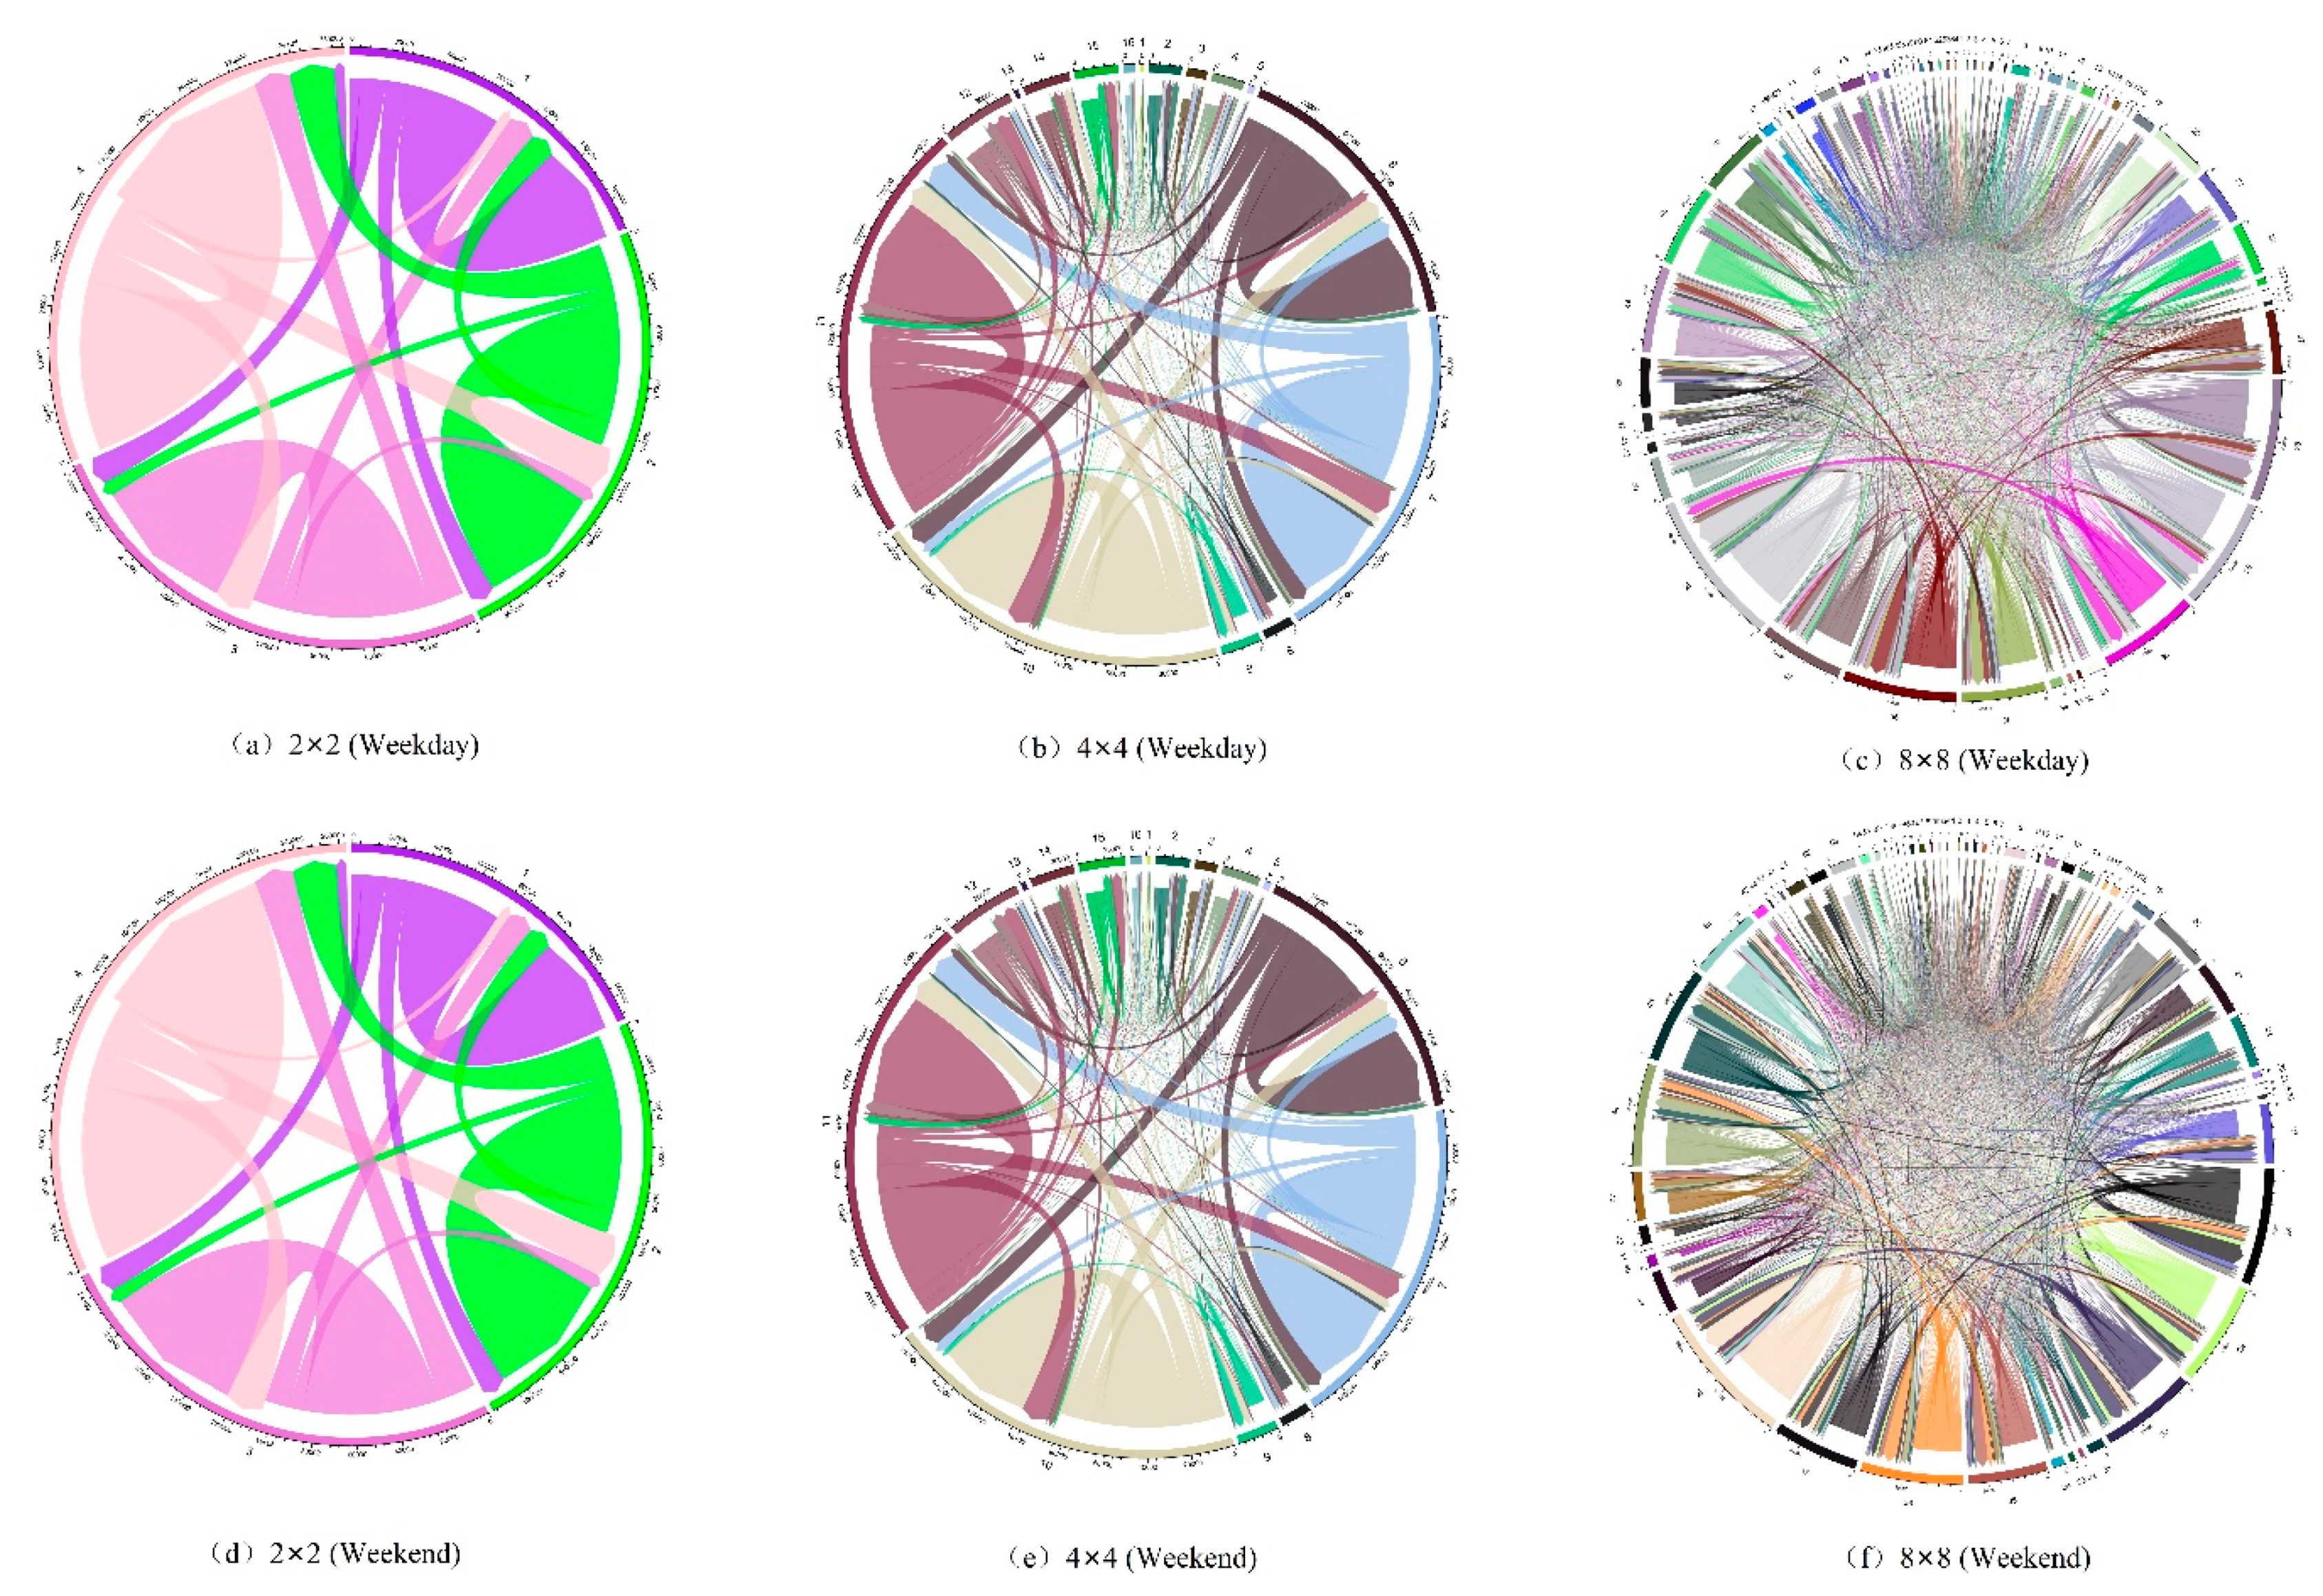
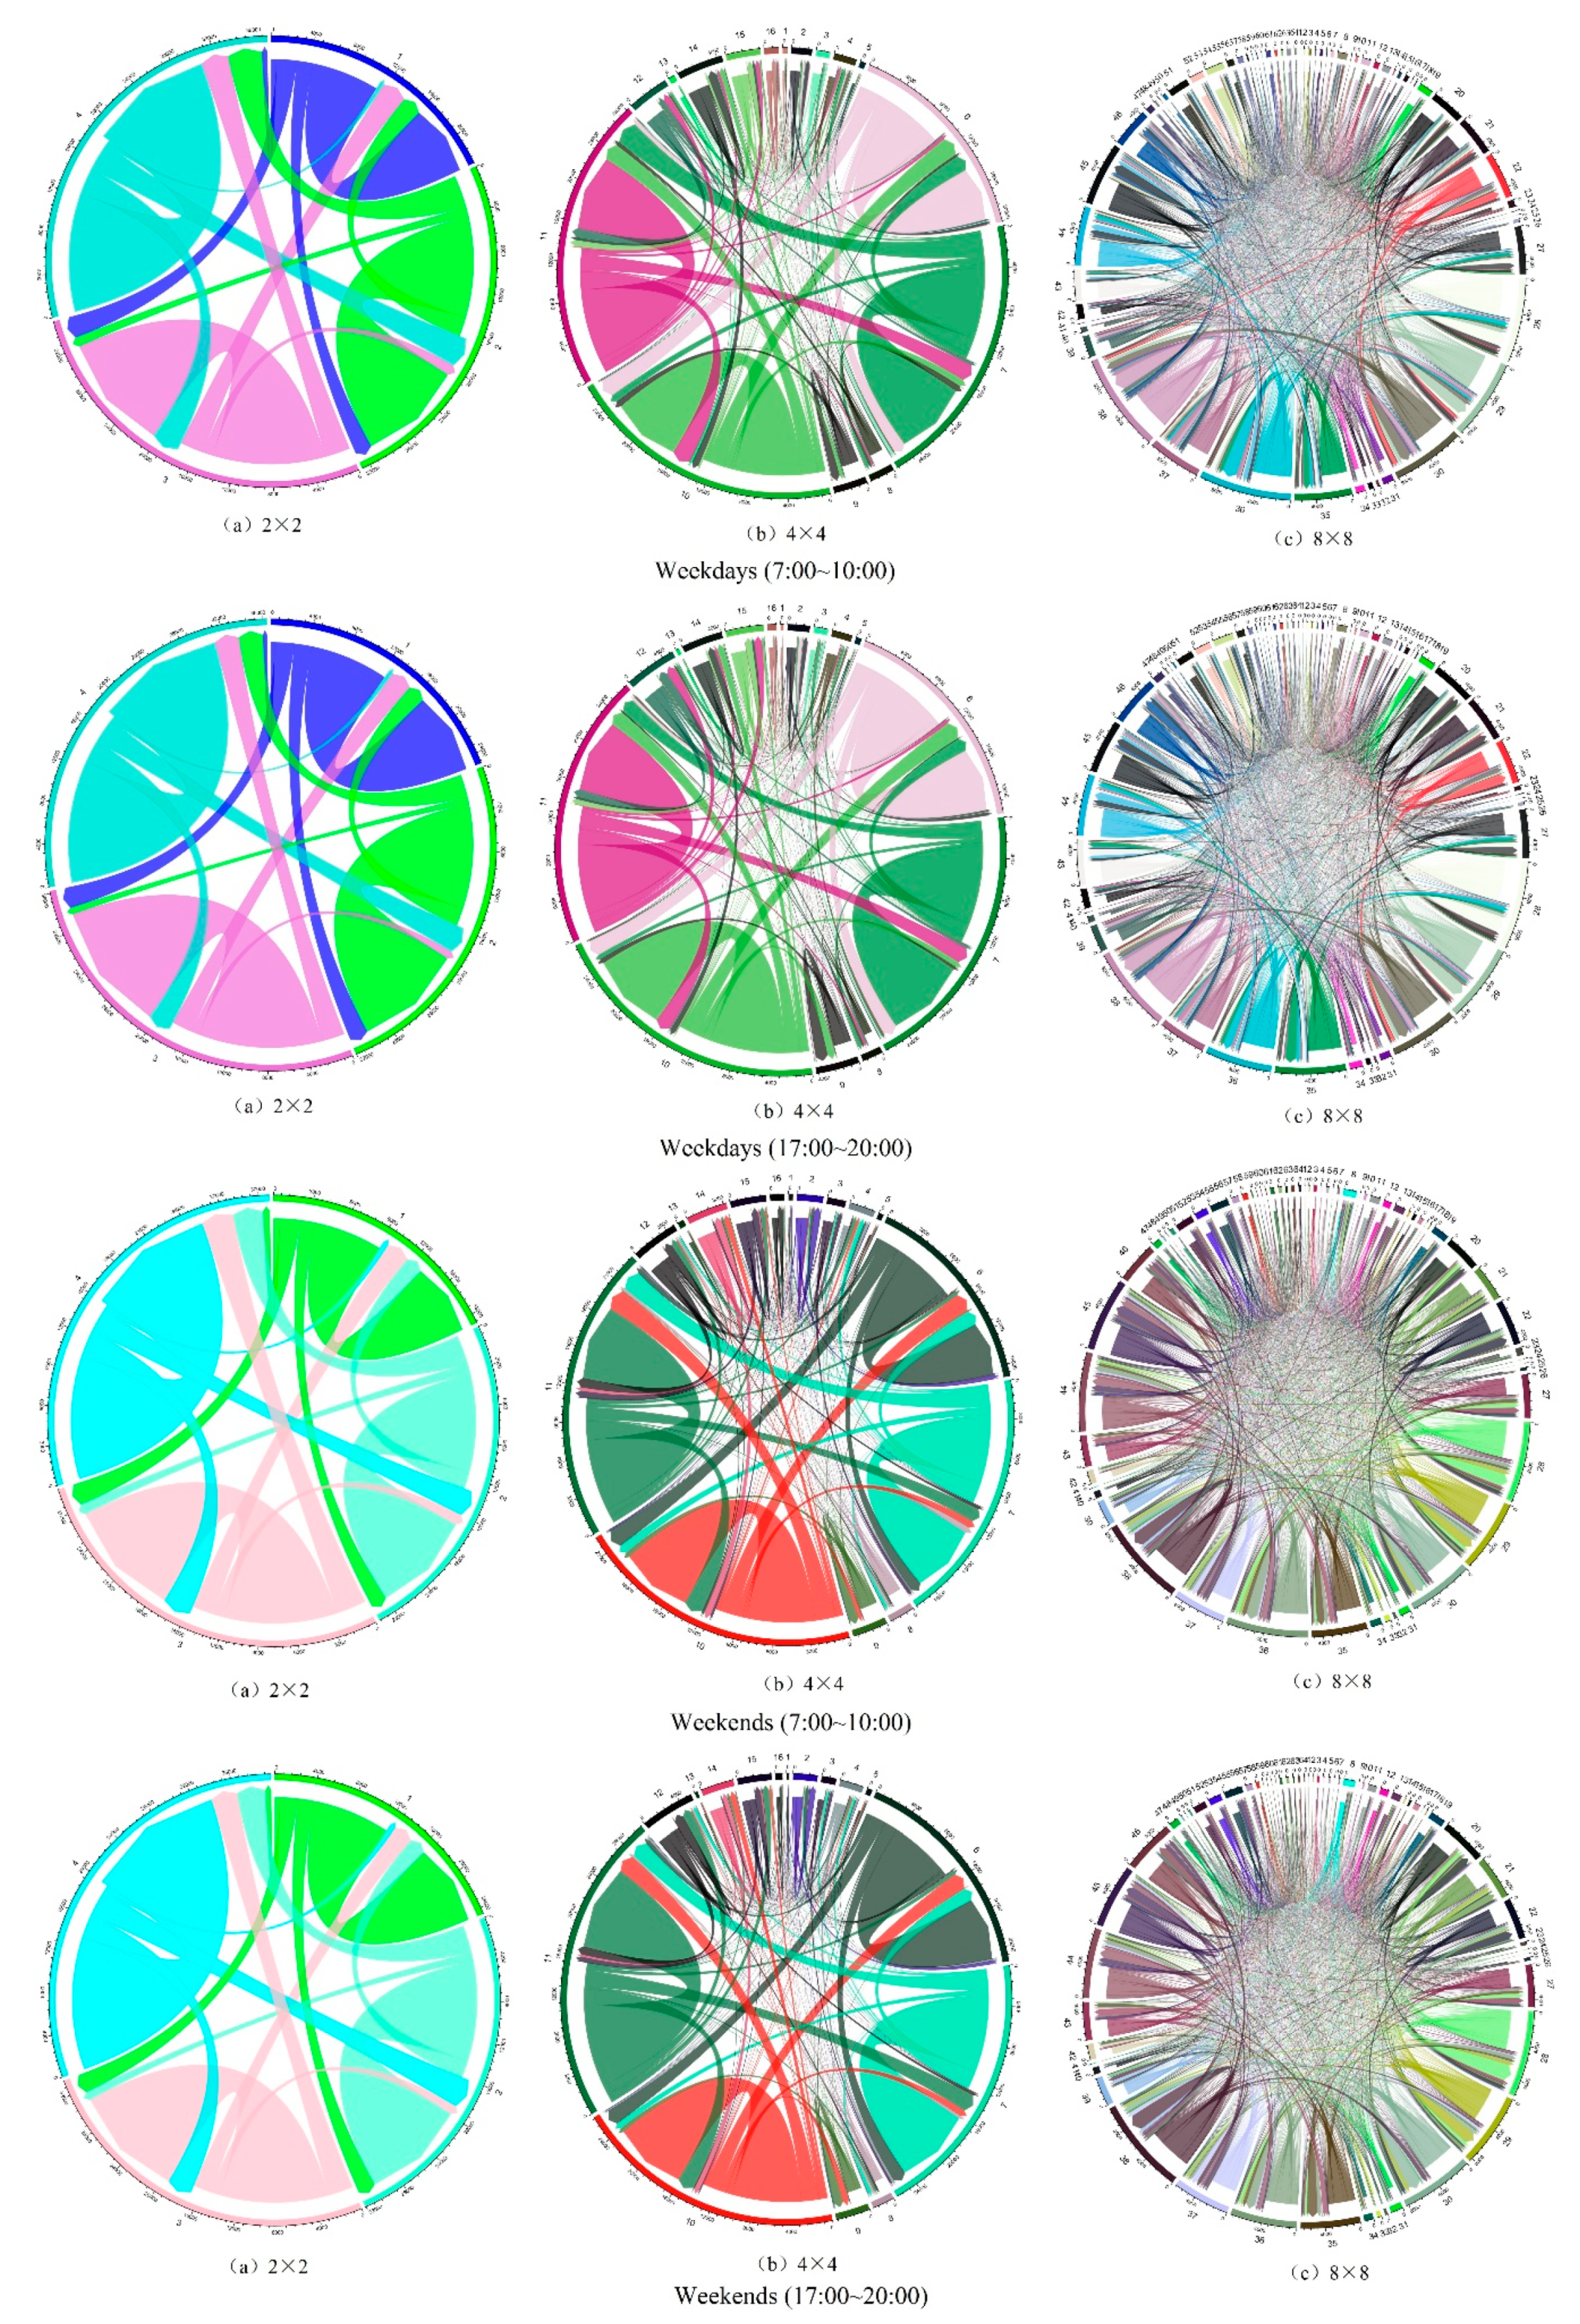
2.3.2. Multiscale Analysis Method of OD Flow Based on the Chord Diagram Plot

The OD flow is a streamline where the starting point O (Xo,Yo,To) of the movement trajectory points to the termination point D (Xd,Yd,Td); it is a directional line with a spatial position. If the OD point distribution is mapped to a certain granularity of spatial area, the orientation between OD points can show the flow of moving objects within the spatial areas. Flow patterns of moving objects on different spatial scales can be analyzed using different partition granularities. By using the definition of OD flow in terms of spatial attributes, this study extends the OD flow to the time dimension. The OD data is a kind of sequence data with time stamps. The directed connection of the OD data start and end time is the OD flow in the time dimension. Mapping the time of an OD point to a time period of a certain granularity indicates the flow of a moving object in different time periods. By changing the granularity of partitioning, OD flows at different time scales can be achieved.
Considering that the taxi OD data records the movement of the vehicle in space-time, it is possible to define its data volume by means of a graph theory method [41]:
Q = ( S , T )
where S is a set of spatial regions and T is a set of time segments.
When s i S or t i T ( i = 1 , 2 , ... , n ) , i is spatial-temporal granularity. Therefore, there are i × i possibilities for OD flow. The row and column records represent the start and end positions or times, respectively, forming an i × i two-dimensional matrix. That is, the possibility of OD streams is recorded; each matrix element represents the OD record statistics. This two-dimensional matrix can be transformed into a chord diagram, providing a better visualization. The outer ring represents the spatial-temporal granularity of the division (e.g., time scale and space scale), and the inner string represents the amount of migration, as shown in Figure 3. The rows of the two-dimensional matrix represent the starting position or time and the columns represent the position or time of the ending point, for example, cell (3, 4) represents the flow amount of 3–4 (Figure 3). However, this kind of diagram has two important limitations. It cannot show the relationship between the total amount of taxi migration in different regions, and it cannot represent the flow direction of taxis. Therefore, it needs to be improved.
Figure 4 shows the improved the chord diagram plot using the circlize package in R. It can be seen from Figure 4 that the improved chord diagram has better visual effects. The text outside the arc represents the number of different regions or time and the width of the arc represents the size of the migration flow. The internal chord band represents the migration of OD data. The wider the chord represents the larger the migration flow. The chords between different arcs represent the migration of OD data between different spaces or time periods. The chords between the same arc represent the amount of OD data transferred between the same space or time period and the arrow at the end of the chord represents the direction of the flow.
According to the chord diagram, the total amount of flow of taxi OD data and the proportion of inflow and outflow can be clearly seen in any space area or time period, and a comparative analysis can also be conducted. The visualization analysis results not only provide a reference for urban residents’ travel plans, but can also infer their functional zoning by analyzing the rules of OD traffic flow of taxis with the change of time between different regions. Taxi data are spatial position data with a specific time series, which has characteristics of space-time and multiscale. Therefore, this paper introduces an adapted chord diagram plot to visualize taxi OD flows in both the time scale and spatial scale using the circlize package in R [53,54].
The taxi data contains abundant information on the time scale. This study uses a ring to display 24 h a day with the method from Liu et al. [49]. As the shape of the ring resembles the shape of the clock, it is generally considered that the top of the ring is the start point and the end point of the time. The time direction is represented by the clockwise direction. Each arc represents the corresponding time period (e.g., 30 min or 60 min). The size of the scale on the arc represents the statistic of OD. Here the OD data span 7 days a week, divided into weekdays and weekends. At the same time, 24 h a day is divided using 30 min and 60 min as different time scales. The travel time of taxi OD has been visualized based on the circlize package in R.
On the spatial scale, this paper uses the OD data of 7 days a week, divided into weekdays and weekends. Based on R language, a spatial visualization analysis has been conducted on the amount of incoming and outgoing traffic and the net flow in Beijing. Each arc in the string diagram represents corresponding to different areas (where the area name first letter indicates each area, e.g., CY indicates Chaoyang district). The scale on the arc represents the different OD statistics, and the arrow at the end of the chord represents the area where the trips end. Further, the research area A (the 6th Ring Road of Beijing) is recursively partitioned into 2n × 2n grids in four quadrants based on the idea of equal granularity rule meshing of spatial regions and quadtree coding. Then the OD point data is mapped to the corresponding the number of spatial grid ID according to the spatial position, thereby converting the OD data into sequence data represented in grid units. First, the study area A is divided into equal-area collections (Figure 5a), that is A = (A1, A2, A3, A4), the OD point data of the original movement trajectory is divided into corresponding subregions, and the OD data of each subregion are statistically and visually analyzed. Then, according to the same method, the subgrid is further divided into collections of regions (Figure 5b), that is A = (A1, A2, …, A16), and then statistically and visually analyzes the OD data of each subarea, followed by analogy; finally, the study areas are divided into regular 8 × 8 grids (Figure 5c). According to the ID of the taxi, the ID numbers of the spatial grids corresponding to the starting point and the ending point are extracted, and the statistics of the flow of each taxi between different regions are calculated; the same processing for all the taxis results in the flow of taxis between the regions on different spatial scales. Using the chord diagram mentioned above, the taxi OD data can be visually analyzed at different spatial scales.

3. Results

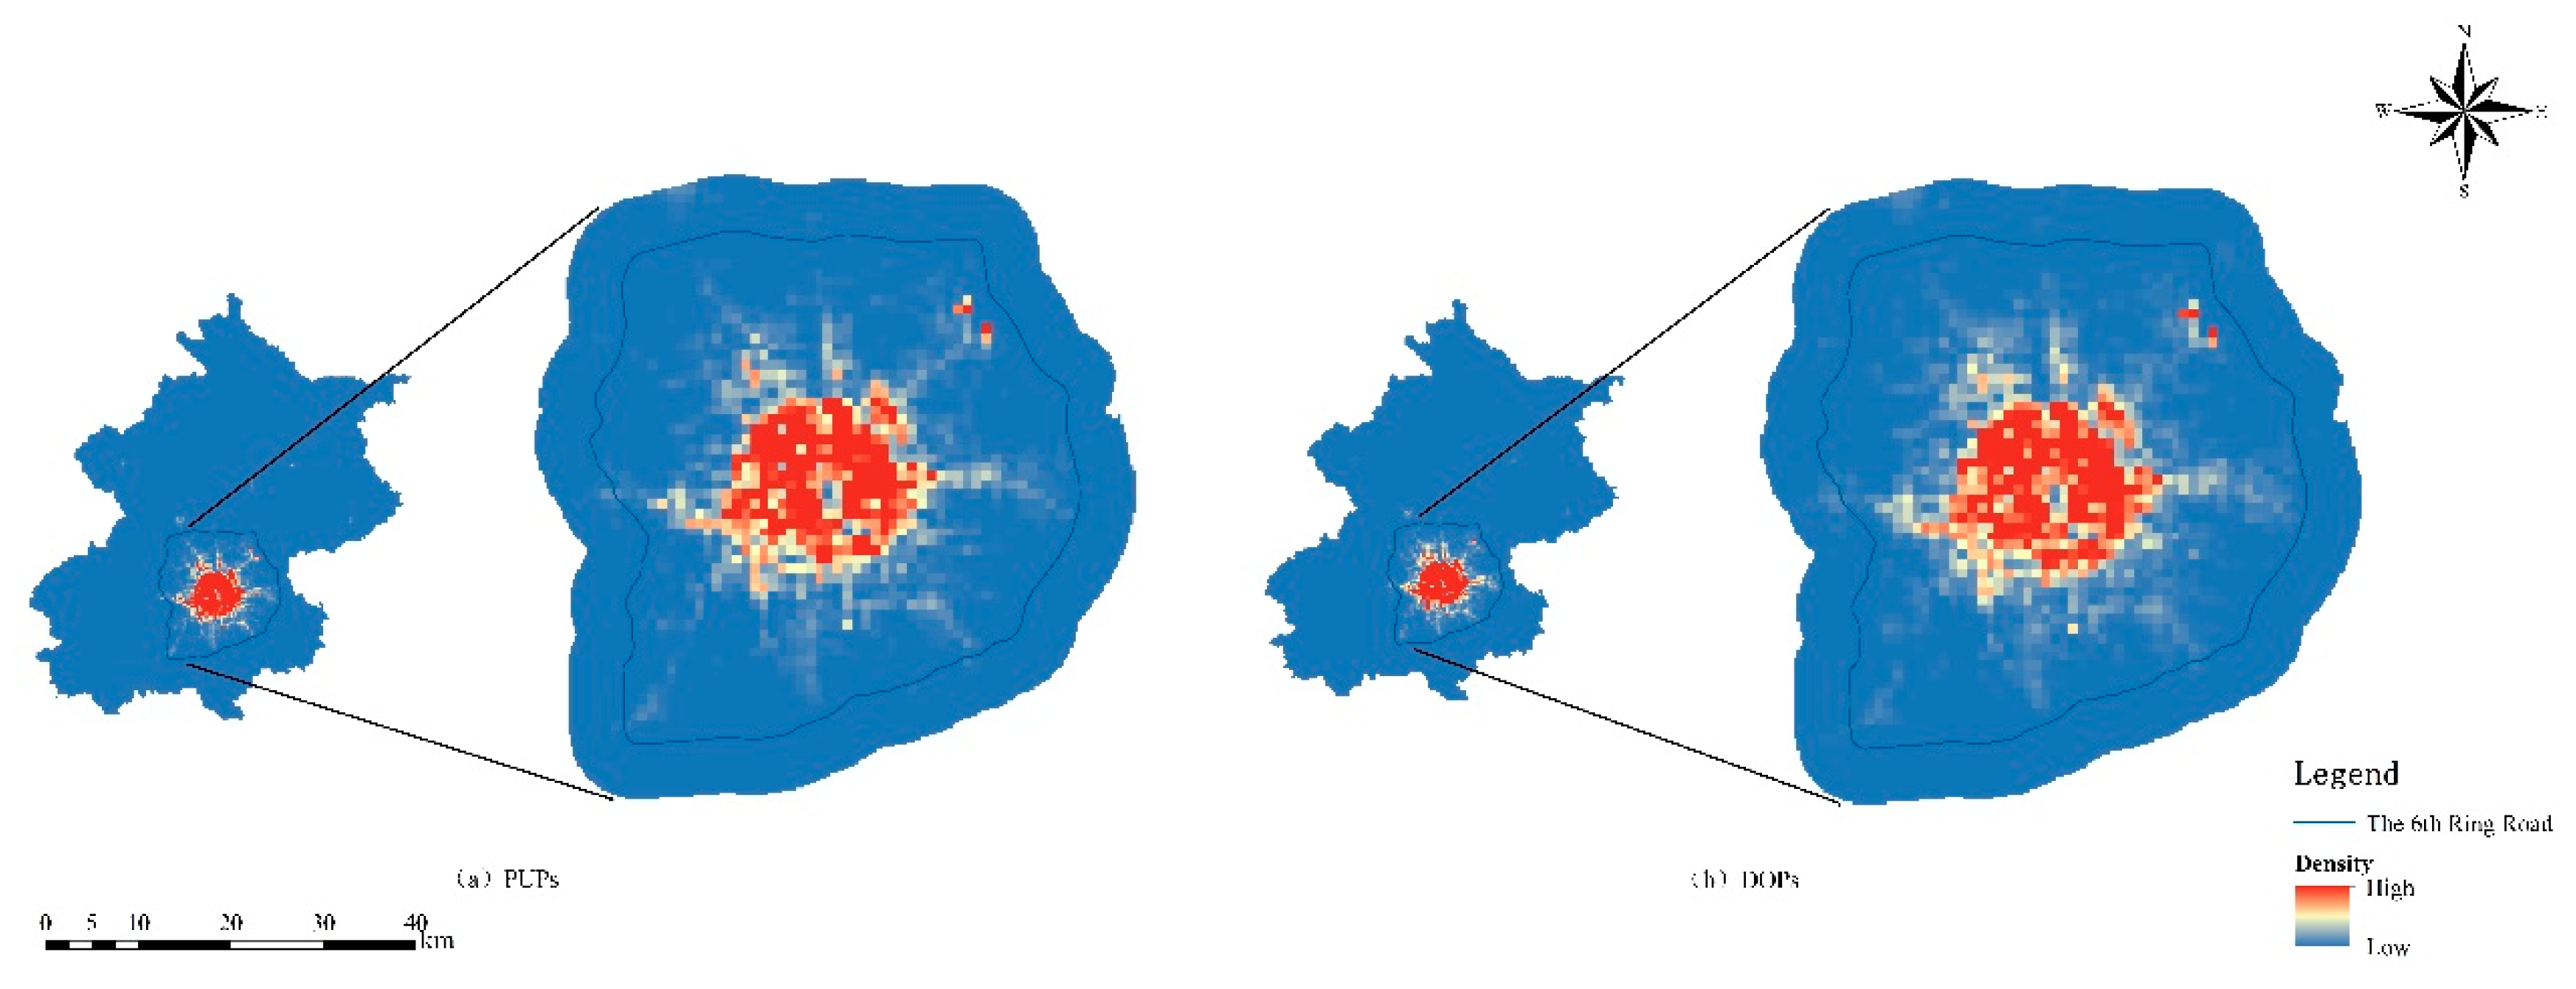
3.1. Spatial-Temporal Characteristics of PUPs and DOPs

According to the taxi OD data, the number of PUPs and DOPs in each hour is counted, that is, the number of times the state of passenger pick-up and drop-off changes from 0 to 1 and from 1 to 0 is calculated every hour. One pick-up and drop-off behavior represents a trip. A consecutive seven-day week taxi OD data set is used to conduct a comprehensive analysis at different hours. It can be seen from Figure 6 that the temporal sequences represented by curves of SP and SD are very similar. Seven 24-h cycles can be clearly identified. That is to say, the temporal distributions of both PUPs and DOPs roughly repeat in the seven days. At the same time, urban residents travel more during the day than at night. There are three peaks during the day, especially weekdays, at around 10:00, 14:00, and 19:00, which usually correspond to going to work, lunch, and going home. The low peak usually occurs at 4:00 and 5:00, when residents travel less frequently.
The global temporal distribution of PUPs and DOPs are plotted in Figure 7. There are differences in the number of PUPs and DOPs on weekdays and weekends (Figure 7). The number of PUPs and DOPs on weekdays is generally higher than the weekends. The number of PUPs and DOPs on the weekday fluctuates significantly with time, showing similarities in the distribution of time. The maximum of the morning peak is at 8:00–10:00 and the daily maximum is at 13:00–14:00. The morning peaks of taxis are delayed by 0.5–1 h compared with the commuting morning peaks. This may be due to the fact that taxis are more sensitive responsive and convenient than other transportation options, and they spend less time traveling. At the same time, the passengers are generally resident in the urban area during the commuting period, who mostly have medium and short-distances to travel. Therefore, these residents can depart later in the noncommuting time period to avoid traveling during the peak period and avoid early peak traffic jams. This results in a taxi morning peak that occurs later than the normal morning peak. Because taxis are more flexible and quicker than buses, the proportion of business trips is high. The peak travel time of taxis in the afternoon is also reflected in this point. At noon, normally lunch time, there are fewer travelers. The amount of trips on weekend days is obviously smaller than weekdays. The reason may be that the travel time of the residents is relatively free on the weekend, and the purpose of the trip is not the same as the weekdays. Most of the trips are intended for recreation, play, etc. Therefore, relatively few residents use a taxi to travel. At the same time, the morning peak of the weekend was delayed by 1 h compared with the weekday. The number of PUPs and DOPs fluctuates little with time from 12:00 to 21:00, and there was no obvious tendency to travel. However, the peak value of PUPs and DOPs in the evening occurred around 22:00–23:00. The main reason may be due to the lack of availability of buses and metros during this period of time; taxis are available and in demand.
Based on the taxi data, the demand for travel of residents on weekdays and weekends in Beijing has been analyzed. We can see from Figure 2 that the density distribution of pick-up and drop-off points of taxis in Beijing is mainly concentrated in the 6th Ring Road, and gradually decreases toward the urban periphery. However, there are also differences between the two, which shows that the density of drop-offs is higher than the density of pick-ups in some hotspots, such as the Capital Airport of Beijing, railway stations, China World Trade Center, and Zhongguancun. For some large-scale communities, the density of pick-ups is higher than the density of drop-offs spots, such as Huilongguan, Tiantongyuan, and Fangzhuang. Further, it can be seen from Figure 8 that the demand for travel of Beijing residents is mainly concentrated within the 6th Ring Road. At the same time, the travel demand in the central urban area is relatively larger than the outer ring. On the weekday, residents’ travel demand is mainly concentrated in Capital Airport of Beijing, China World Trade Center, Zhongguancun, Xinfadi, Yaojiayuan, and other hotspots. Relative to other regions, these regions have a greater demand for travel. Relative to weekdays, the demand for travel in these areas on the weekend is lower.
A travel intensity indicator is used to measure the travel demand of urban residents, which measures how much pressure the residents’ travel places on the transportation system. The indicator reflects the amount of travel and the travel time consumption, so travel intensity is defined as the product of the number of trips and the average travel time of a one-way trip. Travel intensity is a comprehensive index of residents’ travel demand, travel capacity, and level of urban transport services. In order to better reflect the form of Beijing residents’ travel, the taxi OD data was further used to analyze the travel intensity of residents on the weekday and weekend in Beijing based on the TAZ (Traffic Analysis Zone) scale. The identified resident travel ODs were spatialized, each line representing one trip. Travel time and related records are in the attribute table of ArcGIS layer. From Figure 9, it can be seen that the maximum travel intensity of taxis at weekdays in Beijing was 61 and the maximum intensity at weekends was 128. This may be due to the increase in the number of recreational and leisure entertainments by urban residents on weekends. At the same time, high-intensity travel in Beijing is mainly concentrated within the 6th Ring Road, and a single trip back and forth is mainly located outside the 6th Ring Road. This mainly comes from some new cities in Beijing, such as Pinggu, Yanqing, Miyun, and Huairou. It can also be seen that compared with the weekday, the number of residents who choose to travel outside the 6th Ring Road on weekends has increased, and travel between the central urban area and the new city has become more frequent.
According to the taxi GPS data, the travel time/distance between residents on weekdays and weekends in Beijing are analyzed. The average travel time/distance on weekdays in Beijing are 36.7 min and 8.7 km, respectively, and the average travel time and distance on weekends is 34.3 min and 8.1 km. As shown in Figure 10, the residents who travel more than 60 min on weekdays and weekends mainly came from the new towns of Beijing, such as Pinggu, Miyun, and Huairou. Trips less than 10 min are mainly from the inner area of the 5th Ring Road. At the same time, compared to weekdays, residents on weekends have a longer travel time and a wider range. It may be due to most residents choose to have fun or play on weekends. As shown in Figure 11, the residents who traveled long distances (>10 km) were mainly from outside the 6th Ring Road and the surrounding new towns of Beijing (e.g., Pinggu, Miyun, and Huairou), while those who travelled a short distance (<5 km) travel were mainly from within the 5th Ring Road area. The circular structure of the travel distance distribution also confirms the single-center urban structure of Beijing.

3.2. Multitime Scale Patterns of Urban Resident Travel

Figure 12 show the patterns of urban resident travel at different time scales (e.g., 30 min. and 60 min.) on weekdays and weekends. On weekdays, the morning peak of the OD flows appears from 7:00 to 11:00 and from 14:00 to 16:00 in the afternoon. The peak of the OD in the evening of the taxi is from 21:00 to 23:00. It may be due to the fact that the city’s public transport subways ceased operation in this period of time, causing residents to choose taxis travel to make a substantial increase. On weekends, the OD peak appears at 8:00~12:00 in the morning and 15:00~17:00 in the afternoon. The peak of the taxi OD flows in the evening is at 22:00~00:00. Compared with weekdays, the overall travel volume on weekends has decreased, while travel time of the morning peak has been delayed by nearly 1 h. After 15:00, the number of residents has gradually increased, residents’ nightlife continued until around 22:00 to 23:00 at night. At this time, with the continuous suspension of public transportation such as bus, subway, and other transportation, taxis are only a small number of travel tools, and demand has increased substantially.
As shown in Figure 12, the distribution of OD flows tends to fall in adjacent or same time periods at different time scales. When the time scale is 30 min, there are nearly 50.0% of the OD pairs that fall on the original time period, and another 40.0% fall on the adjacent time period. It can be seen that nearly half of the trips of residents may be within half an hour using taxis, and most of the trips are resolved within one hour. At the same time, we can see that travel in short time takes up the majority. Considering the popularization of bus, subway and other travel tools, and the relatively expensive price of taxis, the use of taxis by urban residents is mostly short trips.

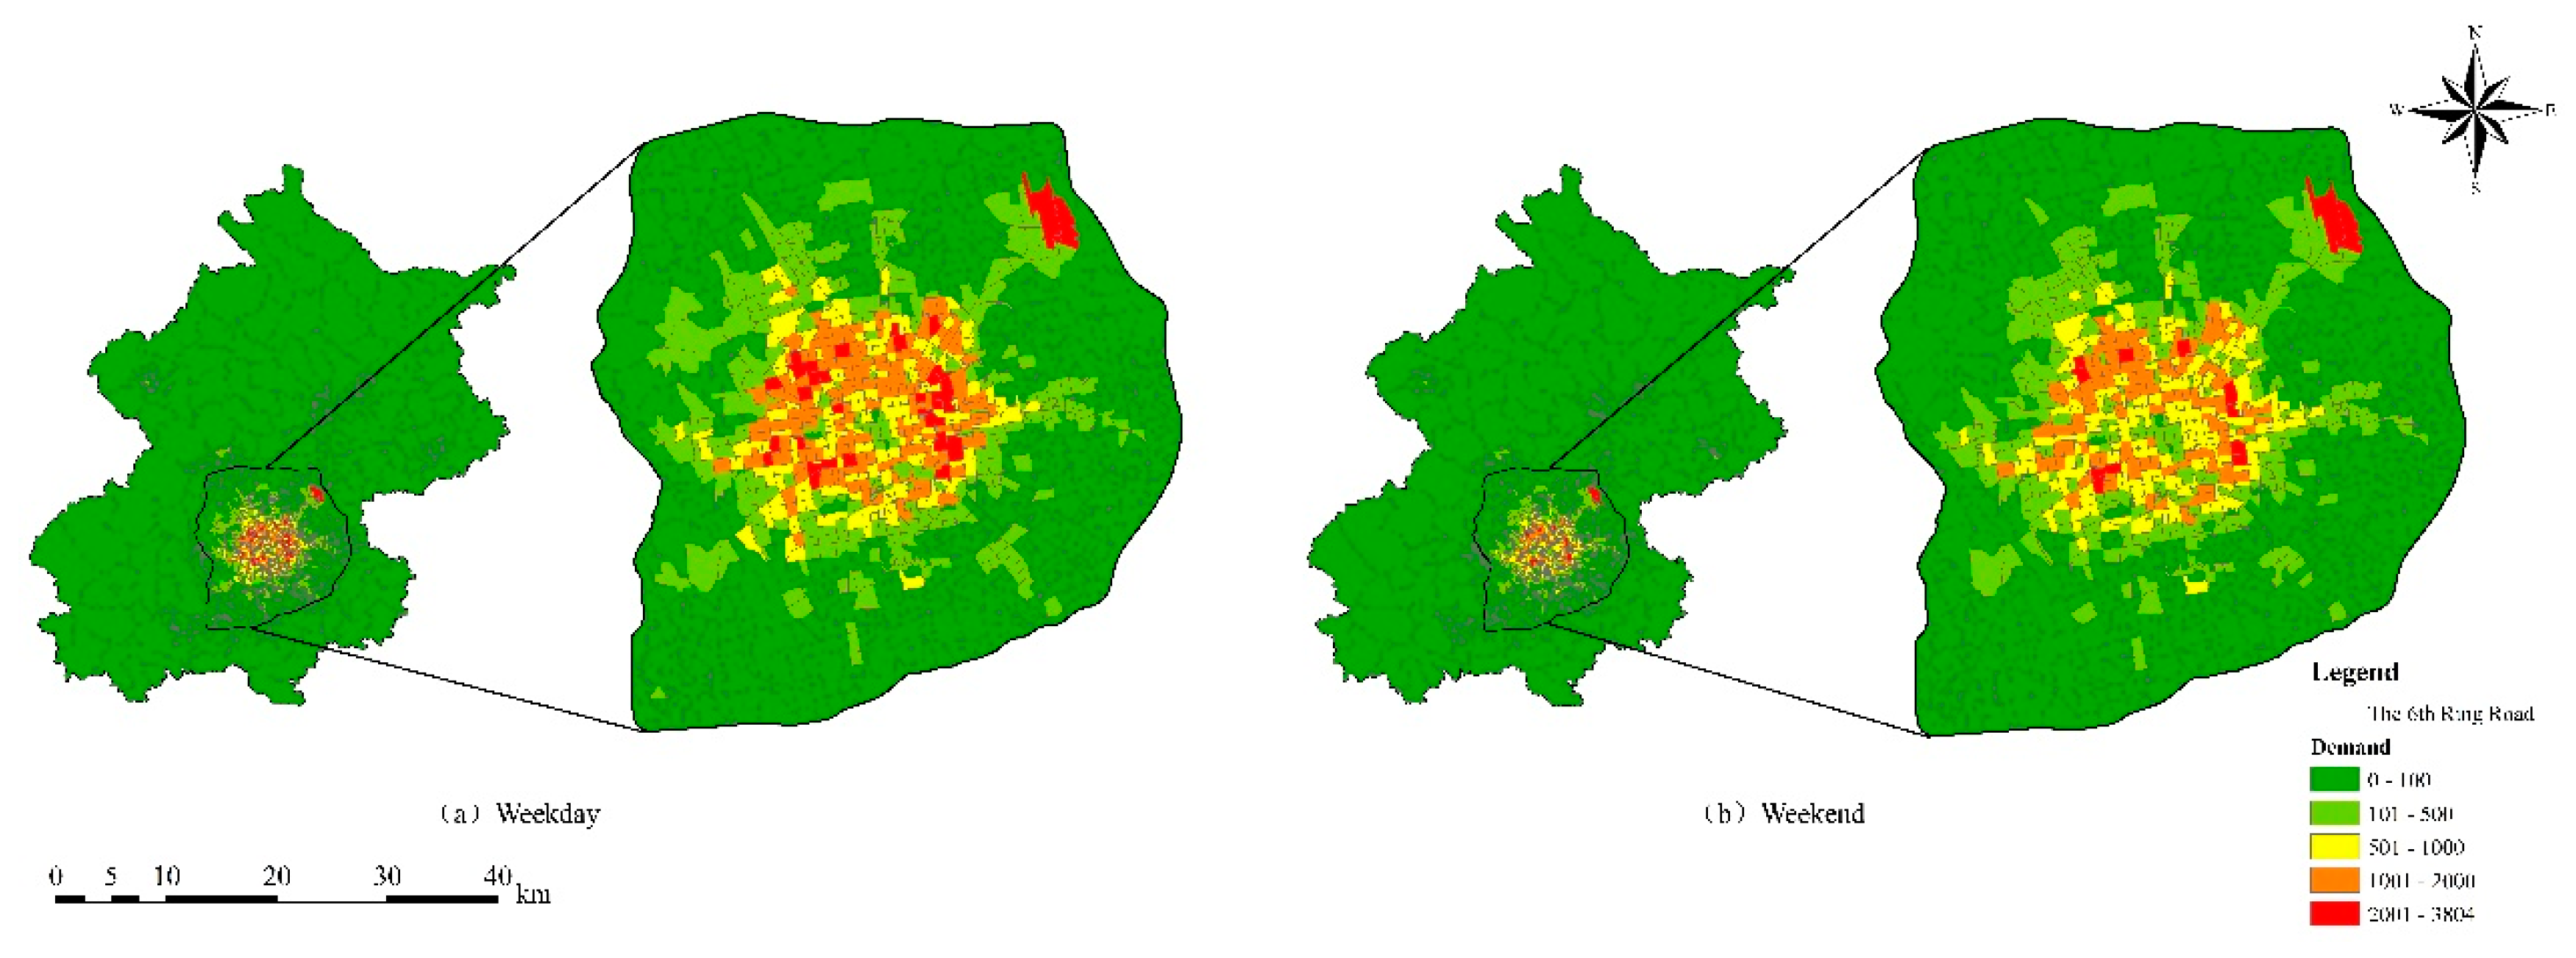
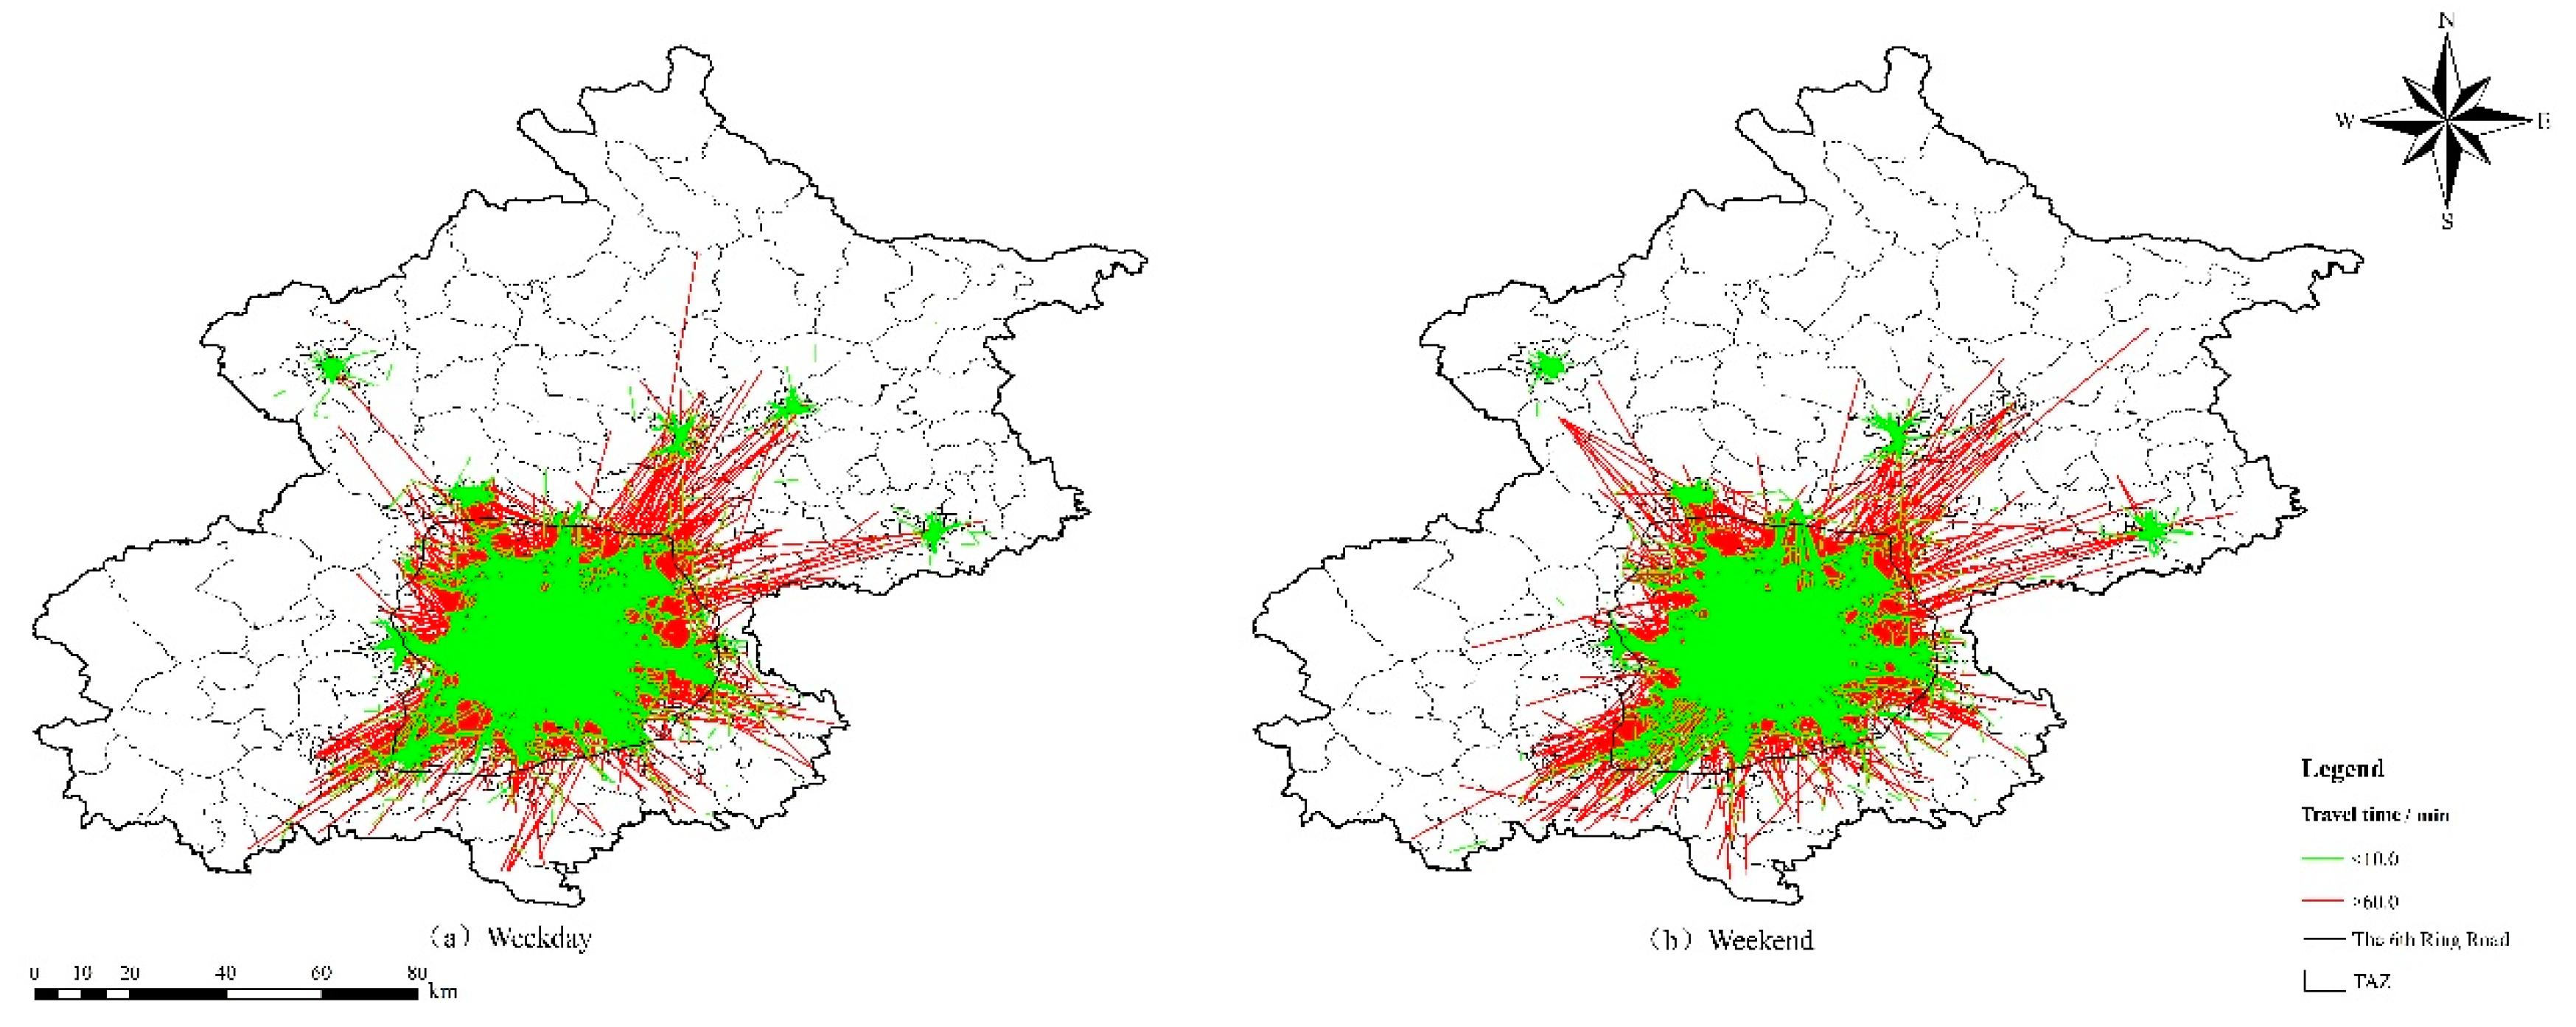
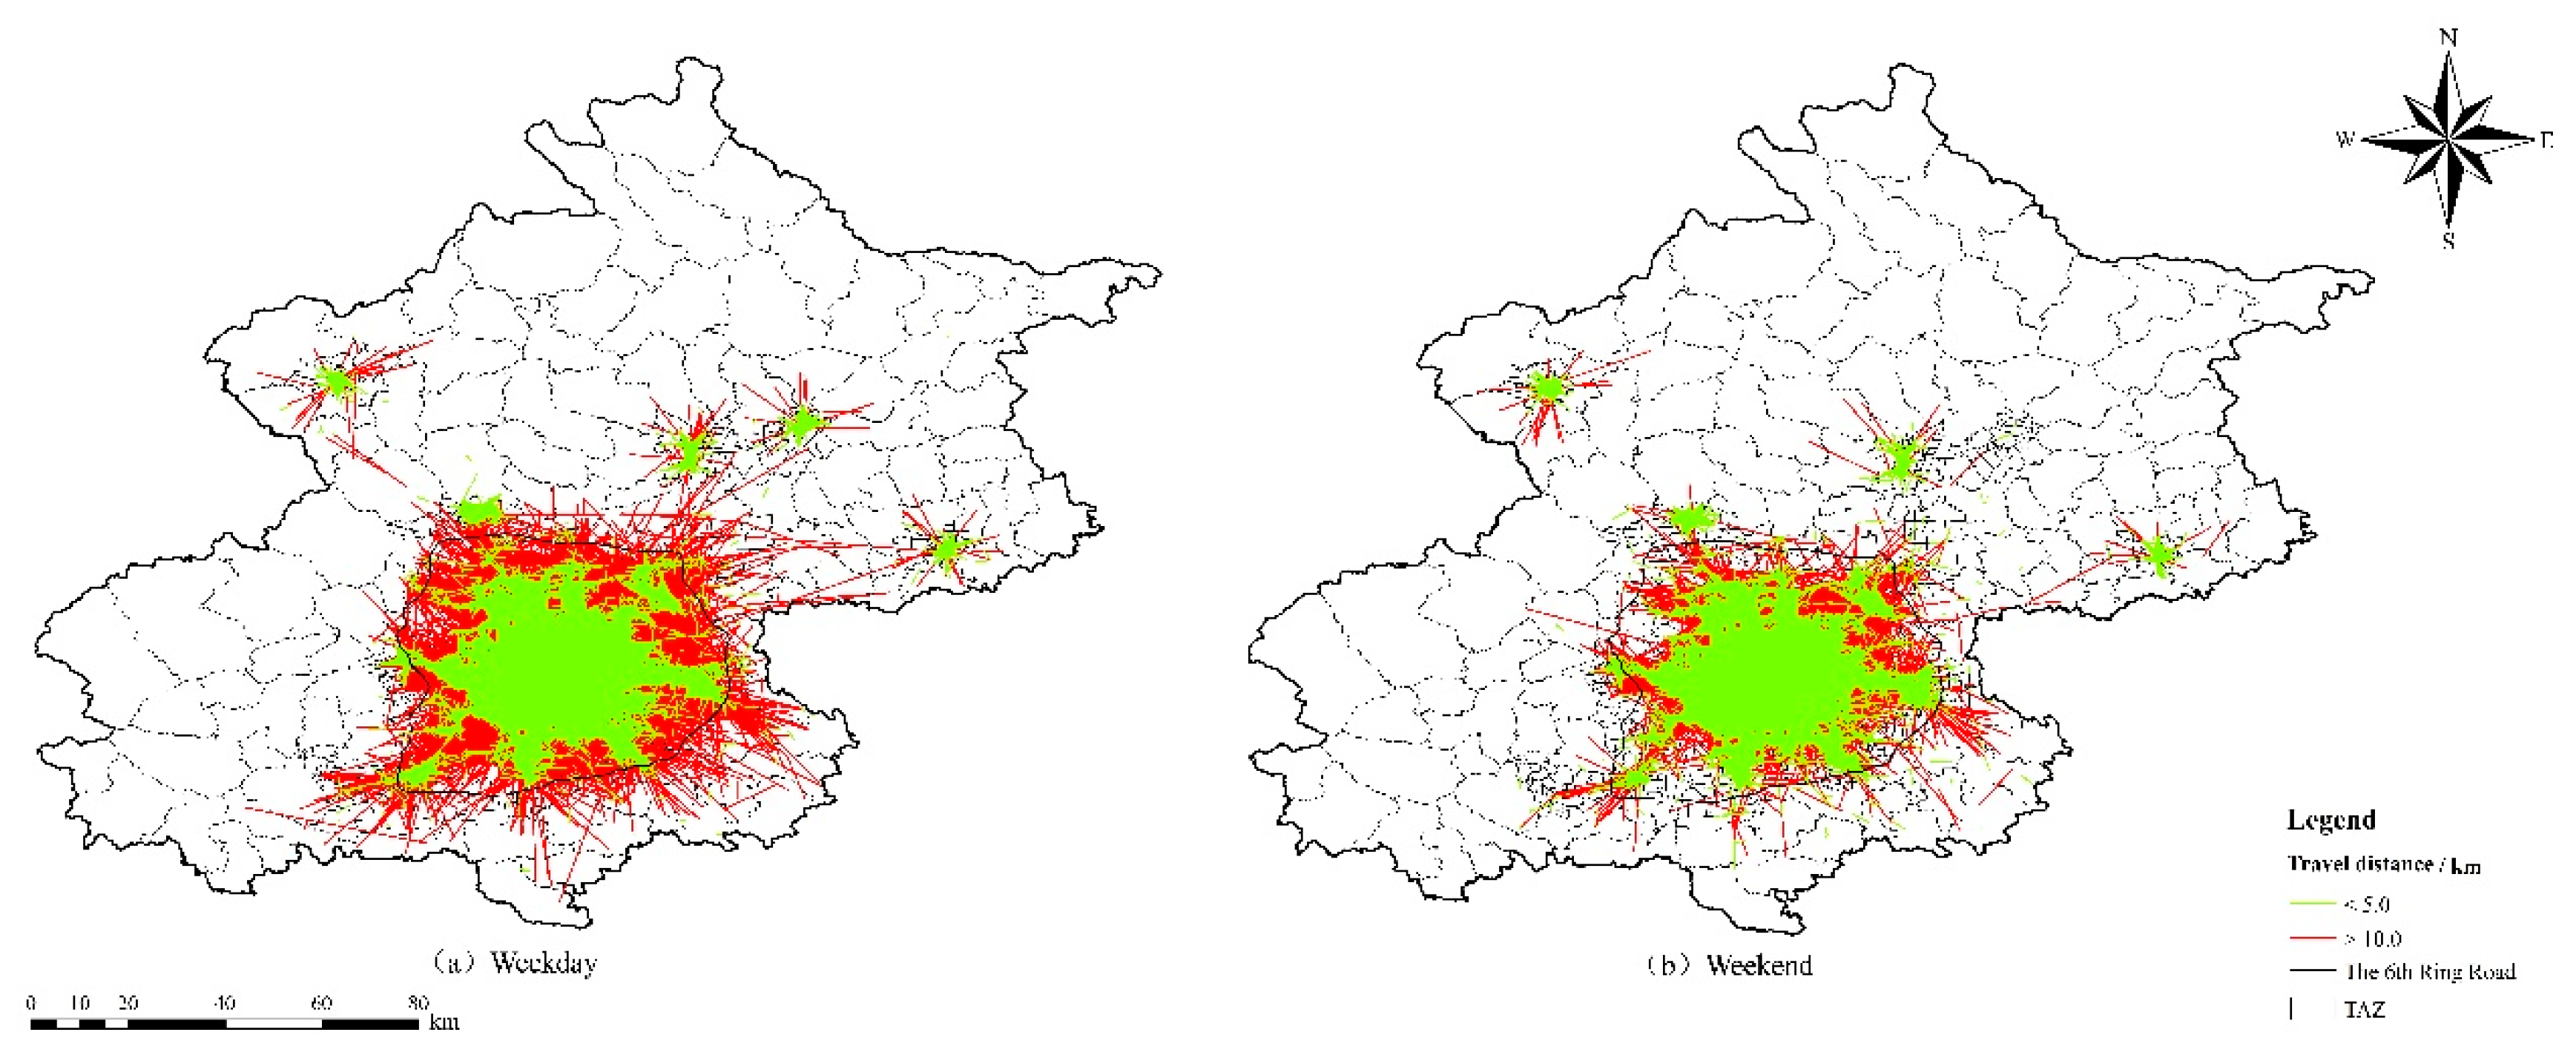
3.3. Spatial Multiscale Patterns of Urban Resident Travel

As shown in Figure 13, the chord diagram plot presents a complete inter-area OD flow system of taxis in Beijing. Each chord starts from the region of pick-ups and ends in the district of drop-offs. The direction of the flows is illustrated using arrowheads on each chord; it shows the visualization of OD flow in various regions of Beijing on weekdays and weekends. Residents’ travel in Beijing is mainly concentrated in the central area of the 6th Ring Road. The largest areas are CY and HD, followed by XC, FT, and DC. Areas with less travel are mainly concentrated in the new town of Beijing, such as PG and MTG, HR, YQ, MY, and other ecological conservation development areas. At the same time, it can be found that more than 50% of district and county OD inflows are mainly concentrated in the region, including CY and HD of the urban functional expansion zone, CP and FS of the new urban development zone, and some districts and counties of the ecological conservation development areas. Compared with the weekdays, the number of residents on weekends has decreased significantly, but the overall trend has little change. However, the outflow of taxi OD in some districts and counties has exceeded the situation in this region, such as HR, TZ, and SJS. Furthermore, the extended chord diagram plot used to analyze the unidirectional flow pattern of OD net travel traffic in various regions reveals interesting results. The net travel traffic value between two regions is calculated by the difference of two bilateral flow sizes, where only the positive net flow values are shown. For example, the average daily OD trip flow from HD to CP is 4000 trips, while there are only 1000 trips from CP to HD. The average net travel flow between these two regions is 3000 (4000 − 1000 = 3000) trips, and the net travel direction is from HD to CP. The length of the axes in Figure 13c,d represents the sum of the total net in-flows and total net out-flows. The bilateral net flows circular plot allows us to clearly identify the unbalanced inter-region travel corridors. The largest bilateral net migration on weekdays is the flow from XC to FT as shown in Figure 14 (and not from DC to CY as shown in Figure 13a), and the largest bilateral net migration on weekend is the flow from CY to SY as shown in Figure 14 (and not from CY to DC as shown in Figure 13b). For the major trip areas, such as FT, CP, and SY, the net flow values capture the intensity of net inflows. Similarly, for those major travel-sending areas such as CY, HD, and XC, higher net out flows are observed.
From the above analysis, it can be seen that residents’ travel of Beijing is mainly concentrated in the central area of the 6th Ring Road. Therefore, the streets in the 6th Ring Road of Beijing are taken as the object of the study. The grid area is used to divide the study area into 2 × 2, 4 × 4, and 8 × 8 regular grid, as shown in Figure 15. The different divisions represent different spatial scales. Here, the OD data of seven days (i.e., one week) in Beijing are used, divided by the weekdays and the weekend, to carry out the visual analysis to the OD flow of the taxis in different spatial scale.
The streets of the 6th Ring Road in Beijing are firstly divided into 2 × 2 regular grids (Figure 16a,d). As shown in Figure 16a,d, the NO.4 of the study area has the largest flows of trips, which is mainly due to the fact that this area contains most of the areas in Beijing, including Tiananmen Square, Chaoyang District, Fengtai District, and Daxing District. The travel volume of the other three grid areas is also relatively large, and the difference between these areas is small. At the same time, compared with the weekdays, the volume of trips in the four regions has decreased on weekends, but the overall trend was not significant. It can also be seen from the above that travel activities in the same area account for the majority and cross-regional travel is less under this spatial scale.
Further, the streets of the 6th Ring Road in Beijing are divided into 4 × 4 regular grids based on the method of recursive partitioning (Figure 16b,e). As shown in Figure 16b,e, the NO.11 of the study area has the largest flows of trips, which is mainly due to the fact that this area contains Tiananmen Square, many tourist attractions in the surrounding area and many transportation stations including the Beijing Railway Station and the Beijing South Railway Station. The daily traffic of the residents is huge. This is followed by areas NO.10, NO.7, and NO.6. The NO.10 of study area includes a large volume of travel areas such as Lugouqiao, Yangfang, and Wanshou Road. And this area also includes the Beijing West Railway Station and various research institutions. Therefore, the amount of trips is large in this area. In the No. 7 of the area, there are large travel areas including Wangjing and Sanlitun; the No. 6 of the area is also relatively large, mainly because it contains many colleges and universities such as Peking University, Tsinghua University, and Renmin University of China, as well as the Beijing North Station. Therefore, the amount of taxi trips is also large. Compared with the weekdays, the volume of trips in these regions has decreased on weekends, but the overall trend was not significant. It can also be seen from the above that travel activities in the same area account for the majority and cross-regional travel is less under this spatial scale. At the same time, it can also be seen that residents in the above areas have more activities in the same area. Compared with these areas, the traffic flow in other areas is getting smaller and smaller as they are getting farther from the central urban area.
On the basis of 4 × 4 grid, it is further divided into 8 × 8 regular grids. With the increasing intensity of the segmentation, the traffic flow between different regions becomes clearer (Figure 16c,f). As shown in Figure 16c,f, the NO. 28–30 and NO. 35–38 of the study area has the largest flows of trips, which is mainly due to the fact that these areas are mainly centered on Tiananmen Square. The area includes almost all of High-speed Railway Station, Railway Station, Airports, and other transportation hubs of Beijing. It also covers most of the tourism, shopping, and other entertainment venues. It is the core area of Beijing. At the same time, it is also the area where Beijing residents have the most travel demand. Compared with the weekdays, the volume of trips in these regions has decreased on weekends, but the overall trend was not significant. At the same time, it can also be seen that with increasing distance from the central urban areas, the traffic flow in other areas is getting smaller and smaller.
From the above analysis the further refinement of the urban spatial scale supports the straightforward identification of the core areas of the city using the visualization analysis method of OD flows. The greater the scale of division, the clearer the flow of traffic between regions becomes. At the same time, this method can also be used to see the traffic flow between different areas. It can characterize the OD flow of taxi trajectory, flow direction, and the properties characteristics of OD flow in different spatial-temporal scales. It can reveal the spatial-temporal patterns of OD flow data at multiple spatial-temporal scales so as to better understand of the flow pattern of urban human between inner areas of the city.

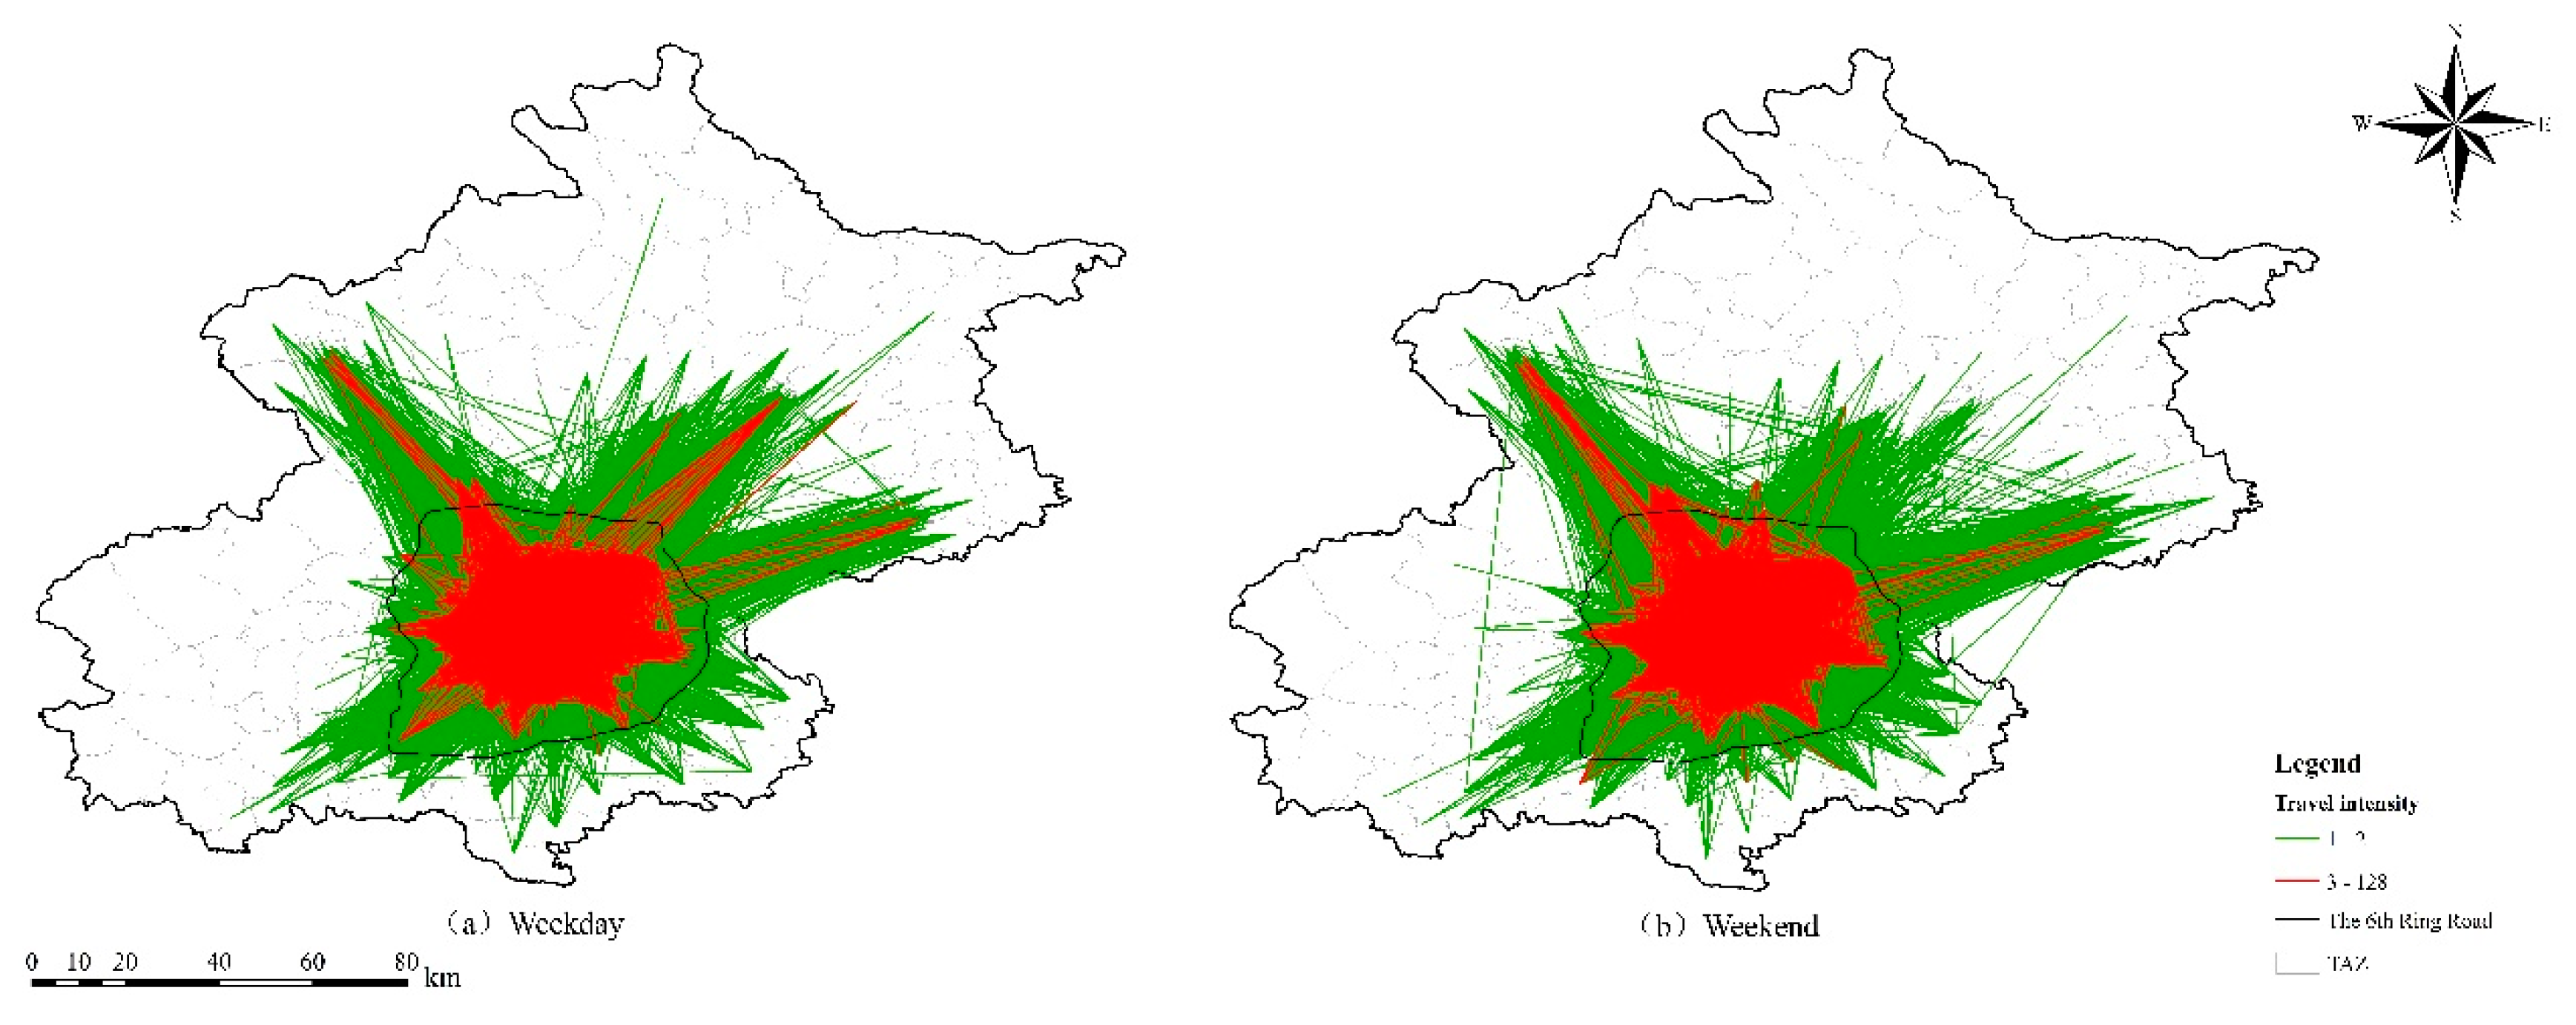
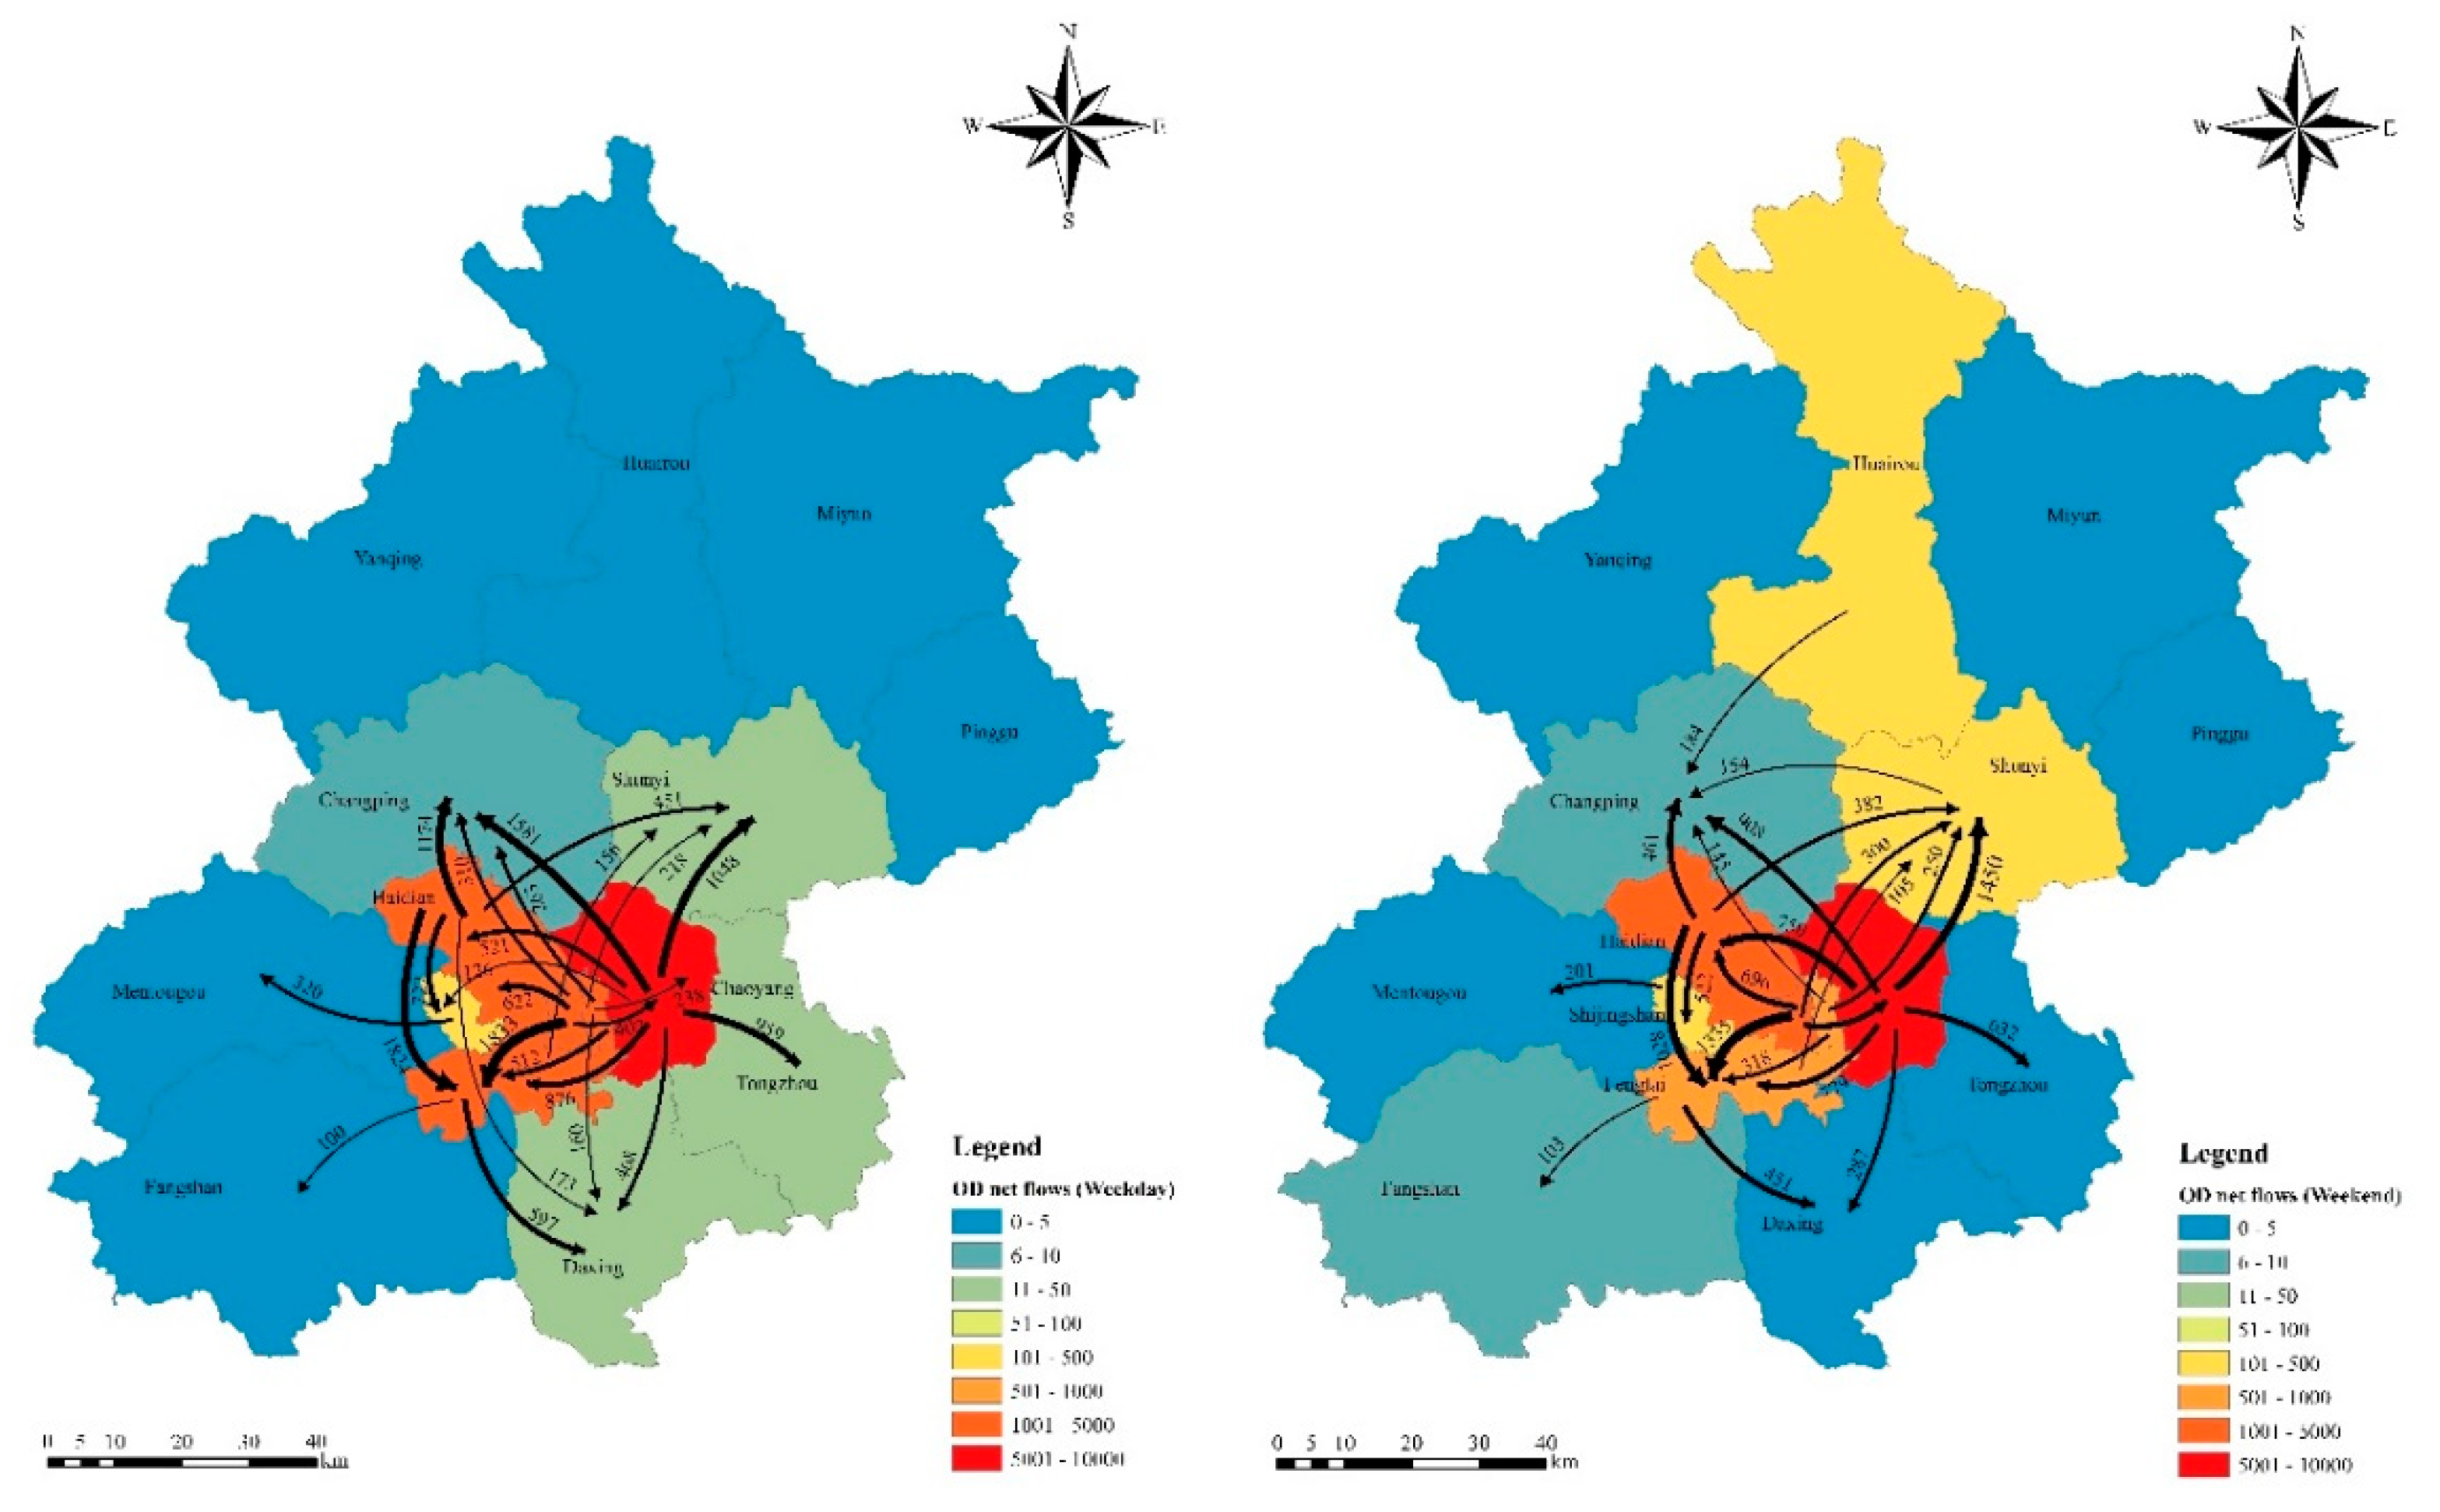
3.4. Spatial-Temporal Patterns of Urban Human Travel with Taxi OD Data

As an important flow subject in different areas of the city, taxis can be used to represent the inter-regional connectivity patterns. The OD flow with the characteristics of start–stop and direction can characterize the inter-area connectivity. Therefore, the hidden behavior patterns in the trajectory data can be revealed by analyzing the OD data of taxis, which will be helpful to study the rules of urban human travel. This paper uses OD data for seven days in one week in Beijing, divided into weekdays and weekends. The OD data at different spatial scales during the 7:00–10:00 and 17:00–20:00 for morning and evening rush hours of Beijing were visually analyzed to explore spatial-temporal patterns of urban human travel.
Figure 17 show the spatial-temporal patterns of OD data at different scales on weekdays and weekends. As shown in Figure 17, the areas with the largest volume of taxis in the morning and evening rush hour of Beijing are mainly centered on Tiananmen Square, and extend to the 4th Ring Road from South to North, including Beijing Railway Station, Beijing South Railway Station, Beijing West Railway Station, and many other transportation sites. The Beijing West Railway Station, which has the largest flow of traffic in Beijing, plus the Beijing Railway Stations and Beijing South Railway Stations, result in huge travel needs to residents entering and leaving the stations. As one of the main tools of transportation in the city, taxis are an important mode of transportation for passengers to enter and leave the railway stations. Therefore, the travel volume in this area is the largest. It was mainly reflected in NO. 4 of Figure 16a, and the proportion of outer rings is the largest. While the proportion of outer rings of NO. 11 and NO. 10 in Figure 16b is also larger. It can be seen that Beijing West Railway Station and Beijing South Railway Station have the largest scale of operations among the many railway stations in the city, and the corresponding passenger traffic is also the largest. Compared to the weekends, we can see that these areas have a large amount of travel between 7:00 and 10:00 on weekdays. However, the number of trips decreased from 17:00 to 20:00, the overall trend has changed little. The main reason is that the period from 7:00 to 10:00 on weekdays belongs to the morning peak of work. The residents have a large number of trips, and the amount of trips at the time will be reduced on weekends. Most residents would chose to entertain and go shopping during the period from 17:00 to 20:00 on weekends, resulting in an increase in the number of trips during the period compared with the weekdays. At the same time, it can also be seen that residents in these areas have more activities in the same area. With the increasing distance from the central urban areas, the traffic flow in other areas is getting smaller and smaller.
At the same time, it can be seen that compared with Shunyi District, the amount of taxis entering Tongzhou District is the smallest; in particular, the amount of taxi travel is almost negligible in the period of 17:00–20:00. The Capital Airport of Beijing is located in Shunyi District (NO. 2 of 2 × 2 grid), and the amount of trips in the area is also relatively large. Tongzhou District is mostly a residential area, so the demand of the taxis is relatively small. In comparison with the outer ring of NO. 7 in 4 × 4 grid at different time periods, it can be seen that the travel volume experiences little change between the morning and evening rush hours on weekdays. On the weekends, the amount of the travel in the period of 17:00–20:00 is higher than the period of 7:00–10:00. This may be due to the fact that the area contains well-known areas such as Wangjing and Sanlitun. These areas have a large amount of travel, especially during the period of 17:00–20:00, resulting in a large amount of taxis entering and leaving from 17:00 to 20:00 on weekends.

4. Discussion and Conclusions

The initial aims of this research focus on how to explore and analyze the characteristics and patterns of urban residents’ travel using taxi GPS data. We propose solutions to these problems by establishing a set of simple, universal, and effective methods. In this paper, we use trajectory data of GPS-equipped taxis in Beijing, China to extract a large volume of trips of anonymous customers and to explore urban human travel spatial-temporal characteristics and patterns. The spatial distribution patterns of PUPs and DOPs on weekdays and weekends are firstly analyzed. In addition, travel demand, intensity, time, and distance on weekdays and weekends are used to explore human mobility by extracting taxi data. Furthermore, this study introduces and applies a new adapted chord diagram plot to visualize taxi OD flows with different space-time scales, revealing the travel patterns of residents. The method can characterize the volume, direction and properties of OD flows in multiple spatial-temporal scales; it is implemented using a circular visualization package in R (circlize). Through the visualization experiment of taxi GPS trajectory data in Beijing, the results show that the proposed visualization technology is able to characterize the spatial-temporal patterns of trajectory OD flows in multiple spatial-temporal scales. This approach utilizes the massive taxi trajectory data from complicated real-world traffic situations to accurately reflect the true spatial-temporal characteristics and patterns of urban travel.
PUPs and DOPs play different roles in traffic generation and attraction; they consider the problem from different perspectives [23]. For example, PUPs represent generation of travel demand from a passenger’s perspective, while they also reflect the attraction for taxi drivers to look for riders. Therefore, it is critical to explore their spatial-temporal characteristics and patterns in depth. Previous studies are limited in their ability to visualize multiscale spatial-temporal trajectories in big data, and it is more difficult to reveal the characteristics of OD stream data [42,43,44,45,46,47,48,49,50]. The methods in this study have the advantage of being able to explore and analyze spatial-temporal characteristics and patterns of urban resident travel in a unique way. The results above verify that the set of methods, including the proposal for the new adapted chord diagram plot method, is a valid tool for analyzing the urban road traffic characteristics and patterns of urban resident travel. The methods proposed in this paper and the corresponding results provide a new perspective for understanding spatial variability of resident travel flow across weekdays and weekends that is essential for sustainable traffic management.
The urbanization process in China has been rapid, and urban structures of world-level cities, such as Beijing, are becoming more complex. Big data provide opportunities to conduct empirical research on urban human travel characteristics and patterns. Furthermore, exploring the corresponding urban structures can break ground for new theoretical studies and contribute to urban and transportation planning. The methods provided in this study are also suitable for the analysis of other cities with similar data sources. However, it should be noted that taxi data inevitably encounter issues of representativeness, that is, mobile users and taxi passengers are not random samples of the population. Another representativeness issue of the taxi data is that residents can choose different transportation modes, such as driving a private car, taking a bus or metro, or taking a taxi for various trip purposes. It is natural that different modes are associated with different patterns. Some travel, such as long-distance commuting, is hardly reflected by taxi trajectories. Most existing data are only able to show city characteristics from a specific perspective. Further studies may expand the data source to include private vehicles, bus, and metro trips. This combination of diverse data can describe human mobility and urban structure in more dimensions, providing a multifaceted picture of urban dynamics. In addition, the conclusions drawn from taxi trip data could also contribute to the improvement of other transportation modes because of their complementary relationships. Therefore, we suggest that taxi trips constitute a relatively stable proportion of intracity travels; they provide a large data volume that is highly precise. Taxi data are reasonable to represent intracity spatial interactions and to reveal city structure. The data source may also be expanded on the temporal dimension. The availability of long-period human mobility data can make it possible to detect changes in the urban structure and validate the effect of policies.

Author Contributions

Conceptualization, Hong Huang and Weihua Zeng; Data curation, Xiaoyong Ni; Funding acquisition, Weihua Zeng; Methodology, Huihui Wang and Weihua Zeng; Resources, Hong Huang and Xiaoyong Ni; Visualization, Huihui Wang; Writing—original draft, Huihui Wang.

Funding

This research was supported by the Reform and Development Research Program of Ministry of Science and Technology “Imperative and significant problems to addressing climate change after Paris Conference” (No. YJ201603).

Acknowledgments

This research was supported by the Reform and Development Research Program of Ministry of Science and Technology “Imperative and significant problems to addressing climate change after Paris Conference” (No. YJ201603). The authors would like to thank the researchers from HeFei University of Technology for their support and help, as well as the anonymous reviewers for their helpful and constructive comments.

Conflicts of Interest

The authors declare no conflicts of interest.

References

  1. Liu, X.; Gong, L.; Gong, Y.; Liu, Y. Revealing travel patterns and city structure with taxi trip data. J. Transp. Geogr. 2015, 43, 78–90. [Google Scholar] [CrossRef] [Green Version]
  2. Sang, S.; O’Kelly, M.; Kwan, M.P. Examining commuting patterns: Results from a journey-to-work model disaggregated by gender and occupation. Urban Stud. 2011, 48, 891–909. [Google Scholar] [CrossRef]
  3. Liu, Y.; Wang, F.; Xiao, Y.; Gao, S. Urban land uses and traffic ‘source-sink areas’: Evidence from gps-enabled taxi data in shanghai. Landsc. Urban Plan. 2012, 106, 73–87. [Google Scholar] [CrossRef]
  4. Gao, S. Spatio-Temporal Analytics for Exploring Human Mobility Patterns and Urban Dynamics in the Mobile Age. Spat. Cogn. Comput. 2015, 15, 86–114. [Google Scholar] [CrossRef]
  5. Kim, J.; Thapa, B.; Jang, S.; Yang, E. Seasonal spatial activity patterns of visitors with a mobile exercise application at Seoraksan National Park, South Korea. Sustainability 2018, 10, 2263. [Google Scholar] [CrossRef]
  6. Chowell, G.; Hyman, J.M.; Eubank, S.; Castillo-Chavez, C. Scaling laws for the movement of people between locations in a large city. Phys Rev. E 2003, 68, 066102. [Google Scholar] [CrossRef] [PubMed]
  7. Ratti, C.; Frenchman, D.; Pulselli, R.M.; Williams, S. Mobile landscapes: Using location data from cell phones for urban analysis. Environ. Plan. B 2006, 33, 727–748. [Google Scholar] [CrossRef]
  8. González, M.C.; Hidalgo, C.A.; Barabási, A.L. Understanding individual human mobility patterns. Nature 2008, 453, 779–782. [Google Scholar] [CrossRef]
  9. Jiang, B.; Yin, J.; Zhao, S. Characterizing the human mobility pattern in a large street network. Phys. Rev. E 2009, 80, 021136. [Google Scholar] [CrossRef] [Green Version]
  10. Kang, C.; Ma, X.; Tong, D.; Liu, Y. Intra-urban human mobility patterns: An urban morphology perspective. Phys. A 2012, 391, 1702–1717. [Google Scholar] [CrossRef]
  11. Rhee, I.; Shin, M.; Hong, S.; Lee, K.; Chong, S. On the Levy-walk nature of human mobility. In Proceedings of the IEEE INFOCOM, Piscataway, NJ, USA, 11–16 March 2008; pp. 924–932. [Google Scholar]
  12. Song, C.; Barabási, A.L. Limits of predictability in human mobility. Science 2010, 327, 1018–1021. [Google Scholar] [CrossRef]
  13. Song, C.; Koren, T.; Wang, P.; Barabási, A. Modelling the scaling properties of human mobility. Nat. Phys. 2010, 6, 818–823. [Google Scholar] [CrossRef] [Green Version]
  14. Yuan, Y.; Raubal, M.; Liu, Y. Correlating mobile phone usage and travel behavior—A case study of Harbin, China. Comput. Environ. Urban 2012, 36, 118–130. [Google Scholar] [CrossRef]
  15. Sevtsuk, A.; Ratti, C. Does urban mobility have a daily routine? Learning from the aggregate data of mobile networks. J. Urban Technol. 2010, 17, 41–60. [Google Scholar] [CrossRef]
  16. Ahas, R.; Aasa, A.; Silm, S.; Tiru, M. Daily rhythms of suburban commuters’ movements in the Tallinn metropolitan area: Case study with mobile positioning data. Transport Res C-Emer. 2010, 18, 45–54. [Google Scholar] [CrossRef]
  17. Jiang, B.; Liu, C. Street—based topological representations and analyses for predicting traffic flow in GIS. Int. J. Geogr. Inf. Sci. 2009, 23, 1119–1137. [Google Scholar] [CrossRef]
  18. Liu, Y.; Kang, C.; Gao, S.; Xiao, Y.; Tian, Y. Understanding intra-urban trip patterns from taxi trajectory data. J. Geogr. Syst. 2012, 14, 463–483. [Google Scholar] [CrossRef]
  19. Li, Q.; Zhang, T.; Wang, H.; Zeng, Z. Dynamic accessibility mapping using floating car data: A network-constrained density estimation approach. J. Transp. Geogr. 2011, 19, 379–393. [Google Scholar] [CrossRef]
  20. Kang, C.; Qin, K. Understanding operation behaviors of taxicabs in cities by matrix factorization. Comput. Environ. Urban 2016, 60, 79–88. [Google Scholar] [CrossRef]
  21. Sun, J.B.; Yuan, J.; Wang, Y.; Si, H.B.; Shan, X.M. Exploring space–time structure of human mobility in urban space. Phys. A 2011, 390, 929–942. [Google Scholar] [CrossRef]
  22. Castro, P.S.; Zhang, D.; Chen, C.; Li, S.; Pan, G. From taxi GPS traces to social and community dynamics: A survey. ACM Comput. Surv. (CSUR) 2013, 46, 1–34. [Google Scholar] [CrossRef]
  23. Zhang, S.; Tang, J.; Wang, H.; Wang, Y.; An, S. Revealing intra-urban travel patterns and service ranges from taxi trajectories. J. Transp. Geogr. 2017, 61, 72–86. [Google Scholar] [CrossRef]
  24. Stopher, P.; FitzGerald, C.; Zhang, J. Search for a global positioning system device to measure person travel. Transport Res C-Emer. 2008, 16, 350–369. [Google Scholar] [CrossRef]
  25. Wolf, J.; Oliveira, M.; Thompson, M. The impact of trip underreporting on VMT and travel time estimates: Preliminary findings from the California statewide household travel survey GPS study. Transp. Res. Rec. 2003, 1854, 189–198. [Google Scholar] [CrossRef]
  26. Dai, X.; Ferman, M.A.; Roesser, R.P. A simulation evaluation of a real-time traffic information system using probe vehicles. In Proceedings of the IEEE Intelligent Transportation Systems 1, Shanghai, China, 12–15 October 2003; pp. 475–480. [Google Scholar]
  27. Kühne, R.; Schäfer, R.-P.; Mikat, J.; Thiessenhusen, K.-U.; Böttger, U.; Lorkowski, S. New approaches for traffic management in metropolitan areas. In Proceedings of the 10th IFAC Symposium, Tokyo, Japan, 4–6 August 2003; pp. 4–6. [Google Scholar]
  28. Lü, W.; Zhu, T.; Wu, D.; Dai, H.; Huang, J. A heuristic path-estimating algorithm for large-scale real-time traffic information calculating. SCI China Ser. E 2008, 51, 165–174. [Google Scholar]
  29. Tong, D.; Coifman, B.; Merr, C.J. New perspectives on the use of GPS and GIS to support a highway performance study. Trans. GIS 2009, 13, 69–85. [Google Scholar] [CrossRef]
  30. Berkow, M.; Monsere, C.; Koonce, P.; Bertini, R.; Wolfe, M. Prototype for data fusion using stationary and mobile data: Sources for improved arterial performance measurement. Transp. Res. Rec. 2009, 2099, 102–112. [Google Scholar] [CrossRef]
  31. Bricka, S.; Bhat, C.R. A comparative analysis of GPS-based and travel survey-based data. Transp. Res. Rec. 2006, 1972, 9–20. [Google Scholar] [CrossRef]
  32. Liu, L.; Andris, C.; Ratti, C. Uncovering cabdrivers’ behaviour patterns from their digital traces. Comput. Environ. Urban 2010, 34, 541–548. [Google Scholar] [CrossRef]
  33. Andrienko, G.; Andrienko, N. A visual analytics approach to exploration of large amounts of movement data. In Proceedings of the 10th international conference on Visual Information Systems VISUAL ’08, Salerno, Italy, 11–12 September 2008; pp. 1–4. [Google Scholar]
  34. Andrienko, G.; Andrienko, N.; Rinzivillo, S.; Nanni, M.; Pedreschi, D.; Giannotti, F. Interactive visual clustering of large collections of trajectories. In Proceedings of the IEEE Symposium on Visual Analytics Science and Technology, Atlantic City, NJ, USA, 11–16 October 2009; pp. 3–10. [Google Scholar]
  35. Andrienko, G.; Andrienko, N.; Dykes, J.; Fabrikant, S.I.; Wachowicz, M. Geovisualization of dynamics, movement and change: Key issues and developing approaches in visualization research. Inf. Vis. 2008, 7, 173–180. [Google Scholar] [CrossRef]
  36. Dodge, S.; Weibel, R.; Lautenschütz, A.K. Towards a taxonomy of movement patterns. Inf. Vis. 2008, 7, 240–252. [Google Scholar] [CrossRef] [Green Version]
  37. Yue, Y.; Zhuang, Y.; Li, Q.; Mao, Q. Mining time-dependent attractive areas and movement patterns from taxi trajectory data. In Proceedings of the 2009 17th International Conference on Geoinformatics, Fairfax, VA, USA, 12–14 August 2009; pp. 1–6. [Google Scholar]
  38. Guo, D.; Zhu, X.; Jin, H.; Gao, P.; Andris, C. Discovering Spatial Patterns in Origin—Destination Mobility Data. Trans. GIS 2012, 16, 411–429. [Google Scholar] [CrossRef]
  39. Ferreira, N.; Poco, J.; Vo, H.T.; Freire, J.; Silva, C.T. Visual exploration of big spatio-temporal urban data: A study of New York city taxi trips. IEEE Tran. Vis. Comput. Graph. 2013, 19, 2149–2158. [Google Scholar] [CrossRef] [PubMed]
  40. Wang, Z.; Ye, T.; Lu, M.; Yuan, X.; Qu, H.; Yuan, J.; Wu, Q. Visual exploration of sparse traffic trajectory data. IEEE Tran. Vis. Comput. Graph. 2014, 20, 1813–1822. [Google Scholar] [CrossRef] [PubMed]
  41. Feng, T.; Ai, T.H.; Yang, W.; Zhang, X.; Xin, R.; Chen, X.Y. Visual analysis of residents travel pattern based on Circos Graph. J. Cent. China Norm. Univ. (Nat. Sci.) 2016, 50, 471–480. (In Chinese) [Google Scholar]
  42. Tobler, W.R. Experiments in migration mapping by computer. Am. Cartogr. 1987, 14, 155–163. [Google Scholar] [CrossRef]
  43. Andrienko, G.; Andrienko, N. Spatio-temporal aggregation for visual analysis of movements. In Proceedings of the 2008 IEEE Symposium on visual analytics science and technology, Sacramento, CA, USA, 30 October–1 November 2008; pp. 51–58. [Google Scholar]
  44. Wood, J.; Dykes, J.; Slingsby, A. Visualisation of origins, destinations and flows with OD maps. Cartogr. J. 2010, 47, 117–129. [Google Scholar] [CrossRef]
  45. Guo, H.; Wang, Z.; Yu, B.; Zhao, H.; Yuan, X. Tripvista: Triple perspective visual trajectory analytics and its application on microscopic traffic data at a road intersection. In Proceedings of the 2011 IEEE Pacific Visualization Symposium (PacificVis), Hong Kong, China, 1–4 March 2011; pp. 163–170. [Google Scholar]
  46. Liu, L.; Biderman, A.; Ratti, C. Urban mobility landscape: Real time monitoring of urban mobility patterns. In Proceedings of the 11th International Conference on Computers in Urban Planning and Urban Management, Hong Kong, China, 16–18 June 2009; pp. 1–16. [Google Scholar]
  47. Hurter, C.; Tissoires, B.; Conversy, S. Fromdady: Spreading aircraft trajectories across views to support iterative queries. IEEE Trans. Vis. Comput. Graph. 2009, 15, 1017–1024. [Google Scholar] [CrossRef] [PubMed]
  48. Slingsby, A.; Wood, J.; Dykes, J. Treemap cartography for showing spatial and temporal traffic patterns. J. Maps 2010, 6, 135–146. [Google Scholar] [CrossRef]
  49. Liu, H.; Gao, Y.; Lu, L.; Liu, S.; Qu, H.; Ni, L.M. Visual analysis of route diversity. In Proceedings of the IEEE Conference on Visual Analytics Science and Technology, Rhode Island, UK, 23–28 October 2011; pp. 171–180. [Google Scholar]
  50. Lu, M.; Wang, Z.; Liang, J.; Yuan, X. OD-Wheel: Visual design to explore OD patterns of a central region. In Proceedings of the 2015 IEEE Pacific Visualization Symposium (PacificVis), Hangzhou, China, 14–17 April 2015; pp. 87–91. [Google Scholar]
  51. Beijing Municipal Bureau of Statistics (BMBS). Beijing Statistical Yearbook; Beijing Municipal Bureau of Statistics: Beijing, China, 2006–2016. Available online: http://tjj.beijing.gov.cn/nj/main/2016-tjnj/zk/indexch.htm.2016.11.04 (accessed on 13 January 2019).
  52. Beijing Municipal Commission of Transport (BMCT); Beijing Transport Institute (BTI). Fifth Comprehensive Survey on Urban Traffic in Beijing; Beijing Municipal Commission of Transport: Beijing, China, 2016.
  53. Gu, Z.; Gu, L.; Eils, R.; Schlesner, M.; Brors, B. Circlize implements and enhances circular visualization in R. Bioinformatics 2014, 30, 2811–2812. [Google Scholar] [CrossRef] [PubMed]
  54. Qi, W.; Abel, G.J.; Muttarak, R.; Liu, S. Circular visualization of China’s internal migration flows 2010–2015. Environ. Plan. A 2017, 49, 2432–2436. [Google Scholar] [CrossRef]
Figure 1. The Beijing study area.
Ijgi 08 00257 g001
Figure 2. Spatial distributions of the density of pick-up points (PUPs) and drop-off points (DOPs).
Ijgi 08 00257 g002
Figure 3. Two-dimensional matrix and visualization effects of origin–destination (OD) flow.
Ijgi 08 00257 g003
Figure 4. The improved chord graph of OD flows.
Ijgi 08 00257 g004
Figure 5. The expression of space multiscale for OD data.
Ijgi 08 00257 g005
Figure 6. Curves of SP and SD representing temporal variations of PUPs and DOPs for the entire study area.
Ijgi 08 00257 g006
Figure 7. Temporal variance of the PUPs and DOPs activities.
Ijgi 08 00257 g007
Figure 8. Distribution of residents travel demand of Beijing based on TAZ scale.
Ijgi 08 00257 g008
Figure 9. Distribution of travel intensity in Beijing based on the TAZ scale.
Ijgi 08 00257 g009
Figure 10. Distribution of travel time in Beijing based on the TAZ scale.
Ijgi 08 00257 g010
Figure 11. Distribution of travel distance in Beijing based on the TAZ scale.
Ijgi 08 00257 g011
Figure 12. Multitime scale visualizations for taxi OD data in Beijing based on the chord diagram plot.
Ijgi 08 00257 g012
Figure 13. OD flows in various regions of Beijing based on the chord diagram plot.
Ijgi 08 00257 g013
Figure 14. Distribution of OD net flows in various regions of Beijing.
Ijgi 08 00257 g014
Figure 15. Division of space region in Beijing.
Ijgi 08 00257 g015
Figure 16. Spatial multiscale visualizations for taxi OD data in Beijing based on the chord diagram plot.
Ijgi 08 00257 g016
Figure 17. Multiscale expression of taxi OD data space in the rush hour (morning and evening).
Ijgi 08 00257 g017
Table 1. GPS data in Beijing city.
FCDTaxi IDTimeLongitudeLatitudeSpeedDirectionState
JL100007562120121225000014116.104839.9638112900
JL100007562120121225000044116.104039.9629992000
JYJ1333115646220121225150826116.291839.88956432681
JYJ1333115646220121225150937116.290139.88969452701

