Multi-Aspect Analysis of Object-Oriented Landslide Detection Based on an Extended Set of LiDAR-Derived Terrain Features


Abstract
:1. Introduction
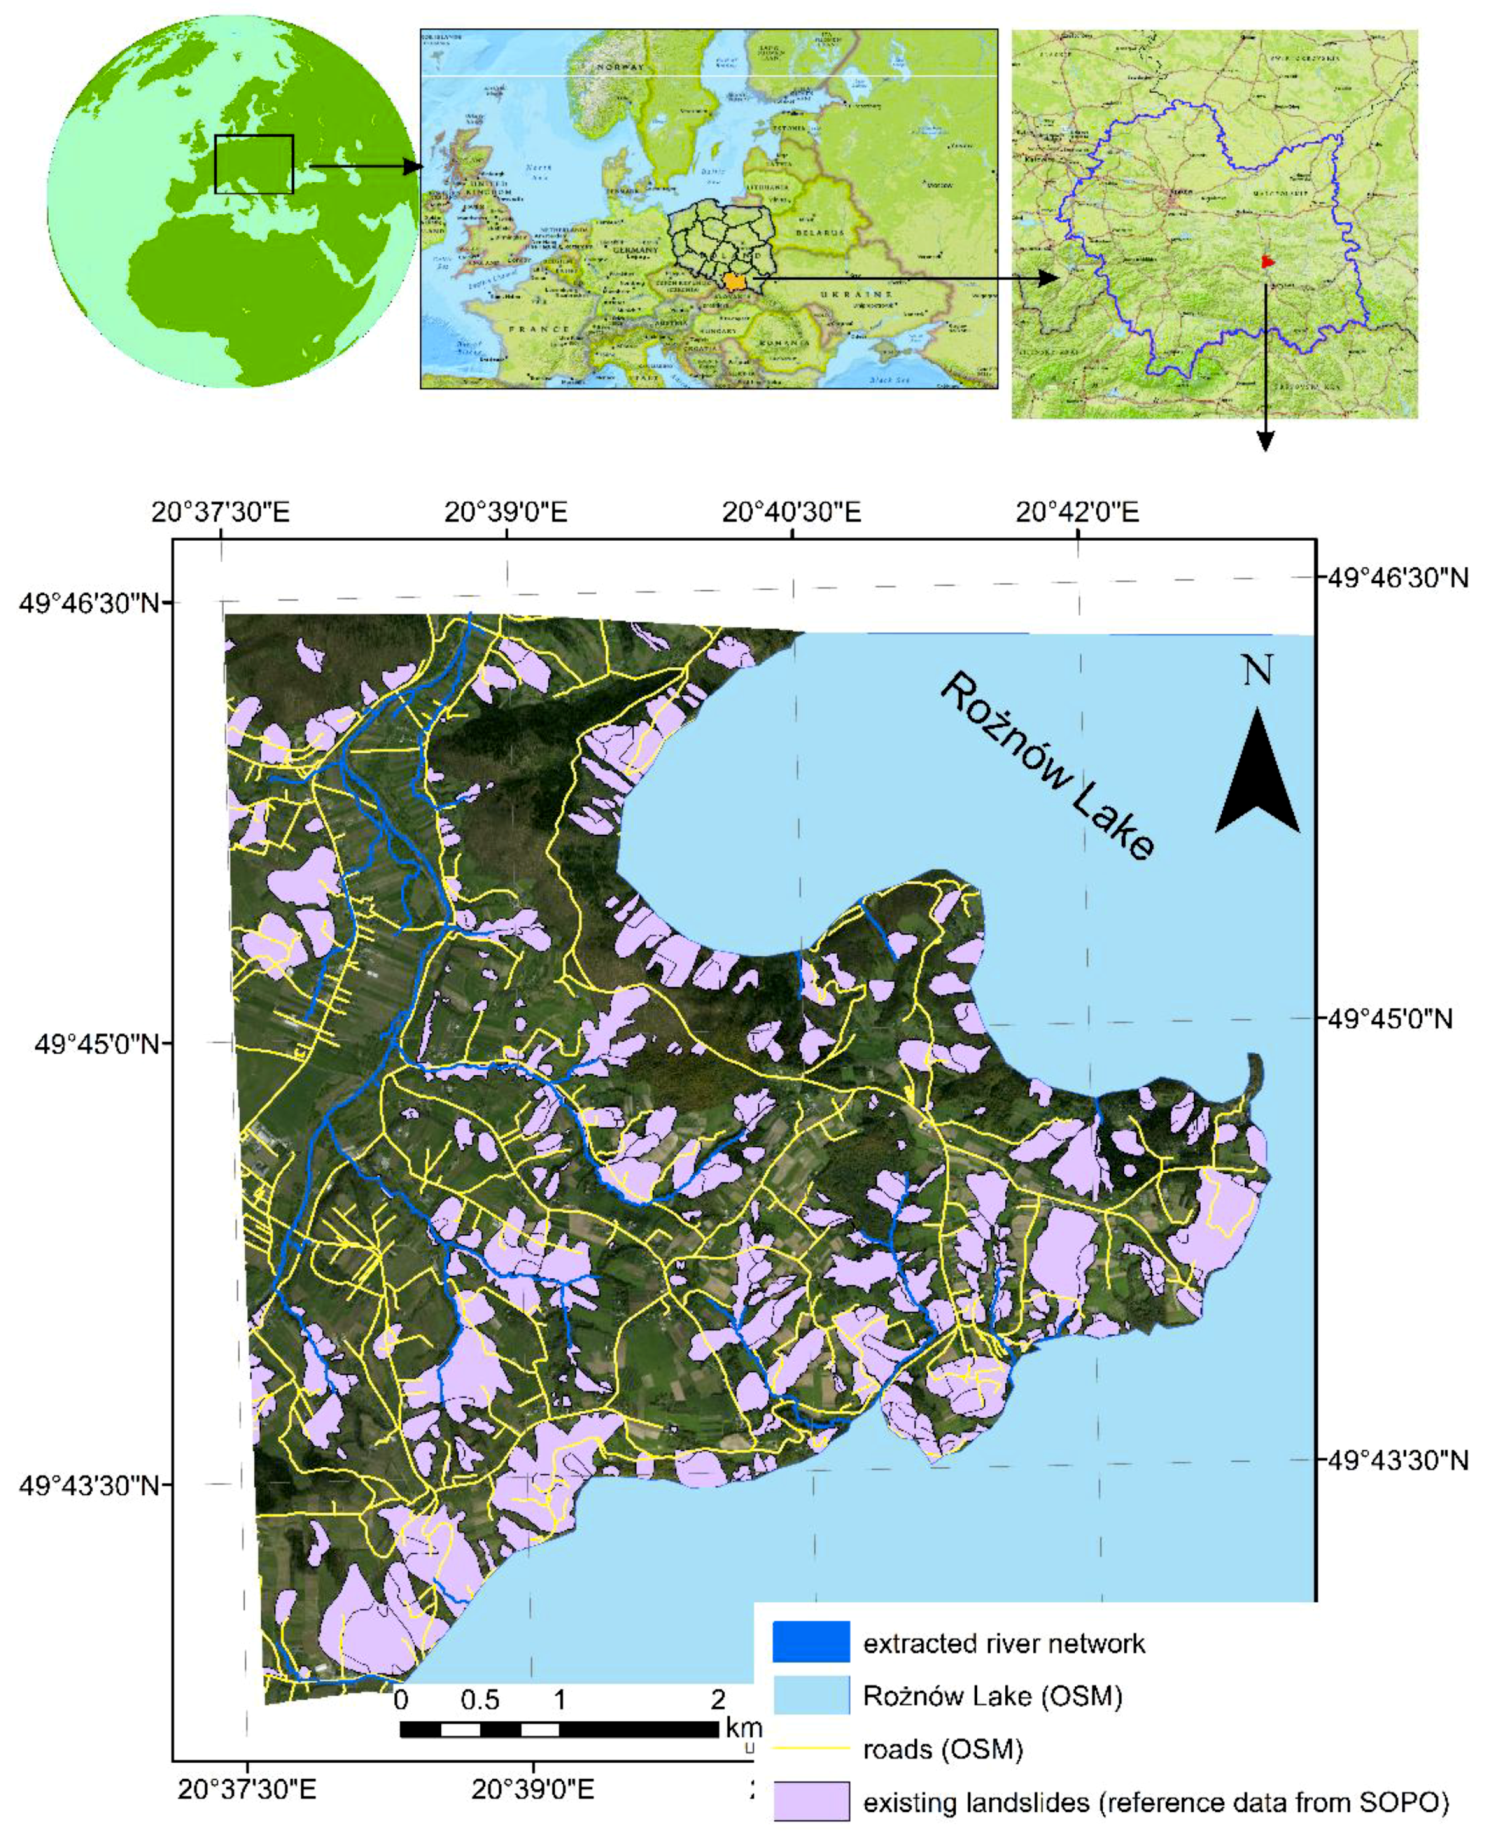
2. Study Area
3. Data
3.1. Landslide Inventory Map
3.2. LiDAR Data
3.3. Auxiliary Data
3.3.1. Road Network
3.3.2. Generation of Accurate River and Stream Networks
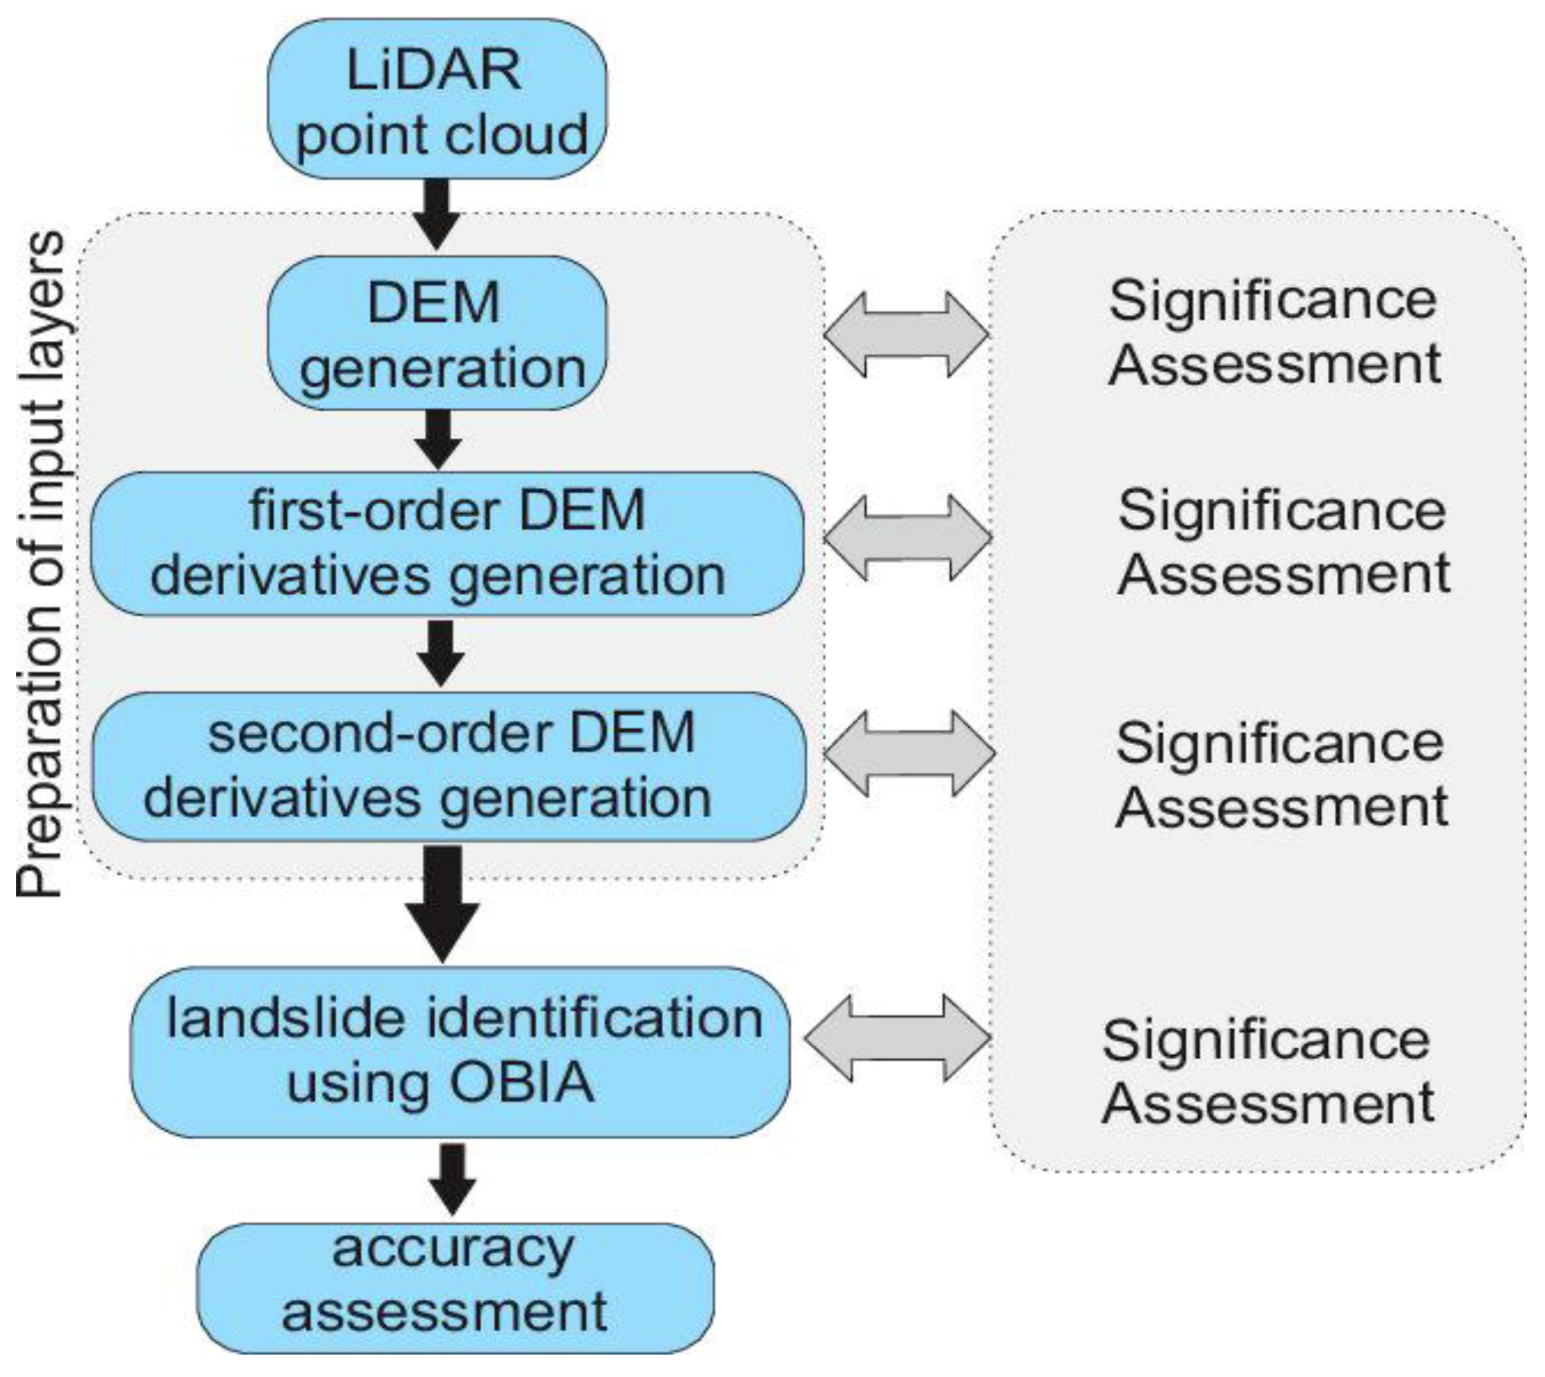
4. Methodology
4.1. Generation of First and Second-order DEM-derivatives
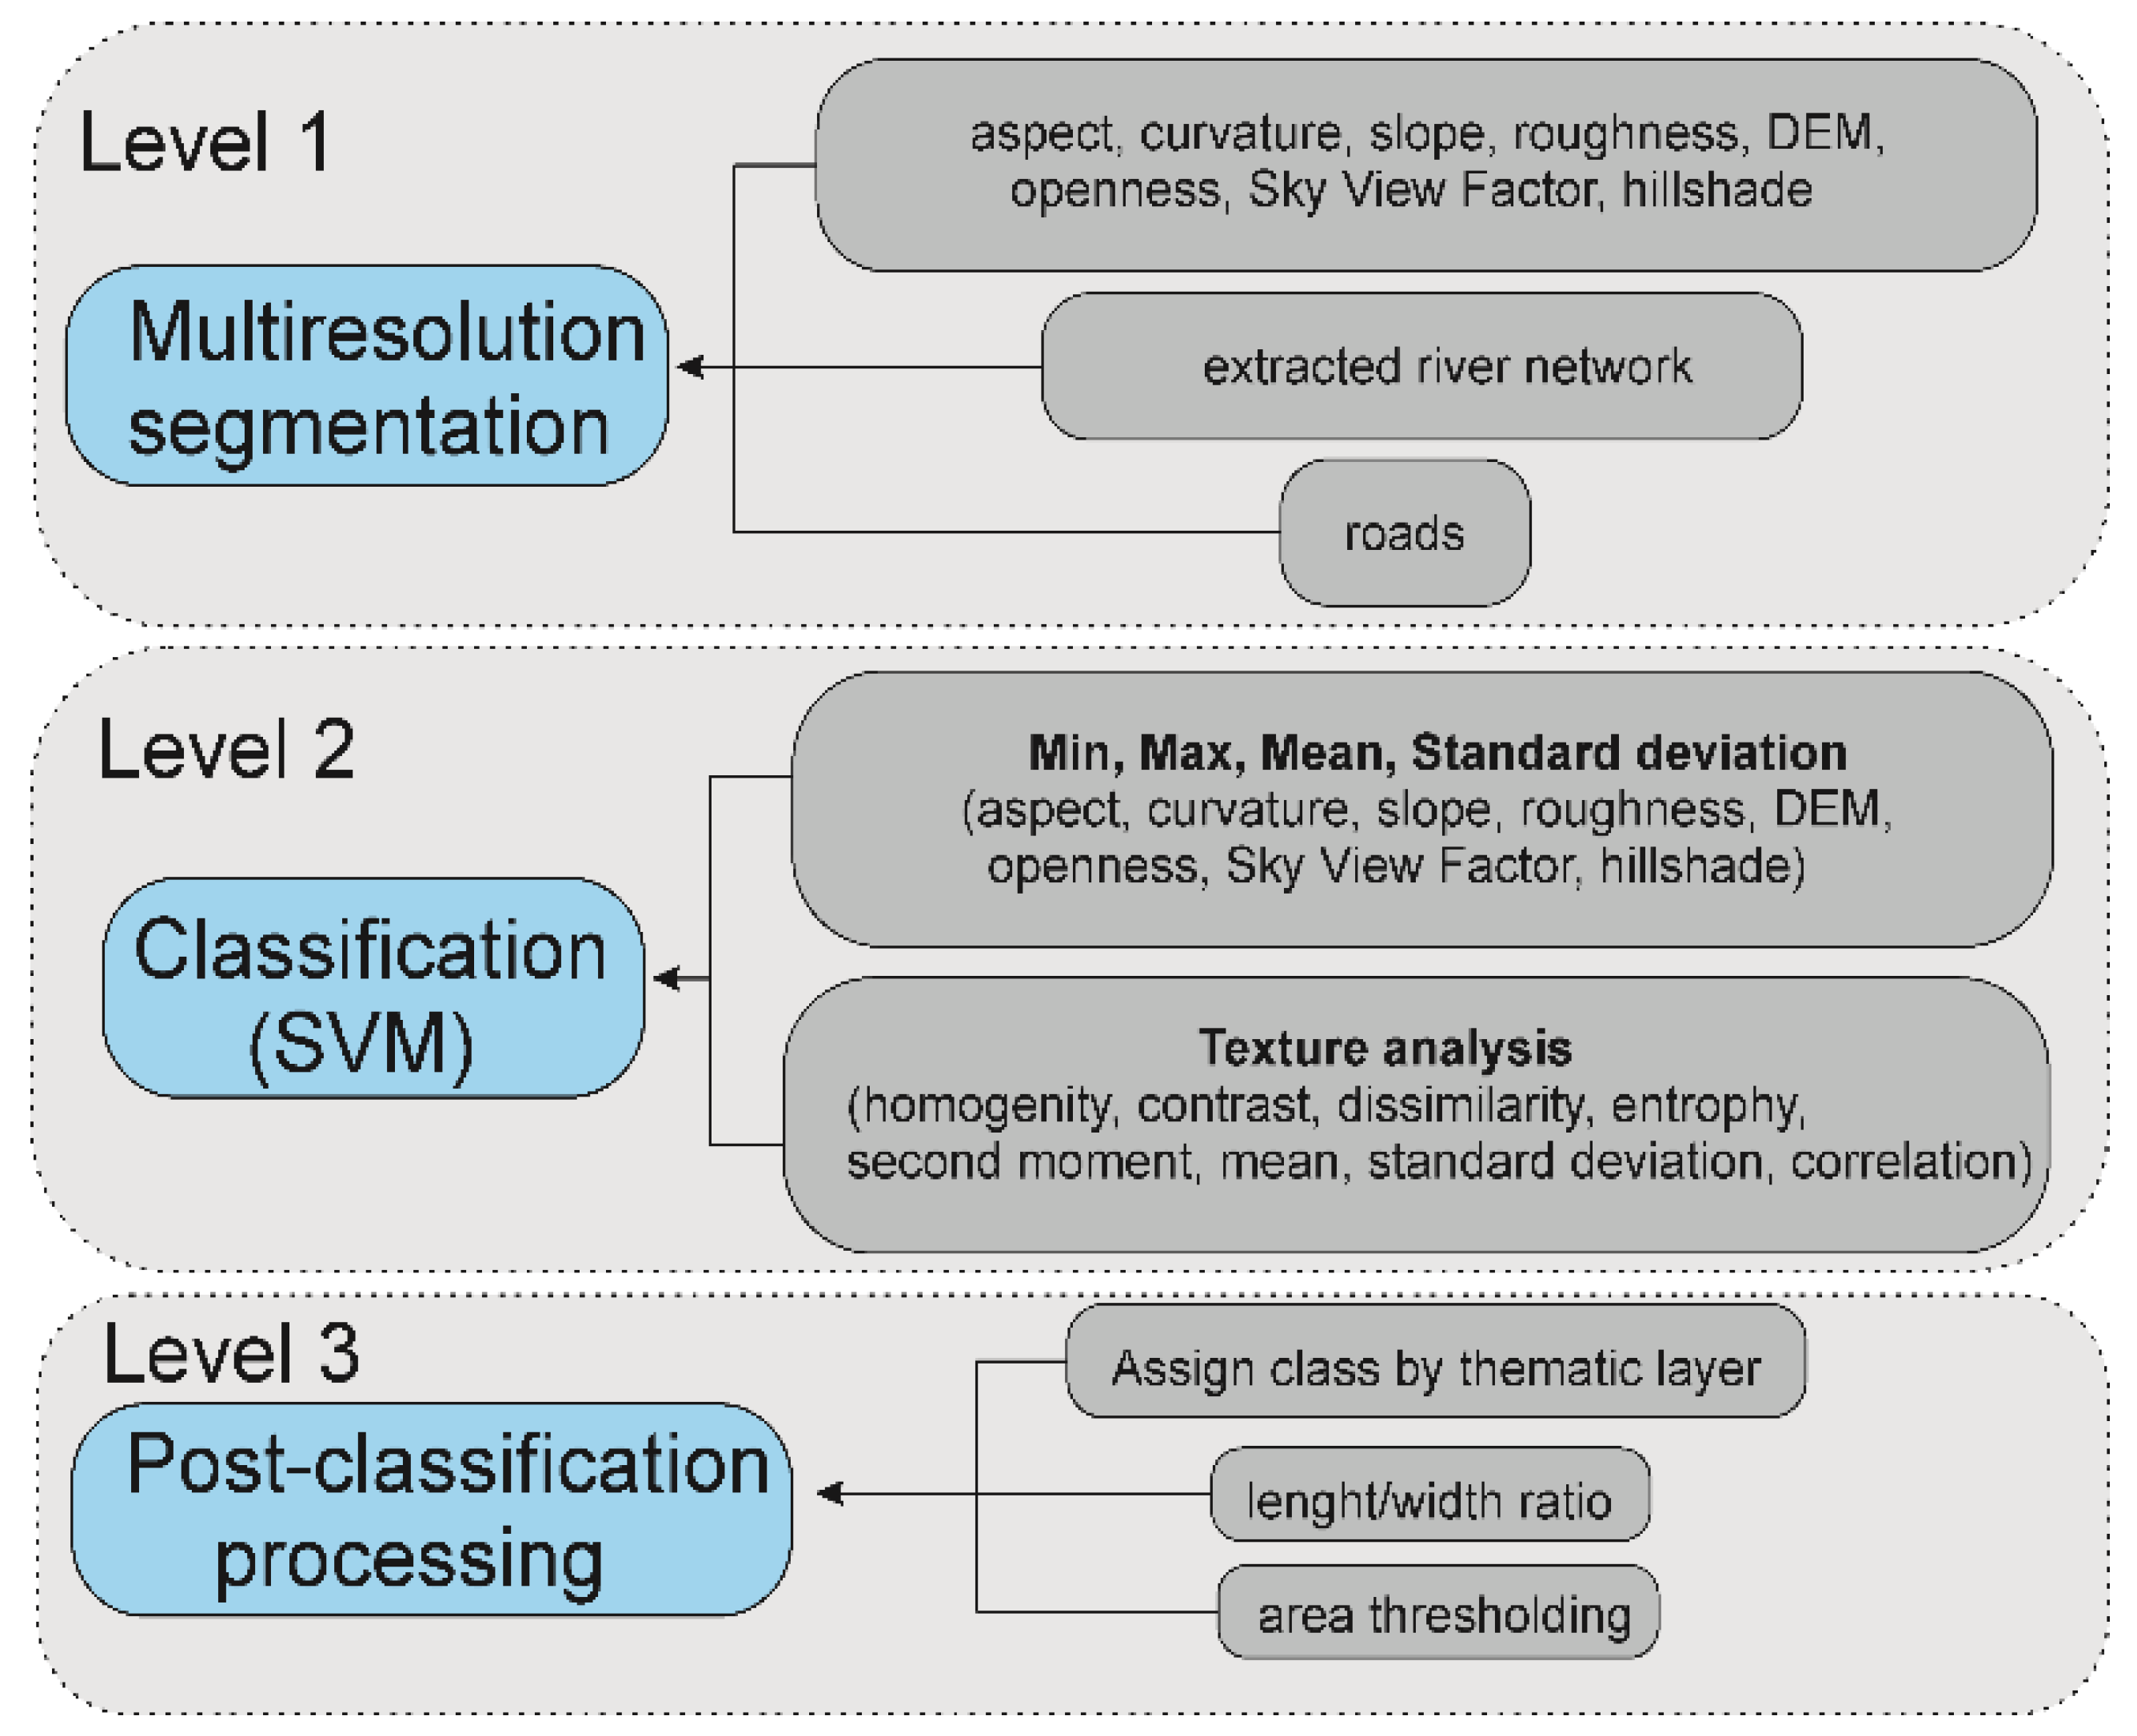
4.2. Classification Using OBIA
4.2.1. Segmentation
4.2.2. Training and Validation Dataset
4.2.3. SVM Classification
4.3. Various Strategies of OBIA Classification Used for Multi-Aspect Significance Assessment
4.4. Post-Classification Processing and Accuracy Assessment
5. Results
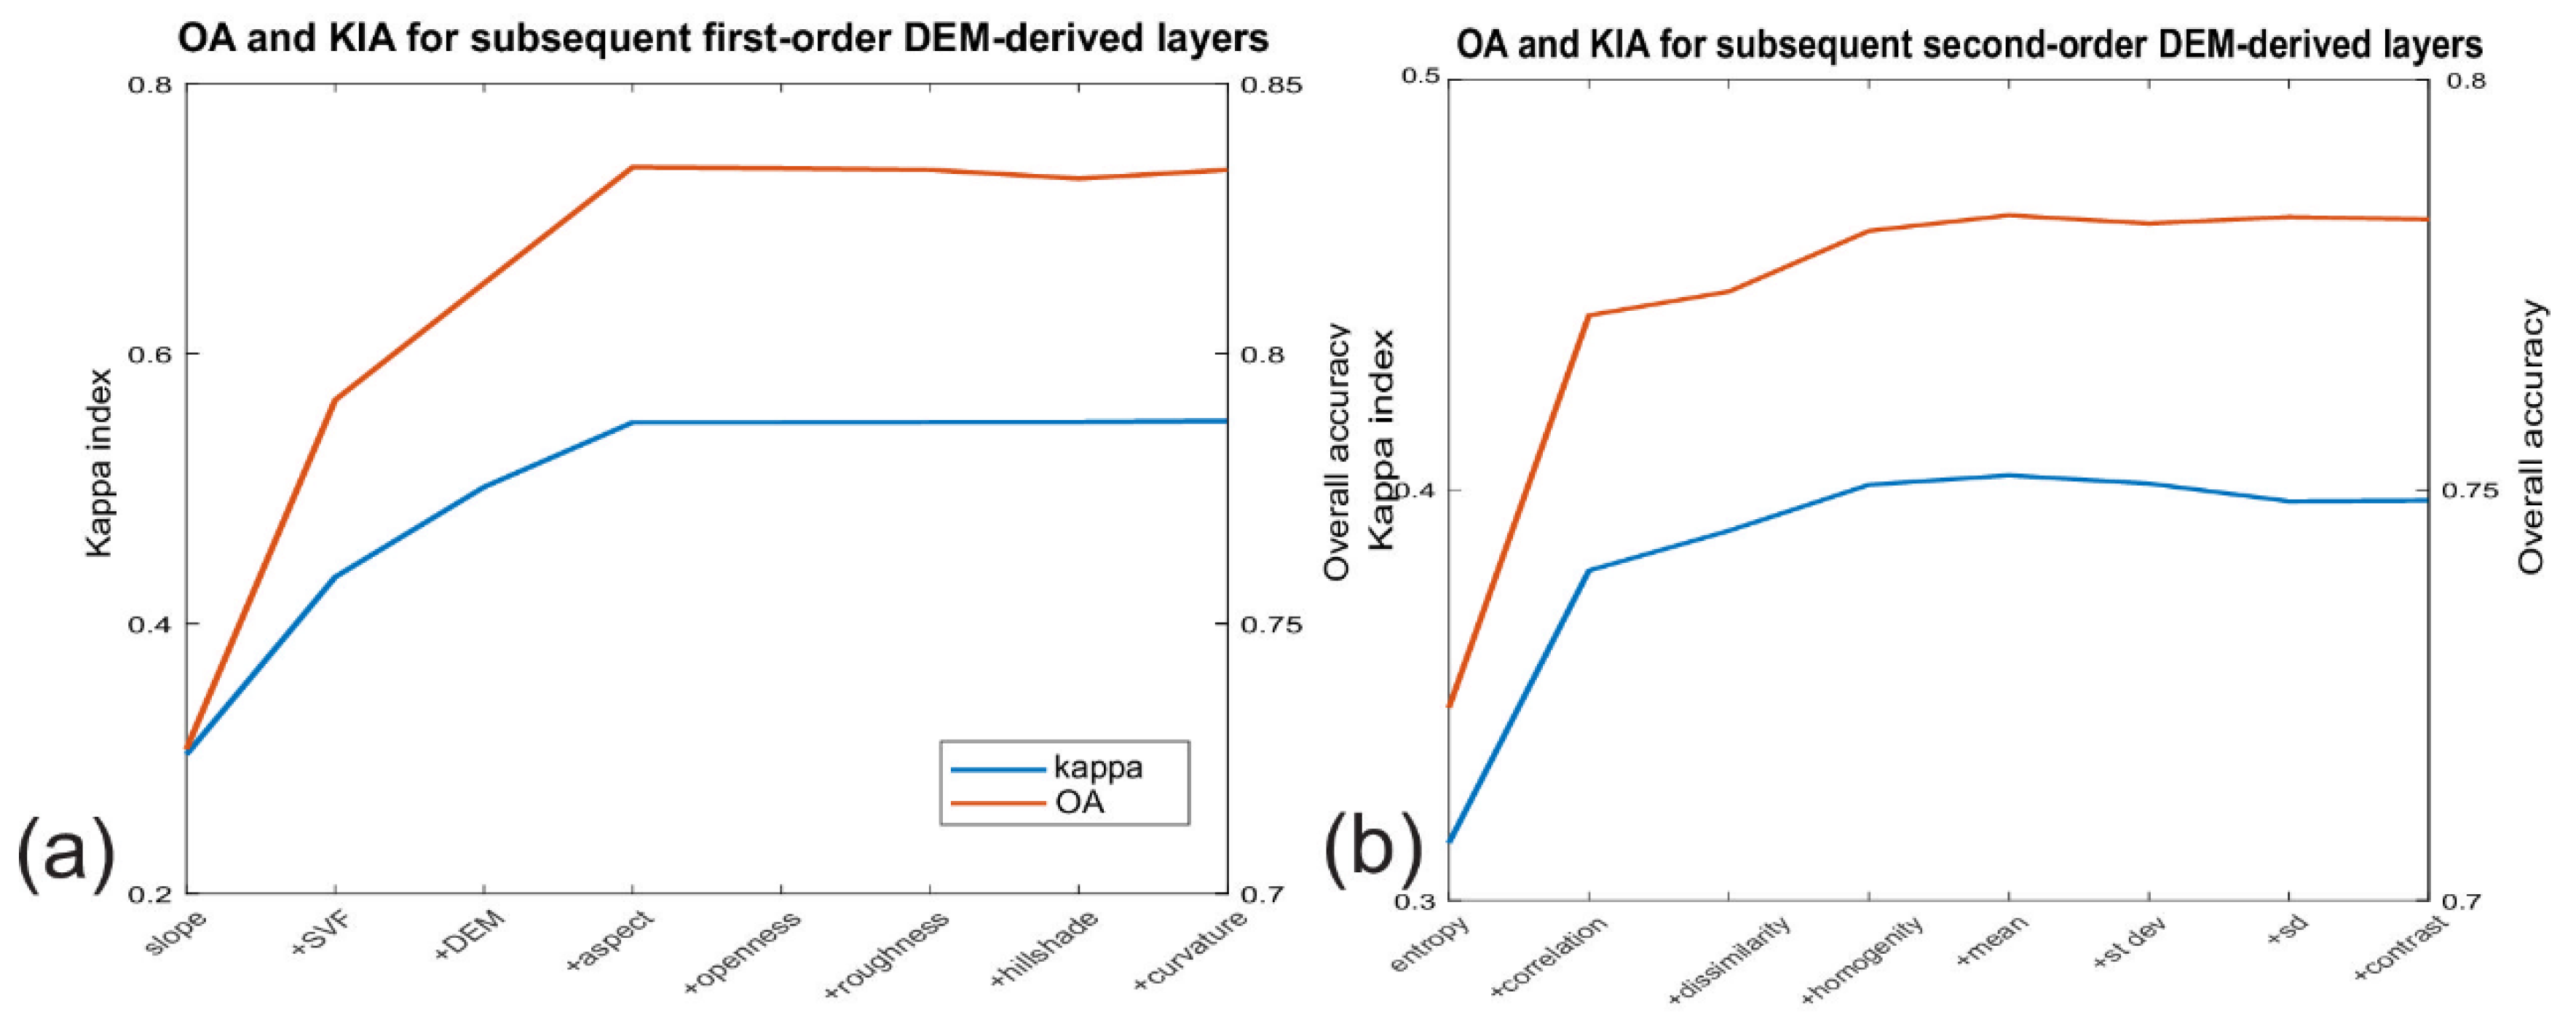
5.1. DEM Derivatives Significance Assessment
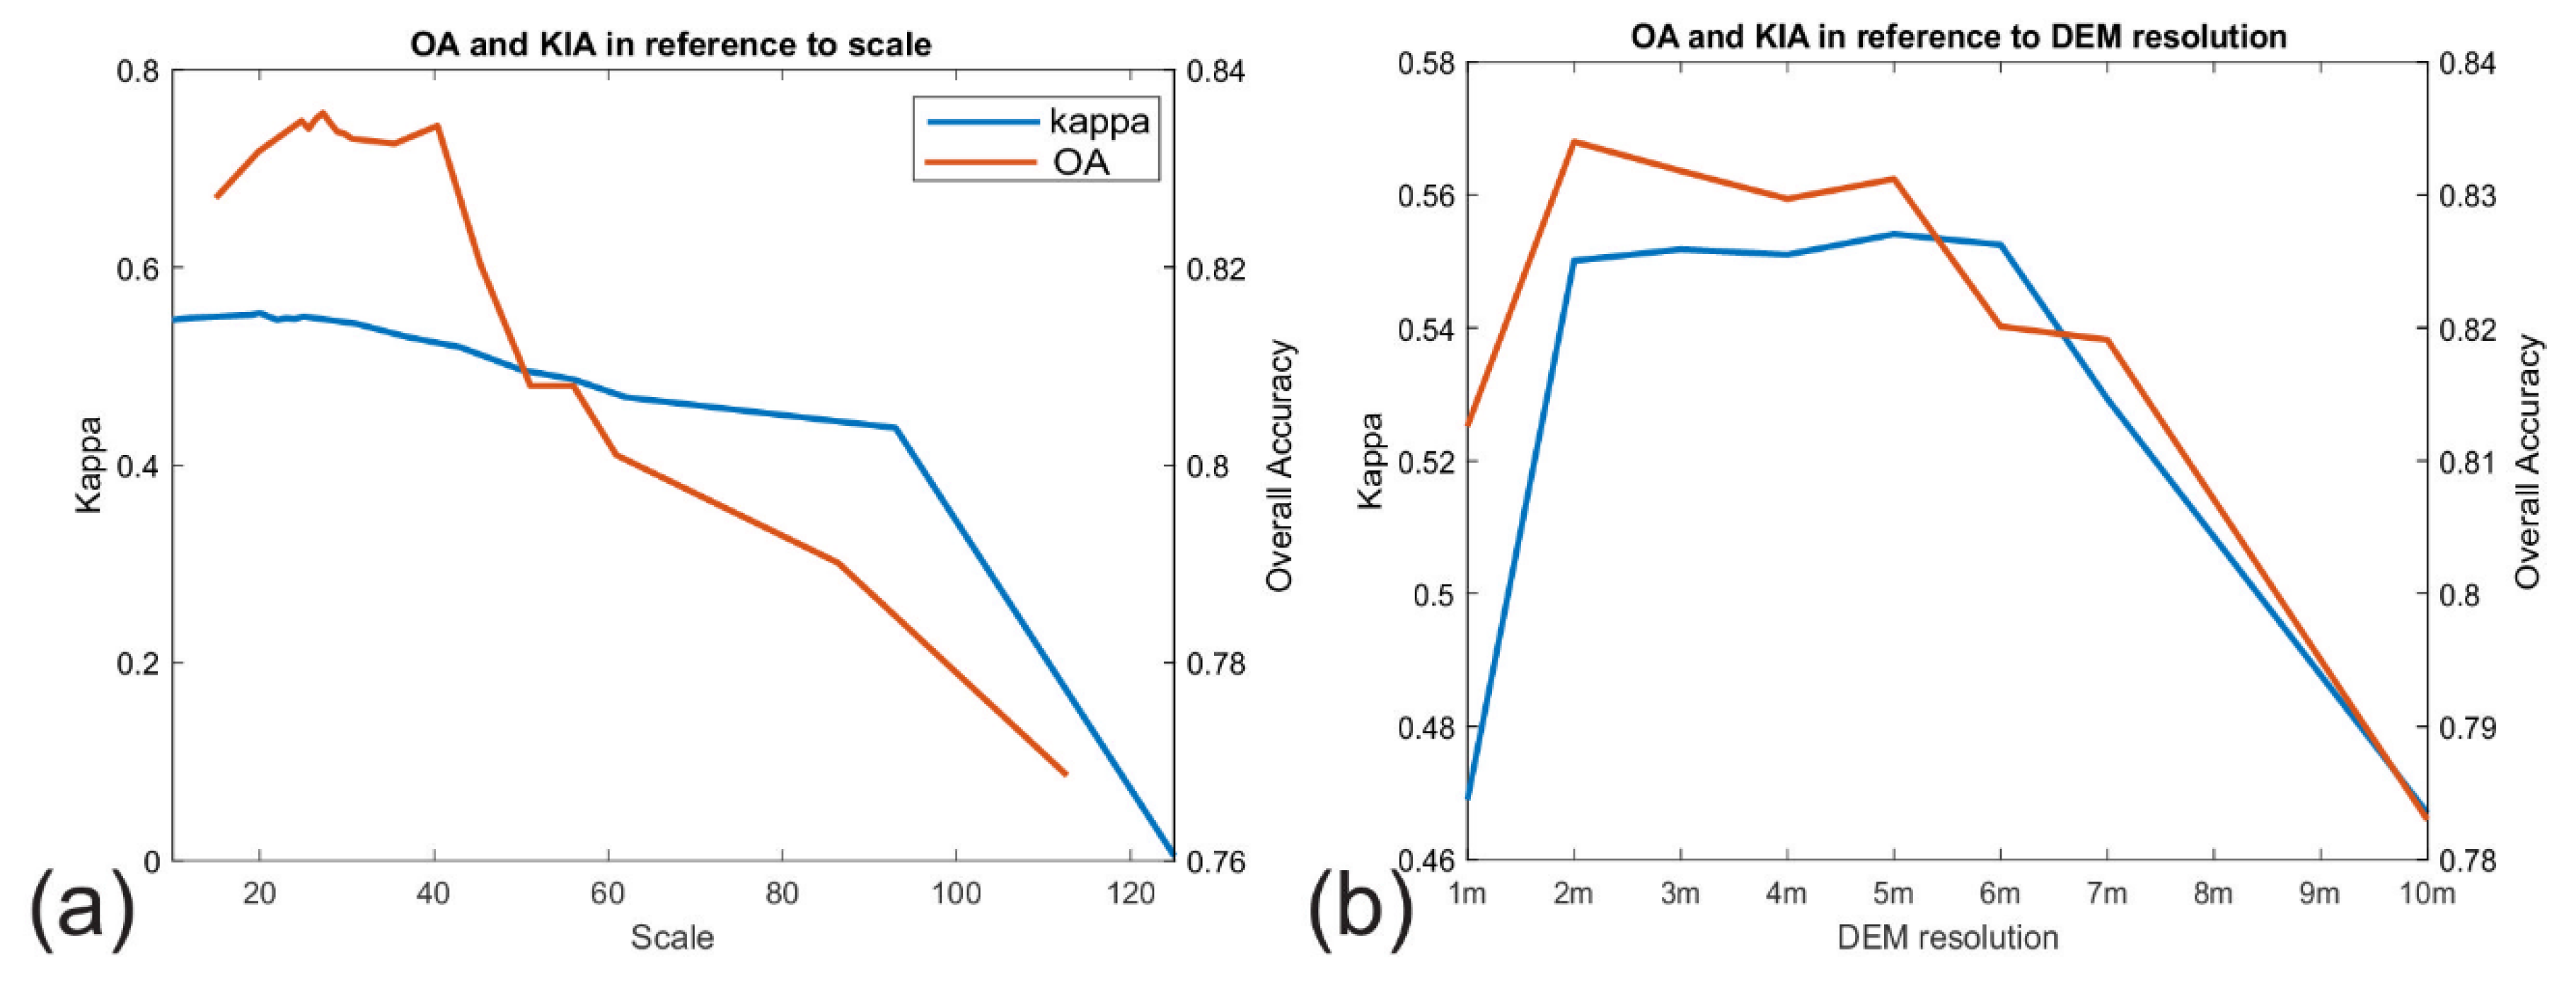
5.2. Scale Significance and DEM Resolution Assessment
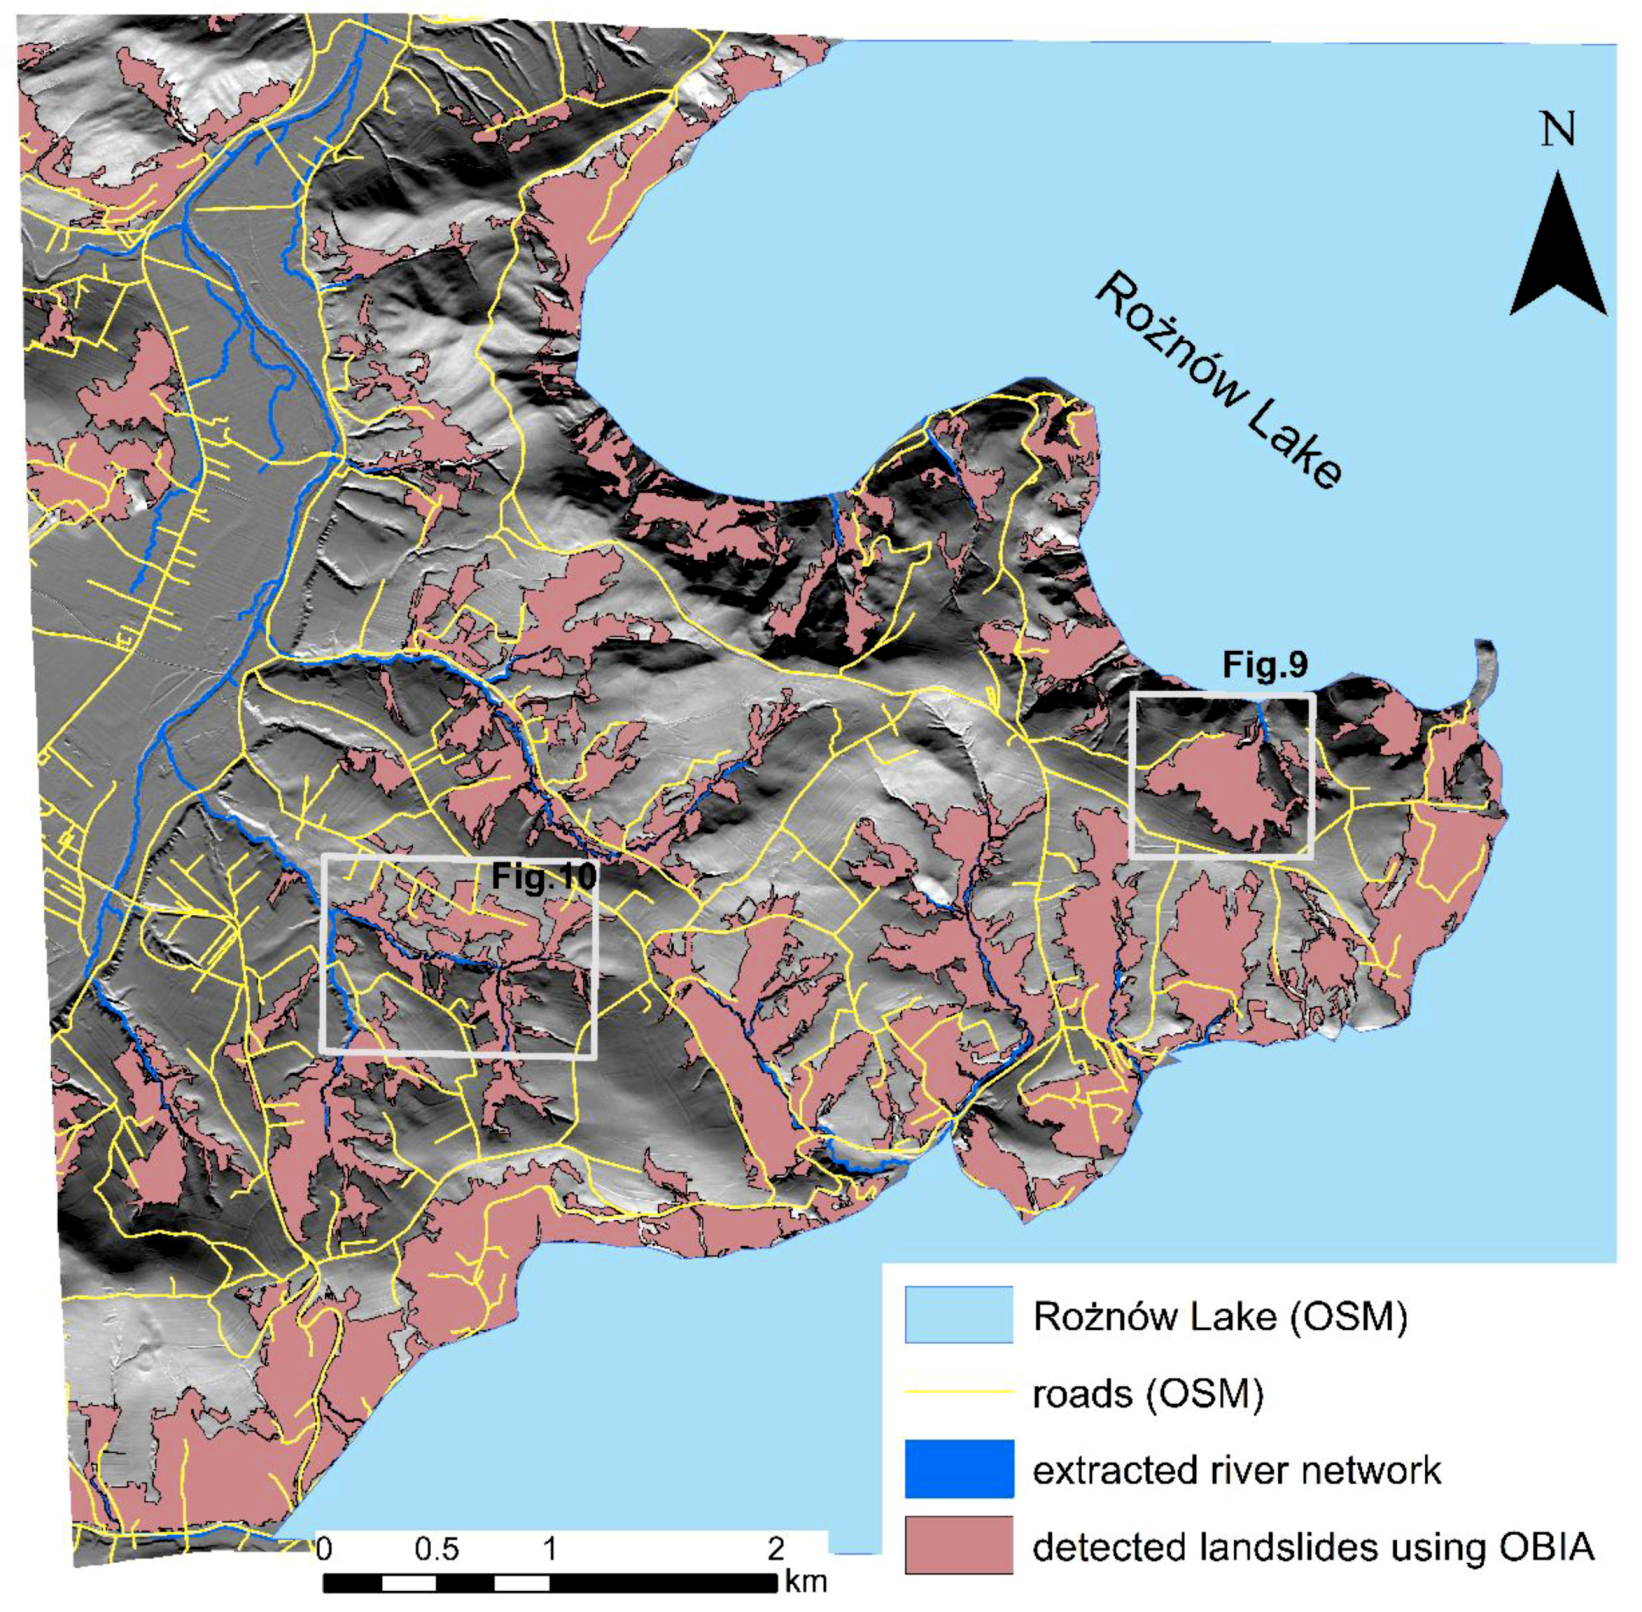
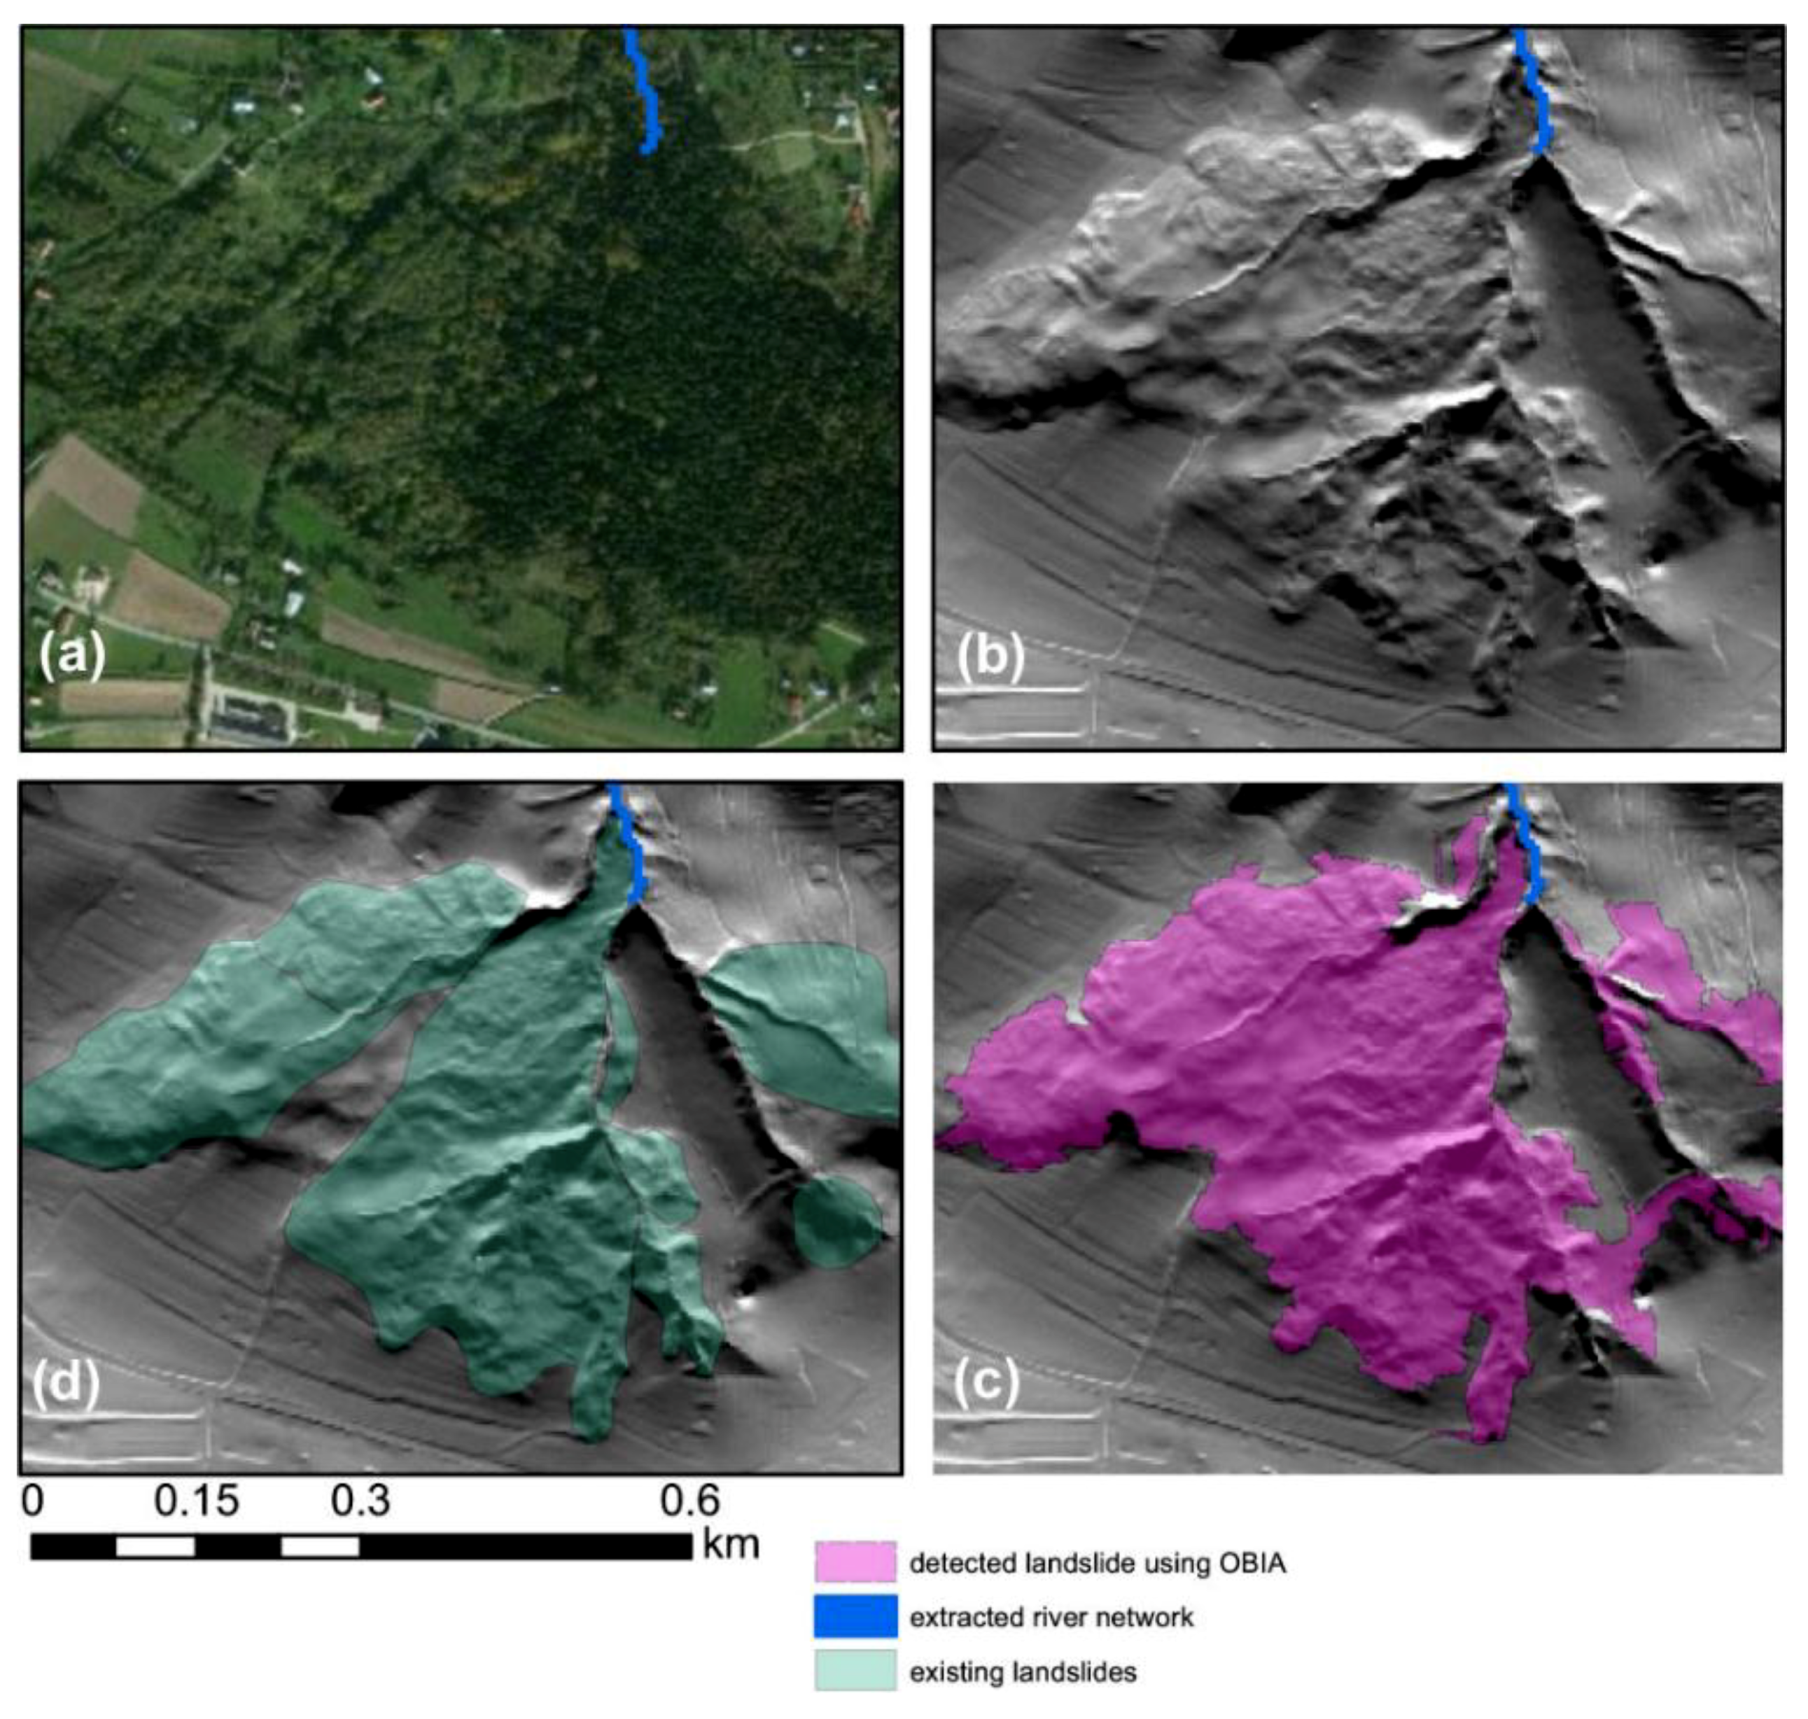
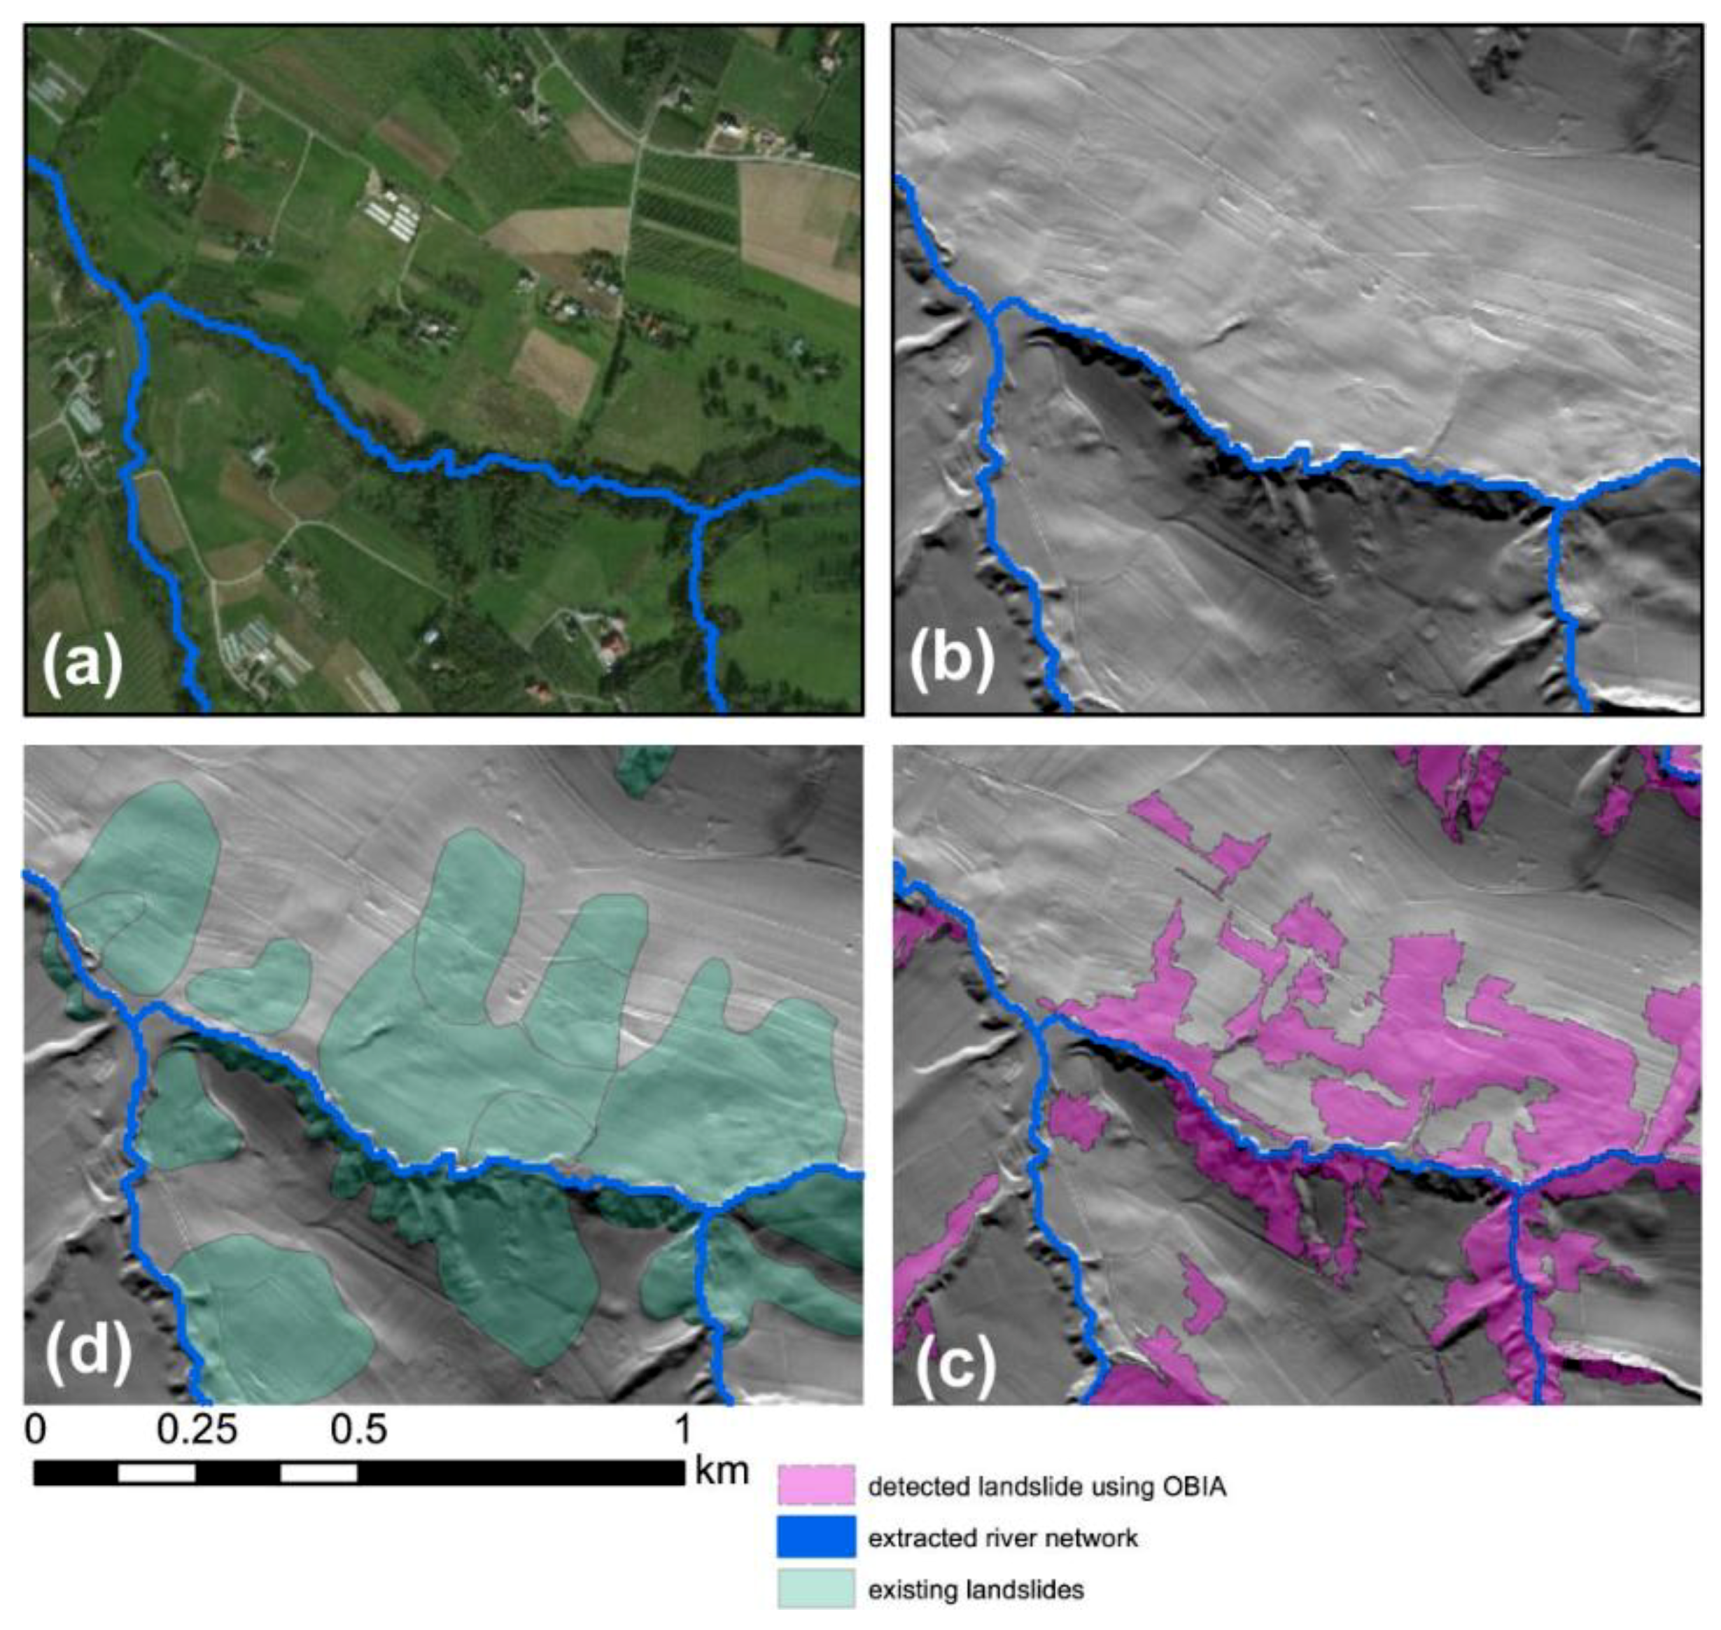
5.3. Post-Processing and Final OBIA-Derived Landslide Map Generation
6. Discussion
6.1. DEM Derivative Significance
6.2. Segmentation Scale and DEM Resolution
6.3. Capabilities and Limitations of Automatic Approaches
6.4. OBIA versus PBA
7. Conclusions
Author Contributions
Funding
Conflicts of Interest
References
- Cruden, D.M. A simple definition of a landslide. Bull. Eng. Geol. Environ. 1991, 43, 27–29. [Google Scholar]
- Leshchinsky, B.A.; Olsen, M.J.; Tanyu, B.F. Contour Connection Method for automated identification and classification of landslide deposits. Comput. Geosci. 2015, 74, 27–38. [Google Scholar] [CrossRef]
- Pawłuszek, K.; Borkowski, A. Impact of DEM-derived factors and analytical hierarchy process on landslide susceptibility mapping in the region of Rożnów Lake, Poland. Nat. Hazards 2017, 86, 919–952. [Google Scholar] [CrossRef]
- Highland, L.M.; Bobrovsky, P. The Landslide Handbook a Guide to Understanding Landslides; USA Geological Survey: Reston, VA, USA, 2008; pp. 34–39.
- Pawłuszek, K.; Borkowski, A.; Tarolli, P. Towards the optimal pixel size of DEM for automatic mapping of landslide areas. Int. Arch. Photogramm. Remote Sens. Spat. Inf. Sci. 2017, 42. [Google Scholar] [CrossRef]
- Ardizzone, F.; Cardinali, M.; Galli, M.; Guzzetti, F.; Reichenbach, P. Identification and mapping of recent rainfall-induced landslides using elevation data collected by airborne Lidar. Nat. Hazards Earth Syst. Sci. 2007, 7, 637–650. [Google Scholar] [Green Version]
- Guzzetti, F.; Mondini, A.C.; Cardinali, M.; Fiorucci, F.; Santangelo, M.; Chang, K.T. Landslide inventory maps: New tools for an old problem. Earth-Sci. Rev. 2012, 112, 42–66. [Google Scholar] [CrossRef] [Green Version]
- Borkowski, A.; Perski, Z.; Wojciechowski, T.; Jozkow, G.; Wojcik, A. Landslides mapping in Roznow Lake vicinity, Poland using airborne laser scanning data. Acta Geodyn. Geromater. 2011, 8, 325–333. [Google Scholar]
- Den, V.; Eeckhaut, M.; Kerle, N.; Poesen, J.; Hervás, J. Object-oriented identification of forested landslides with derivatives of single pulse LiDAR data. Geomorphology 2012, 173, 30–42. [Google Scholar] [CrossRef]
- Cheng, K.S.; Wei, C.; Chang, S.C. Locating landslides using multi-temporal satellite images. Adv. Space Res. 2004, 33, 296–301. [Google Scholar] [CrossRef]
- McKean, J.; Roering, J. Objective landslide detection and surface morphology mapping using high- resolution airborne laser altimetry. Geomorphology 2004, 57, 331–351. [Google Scholar] [CrossRef]
- Booth, A.M.; Roering, J.J.; Perron, J.T. Automated landslide mapping using spectral analysis and high-resolution topographic data: Puget Sound lowlands, Washington, and Portland Hills, Oregon. Geomorphology 2009, 109, 132–147. [Google Scholar] [CrossRef]
- Pawłuszek, K.; Borkowski, A.; Tarolli, P. Sensitivity analysis of automatic landslide mapping: Numerical experiments towards the best solution. Landslides 2018, 15, 1851–1865. [Google Scholar] [CrossRef]
- Tarolli, P. High-resolution topography for understanding Earth surface processes: Opportunities and challenges. Geomorphology 2014, 216, 295–312. [Google Scholar] [CrossRef]
- Wojciechowski, T.; Borkowski, A.; Perski, Z.; Wójcik, A. Dane lotniczego skaningu laserowego w badaniu osuwisk przykład osuwiska w Zbyszycach (Karpaty zewnętrzne). Przegląd Geologiczny 2012, 60, 1–8. (In Polish) [Google Scholar]
- Rosenfeld, A. Segmentation: Pixel-Based Methods. In Fundamentals in Computer Vision 225–238; Cambridge University Press: Cambridge, UK, 1983. [Google Scholar]
- Li, X.; Cheng, X.; Chen, W.; Chen, G.; Liu, S. Identification of forested landslides using LiDar data, object-based image analysis, and machine learning algorithms. Remote Sens. 2015, 7, 9705–9726. [Google Scholar] [CrossRef]
- Keyport, R.N.; Oommen, T.; Martha, T.R.; Sajinkumar, K.S.; Gierke, J.S. A comparative analysis of pixel-and object-based detection of landslides from very high-resolution images. Int. J. Appl. Earth Observ. Geoinf. 2018, 64, 1–11. [Google Scholar] [CrossRef]
- Blaschke, T. Object based image analysis for remote sensing. ISPRS J. Photogramme. Remote Sens. 2010, 65, 2–16. [Google Scholar] [CrossRef] [Green Version]
- Martha, T.R.; Kerle, N.; Westen, C.J.; Jetten, V.; Kumar, K.V. Segment optimization and data-driven thresholding for knowledge-based landslide detection by object-based image analysis. IEEE Trans. Geosci. Remote Sens. 2011, 49, 4928–4943. [Google Scholar]
- Seijmonsbergen, A.C.; Anders, N.S.; Bouten, W. Geomorphological Change Detection Using Object-Based Feature Extraction from Multi-Temporal Lidar Data. IEEE Geosci. Remote Sens. Lett. 2013, 10, 1587–1591. [Google Scholar]
- Kroh, P. Analysis of land use in landslide affected areas along the Łososina Dolna Commune, the Outer Carpathians, Poland. Geomat. Nat. Hazards Risk 2017, 8. [Google Scholar] [CrossRef]
- Gorczyca, E. Morphodynamics of the River Łososina Channel after an extreme flood (Western Carpathian Mountains). Geografija 2007, 43, 8–15. [Google Scholar]
- Perski, Z.; Wojciechowski, T.; Borkowski, A. Persistent scatterer SAR interferometry applications on landslides in Carpathians (Southern Poland). Acta Geodyn. Geomater. 2010, 7, 1–7. [Google Scholar]
- Gorczyca, E.; Wrońska-Wałach, D. Objaśnienia do Mapy osuwisk i terenów zagrożonych ruchami masowymi w skali 1:10000, gm. Łososina Dolna, pow.: Nowosądecki, woj: Małopolskie. Available online: http://mapa.osuwiska.pgi.gov.pl (accessed on 5 June 2018). (In Polish)
- Bąk, M.; Długosz, M.; Gorczyca, E.; Kasina, K.; Kozioł, T.; Wrońska-Wałach, D.; Wyderski, P. Mapa osuwisk i terenów zagrożonych ruchami masowymi w skali 1:10000, gm. Łososina Dolna, pow. nowosądecki, woj. Małopolskie. Available online: http://mapa.osuwiska.pgi.gov.pl (accessed on 5 June 2018). (In Polish)
- Varnes, D.J. Slope movement types and processes. In Landslides, Analysis and Control, Special Report 176: Transportation Research Board; Schuster, R.L., Krizek, R.J., Eds.; National Academy of Sciences: Washington, WA, USA, 1978; pp. 11–33. [Google Scholar]
- Hungr, O.; Leroueil, S.; Picarelli, L. The Varnes classification of landslides types, an update. Landslides 2014, 11, 167–194. [Google Scholar] [CrossRef]
- Pawłuszek, K.; Ziaja, M.; Borkowski, A. Accuracy assessment of the height component of the airborne laser scanning data collected in the ISOK system for the Widawa river valley. Acta Sci. Polonorum Geod. Descr. Terr. 2014, 13, 27–38. (In Polish) [Google Scholar]
- Pourghasemi, H.R.; Pradhan, B.; Gokceoglu, C.; Mohammadi, M.; Moradi, H.R. Application of weights-of-evidence and certainty factor models and their comparison in landslide susceptibility mapping at Haraz watershed, Iran. Arab. J. Geosci. 2013, 6, 2351–2365. [Google Scholar] [CrossRef]
- Pourghasemi, H.R.; Moradi, H.R.; Aghda, S.F.; Gokceoglu, C.; Pradhan, B. GIS-based landslide susceptibility mapping with probabilistic likelihood ratio and spatial multi-criteria evaluation models (North of Tehran, Iran). Arab. J. Geosci. 2014, 7, 1857–1878. [Google Scholar] [CrossRef]
- Mashari, S.; Solaimani, K.; Omidvar, E. Landslide susceptibility mapping using multiple regression and GIS tools in Tajan Basin, North of Iran. Environ. Nat. Resour. Res. 2012, 2, 43. [Google Scholar] [CrossRef]
- Penna, D.; Borga, M.; Aronica, G.T.; Brigandì, G.; Tarolli, P. Predictive power of a shallow landslide model in a high-resolution landscape: dissecting the effects of forest roads. Hydrol. Earth Syst. Sci. 2014, 18, 2127–2139. [Google Scholar] [CrossRef]
- Sofia, G.; Tarolli, P. Automatic characterization of road networks under forest cover: advances in the analysis of roads and geomorphic process interaction. Rend. Online Soci. Geol. Ital. 2016, 39, 23–26. [Google Scholar] [CrossRef]
- Tarolli, P.; Sofia, G. Human topographic signatures and derived geomorphic processes across landscapes. Geomorphology 2016, 255, 140–161. [Google Scholar] [CrossRef] [Green Version]
- Pawłuszek, K.; Borkowski, A. Automatic Landslides Mapping in the Principal Component Domain. In Advancing Culture of Living with Landslides; Mikoš, M., Vilímek, V., Yin, Y., Sassa, K., Eds.; WLF 2017; Springer: Cham, Switzerland, 2017. [Google Scholar]
- Chen, W.; Li, X.; Wang, Y.; Chen, G.; Liu, S. Forested landslide detection using LiDAR data and the random forest algorithm: A case study of the Three Gorges, China. Remote Sens. Environ. 2014, 152, 291–301. [Google Scholar]
- Meyer, D. Support Vector Machines; FH Technikum: Vienna, Austria, 2017. [Google Scholar]
- Moosavi, V.; Talebi, A.; Shirmohammadi, B. Producing a landslide inventory map using pixel-based and object-oriented approaches optimized by Taguchi method. Geomorphology 2014, 204, 646–656. [Google Scholar] [CrossRef]


| Training Dataset (km2) | Validation Dataset (km2) | Total Dataset (km2) | |
|---|---|---|---|
| Landslides | 2.01 | 4.71 | 6.72 |
| Non-landslides | 3.11 | 16.17 | 19.28 |
| Total | 5.12 | 20.88 | 26.00 |
| No Landslide Objects | Landslide Objects | |
|---|---|---|
| Producer Accuracy | 0.89 | 0.71 |
| User Accuracy | 0.91 | 0.67 |
| KIA | 0.58 | 0.61 |
© 2019 by the authors. Licensee MDPI, Basel, Switzerland. This article is an open access article distributed under the terms and conditions of the Creative Commons Attribution (CC BY) license (http://creativecommons.org/licenses/by/4.0/).
Share and Cite
Pawłuszek, K.; Marczak, S.; Borkowski, A.; Tarolli, P. Multi-Aspect Analysis of Object-Oriented Landslide Detection Based on an Extended Set of LiDAR-Derived Terrain Features. ISPRS Int. J. Geo-Inf. 2019, 8, 321. https://0-doi-org.brum.beds.ac.uk/10.3390/ijgi8080321
Pawłuszek K, Marczak S, Borkowski A, Tarolli P. Multi-Aspect Analysis of Object-Oriented Landslide Detection Based on an Extended Set of LiDAR-Derived Terrain Features. ISPRS International Journal of Geo-Information. 2019; 8(8):321. https://0-doi-org.brum.beds.ac.uk/10.3390/ijgi8080321
Chicago/Turabian StylePawłuszek, Kamila, Sylwia Marczak, Andrzej Borkowski, and Paolo Tarolli. 2019. "Multi-Aspect Analysis of Object-Oriented Landslide Detection Based on an Extended Set of LiDAR-Derived Terrain Features" ISPRS International Journal of Geo-Information 8, no. 8: 321. https://0-doi-org.brum.beds.ac.uk/10.3390/ijgi8080321