1. Introduction
The inclusion of satellite data into operational applications has often lagged behind its use in research applications [
1]. The first meteorological satellites were launched in the 1960s [
2], but it took a decade before data from satellites were routinely used operationally, and several more decades before satellite data were used in numerical weather prediction [
1]. Similarly, ocean satellite data have been readily available for decades (
Table 1), yet these data resources are still underutilized in many branches of operational oceanography [
3,
4]. However, satellite data can be a source of important environmental observations for operational oceanographic applications, given the global coverage and the decades-long timeseries of many satellite measurements [
5]. Additionally, satellites are expensive national investments, and the data from them should be utilized to their maximum benefit. In the National Marine Fisheries Service (NMFS) of the National Oceanographic and Atmospheric Administration (NOAA), operational management activities that could benefit from satellite data include habitat classification, conservation efforts, and stock assessment (the process of determining the abundance of a fishery stock in response to fishing pressure). The scientists and managers responsible for these activities are typically not experts in acquiring and processing satellite data, which can lead to obstacles in them integrating satellite products in their work [
3].
Incorporating ocean satellite products into operational use requires a minimum of three steps: data discovery, access, and utilization. There can be barriers associated with each step. Data discovery is the process of finding the available datasets and determining their appropriate use. This process typically involves a web search to find products and product documentation. Understanding the documentation and determining if a product is useful for an application might involve locating additional web resources and talking with satellite data subject matter experts. This step can be the most time consuming, considering the array of satellite products that are available. For example, the Group for High Resolution Sea Surface Temperature (GHRSST) catalog lists over 80 disparate sea surface temperature datasets [
6]. After locating desirable products, a user must access the data. Satellite products can be downloaded from a multitude of data providers, including NOAA, National Aeronautics and Space Agency (NASA), Jet Propulsion Laboratory (JPL), European Space Agency (ESA), and European Organisation for the Exploitation of Meteorological Satellites (EUMETSAT). These organizations may or may not require a registration step. Furthermore, the data access may be by direct download of data files via FTP (File Transfer Protocol) and HTTP (HyperText Transfer Protocol), or through online data servers (e.g., the Thematic Real-time Environmental Distributed Data Services (THREDDS), and the Open-source Project for a Network Data Access Protocol (OPeNDAP) [
7]), each with its own protocols to search, subset, and download data. Utilizing the data might require a different set of software packages, scripts, and libraries to extract the data in a usable form, since the data files can be in a variety of file formats, including Hierarchical Data Format (HDF), Network Common Data Form (netCDF), and older binary and text formats.
NOAA’s CoastWatch Program (
https://coastwatch.noaa.gov) is designed to address the issues outlined above [
8]. Its mission is to provide easier access to global and regional satellite products. The program is structured with a central office that makes and distributes satellite products, and six regional nodes that develop products and provide services tailored to the needs of their local users. The regional nodes act as value added providers by offering tiered levels of assistance to users including developing tools and tutorials, providing training and hands-on assistance, locating or creating products in response to users’ needs and working directly with users on projects. The West Coast Node (WCN,
https://coastwatch.pfeg.noaa.gov) is housed at NOAA’s Southwest Fisheries Science Center (SWFSC) and caters primarily to the needs of NMFS scientists. The WCN works closely with the data group at the SWFSC Environmental Research Division (ERD), which hosts the WCN/ERD ERDDAP server.
The WCN developed the NOAA Ocean Satellite Course [
9] to increase the awareness and utilization of satellite data by fisheries scientists and ocean resource managers. The course has been offered and refined annually for over a decade. In this paper, we describe the course content and structure, present results of post-course surveys designed to measure course effectiveness, and review the course impacts on operational oceanography. We also describe efforts to extend the reach of the course, both nationally and internationally, and discuss lessons learned.
2. NOAA Ocean Satellite Course
The NOAA Ocean Satellite Course was initially offered in 2006 by the WCN of the NOAA CoastWatch program. Since that time, the course has been held annually, primarily on the West Coast of the United States. The goal of the course is to provide participants with the knowledge and tools they require to incorporate off-the-shelf satellite data products into their operational activities, without delving too much into the details of how the products are made. This distinction differentiates the NOAA Ocean Satellite Course from other well-established satellite remote sensing courses that cover such topics as ocean optics, atmospheric corrections, ocean color algorithms, and image analysis (e.g.,
http://www.geo.cornell.edu/ocean/satellite/). In addition, the NOAA Ocean Satellite Course has never had dedicated staff in the way that the NASA Applied Remote Sensing Training (ARSET) program [
10] or the COMET program do [
11], which are described in this special issue. EUMETSAT, Europe’s operational satellite agency, has offered courses with a scope and target audience similar to those of the NOAA course since 2017 [
12]. However, to our knowledge these types of training courses are not well documented in the literature. With this paper we hope to contribute to building a body of knowledge about effective training activities that target potential operational users of ocean satellite data, while placing only moderate demands on limited human and financial resources.
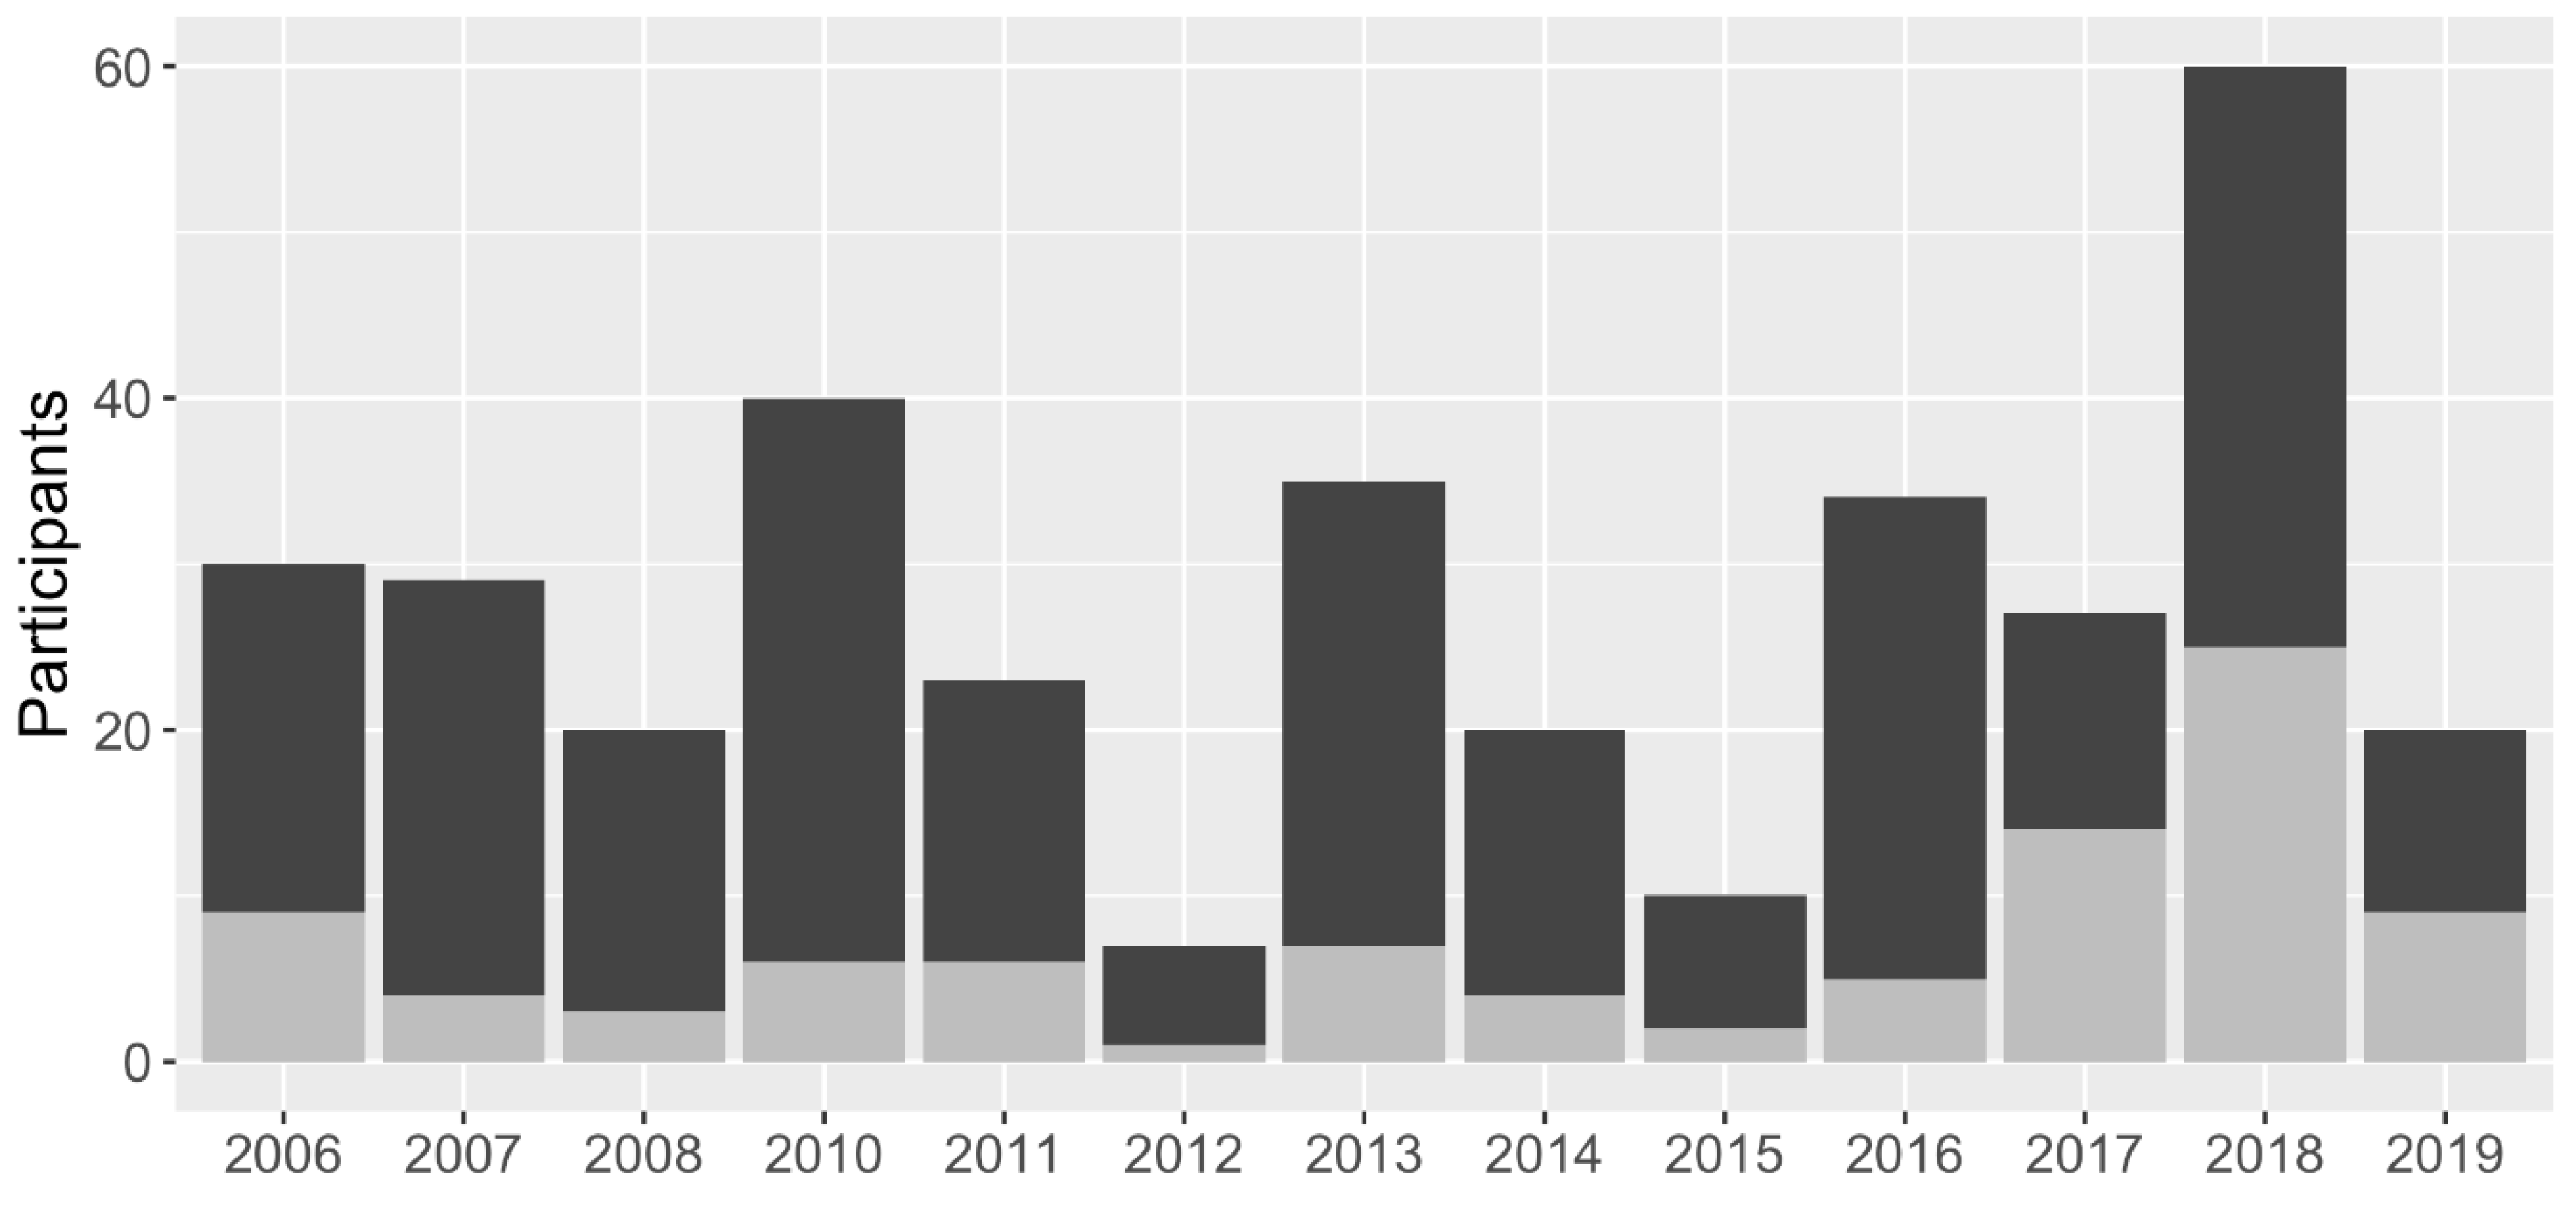
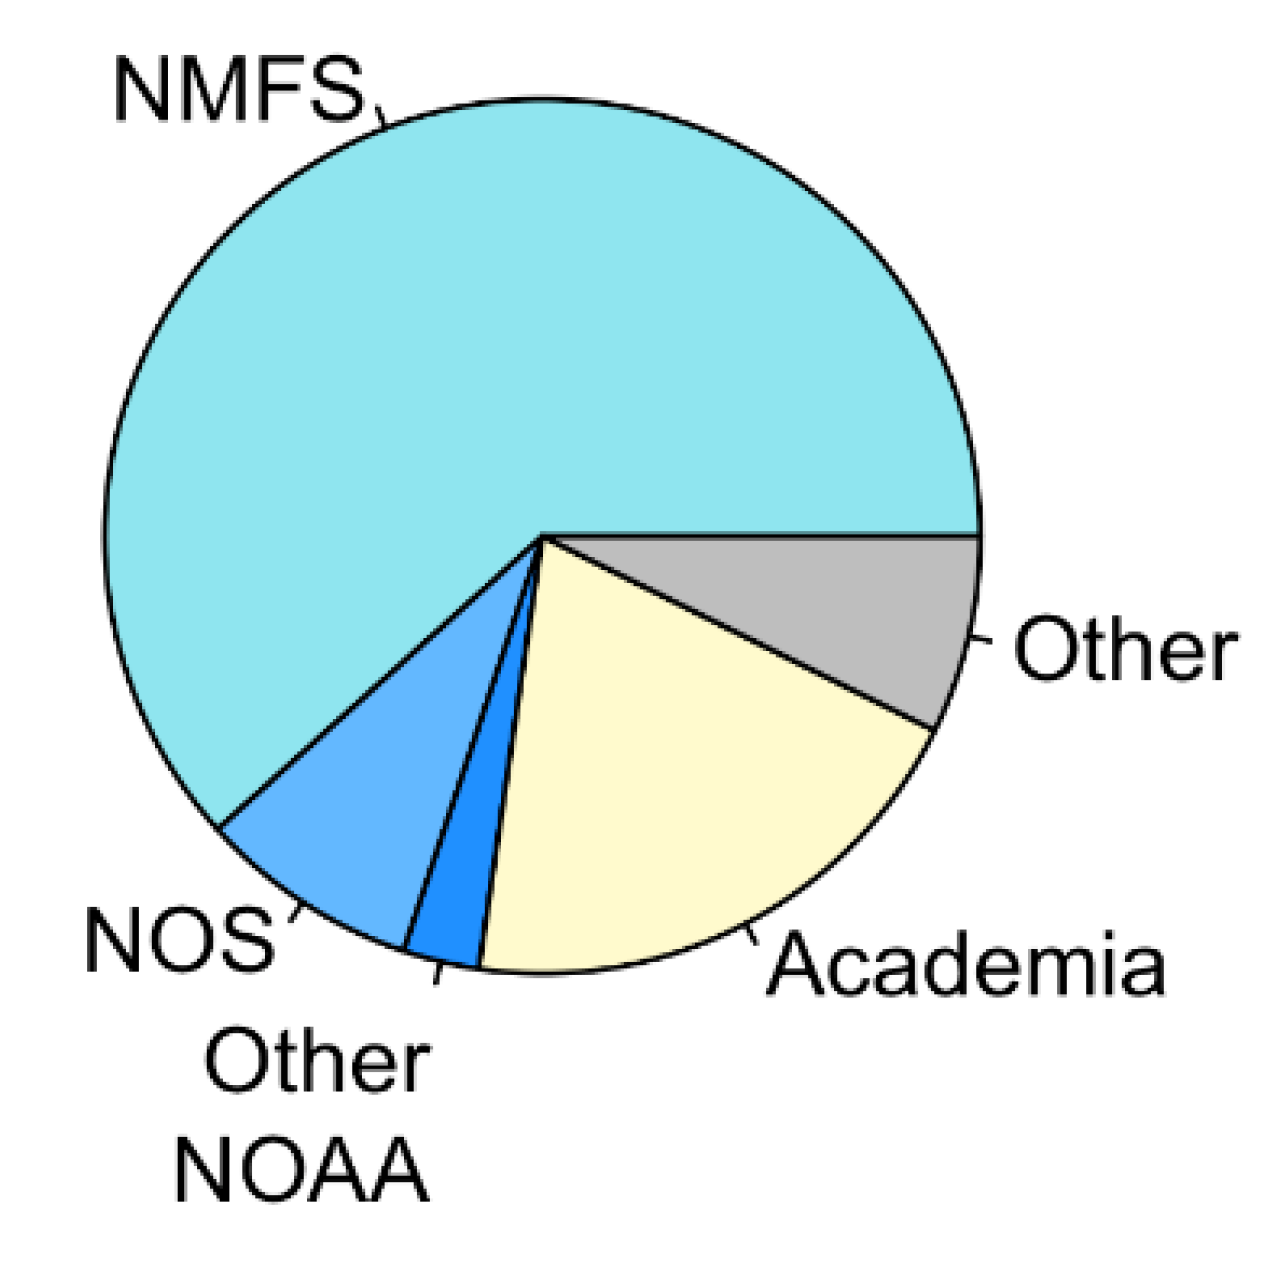
The primary target audiences for the NOAA course are scientists and managers within the NOAA line offices of NMFS and the National Ocean Service (NOS) who are involved in operational activities but are not currently using satellite data in their work. Course attendance has generally been between 20 to 30 participants per year, and of the over 350 total participants (
Figure 1), approximately 75% have been NOAA employees and affiliates (
Figure 2). The course is offered at no cost to participants, thereby reducing financial barriers and drawing participants who might be uncertain about whether a tuition fee is a justifiable cost. Although the course is conducted by the regional WCN, it is open to participants across the country.
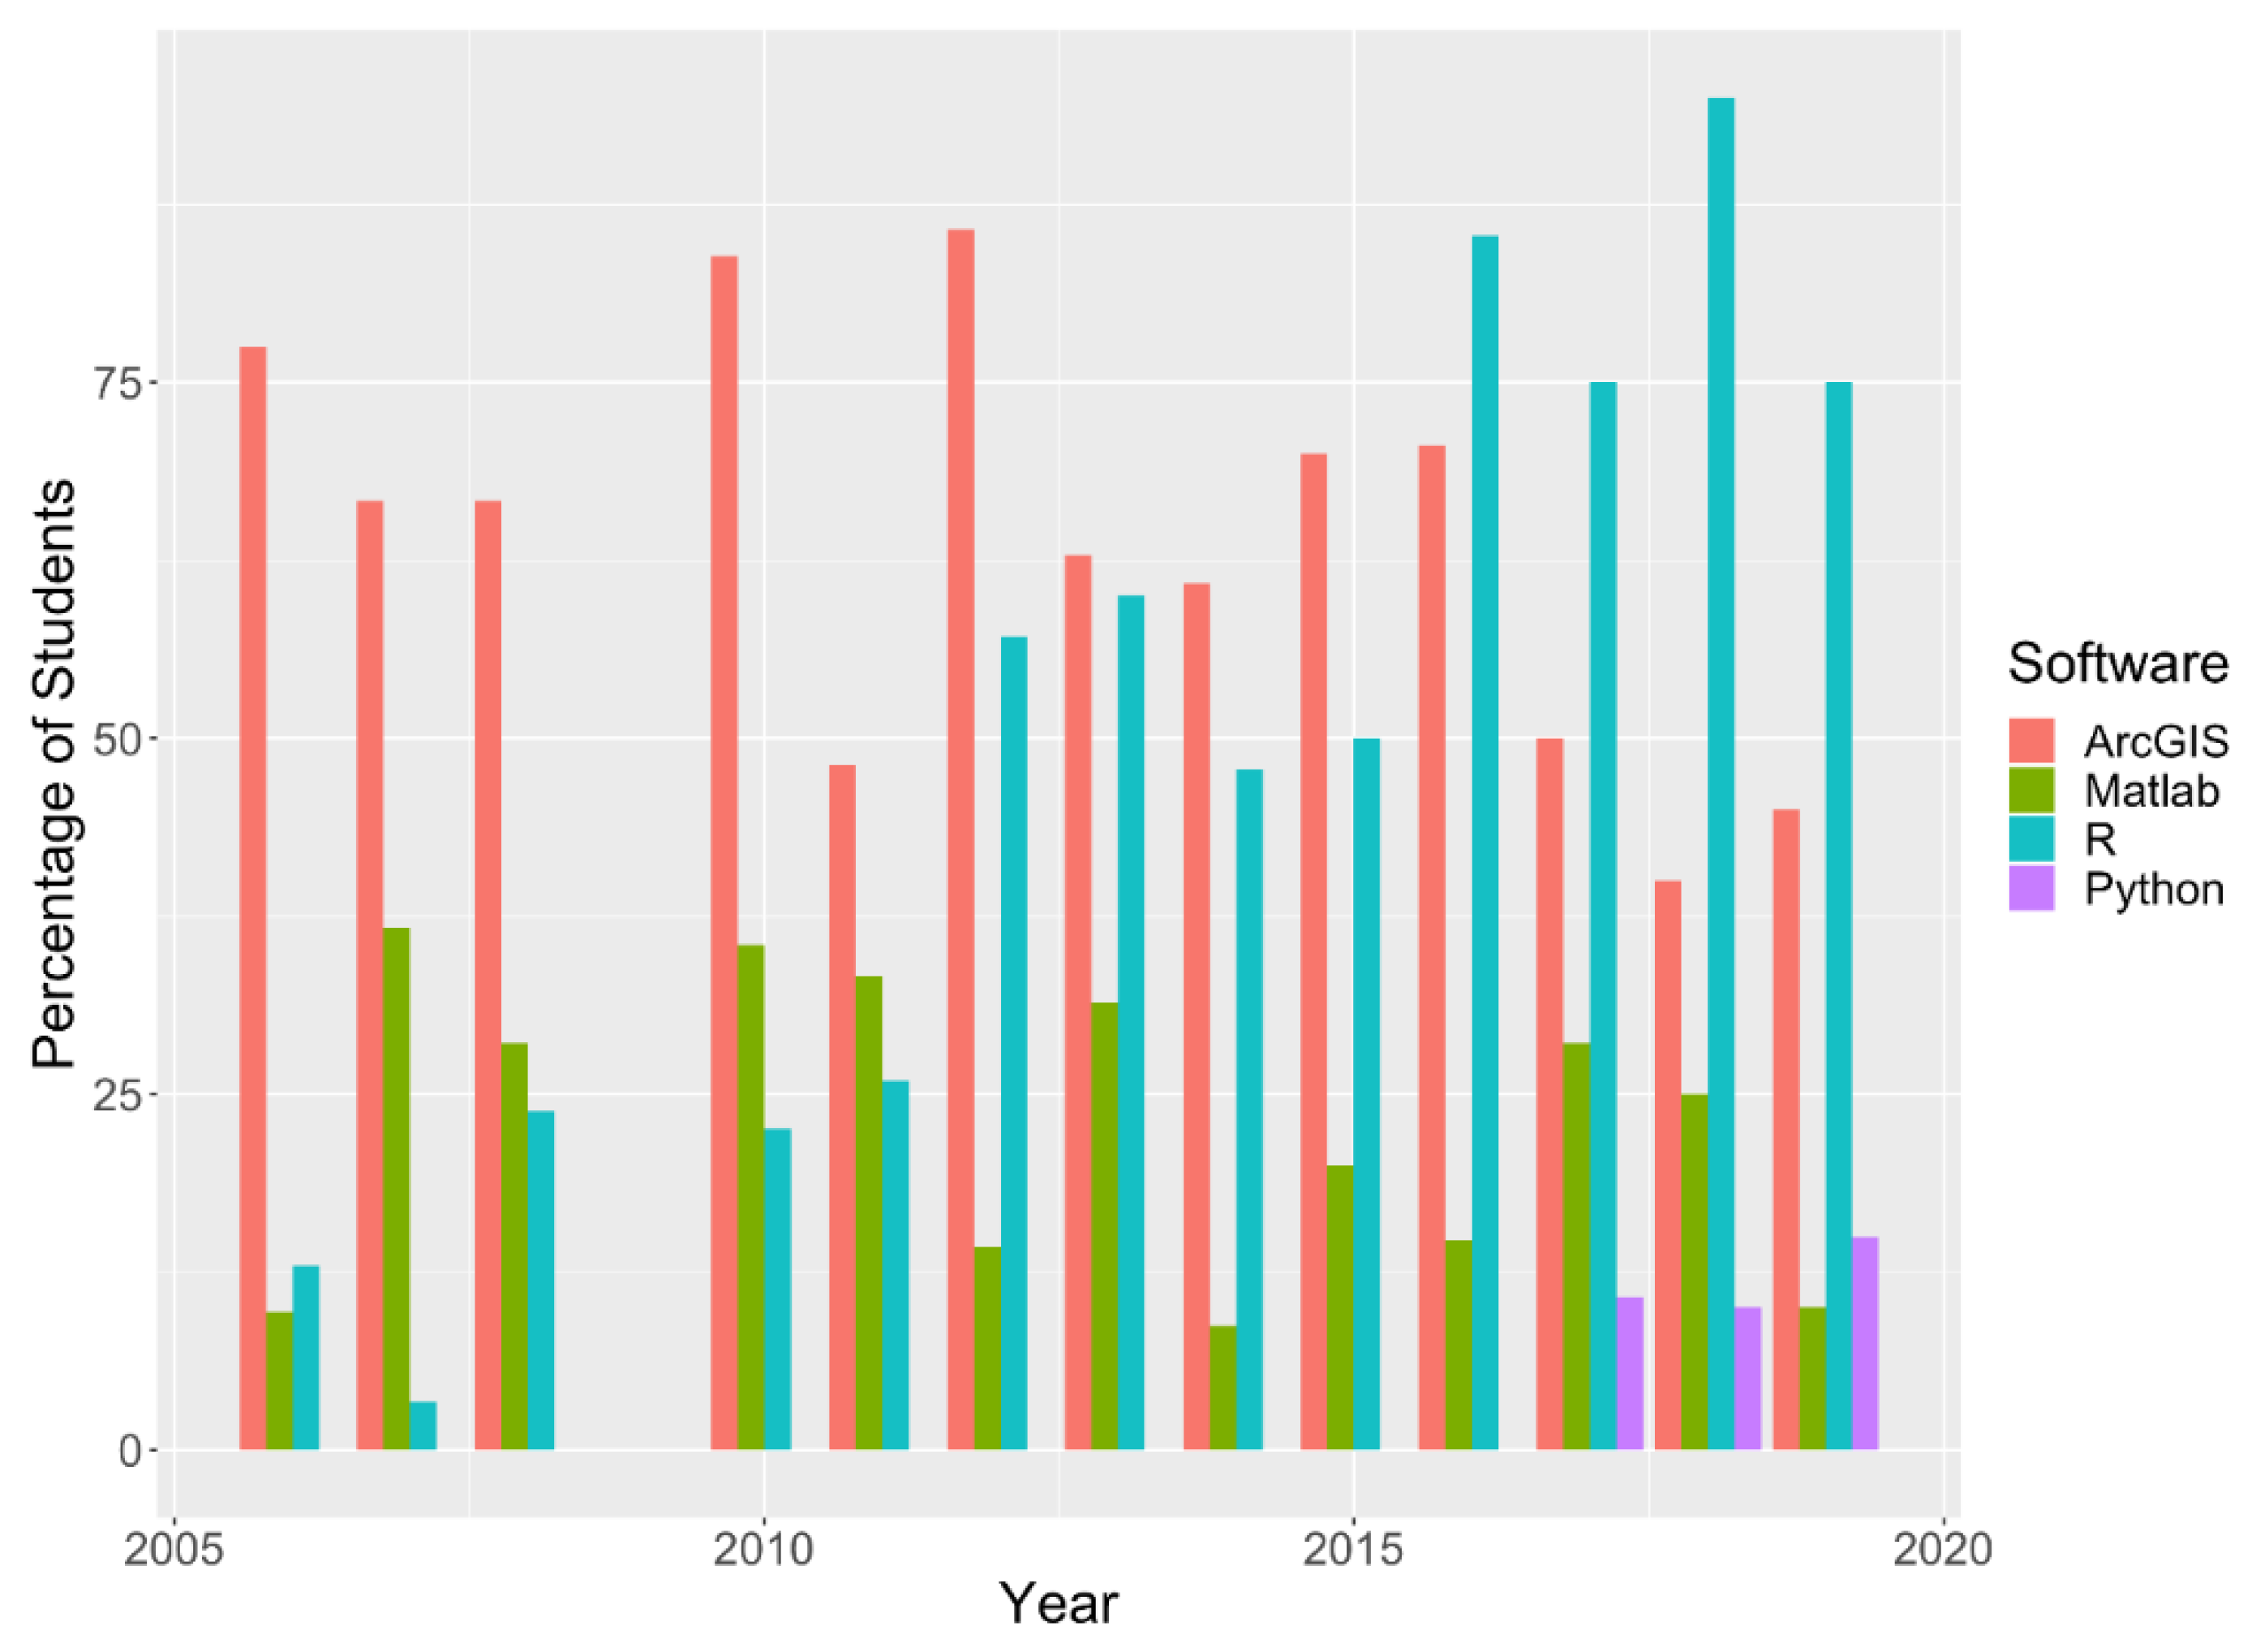
The analytical tools we use in the course are based on the skill-set and analytical software package preferences of the participants, which are determined through the course registration form. During the course beginnings, ArcGIS [
13] and Matlab® [
14] were the most commonly used software packages (
Figure 3). Over the years, there has been a steady increase in the use of R [
15], and currently R and ArcGIS are the two most commonly used packages. In 2017, Python [
16] started appearing as a software used by some participants, but it is currently not widely used by course participants. Python [
16] and R [
15] are both available under open source licensing, which is advantageous to operational users without the resources to buy expensive software licenses. By teaching in alignment with the software already being used by the participants, we leverage preexisting skills sets and avoid the challenge of introducing unfamiliar software. As a result, the hands-on portion of the course can focus on techniques to bring satellite data into the software packages and convert the data into a format that is usable to the participant. The participants can typically take over from that point and apply the data to their projects. In effect, the course becomes an exercise in capacity building that can be taken back to the workplace and integrated into an existing operational workflow.
2.1. Pre-Course Activities
An important component contributing to the success of the course is advance preparation by the students and the instructors, which is facilitated by setting up a registration process several months before the scheduled course dates. Students are required to submit an online registration form that requests their contact information and affiliation, information about their familiarity with satellite data, the satellite products that are of interest to them, the analytical software packages they prefer to use, and a brief description of the project they are interested in working on during the course. Instructors use this information to adjust the course content to match the level of experience and the interests of course participants.
About four to six weeks prior to the course, students receive a welcome email from course organizers providing logistical information. Specifications for the software packages are also included to ensure that the versions installed on the students’ laptops are compatible with the course tools. This software information is particularly important to NOAA employees and affiliates who require the assistance of an IT specialist with administration access to add or update software on their laptop computers. Within the same welcome email are links to test scripts, for use prior to the course to ensure that the software is working properly, as well as links to course materials that allow students to review the materials in advance.
2.2. Course Format
The course is conducted over three days and has three main components: (1) lectures that provide participants with a basic knowledge of satellite remote sensing; (2) live demonstrations of tools developed to facilitate the use of satellite data; and (3) a hands-on workshop applying satellite data to a work-related project of the participants choosing. On the first day, lectures center around how satellite measurements are made and the types of measurements that are available. These lectures are not intended to provide detailed information about how satellite products are made (e.g., atmospheric corrections, radiative transfer models, etc.), but rather to give students sufficient background to select the best products for their applications. The first day also includes introductions to the tools used in the course to help them bring satellite data into their analysis software. To improve retention of introductory material and reduce presentation fatigue, lectures are interspersed with hands-on demonstrations of the course tools. During the first half of the second day, instruction on using the course tools begins in earnest. Students are walked through the steps of satellite data discovery, download, and visualization in a series of exercises that are based on common oceanographic applications, such as generating a timeseries of satellite data within a user-defined area. For the final day and a half of the course, students apply the tools and information from the course to a project of their choosing, with instructors providing guidance and troubleshooting problems.
2.3. Data Access Tools
The course employs three data access tools: ERDDAP, a data server developed by NOAA’s ERD; the rerddapXtracto package [
17] for accessing ERDDAP through R; and the Environmental Data Connector [
18], a plug-in module for accessing ERDDAP through ArcGIS. Each of these tools in outlined in more detail below.
2.3.1. ERDDAP
The ERDDAP data server [
19] is the primary source of satellite data products for the course. ERDDAP provides a simple, consistent way to download data, allowing the sub-setting of data both temporally and spatially, and providing over 30 common data, metadata, and image formats for downloading data. ERDDAP provides both a graphical interface to visualize and manually download selected data, and a RESTful URL (meaning it is based on representational state transfer (REST) technology) [
20], where a data request is completely defined in a single URL. The RESTful URL allows users to bring selected satellite data directly into their analysis software. Behind the scenes, an additional benefit is that a single ERDDAP can serve as a conduit to access datasets housed on other servers (e.g., ERDDAP, THREDDS, and Sensor Observation Service (SOS)), thereby providing a single location and access protocol for datasets made available by multiple data providers (a “one-stop shopping location”). ERDDAP is used by over 80 institutions world-wide to serve satellite and other environmental data. For the course, we used the ERDDAP co-operated by CoastWatch WCN and the ERD of NOAA’s SWFC, which serves over 1000 satellite datasets [
19]. After completing the course students can continue to use the WCN/ERD ERDDAP as a rich source of satellite data for future projects. The demonstration on how to use ERDDAP that was developed for this course is publicly available on the WCN website [
21] and on GitHub [
22].
2.3.2. RerddapXtracto Package for R
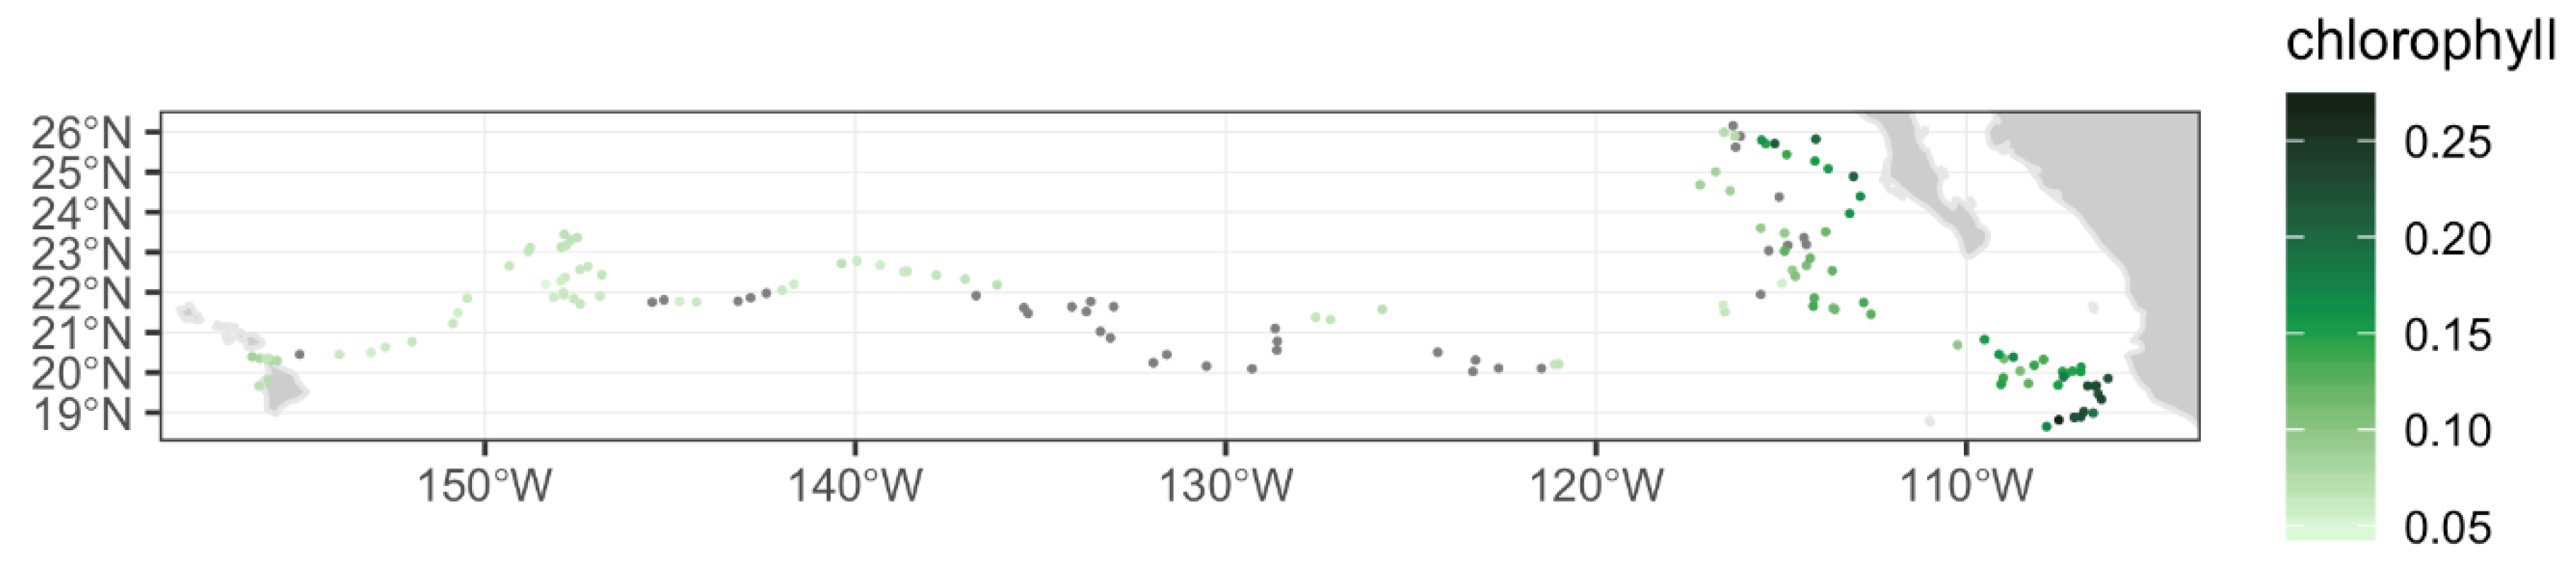
A common task in fisheries science is to extract satellite data along a set of latitude, longitude, and time coordinates representing the track of an animal fitted with a location tag (
Figure 4) or a ship’s station locations, a task which requires some degree of programming skill. To simplify this task, the rerddapXtracto R package was developed specifically for course participants to perform this data extraction on any gridded dataset on any ERDDAP for a user supplied set of latitude, longitude, and time coordinates [
17]. In addition, satellite data can be extracted for an irregularly shaped area, such as a marine sanctuary or a fishery management area. Students are provided with a set of premade scripts that demonstrate the use of the functions in the R rerddapXtracto package [
17]. This documentation is also available on the WCN website [
23] and on GitHub [
24].
2.3.3. Environmental Data Connector (EDC) for ArcGIS
Many fisheries and marine resource managers use ArcGIS [
11], which has had limited options for importing raster satellite data. To mitigate this issue, we oversaw the development of a plug-in for ArcGIS, the Environmental Data Connector (EDC) [
16], which provides a user-friendly interface for accessing raster datasets served on ERDDAP or THREDDS servers. With the EDC, datasets can be subset spatially and temporally, and then imported directly into ArcGIS. Many of the features found in the rerddapXtracto R package are also available in the EDC, including matching satellite data to an animal track or a ship’s station locations.
2.4. Datasets
The datasets used for the course are primarily off-the-shelf satellite products, which are on regular spatial grids (as opposed to swath products). Whenever possible, we make available near real-time versions of each product, which have lower quality control but are available with low latency, and delayed release (science quality) versions that are binned into daily, weekly, and monthly averaged composites. Other products included in the course are those that blend multiple sensors into a dataset, thereby providing improved spatial coverage and often extending the temporal coverage back a decade or longer [
6,
25]. This mix of products supports many of the fisheries management activities carried out by NMFS. Stock assessment, habitat classification, and conservation efforts require long-term satellite records of the highest possible quality on decadal timescales, in order to accurately detect trends and anomalies that might be influencing animal populations. In contrast, some fishery management needs, such as optimizing ship surveys in real-time and driving models in the emerging field of dynamic ocean management [
9,
10,
11], require recent and near-real-time satellite data.
2.5. Student Projects
During the second half of the course students work on a project of their own choosing. The project work is a key aspect of the course satellite course, in that it facilitates employing some of the core tenets of problem-based learning into our instructional design [
26]. Students apply the knowledge and tools introduced during the lectures and demonstrations to the project, drawing on the expertise of fellow students, with the instructors providing support and guidance and overseeing the learning process.
2.6. Post-Course Activities
At the conclusion of the course, students are requested to complete an evaluation survey to document their experiences and to determine which aspects of the course worked well and which could be improved. This information is used in the continual process of fine-tuning the course to optimize its effectiveness. The students are also requested to turn in a summary slide that describes how they applied their newly acquired satellite data skills to their course project or future projects. The slides are useful for designing new tools to address common tasks for future participants and to demonstrate to NOAA management the utility of operational satellite products.
2.7. Extending Our Reach
Until recently, the NOAA Satellite Courses offered by WCN have been held almost exclusively on the U.S. West Coast, in either Corvallis, Oregon (2006–2013), or Seattle, Washington (2014–2017). As a consequence, participation has been biased towards those residing regionally or those who could secure travel funds to attend. To begin addressing this issue, WCN offered a Satellite Course in March at the NMFS Laboratory in Juneau, Alaska, in March 2019. A significant number of scientists there had never been able to attend the course in Seattle as its timing conflicted with their operational field work. In addition, WCN will partner with the CoastWatch Atlantic Node for a 2019 course in Galveston, Texas, and a 2020 course in Puerto Rico. Beginning in 2017, WCN began working with personnel from other CoastWatch regional nodes to develop courses tailored to specific regions of the United States. As a consequence, Central Pacific OceanWatch Node offered a satellite data training course in Hawaii in autumn 2018. The East Coast Node offered a course in Narragansett, Rhode Island, in August 2018, and a second course in College Park, Maryland, in May 2019.
In addition to training the NOAA operational workforce, engaging an international workforce is an important element in increasing use of satellite data in oceanography. Towards this end, elements of the NOAA Satellite Training Course have been incorporated into the tutorial sessions offered by the Pan Ocean Remote Sensing Conference (PORSEC). Since 2014 the WCN manager has been the lead instructor in the PORSEC tutorials, which have been held in Indonesia (2014), Brazil (2016), and South Korea (2018); the next tutorial is planned for Malaysia in 2020. The tutorials attract an international group of advanced undergraduate students, graduate students, and young professionals who want to expand their expertise in using ocean satellite products.
4. Lessons Learned
4.1. Teach with the Software Used by Course Participants
Operational end-users typically employ a set of analytical software they have already integrated into the workflows for their operational tasks. Using the same analytical software in the course instead of imposing a new and unfamiliar set of tools improves the effectiveness of the course in the following ways. First, course time is spent on techniques to acquire and process satellite data rather than teaching a new software program. Second, the need for course participants to install and pay for a new software license is avoided. Finally, the skills and techniques participants learn in the course can be immediately applied to existing workflows. Currently, the NOAA course focuses on accessing data with either ArcGIS or R (
Figure 3), which are the tools currently preferred by course participants. Materials developed for the course demonstrating the use of the rerddapXtracto package [
17] for R are now available on the WCN website [
24] and on GitHub [
23].
4.2. Provide One-Stop Shopping for Data
Providing participants with a single online location to access the data they need gives them a consistent way to obtain data without having to deal with multiple formats and access protocols. During the course, this allows participants to quickly start to use satellite data. An added benefit is that participants can return to the same location for additional satellite data needs and introduce colleagues to data sources. For our courses, we use an ERDDAP server that distributes approximately 1000 satellite datasets [
19]. Materials demonstrating the use of ERDDAP that were developed for the course are now available on the WCN website [
21] and on GitHub [
22].
4.3. Understand Users’ Data Requirements
We have observed that providing satellite products that are fit for purpose, i.e., datasets that are appropriate for the operational applications on which the course participants are working, increases the likelihood that operational scientists will use satellite data in their studies. For example, fisheries management applications, such as determining ecological tends or characterizing fish habitats, require science quality datasets that go back decades. Typically, daily satellite observations are too frequent for these long-term studies, requiring weekly or monthly versions of the dataset, and often an anomaly product is required to evaluate changes in environmental conditions. In addition, most end-users are interested in a satellite product type, such as chlorophyll or sea surface temperature, and are less concerned with which sensor or satellite collected the data. Therefore, products such as the Multi-Scale Ultra-High Resolution sea surface temperature dataset [
39] and the ESA’s Climate Change Initiative Ocean Color products [
25] that merge together data from multiple sensors and platforms to create long timeseries are extremely valuable for fisheries applications. Near real-time data are also needed for optimizing ship surveys in real-time and developing models in the emerging field of dynamic ocean management [
9,
10,
11].
4.4. Document Student Projects
A cataloging of the participants’ course projects that captures, at minimum, a description of each project, how it supports operational goals, and how skills learned during the course have advanced the projects, provides multiple benefits for course sustainability and improvement. First, the catalog information helps course designers monitor changing student needs and adjust course content to address those needs. For example, early in the history of our course we tracked a recurring need to match up ship sampling locations to satellite data, which lead to development of the rerddapXtracto R package. Second, the catalog is a useful resource for showing new students what can be done with satellite data. Finally, the organizations funding the course, NOAA, NESDIS, and JPSS in our case, need to understand how the course is benefiting operational goals in order to justify the expenditure and ensure future funding for the course.
4.5. Rotate Course Locations
Roaming courses, offered in a variety of geographic locations, allow broader participation when there are limited travel funds available to attend the course. In addition, targeting different locations helps to avoid saturating the market for a satellite course in one area and allows instructors to localize the content of the course to address different regional needs.
4.6. Learn from Course Participants
These courses provide a valuable opportunity for course instructors to understand both the types of satellite products operational end-users need, and their specific applications. This information helps instructors to develop more effective course materials and improve on the data access tools used in the course. Conducting the course also helps to identify gaps in the existing suite of satellite products. Communicating these data needs back to NOAA’s data providers allows them to better address user needs. In addition, because participants are proficient in the software packages used for the course, they often develop creative scripts to accomplish operational tasks that they are willing to share with the instructors and other course participant which expands the tool set offered to future participants.
4.7. Future Steps
The NOAA Satellite Course was developed by satellite oceanographers with limited professional training in education techniques or theory. In the future, we intend to incorporate input from professional educators to improve the course lecture materials. In addition, an effective evaluation process is important for improving the course and assessing course effectiveness. Our evaluations process has focused on asking about satellite data usage, which has provided valuable insight for improving the course. However, additional insights could have been gained by asking participants to assess their pre and post confidence levels on specific aspects covered in the training [
40]. For our future training courses, we plan on incorporating this improved survey design, which would specifically ask about each of the different components of the course: knowledge about satellite datasets, experience with accessing data, and background using analysis software.
5. Conclusions
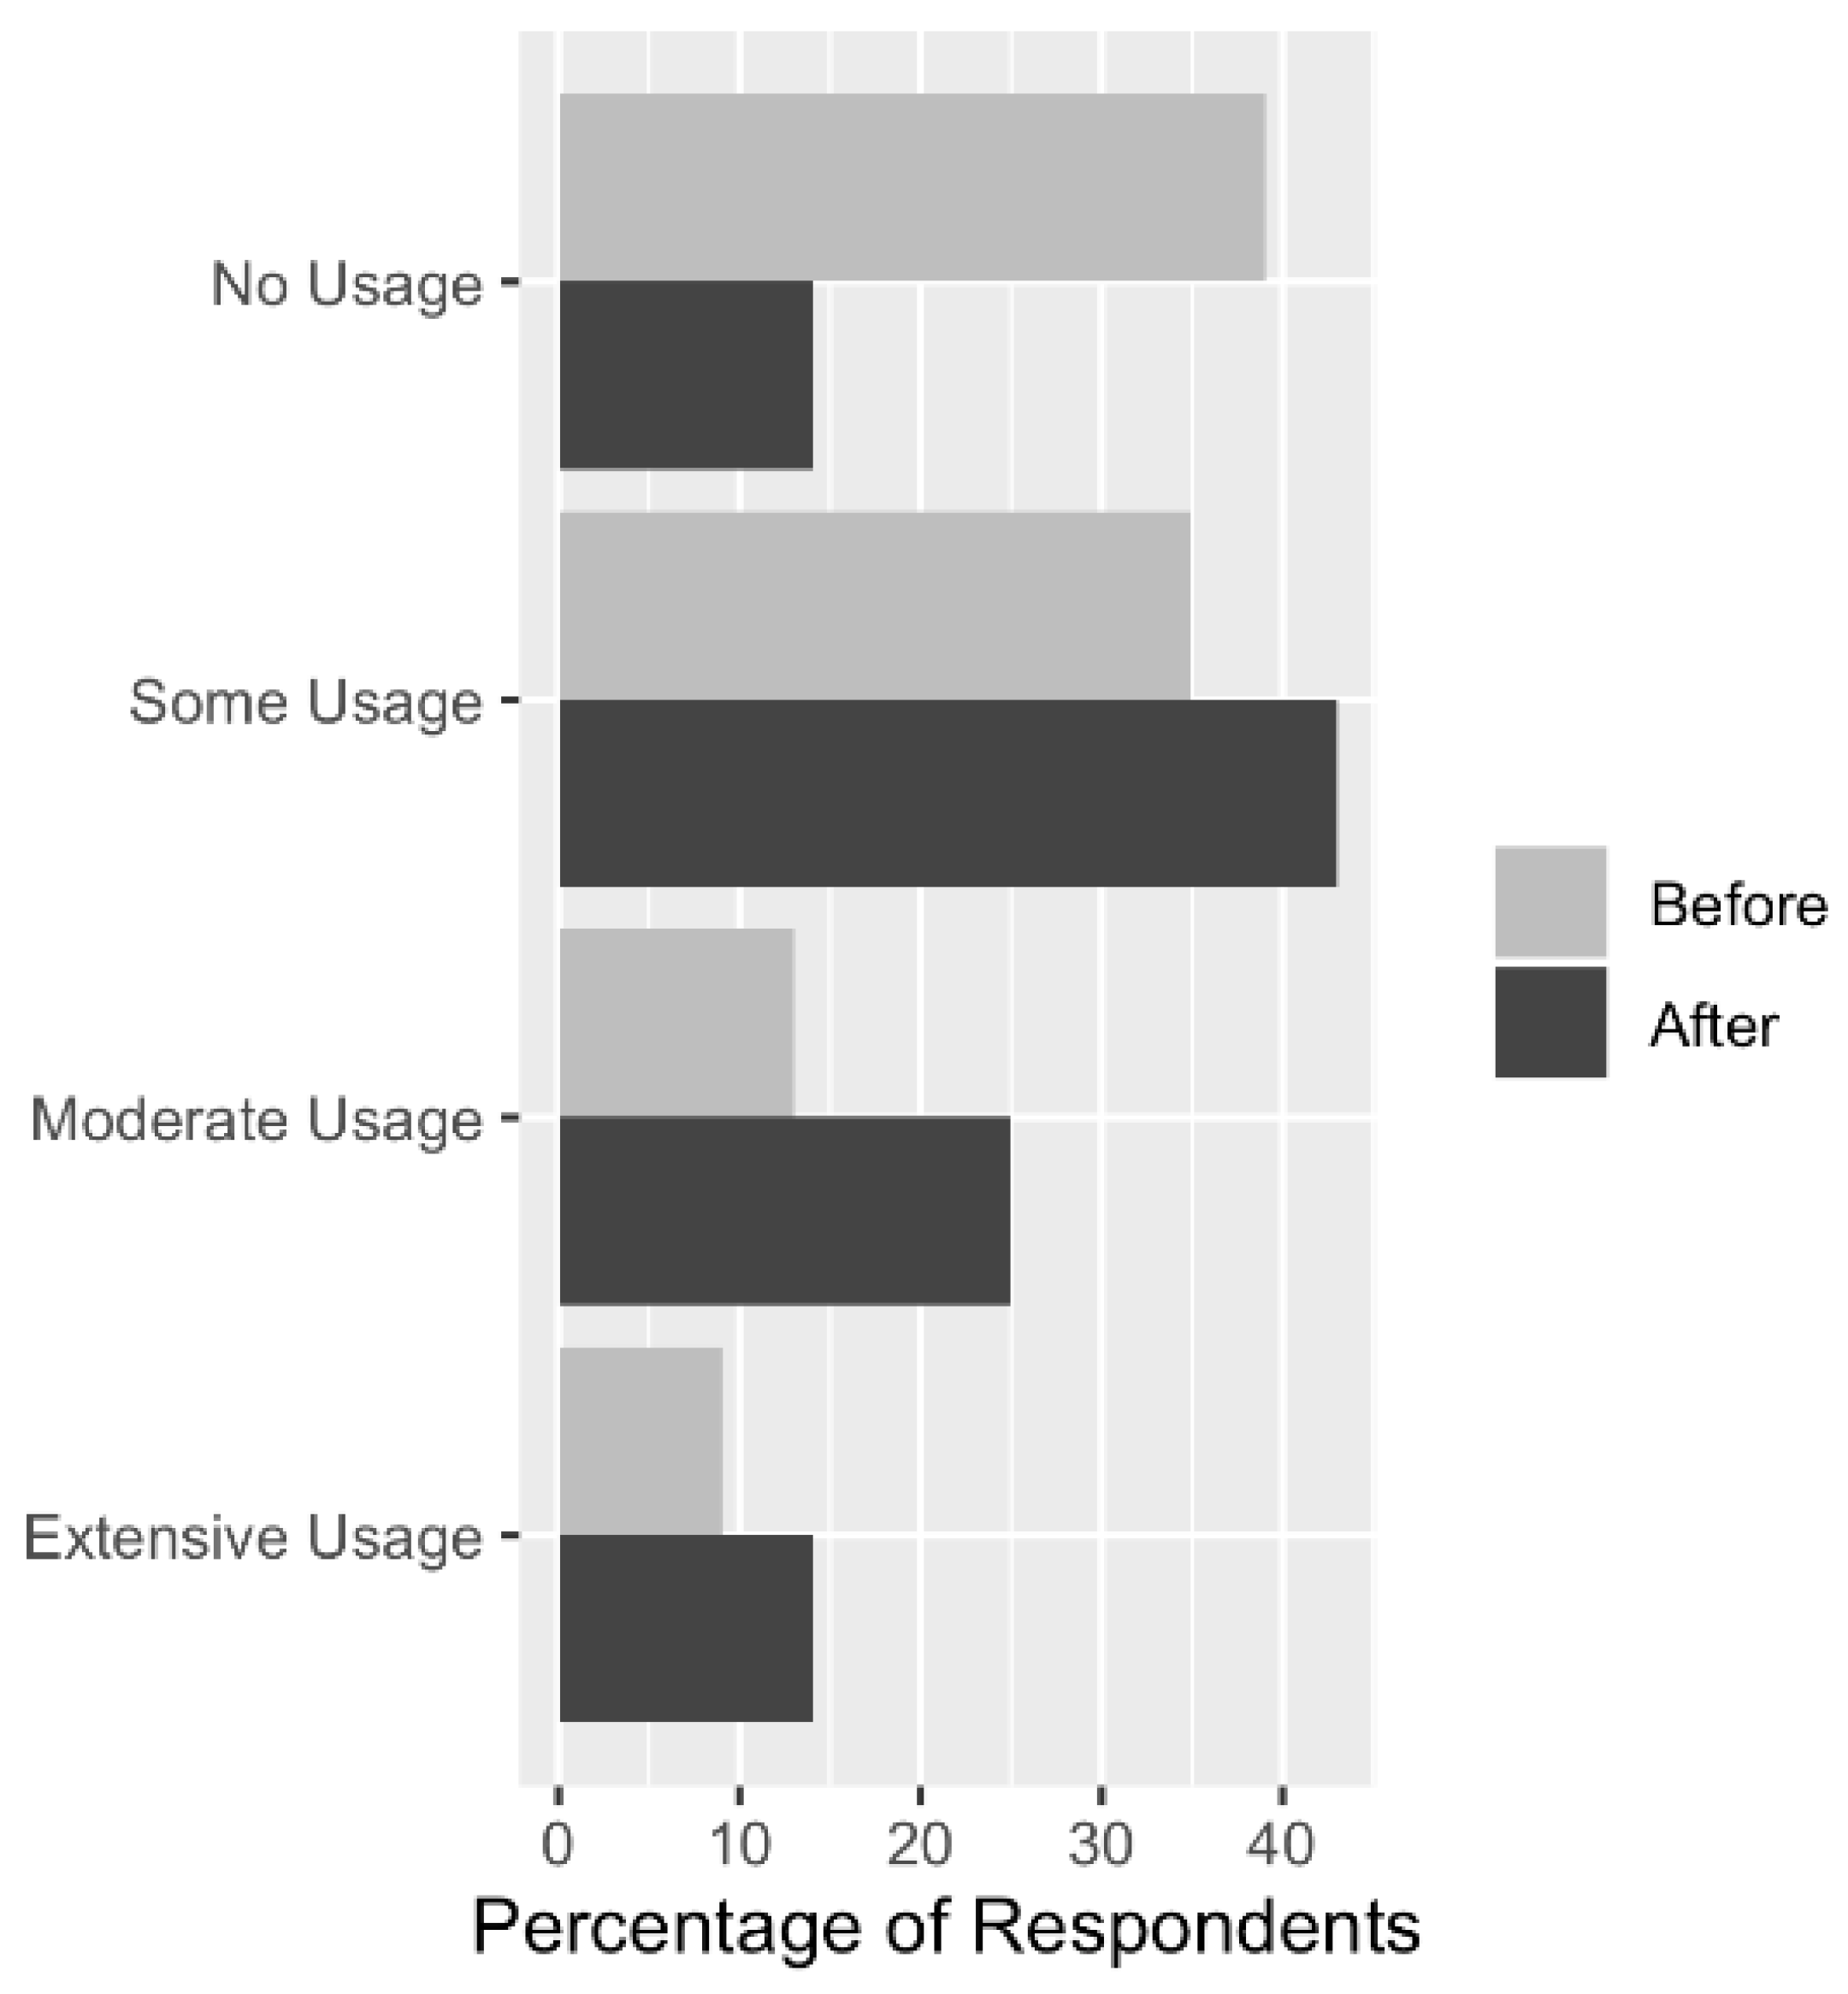
The NOAA Ocean Satellite Course was implemented to address the underutilization of satellite data in the operational activities of the NMFS. Based on feedback and survey results from participants in the course, the course has been effective at achieving this goal. Satellite usage by course alumni increased after taking the course, even for those who regularly used satellite data in their work prior to taking the course. Most notably, those who do not use satellite data in their work dropped by 66% after taking the course.
The target participants for the course are the researchers and resource managers within NMFS, and the course is designed to make it easy for them to use satellite data and to attend the course. Course instructors are embedded within NMFS line offices, where they work with potential participants to understand their satellite product needs. Off-the-shelf datasets that are appropriate to address those needs are assembled in a single online location for classroom use. The datasets are distributed via ERDDAP servers, which provide the participant with a simple, consistent way to subset and download the satellite data. In addition, productivity tools are made available that interact with ERDDAP to help participants accomplish tasks commonly necessary for fisheries research. Participants are given a background in the fundamentals of satellite remote sensing sufficient to help them select and use data products that are useful without exposing them to advanced remote sensing concepts that are beyond the scope of a three-day course. Practical portions of the course are taught using the preferred software of the course participants, thereby eliminating the effort involved in learning new software. Finally, the courses are offered in various locations, nationally and internationally, thereby reducing the time and expense needed for participants’ travel.
Although teaching the course content and tools are important to the success of the course, a few instructional steps serve to reinforce and foster the continued use of satellite data by participants. The first is the hands-on portion of the course, where participants take the information and skills learned in the lecture portion of the course and apply it to a satellite-based application that is relevant to their operational activities at NMFS. The second is the post-course support available to participants to reinforce and foster their continued use of satellite data. Course materials and the ERDDAP data catalog are continually updated and made available on the WCN website (
https://coastwatch.pfeg.noaa.gov/). WCN and PolarWatch, its sister node, also maintains code libraries in R and Python. Finally, CoastWatch support personnel are available to course participants to answer question and to help implement satellite data applications.


