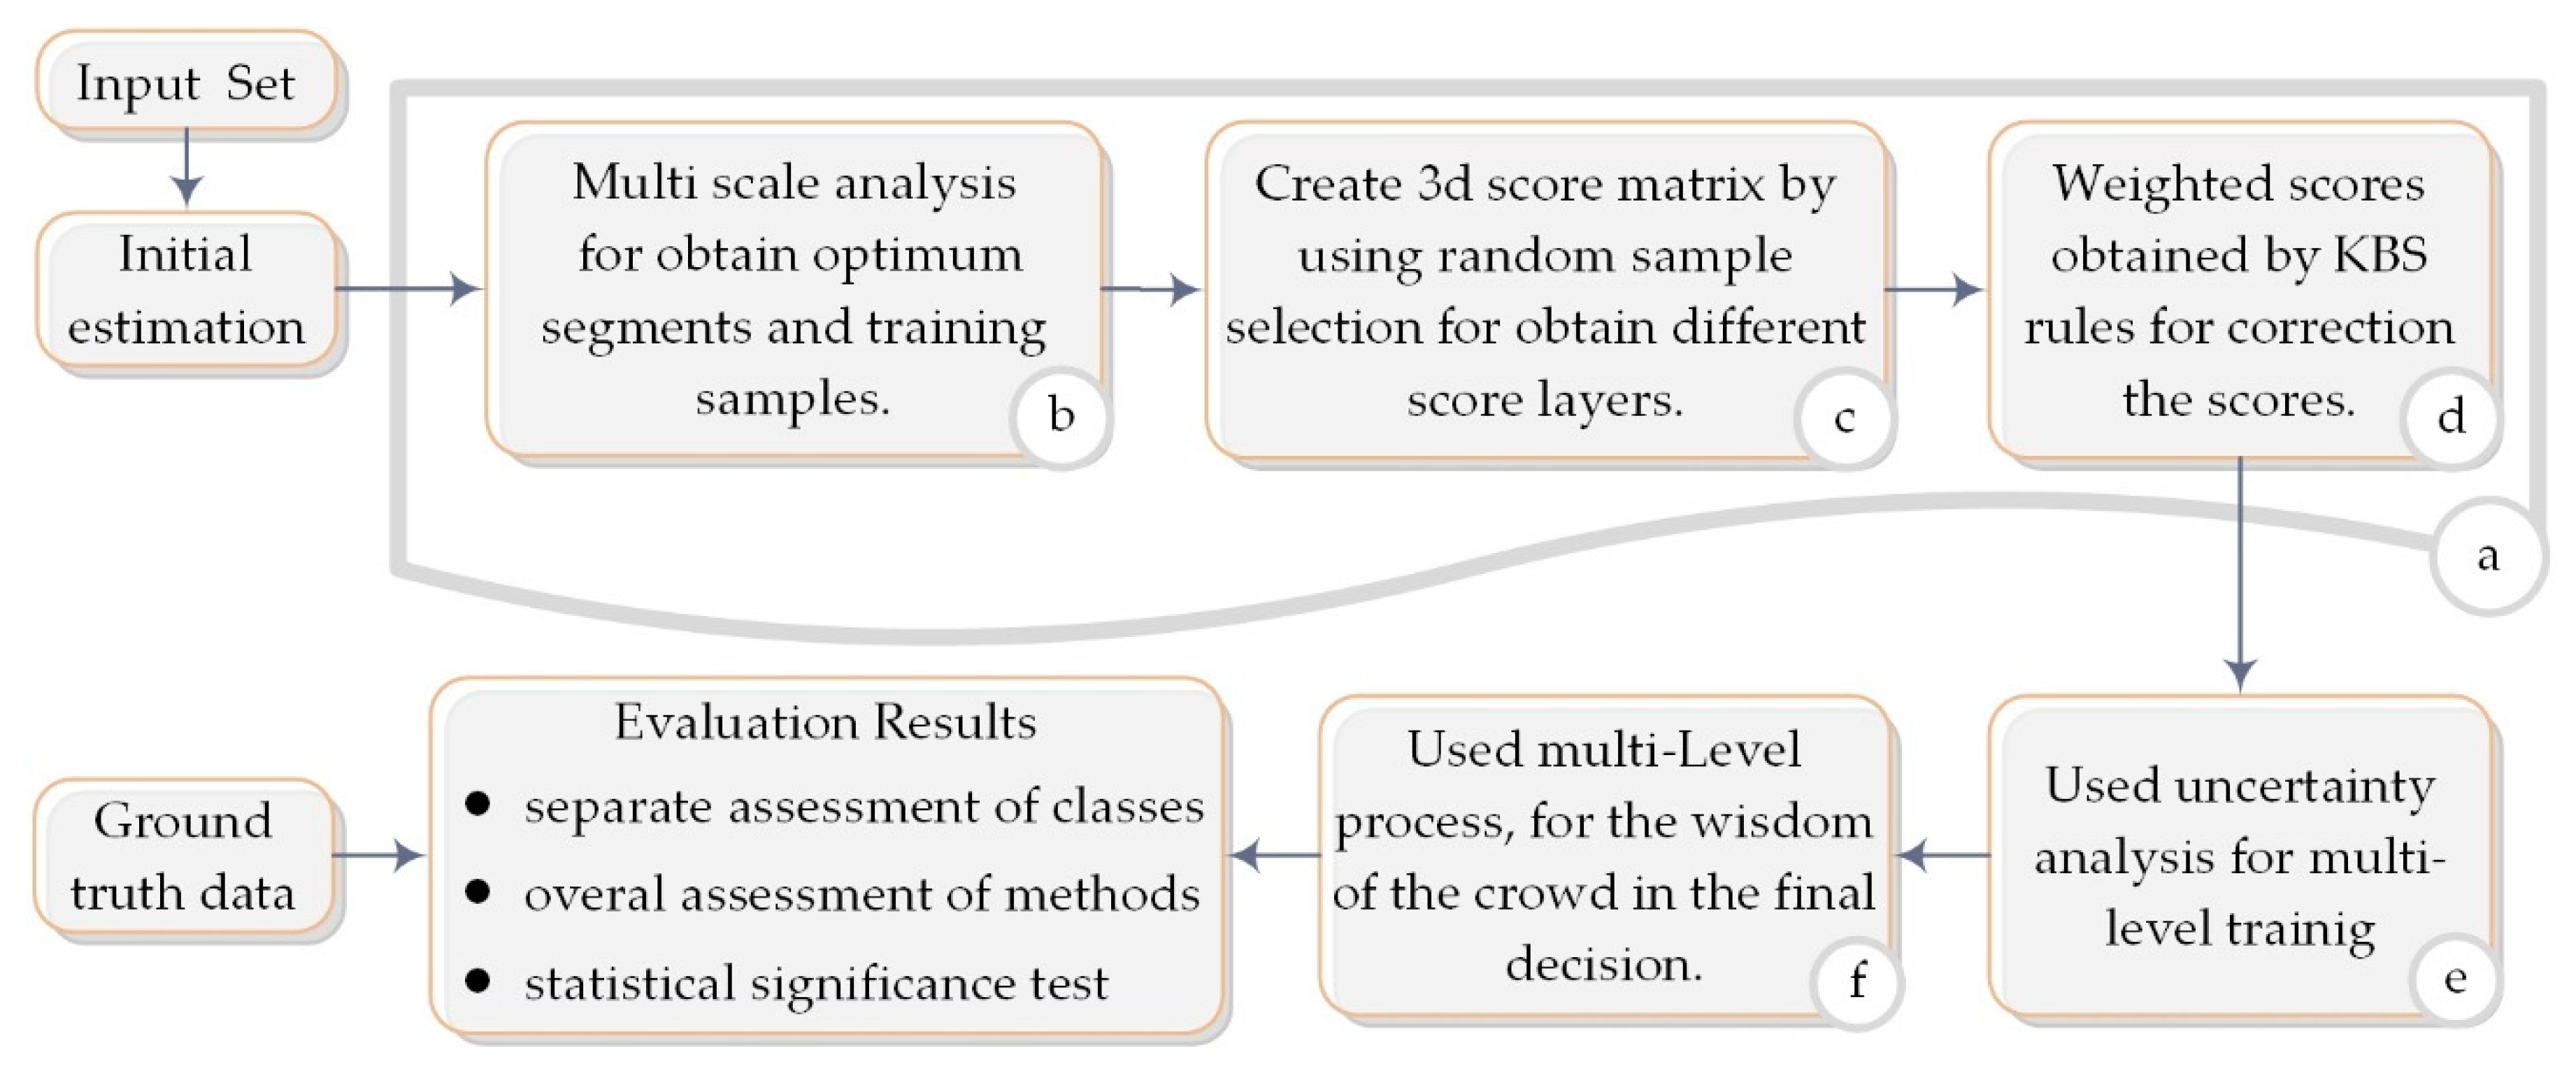
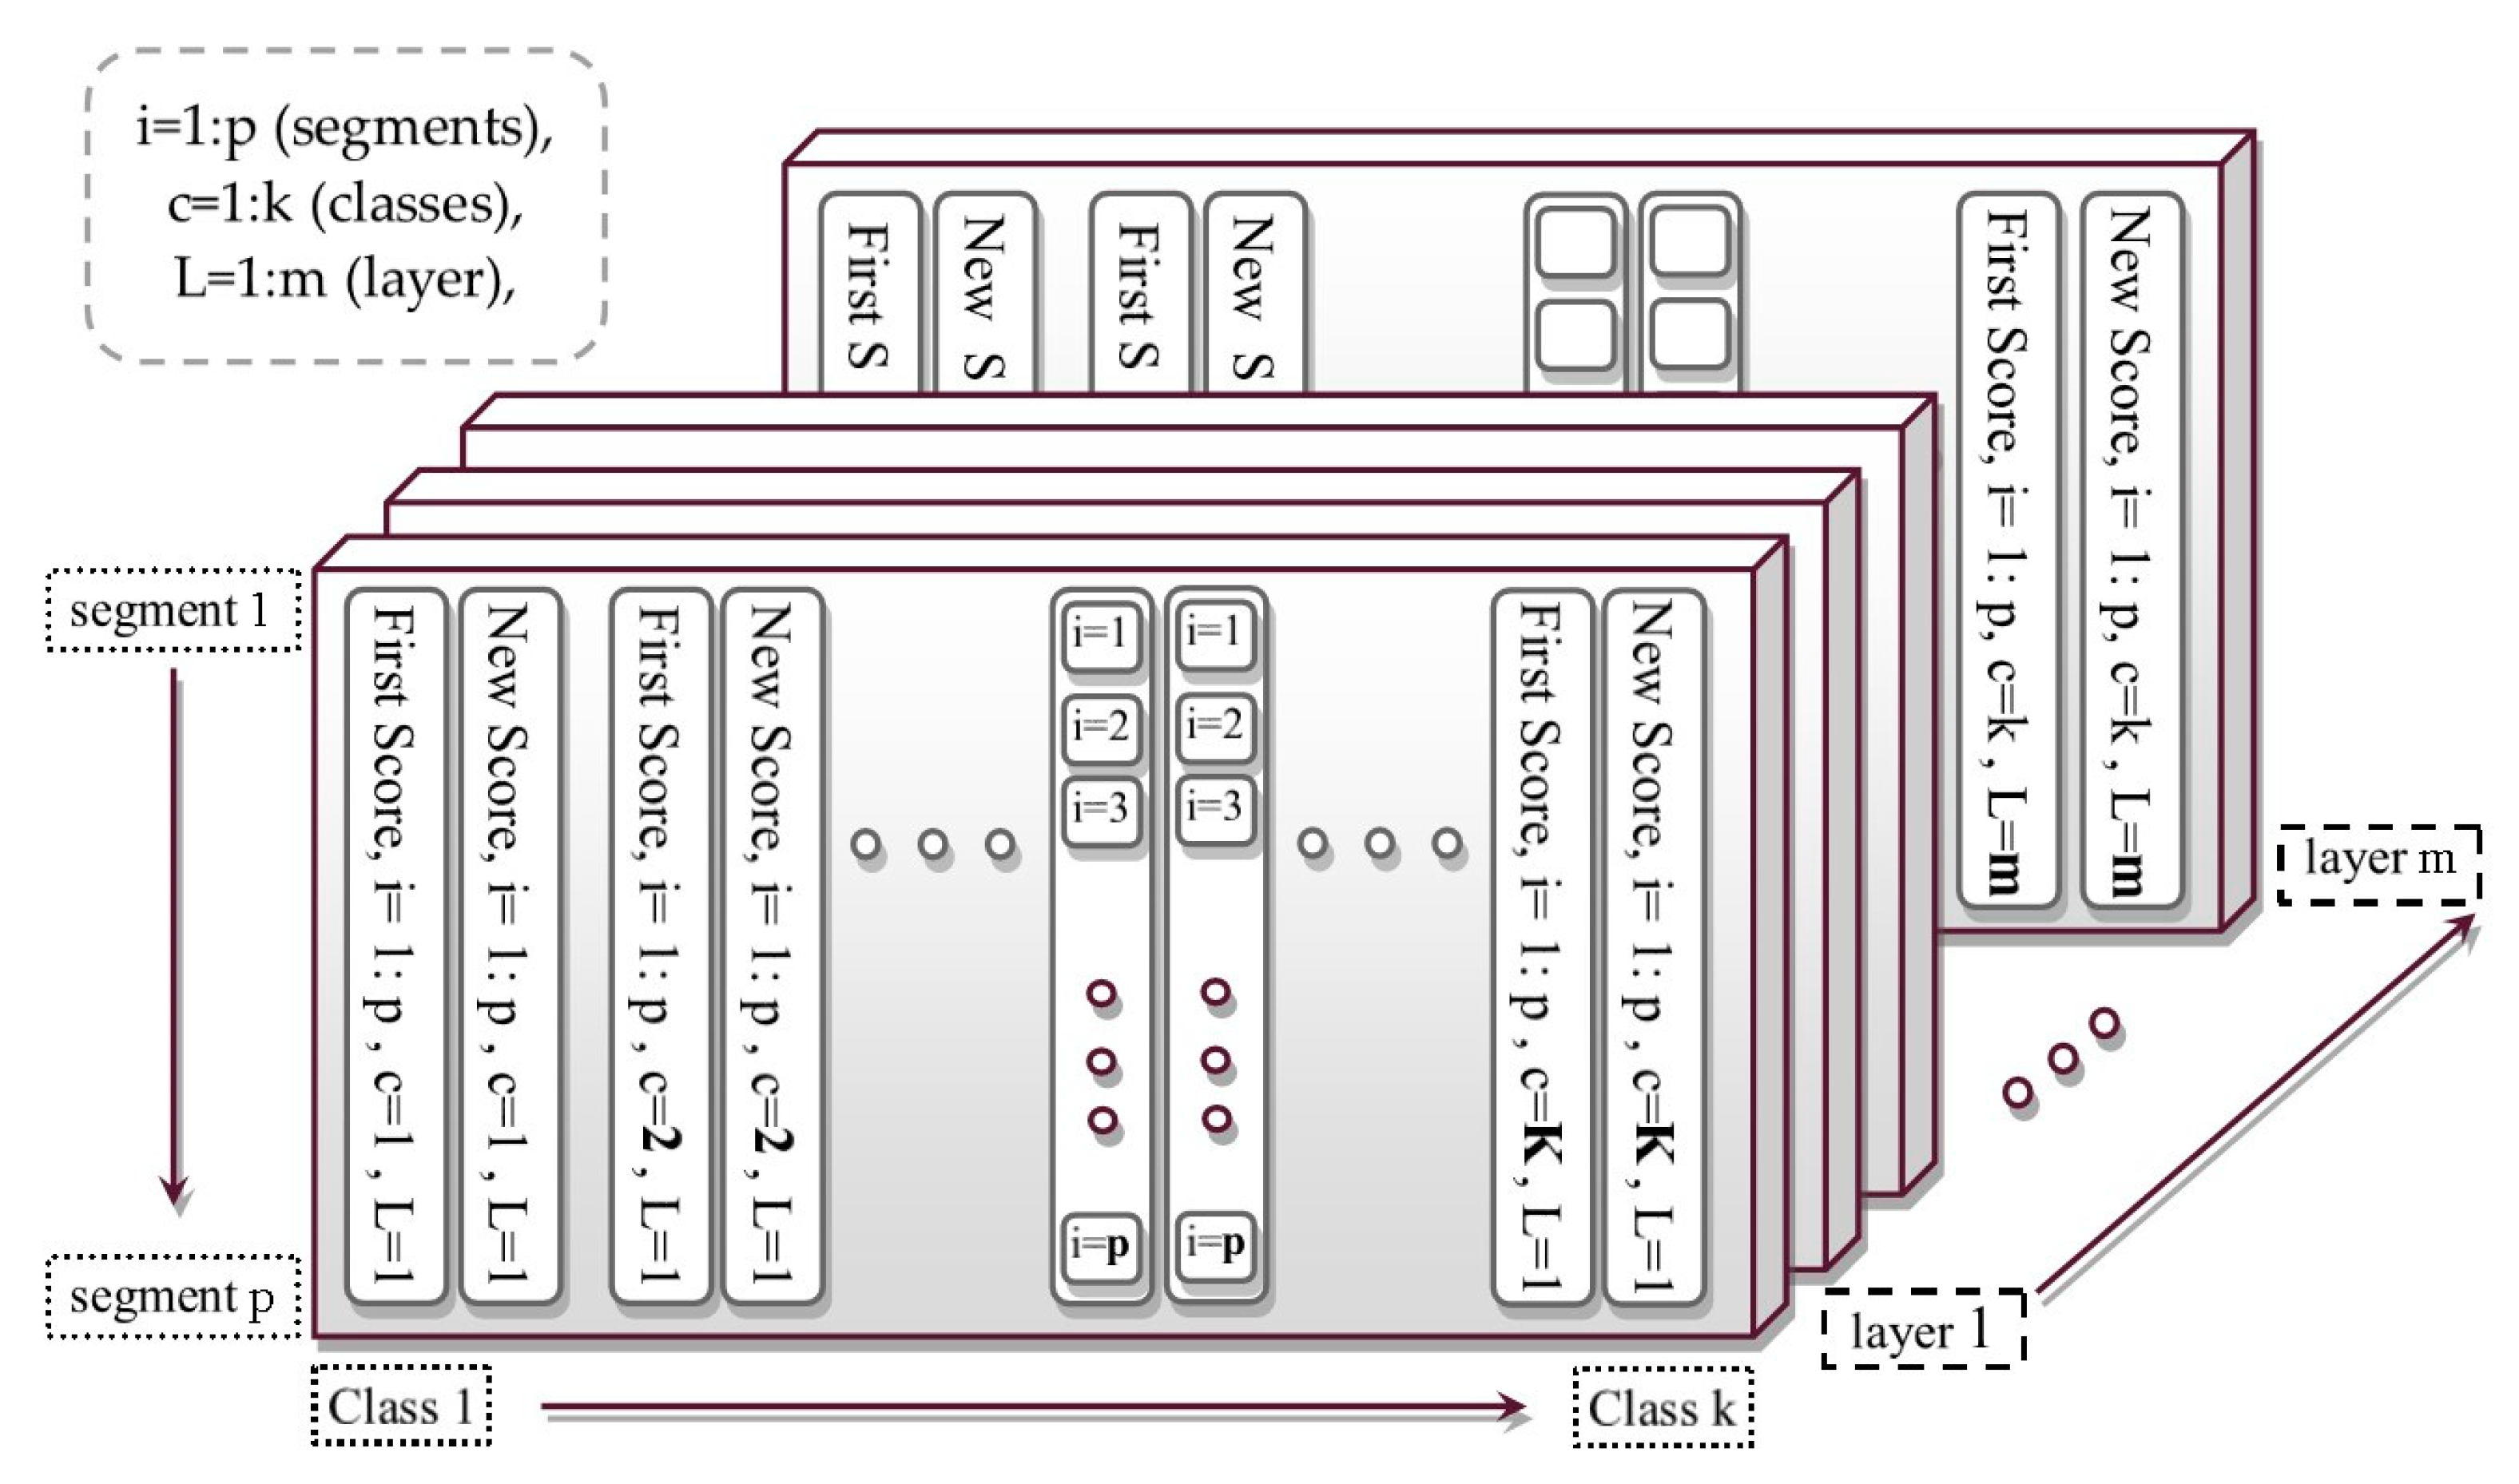
3.2. Results
In order to evaluate the proposed method, it was applied on the test images (the test images I to V correspond to Vaihingen 5, 7, 13, 26, and 28, respectively) in several ways. First, we evaluated the results of the proposed method on the test images and compared them with the base state in which all the training data was used (
Table 1). Likewise, the layered form of the proposed method in majority voting mode was used for output labels (
Table 1). Next, the results were reviewed at each class by F1_score criteria (
Table 2). For more comparison, popular machine learning algorithms such as AdaBoost and RF were also studied (
Table 3). In
Table 4 we used an optimization algorithm in the parameter determination of the SVMs kernel. Furthermore, in order to evaluate the efficiency of the proposed method in different feature spaces as an input of the classification method, new features were extracted from the images band and DSM data. The results from the classification of images with these new features were examined by the proposed and compared methods (
Table 5 and
Table 6). Finally, the McNemar test was done. In all the scenarios, the same training data was used. Furthermore, the ground truth including the whole image was used to evaluate all the tests (provided by [
44]).
In the comparative process, we tried to examine the proposed method in different aspects. Accordingly, in the base mode (
Table 1, Column:
Base), the used classifier was the same as in the proposed method, with the difference that all training data are used. Likewise, the majority voting mode used several layers and the training sampling was the same as in the proposed method, but all layer outputs were used as labels in the majority voting mode (
Table 1, Column:
Majority vote).
The results show that our approach increased the classification accuracy compared to the voting-based method. The accuracy depended on the scene conditions. The classification defects of test image IV were due to the presence of more shadowed areas, high interference between the water class and the road in the shadow, the existence of complex and diverse buildings with different roof slopes (from flat to inclined), and also the dense buildings area. Hence, by maintaining the other conditions and only changing the classification method, we could obtain more improvement. Meanwhile, for some images (such as test image III), which has less class interference of the training data and separate buildings etc., a less improved accuracy was achieved. The shortage of its classification was more affected by the characteristics of the ground truth data and the scene conditions (in terms of the shrubs belonging to the high or low elevation vegetation class, as well as the separation of road and sparse vegetation cover, etc.). Furthermore, if the classification results were similar, the combination process could not improve the classification accuracy. Therefore, diversity is an important requirement for the success of hybrid systems [
8,
45]. In test image III, for all modes (
Table 1) the results were the same (no significant changes), so a great improvement in the results was not expected. In order to compare the accuracy of the classes, the accuracy of each class was examined separately by F1_score. According to the number of test images and classes, only the two last test images in
Table 1 are presented below (
Table 2).
As seen in the class accuracy review, the proposed method had the highest accuracy in the building class, which is one of the most important urban indicators. In the test image IV, the precision of the water class was low in the base mode, since the asphalt pavement in the shaded areas (due to the coldness of the area) had a similar behavior to the water properties in the near-infrared band. Therefore, the precision of these classes was diminished (
Table 2, Column:
Base). In the majority voting, because we attempted to expand the distribution modes, the training segments in each layer were distributed regularly between classes and an improvement was achieved (
Table 2, Column:
Majority vote). Accordingly, the proposed method obtained appropriate results using the layered analysis system and weighted scores. In order to do a further evaluation, ensemble classification methods were considered.
In order to do a further evaluation, RF and AdaBoost methods were considered. The results of the RF method are presented on the test images in
Table 3. Since the number of trees must be defined in this method, this value was defined in three modes. The RF classification was implemented in the EnMAP-box software [
46]. The EnMAP-box is a IDL-based tool for the classification and regression analysis of remote-sensing imagery. RF offers a cross-validation-like accuracy measure through the out-of-bag error estimate and gives an insight into the variable importance by assessing the accuracy loss when feature values are randomly permuted [
47]. For greater comparison, the AdaBoost method [
20,
48], another popular ensemble classifier in the machine learning algorithms, was also studied (
Table 3). The AdaBoost algorithm used classification trees as individual classifiers, and then a bootstrap sample of the training set was drawn using the weights for each trial on that iteration. The number of iterations and the number of trees were set to equal. For all tests, the inputs (used segments, training data, and features) were similar to the proposed method.
SVM uses kernel functions in order to map data into higher features space to obtain better results. For a comparison with the proposed method, in this step, the RBF kernel function was used. Hence, some parameters, such as the penalty term (C) and RBF kernel parameter were required to be optimally set. Ideal values for these parameters depended on the distribution of the classes in the feature space. In doing so, those parameters with the best performance were found by optimization methods (
Table 4). Hence, we used the grid search to test ranges of parameters with an internal performance estimation for a new comparison method (Op. SVM). The accuracy of results during the grid search was monitored by three-fold cross-validation on the training data.
According to the results, RF generally exhibits a little better performance improvement over the AdaBoost. RF yields a generalization error rate that compares favorably to AdaBoost, yet is more robust to noise. For example, in image IV, which has a class interference and mixed sample, its accuracy improvement was greater. Furthermore, according to the results, it can be assumed that, on average, when the number of trees in the RF and AdaBoost methods was equal to the number of selected layers in the proposed method (which is automatically determined), it may be at is optimum.
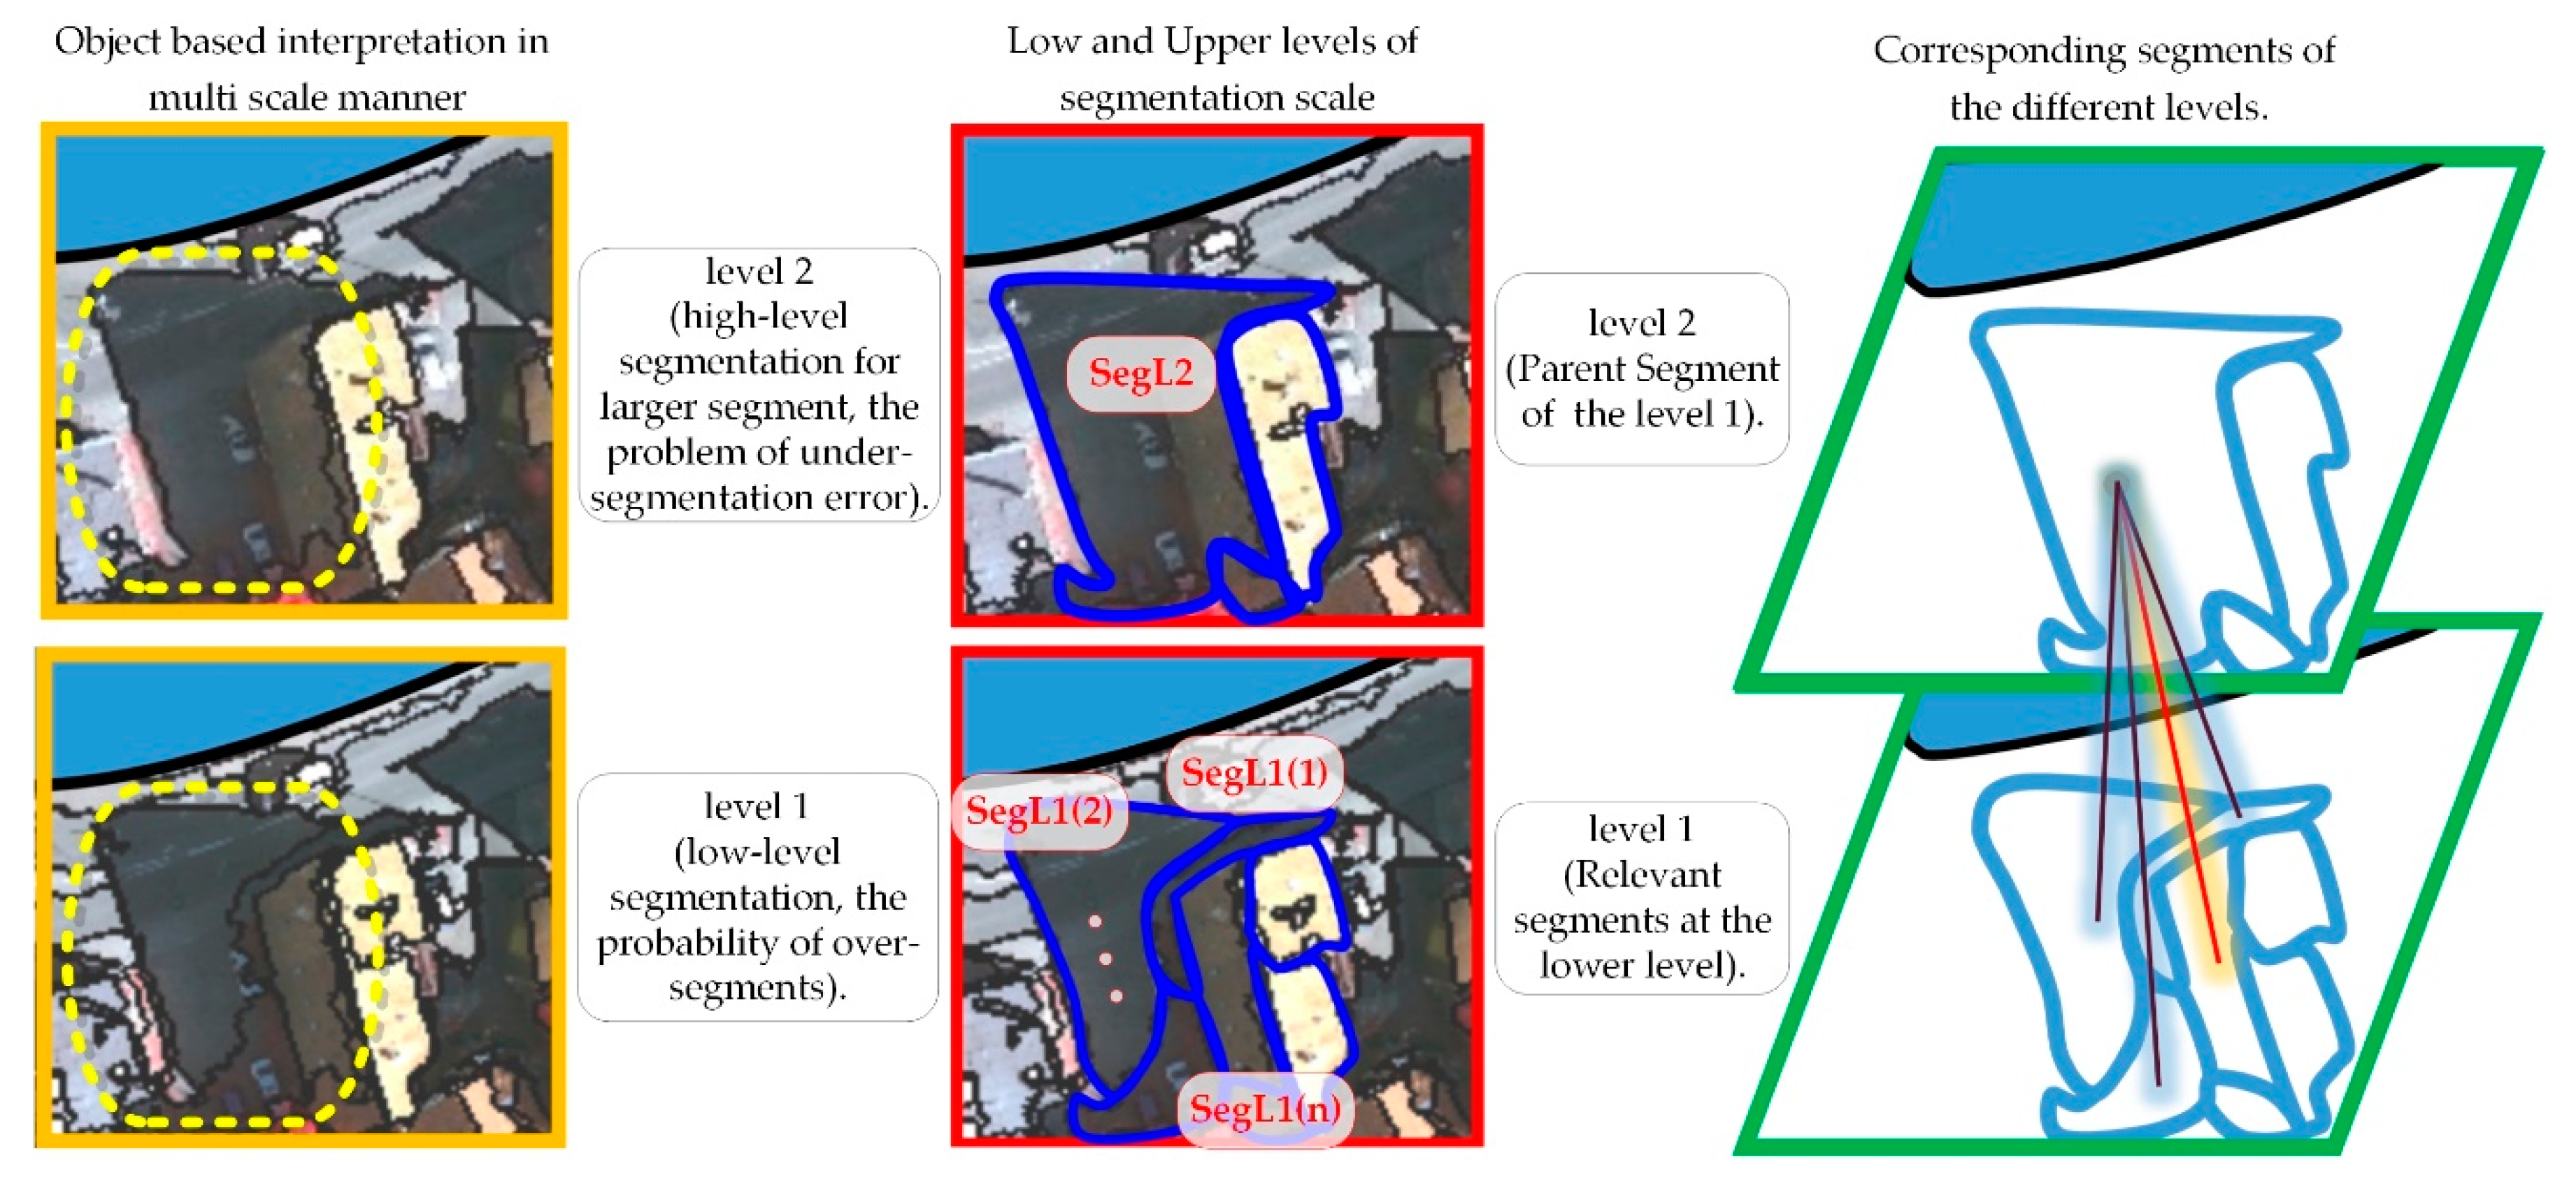
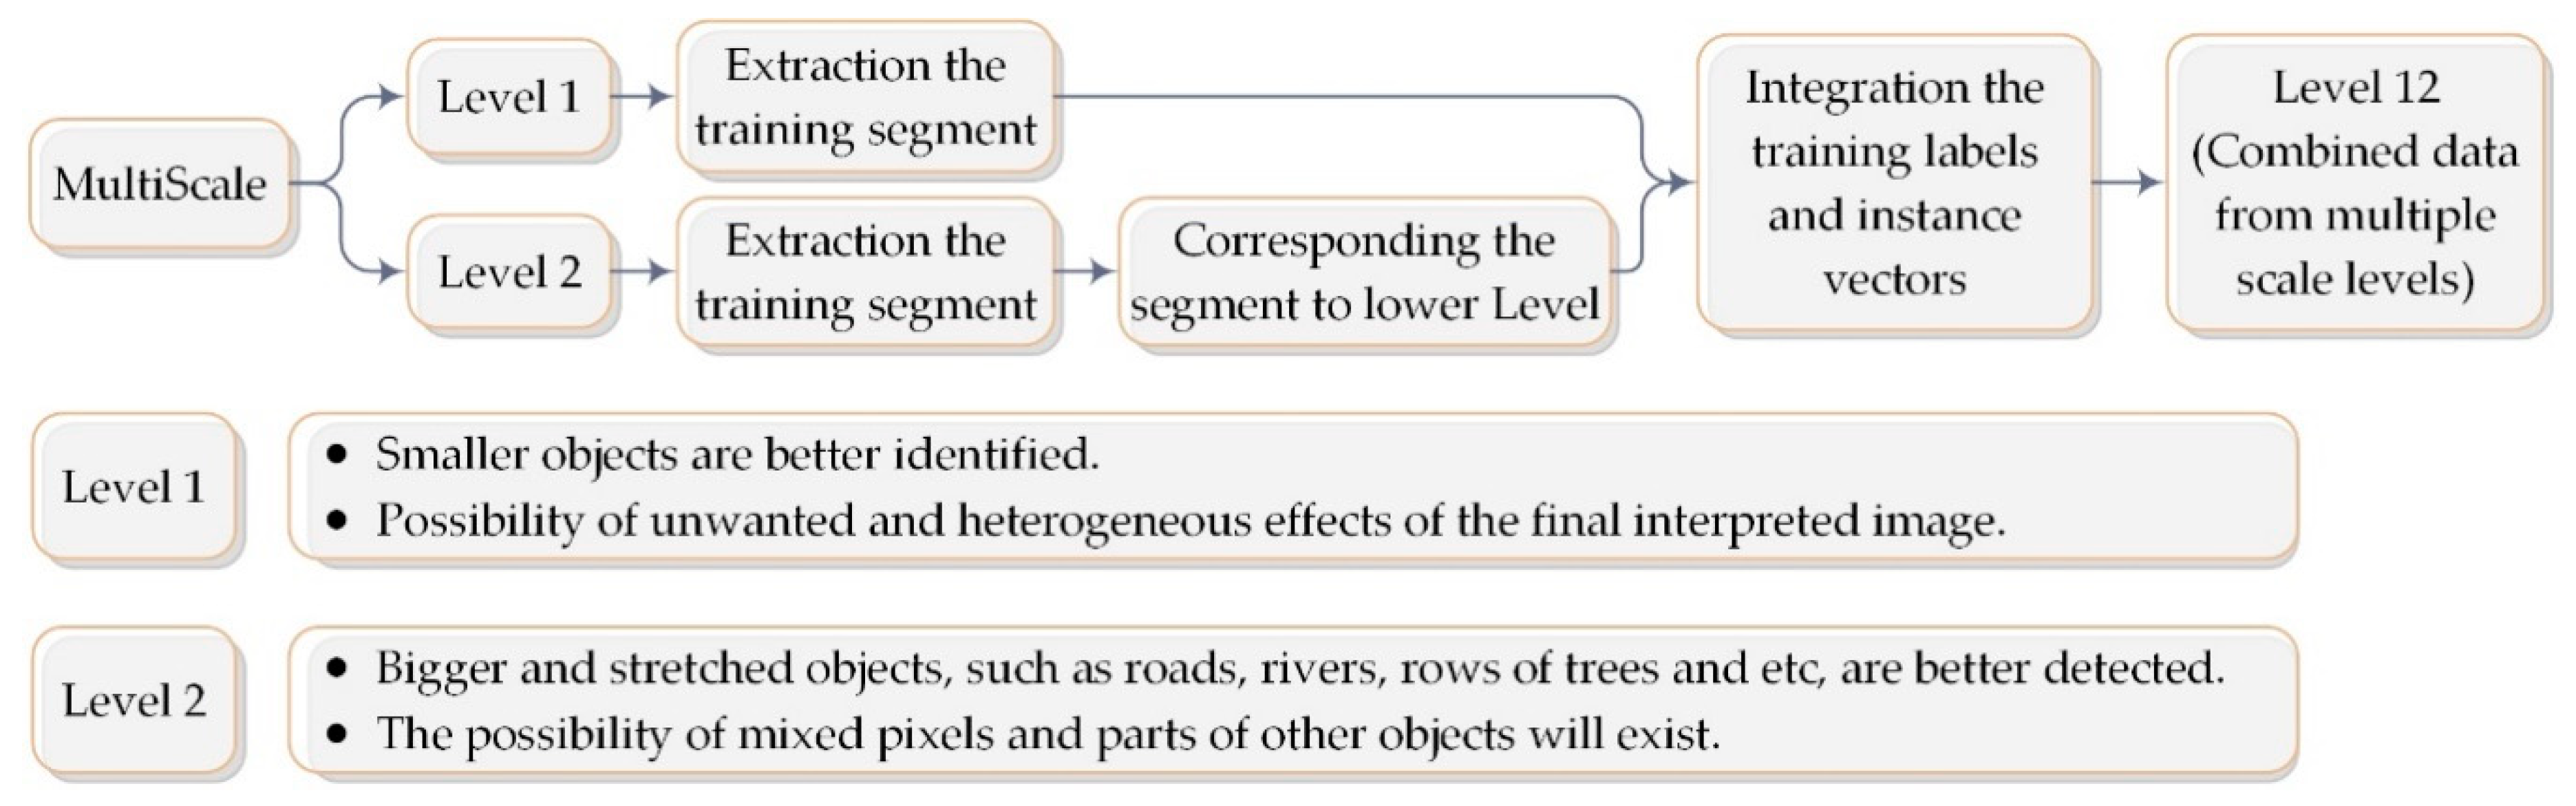
In previous tests, the proposed method and all comparative methods used the same training data and similar features (
Section 3.1). In order to evaluate the efficiency of the proposed method in different feature spaces, one of the most widely used methods was also used to produce useful features. The results from the classification of images with GLCM (Gray-Level Co-occurrence Matrix) features are presented in
Table 5 and
Table 6. For this purpose, eight textual features (Contrast, Correlation, Dissimilarity, Entropy, Homogeneity, Mean, Second Moment, and Variance) of each image band and DSM, by the kernel dimensions of 3 × 3, 5 × 5 and 7 × 7, and in four directions (each 45 degrees) were extracted (384 feature bands). Then, it was averaged from different directions, so that the directional effect was eliminated in the production feature (96 feature bands). The original image and the nDSM were also used. Then, the classification was done by all available features (100 feature bands). For this, test images III and IV were considered as the lowest and highest difference in scores (
Table 1).
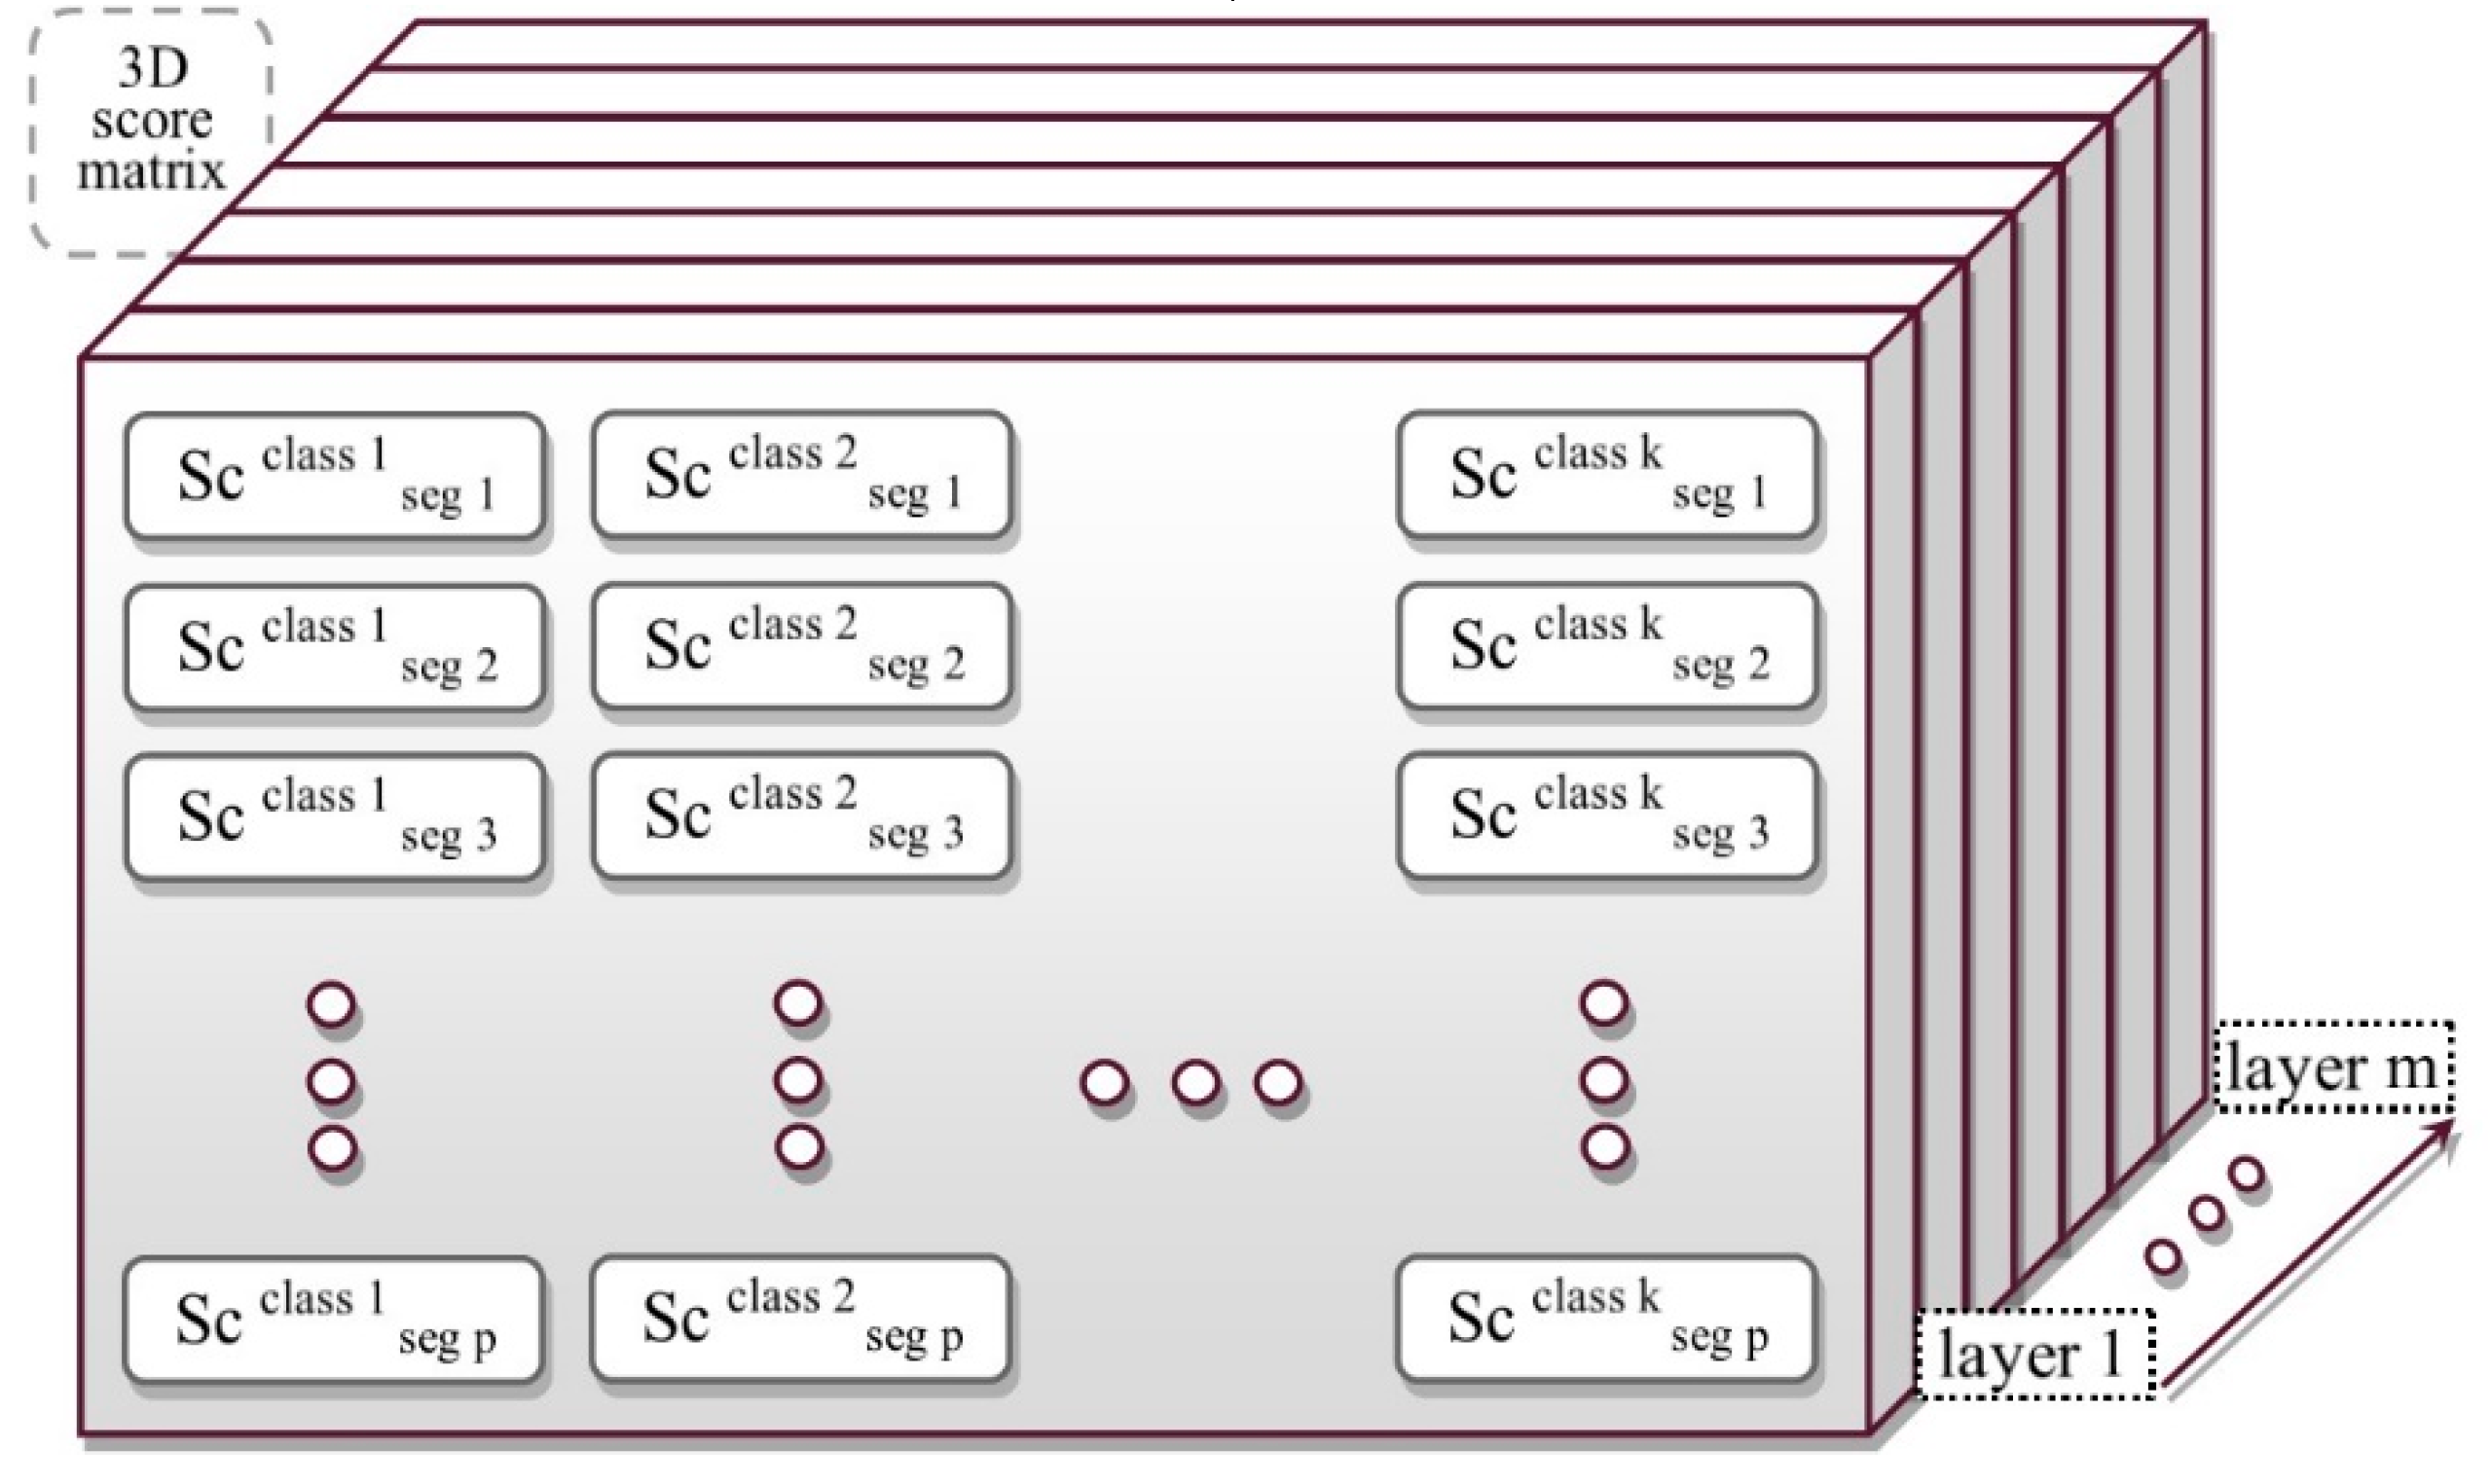
In
Table 5, two topics were examined. First, the effectiveness of the weights that were obtained by the automatic method in the proposed process (without multi-layers column) was checked. In doing so, after calculating the weights in the presented process (
Section 2.4), they were applied to the scores (the same as in the proposed method but without the layered structure). Secondly, by evaluating the effectiveness of the multi-level process (without a multi-level column), the results of the internal evaluation of the proposed method were studied. In the analysis and comparison of various methods, any differences in results are not significant. Therefore, statistical tests are used to study the significance of the differences mentioned in the results (Mc Test row). According to the results, there was no dependency between the outputs of the mentioned methods and the proposed method. For more investigation, the process was repeated with competition methods and the results are listed for test image III (the image with the lowest improvement among all test images) in
Table 6.


