Spatial and Temporal Evolution of the Infiltration Characteristics of a Loess Landslide

 ,
,
Abstract
:1. Introduction
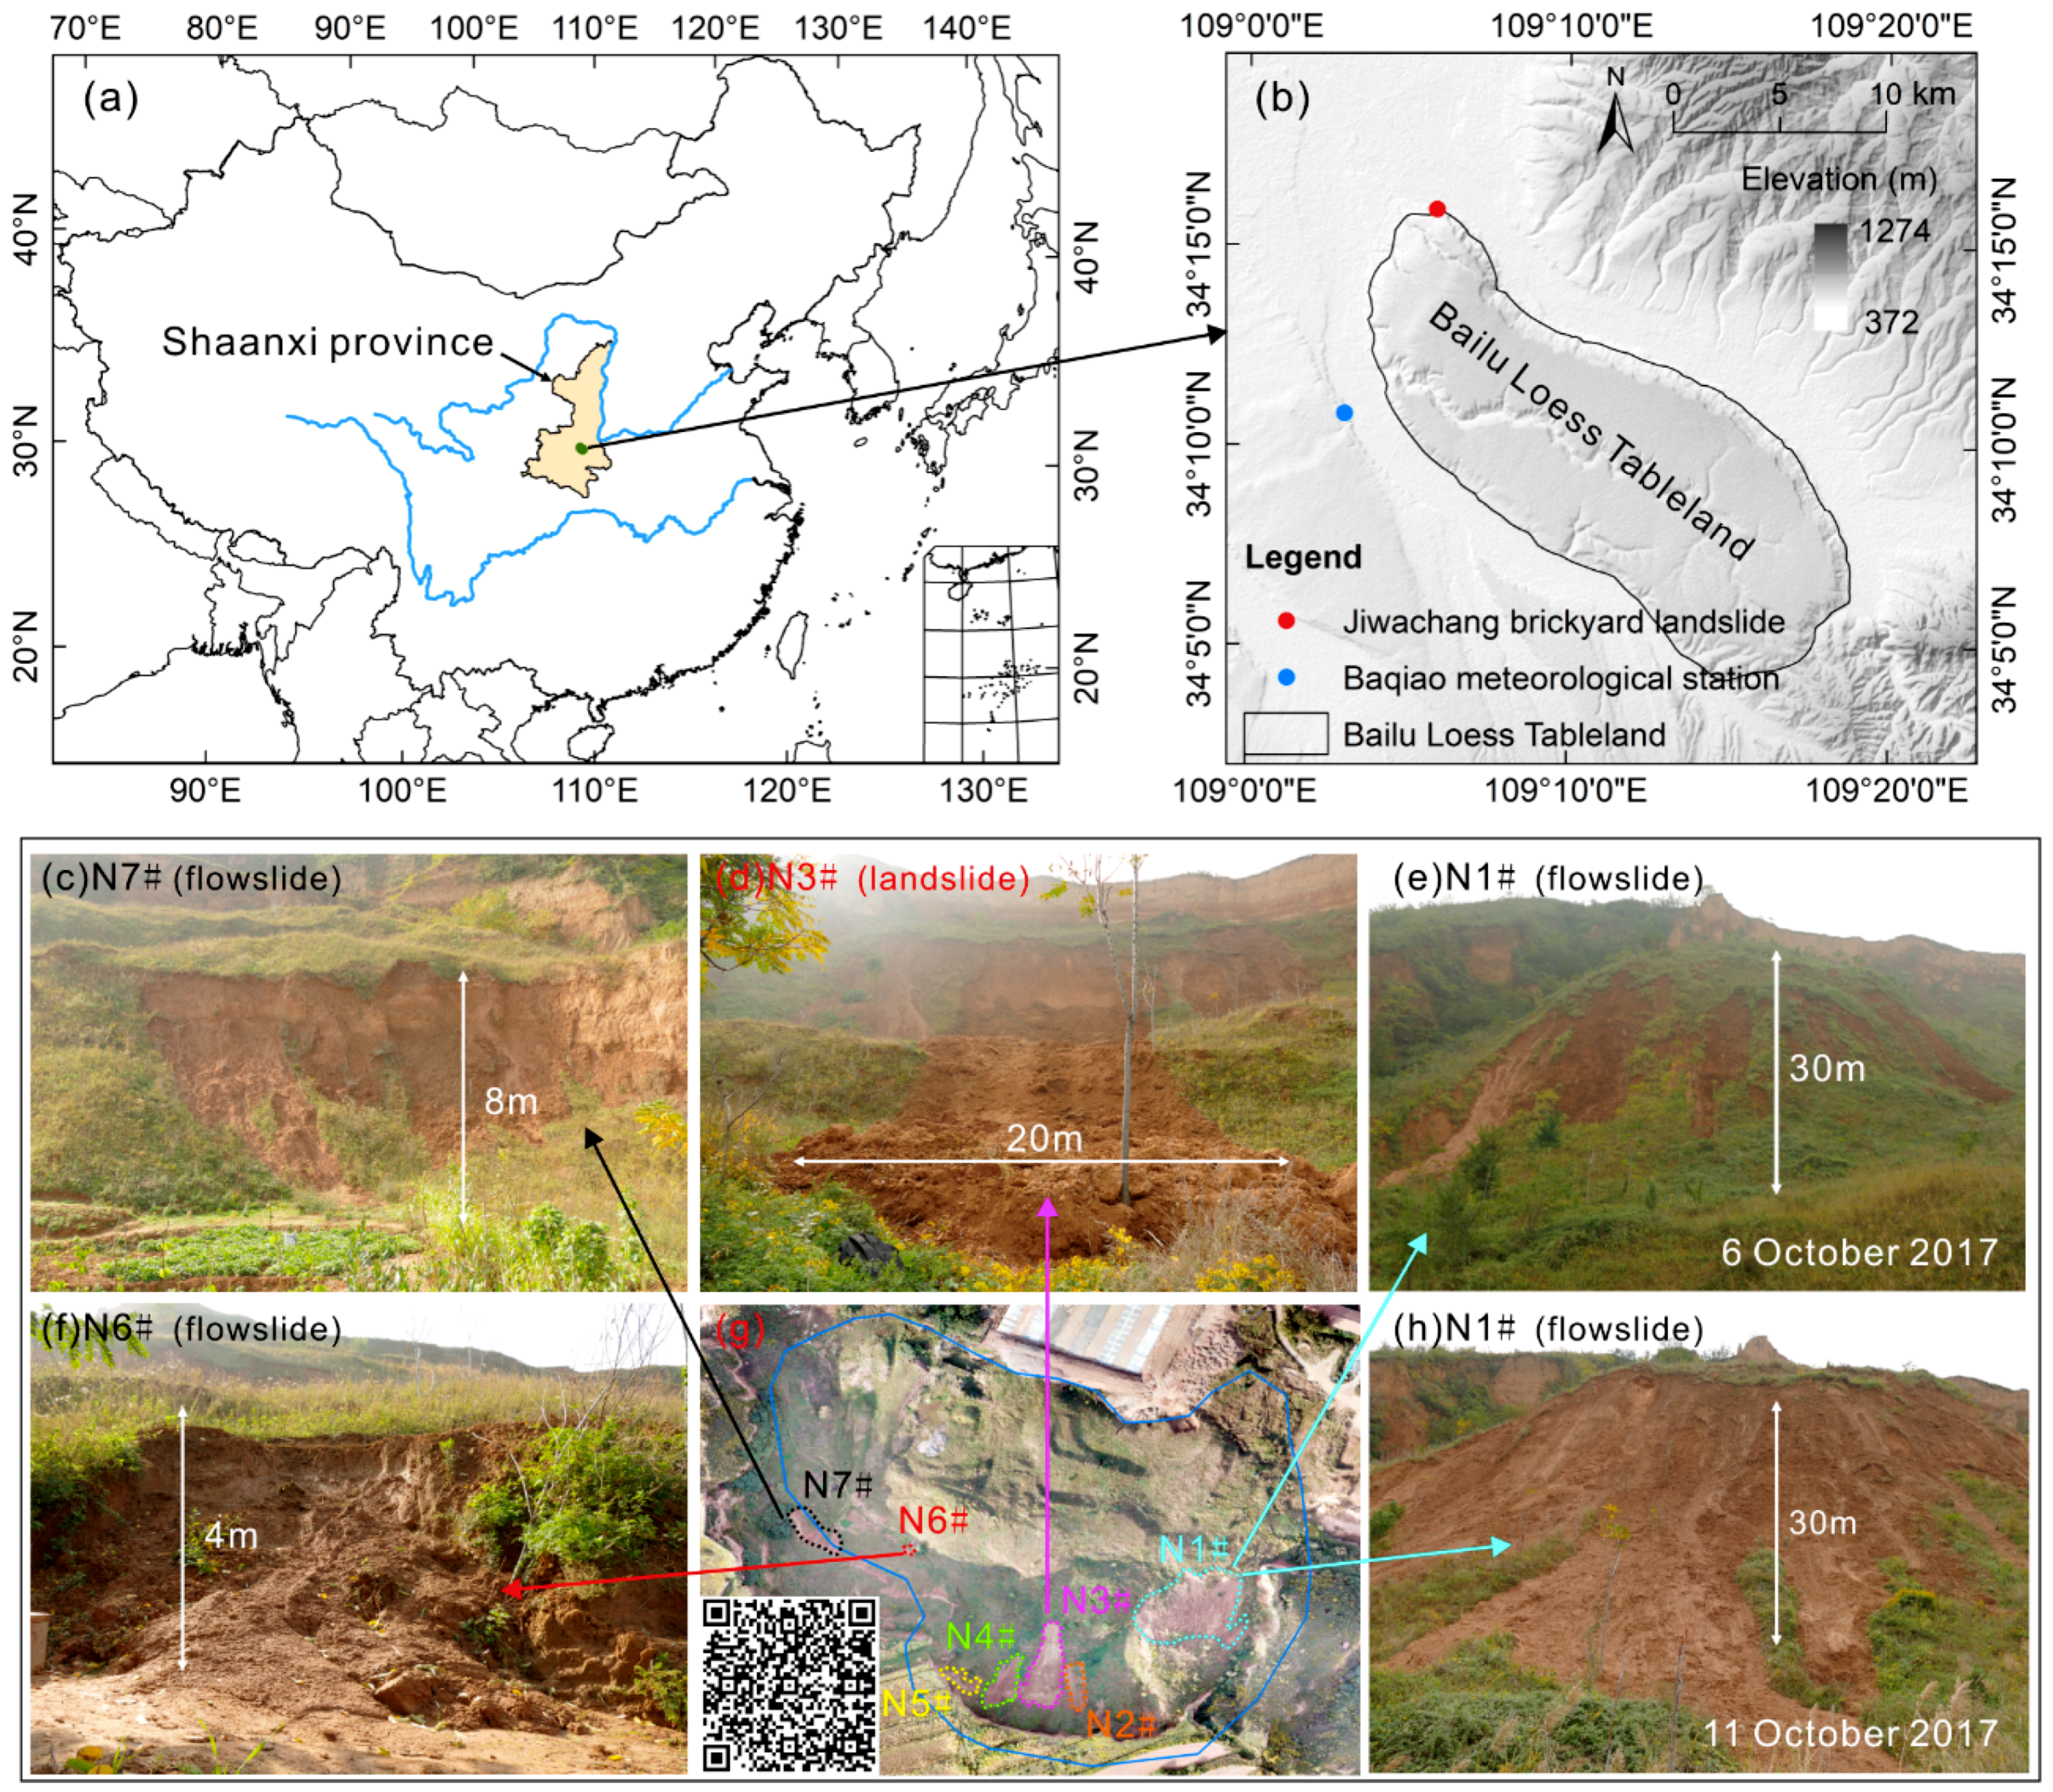
2. Study Area
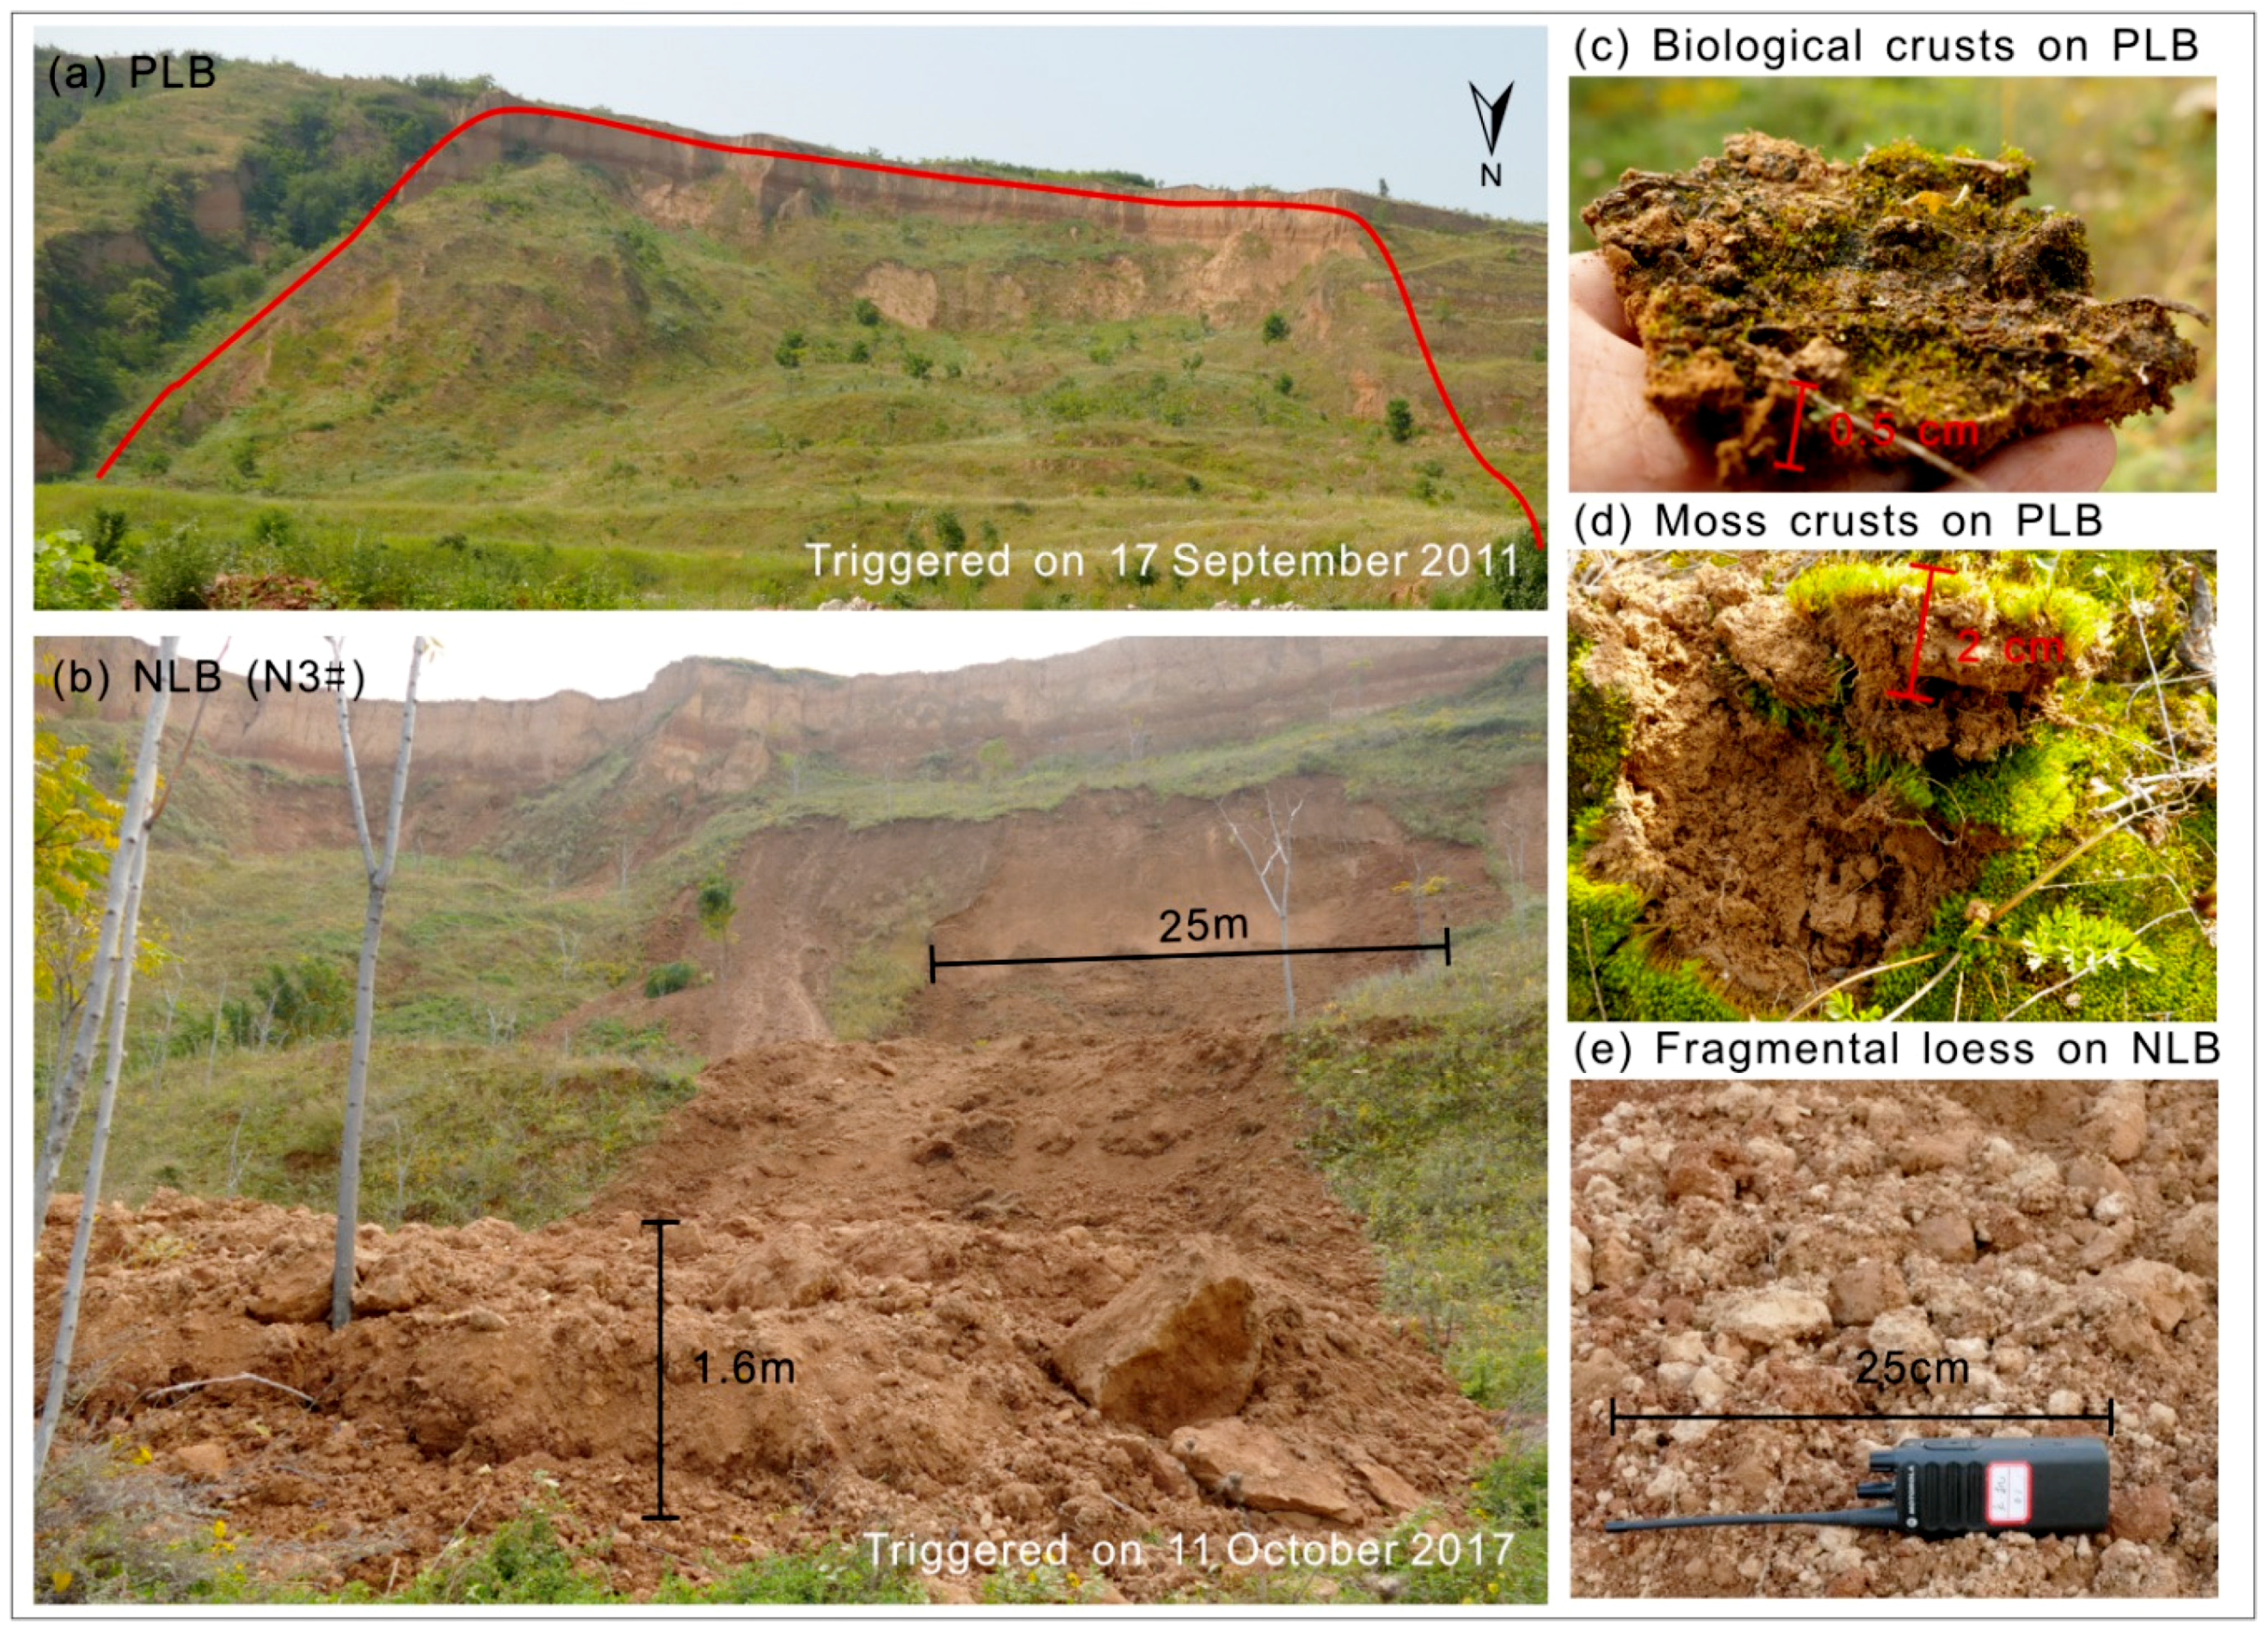
3. Field Investigation
4. Materials and Methods
4.1. In Situ Infiltration Rate and the Physical Index Measurement
4.2. Experimental Design
4.3. Statistical Analysis
5. Results
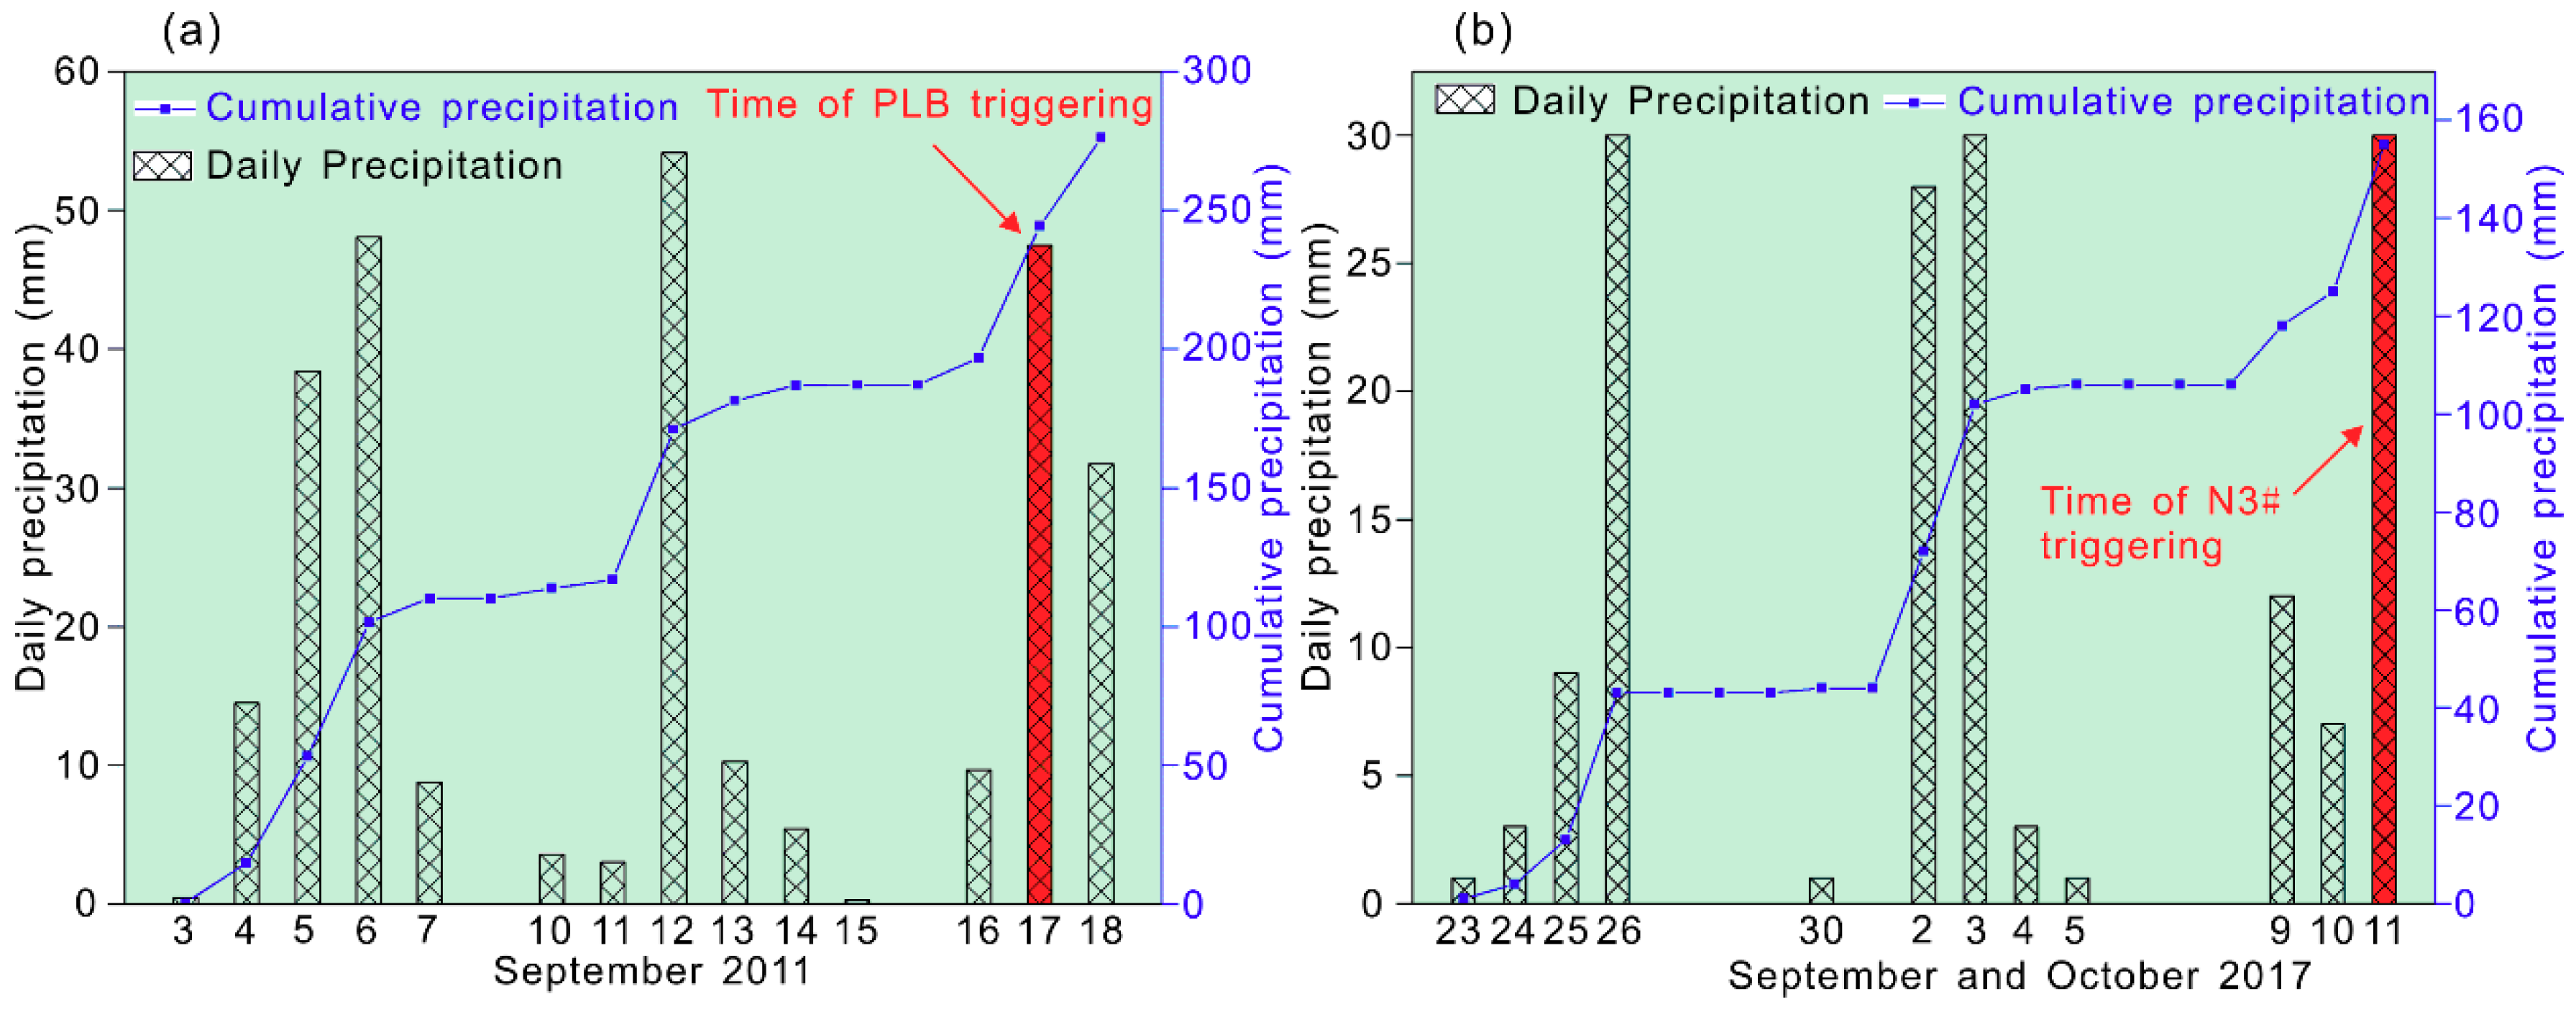
5.1. Occurrence of Landslides and Flowslides Associated with Precipitation
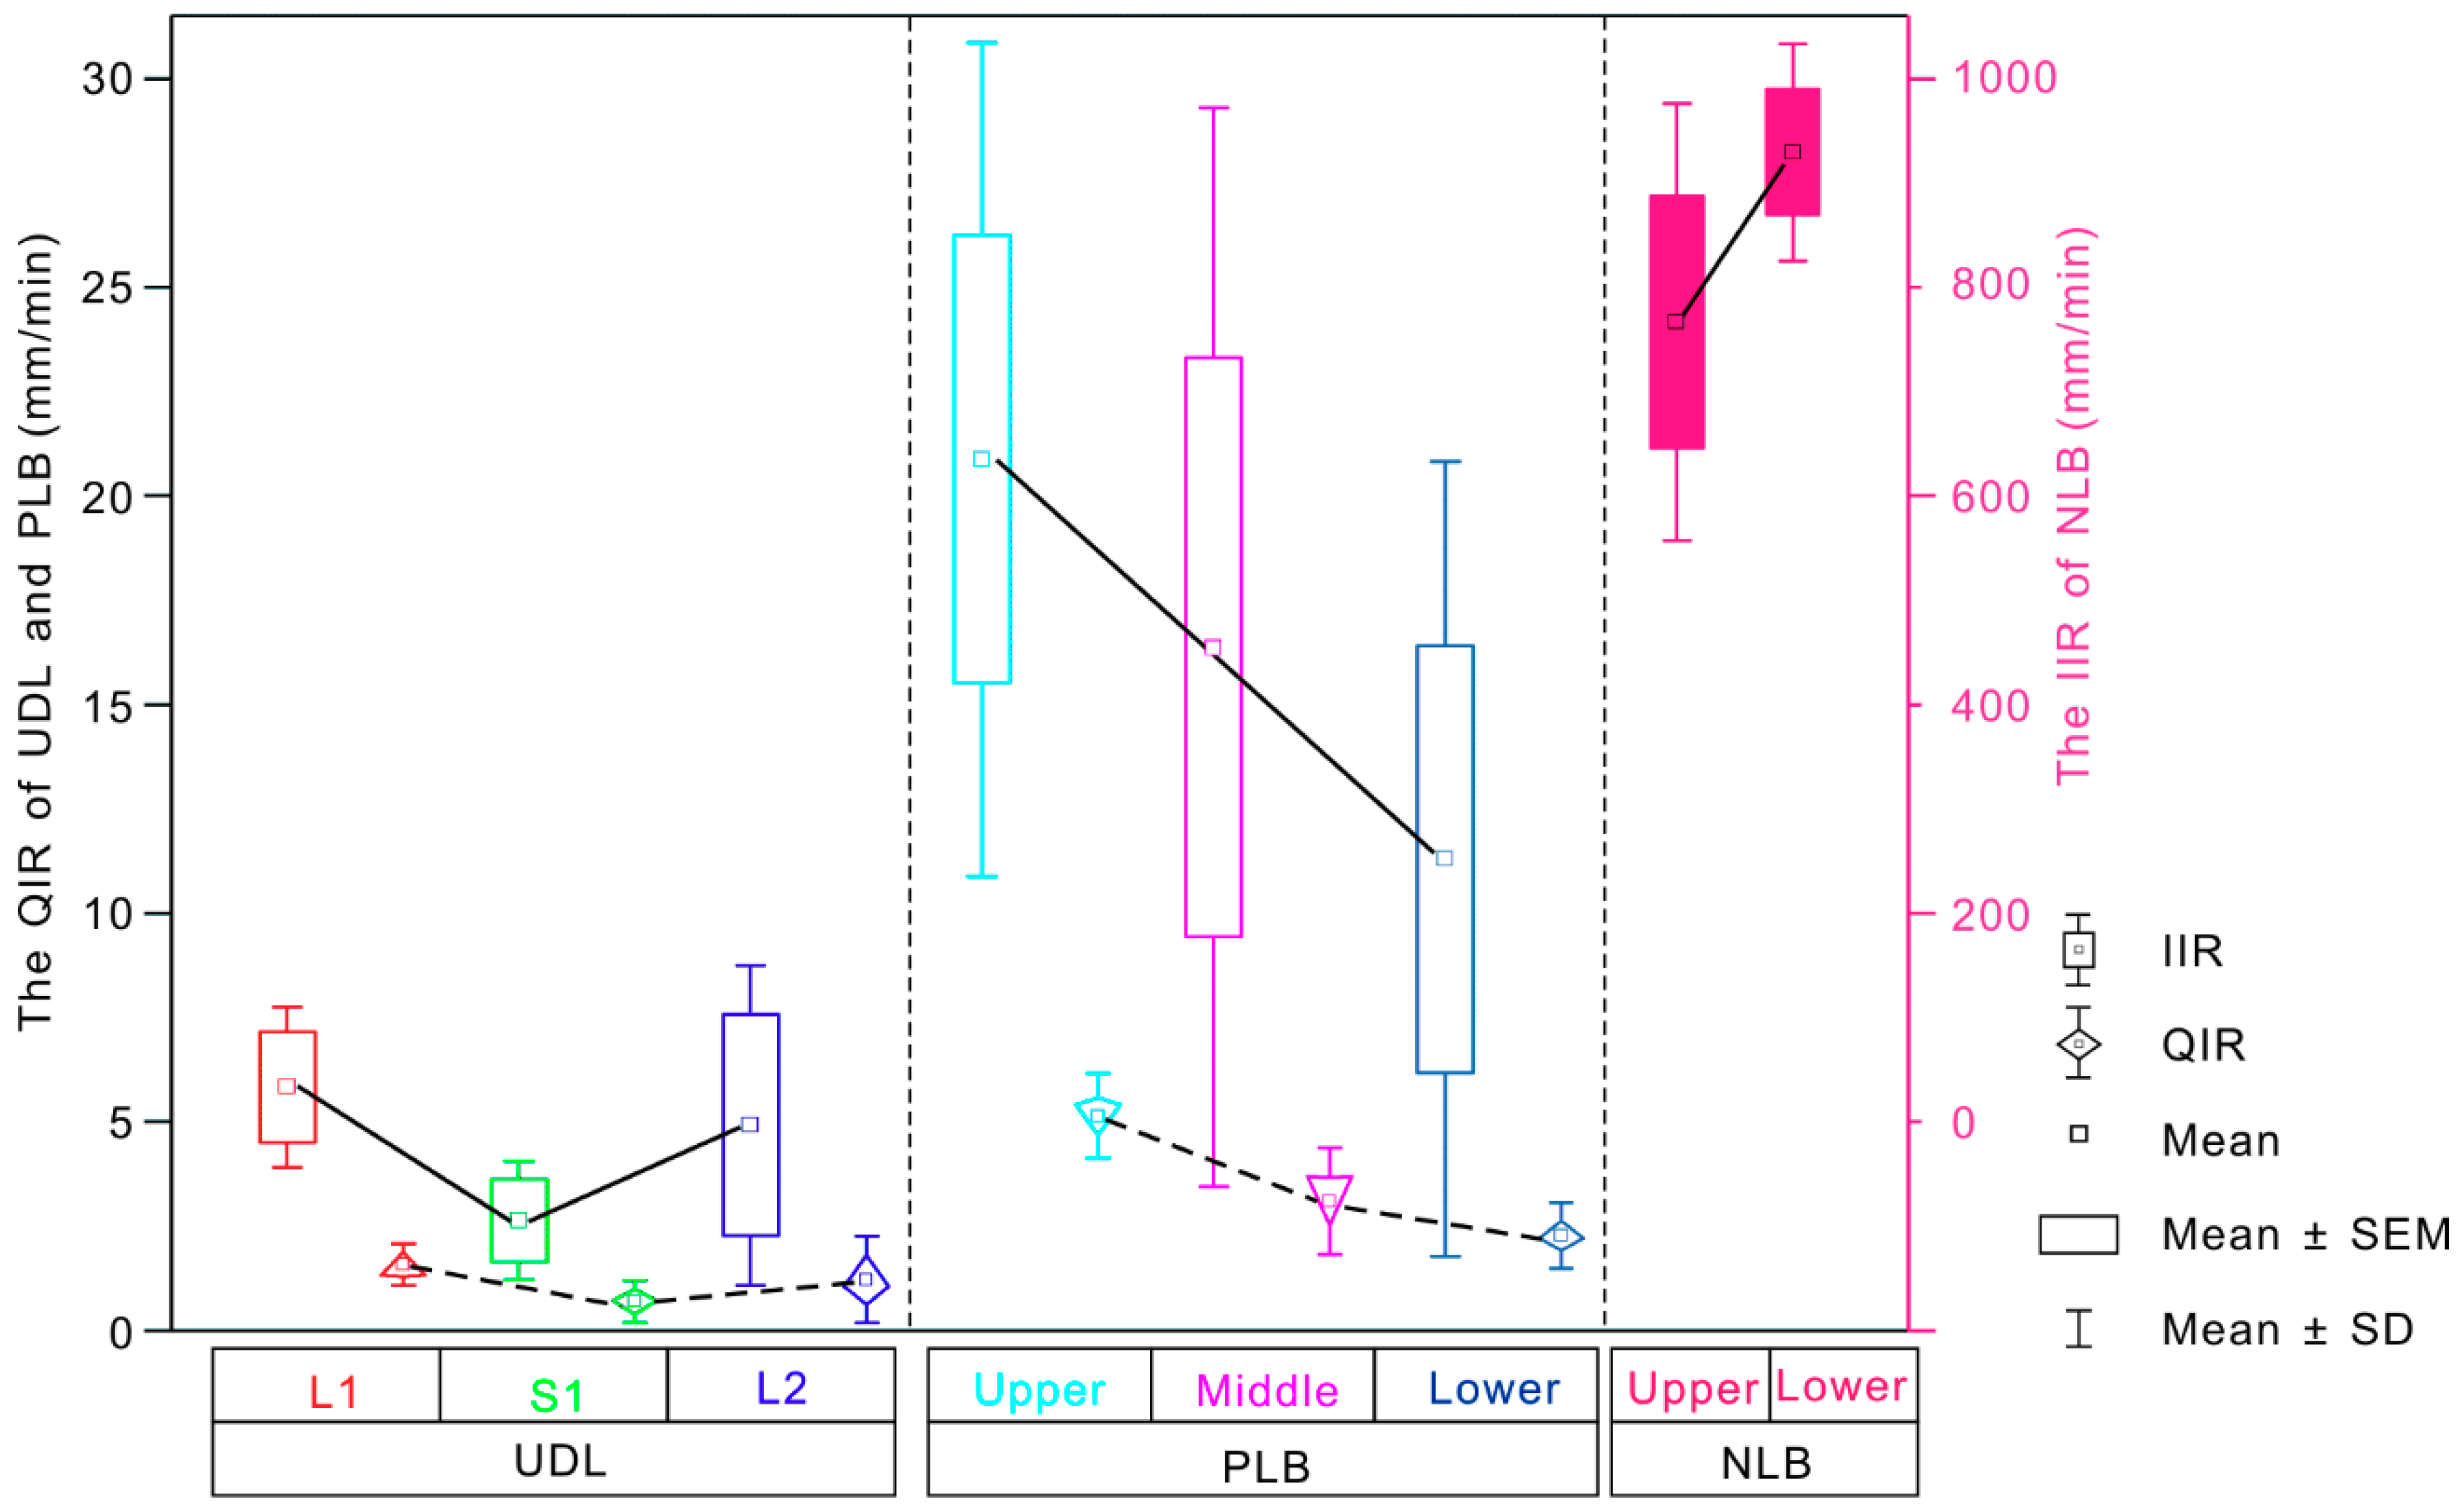
5.2. The Spatial Differences in Infiltration Characteristics across Sites
5.3. Physical Parameter Differences across Sites
5.4. Temporal Evolution of the Infiltration Rate in the Recent Landslide
6. Discussion
6.1. The Reason for Spatial Differences in the Infiltration Rate
6.2. Role and Function of Physical Crusts in the Infiltration Rate in a Recent Landslide
6.3. Role and Function of Biological Crusts and Moss Crusts on a Landslide Body
6.4. The Temporal Evolution of the Infiltration Rate in a Recent Landslide
7. Conclusions
Author Contributions
Funding
Acknowledgments
Conflicts of Interest
References
- Tu, X.B.; Kwong, A.K.L.; Dai, F.C.; Tham, L.G.; Min, H. Field monitoring of rainfall infiltration in a loess slope and analysis of failure mechanism of rainfall-induced landslides. Eng. Geol. 2009, 105, 134–150. [Google Scholar] [CrossRef]
- Kong, Y.; Ruan, H.N.; Huang, X.F. Field testing of earth pressures in a large-scale natural loess slope. KSCE J. Civ. Eng. 2017, 22, 1–8. [Google Scholar] [CrossRef]
- Liu, T.S. Loess and Environment; China Ocean Press: Beijing, China, 1985. [Google Scholar]
- Ryashchenko, T.G.; Akulova, V.V.; Erbaeva, M.A. Loessial soils of Priangaria, Transbaikalia, Mongolia, and northwestern China. Quat. Int. 2008, 179, 90–95. [Google Scholar] [CrossRef]
- Wang, J.J.; Liang, Y.; Zhang, H.P.; Wu, Y.; Lin, X. A loess landslide induced by excavation and rainfall. Landslides 2014, 11, 141–152. [Google Scholar] [CrossRef]
- Qiu, H.J.; Cui, P.; Regmi, A.D.; Wang, Y.; Hu, S. Slope height and slope gradient controls on the loess slide size within different slip surfaces. Phys. Geogr. 2017, 38, 303–317. [Google Scholar] [CrossRef]
- Zhuang, J.Q.; Peng, J.B. A coupled slope cutting-a prolonged rainfall-induced loess landslide: A 17 October 2011 case study. Bull. Eng. Geol. Environ. 2014, 73, 997–1011. [Google Scholar] [CrossRef]
- Xu, X.Z.; Guo, W.Z.; Liu, Y.K.; Ma, J.Z.; Wang, W.L.; Zhang, H.W.; Gao, H. Landslides on the Loess Plateau of China: A latest statistics together with a close look. Nat. Hazards 2017, 86, 1393–1403. [Google Scholar] [CrossRef]
- Zhang, X.; Li, P.; Li, Z.B.; Yu, G. Characteristics and formation mechanism of the July 25, 2013, Tianshui group-occurring geohazards. Environ. Earth Sci. 2017, 76, 219. [Google Scholar] [CrossRef]
- Qiu, H.J.; Cui, P.; Regmi, A.D. Landslide distribution and size versus relative relief (Shaanxi Province, China). Bull. Eng. Geol. Environ. 2018, 77, 1331–1342. [Google Scholar] [CrossRef]
- Zhang, F.; Wang, G. Effect of irrigation-induced densification on the post-failure behavior of loess flowslides occurring on the Heifangtai area, Gansu, China. Eng. Geol. 2018, 236, 111–118. [Google Scholar] [CrossRef]
- Qiu, H.J.; Cui, P.; Hu, S. Size distribution and size of loess slides in response to slope height and slope gradient based on field survey data. Geomat. Nat. Hazards Risk. 2019, 10, 1443–1458. [Google Scholar] [CrossRef] [Green Version]
- Lowery, B.; Hickey, W.J.; Arshad, M.A.; Lal, R. Soil Water Parameters and Soil Quality. In Methods for Assessing Soil Quality; Doran, J.W., Jones, A.J., Eds.; Segoe Rd: Madison, WI, USA, 1996; pp. 143–155. [Google Scholar]
- Xu, L.; Qiao, X.; Wu, C.; Iqbal, J.; Dai, F. Causes of landslide recurrence in a loess platform with respect to hydrological processes. Nat. Hazards 2012, 64, 1657–1670. [Google Scholar] [CrossRef]
- Zhou, Y.F.; Tham, L.G.; Yan, W.M.; Dai, F.C.; Xu, L. Laboratory study on soil behavior in loess slope subjected to infiltration. Eng. Geol. 2014, 183, 31–38. [Google Scholar] [CrossRef]
- Leng, Y.; Peng, J.; Wang, Q.; Meng, Z.; Huang, W. A fluidized landslide occurred in the Loess Plateau: A study on loess landslide in South Jingyang tableland. Eng. Geol. 2017, 236, 129–136. [Google Scholar] [CrossRef]
- Cogan, J.; Gratchev, I.; Wang, G. Rainfall-induced shallow landslides caused by ex-Tropical Cyclone Debbie, 31 March 2017. Landslides 2018, 15, 1215–1221. [Google Scholar] [CrossRef]
- Derbyshire, E. Geological hazards in loess terrain, with particular reference to the loess regions of China. Earth-Sci. Rev. 2001, 54, 231–260. [Google Scholar] [CrossRef]
- Qiu, H.J.; Regmi, A.D.; Cui, P. Size distribution of loess slides in relation to local slope height within different slope morphologies. Catena 2016, 145, 155–163. [Google Scholar] [CrossRef]
- Qiu, H.J.; Cui, P.; Regmi, A.D. Influence of topography and volume on mobility of loess slides within different slip surfaces. Catena 2017, 157, 180–188. [Google Scholar] [CrossRef]
- Zhang, F.; Huang, X. Trend and spatiotemporal distribution of fatal landslides triggered by non-seismic effects in China. Landslides 2018, 15, 1663–1674. [Google Scholar] [CrossRef]
- Bresson, L.M.; Valentin, C. Soil Surface Crust Formation: Contribution of Micromorphology. In Developments in Soil Science 22, Soil Micromorphology: Studies in Management and Genesis; Ringrose-Voase, A.J., Humphreys, G.S., Eds.; Elsevier: Amsterdam, The Netherlands, 1994; pp. 737–762. [Google Scholar]
- Casanova, M.; Messing, I.; Joel, A. Influence of aspect and slope gradient on hydraulic conductivity measured by tension infiltrometer. Hydrol. Process. 2000, 14, 155–164. [Google Scholar] [CrossRef]
- Hu, W.; Shao, M.; Wang, Q.; Fan, J.; Horton, R. Temporal changes of soil hydraulic properties under different land uses. Geoderma 2009, 149, 355–366. [Google Scholar] [CrossRef]
- Zhao, J.; Ma, Y.; Cao, J.; Wei, J.; Shao, T. Effect of Quaternary climatic change on modern hydrological systems in the southern Chinese Loess Plateau. Environ. Earth Sci. 2015, 73, 1161–1167. [Google Scholar] [CrossRef]
- Van Asch, T.W.; Buma, J.; Van Beek, L.P.H. A view on some hydrological triggering systems in landslides. Geomorphology 1999, 30, 25–32. [Google Scholar] [CrossRef]
- Wang, G.; Sassa, K. Pore-pressure generation and movement of rainfall-induced landslides: Effects of grain size and fine-particle content. Eng. Geol. 2003, 69, 109–125. [Google Scholar] [CrossRef]
- Zaady, E.; Gutterman, Y.; Boeken, B. The germination of mucilaginous seeds of t Plantago coronopus, Reboudia pinnata, and t Carrichtera annua on cyanobacterial soil crust from the Negev Desert. Plant Soil 1997, 190, 247–252. [Google Scholar] [CrossRef]
- Eldridge, D.J.; Zaady, E.; Shachak, M. Infiltration through three contrasting biological soil crusts in patterned landscapes in the Negev, Israel. Catena 2000, 40, 323–336. [Google Scholar] [CrossRef]
- Qiu, H.J.; Cui, P.; Regmi, A.D. The effects of slope length and slope gradient on the size distributions of loess slides: Field observations and simulations. Geomorphology 2018, 300, 69–76. [Google Scholar] [CrossRef]
- Zhao, J.B.; Tian, J.S.; Jun, J.N. Permeability and water-bearing conditions of loess in Bailu tableland in the eastern suburbs of Xi’an. Geogr. Res. 2009, 28, 1188–1196. [Google Scholar]
- Cheng, Q.; Chen, X.; Chen, X.; Zhang, Z.; Ling, M. Water infiltration underneath single-ring permeameters and hydraulic conductivity determination. J. Hydrol. 2011, 398, 135–143. [Google Scholar] [CrossRef]
- Bagarello, V.; Prima, S.D.; Iovino, M.; Provenzano, G. Estimating field-saturated soil hydraulic conductivity by a simplified beerkan infiltration experiment. Hydrol. Process. 2014, 28, 1095–1103. [Google Scholar] [CrossRef]
- Hu, G.T.; Yang, W.Y. Engineering Geology; Geology Press: Beijing, China, 1987; pp. 26–30. [Google Scholar]
- Belnap, J. The potential roles of biological soil crusts in dryland hydrologic cycles. Hydrol. Process. 2006, 20, 3159–3178. [Google Scholar] [CrossRef]
- Saxton, K.E.; Rawls, W.J. Soil water characteristic estimates by texture and organic matter for hydrologic solutions. Soil Sci. Soc. Am. J. 2006, 70, 1569–1578. [Google Scholar] [CrossRef] [Green Version]
- Strudley, M.W.; Green, T.R.; Ascough, J.C. Tillage effects on soil hydraulic properties in space and time: State of the science. Soil Tillage Res. 2008, 99, 4–48. [Google Scholar] [CrossRef]
- Mueller, L.; Kay, B.D.; Deen, B.; Hu, C.; Zhang, Y.; Wolff, M.; Schindler, U. Visual assessment of soil structure: Part II. Implications of tillage, rotation and traffic on sites in Canada, China and Germany. Soil Tillage Res. 2009, 103, 188–196. [Google Scholar] [CrossRef]
- Celik, I. Land-use effects on organic matter and physical properties of soil in a southern Mediterranean highland of Turkey. Soil Tillage Res. 2005, 83, 270–277. [Google Scholar] [CrossRef]
- Badorreck, A.; Gerke, H.H.; Hüttl, R.F. Morphology of physical soil crusts and infiltration patterns in an artificial catchment. Soil Tillage Res. 2013, 129, 1–8. [Google Scholar] [CrossRef]
- Błońska, E.; Lasota, J.; Zwydak, M.; Klamerus-Iwan, A.; Gołąb, J. Restoration of forest soil and vegetation 15 years after landslides in a lower zone of mountains in temperate climates. Ecol. Eng. 2016, 97, 503–515. [Google Scholar] [CrossRef]
- Langhans, T.M.; Storm, C.; Schwabe, A. Regeneration processes of biological soil crusts, macro-cryptogams and vascular plant species after fine-scale disturbance in a temperate region: Recolonization or successional replacement? Flora 2010, 205, 46–60. [Google Scholar] [CrossRef]
- Wang, H.; Zhang, G.H.; Liu, F.; Geng, R.; Wang, L.J. Temporal variations in infiltration properties of biological crusts covered soils on the Loess Plateau of China. Catena 2017, 159, 115–125. [Google Scholar] [CrossRef]
- Han, Y.; Fan, Y.; Xin, Z.; Wang, L.; Cai, Q.; Wang, X. Effects of wetting rate and simulated rain duration on soil crust formation of red loam. Environ. Earth Sci. 2016, 75, 149. [Google Scholar] [CrossRef]
- Vaezi, A.R.; Ahmadi, M.; Cerdà, A. Contribution of raindrop impact to the change of soil physical properties and water erosion under semi-arid rainfalls. Sci. Total Environ. 2017, 583, 382–392. [Google Scholar] [CrossRef] [PubMed]
- Lu, J.; Zheng, F.; Li, G.; Bian, F.; An, J. The effects of raindrop impact and runoff detachment on hillslope soil erosion and soil aggregate loss in the Mollisol region of Northeast China. Soil Tillage Res. 2016, 161, 79–85. [Google Scholar] [CrossRef]
- Belnap, J.; Lange, O.L. Biological Soil Crusts; Structure, Function, and Management; Springer: Berlin, Germany, 2001; p. 503. [Google Scholar]
- Nejidat, A.; Potrafka, R.M.; Zaady, E. Successional biocrust stages on dead shrub soil mounds after severe drought: Effect of micro-geomorphology on microbial community structure and ecosystem recovery. Soil Biol. Biochem. 2016, 103, 213–220. [Google Scholar] [CrossRef]
- Warren, S.D. Synopsis: Influence of Biological Soil Crusts on Arid Land Hydrology and Soil Stability. In Biological Soil Crusts: Structure, Function, and Management; Springer: Berlin/Heidelberg, Germany, 2001; pp. 349–360. [Google Scholar]
- Luo, H.; Wu, F.; Chang, J.; Xu, J. Microstructural constraints on geotechnical properties of Malan Loess: A case study from Zhaojiaan landslide in Shaanxi province, China. Eng. Geol. 2018, 236, 60–69. [Google Scholar] [CrossRef]
- Bo, X.; Wang, Q.H.; Zhao, Y.G.; Shao, M.A. Artificial culture of biological soil crusts and its effects on overland flow and infiltration under simulated rainfall. Appl. Soil Ecol. 2011, 48, 11–17. [Google Scholar]
- Qiu, H.J.; Cui, Y.F.; Pei, Y.Q.; Yang, D.D.; Hu, S.; Wang, X.G.; Ma, S.Y. Temporal patterns of nonseismically triggered landslides in Shaanxi Province, China. Catena 2019. [Google Scholar] [CrossRef]
- Zaady, E.; Groffman, P.; Shachak, M. Nitrogen fixation in macro-and microphytic patches in the Negev desert. Soil Biol. Biochem. 1998, 30, 449–454. [Google Scholar] [CrossRef]
- Stokes, A.; Sotir, R.; Chen, W.; Ghestem, M. Soil bio-and eco-engineering in China: Past experience and future priorities. Ecol. Eng. 2010, 36, 247–257. [Google Scholar] [CrossRef]


| Type | Name | Relative Height Difference (m) | Length (m) | Distance (m) | Average Thickness (m) | Area (m2) | Estimated Volume (m3) | Triggered Date |
|---|---|---|---|---|---|---|---|---|
| Landslide | PLB | 114 | 339 | 315 | 8 | 100,900 | 599,000 | 11 September 2011 |
| Flowslide | N1# | 30 | 50 | 80 | 0.5 | 4000 | – | 11 October 2017 |
| Landslide | N2# | 8 | 15 | 8 | 0.5 | 120 | 60 | 4–11 October 2017 |
| Landslide | N3# (NLB) | 12 | 70 | 15–25 | 0.8 | 1400 | 840–1400 | 11 October 2017 |
| Landslide | N4# | 9 | 22 | 12 | 0.6 | 270 | 162 | 4–11 October 2017 |
| Flowslide | N5# | 3 | 5 | 7 | 0.5 | 40 | – | 4–11 October 2017 |
| Flowslide | N6# | 4 | 8 | 8 | 1 | 70 | – | 4–11 October 2017 |
| Flowslide | N7# | 8 | 10 | 20 | 0.3 | 200 | – | 4–11 October 2017 |
| Without Crust (mm/min) | Crusted (mm/min) | Scalped (mm/min) | ||||
|---|---|---|---|---|---|---|
| Mean | SEM | Mean | SEM | Mean | SEM | |
| 26 October 2017 | 855.4 | 89.4 | — | — | — | — |
| 14 March 2018 | — | — | 11.6 a | 1.7 | 51.3 b | 7.9 |
| 17 July 2018 | — | — | 10.9 a | 0.7 | 29.7 c | 8.2 |
| Physical Crust Thickness (mm) | Bulk Density (g/cm3) | Porosity (%) | Height of Grass (cm) | |
|---|---|---|---|---|
| 26 October 2017 | No crust | 0.8–1.2 | 57.1–69.8 | No grass |
| 14 March 2018 | 0.5–1.5 | 0.9–1.2 | 55.4–64.2 | 5–10 |
| 17 July 2018 | 1–2 | 1.0–1.3 | 45.5–57.2 | 50–120 |
© 2020 by the authors. Licensee MDPI, Basel, Switzerland. This article is an open access article distributed under the terms and conditions of the Creative Commons Attribution (CC BY) license (http://creativecommons.org/licenses/by/4.0/).
Share and Cite
Yang, D.; Qiu, H.; Pei, Y.; Hu, S.; Ma, S.; Liu, Z.; Zhang, Y.; Cao, M. Spatial and Temporal Evolution of the Infiltration Characteristics of a Loess Landslide. ISPRS Int. J. Geo-Inf. 2020, 9, 26. https://0-doi-org.brum.beds.ac.uk/10.3390/ijgi9010026
Yang D, Qiu H, Pei Y, Hu S, Ma S, Liu Z, Zhang Y, Cao M. Spatial and Temporal Evolution of the Infiltration Characteristics of a Loess Landslide. ISPRS International Journal of Geo-Information. 2020; 9(1):26. https://0-doi-org.brum.beds.ac.uk/10.3390/ijgi9010026
Chicago/Turabian StyleYang, Dongdong, Haijun Qiu, Yanqian Pei, Sheng Hu, Shuyue Ma, Zijing Liu, Yan Zhang, and Mingming Cao. 2020. "Spatial and Temporal Evolution of the Infiltration Characteristics of a Loess Landslide" ISPRS International Journal of Geo-Information 9, no. 1: 26. https://0-doi-org.brum.beds.ac.uk/10.3390/ijgi9010026