Spatiotemporal Analysis of Tourists and Residents in Shanghai Based on Location-Based Social Network’s Data from Weibo


Abstract
:
1. Introduction
2. Related Work
3. Research Design
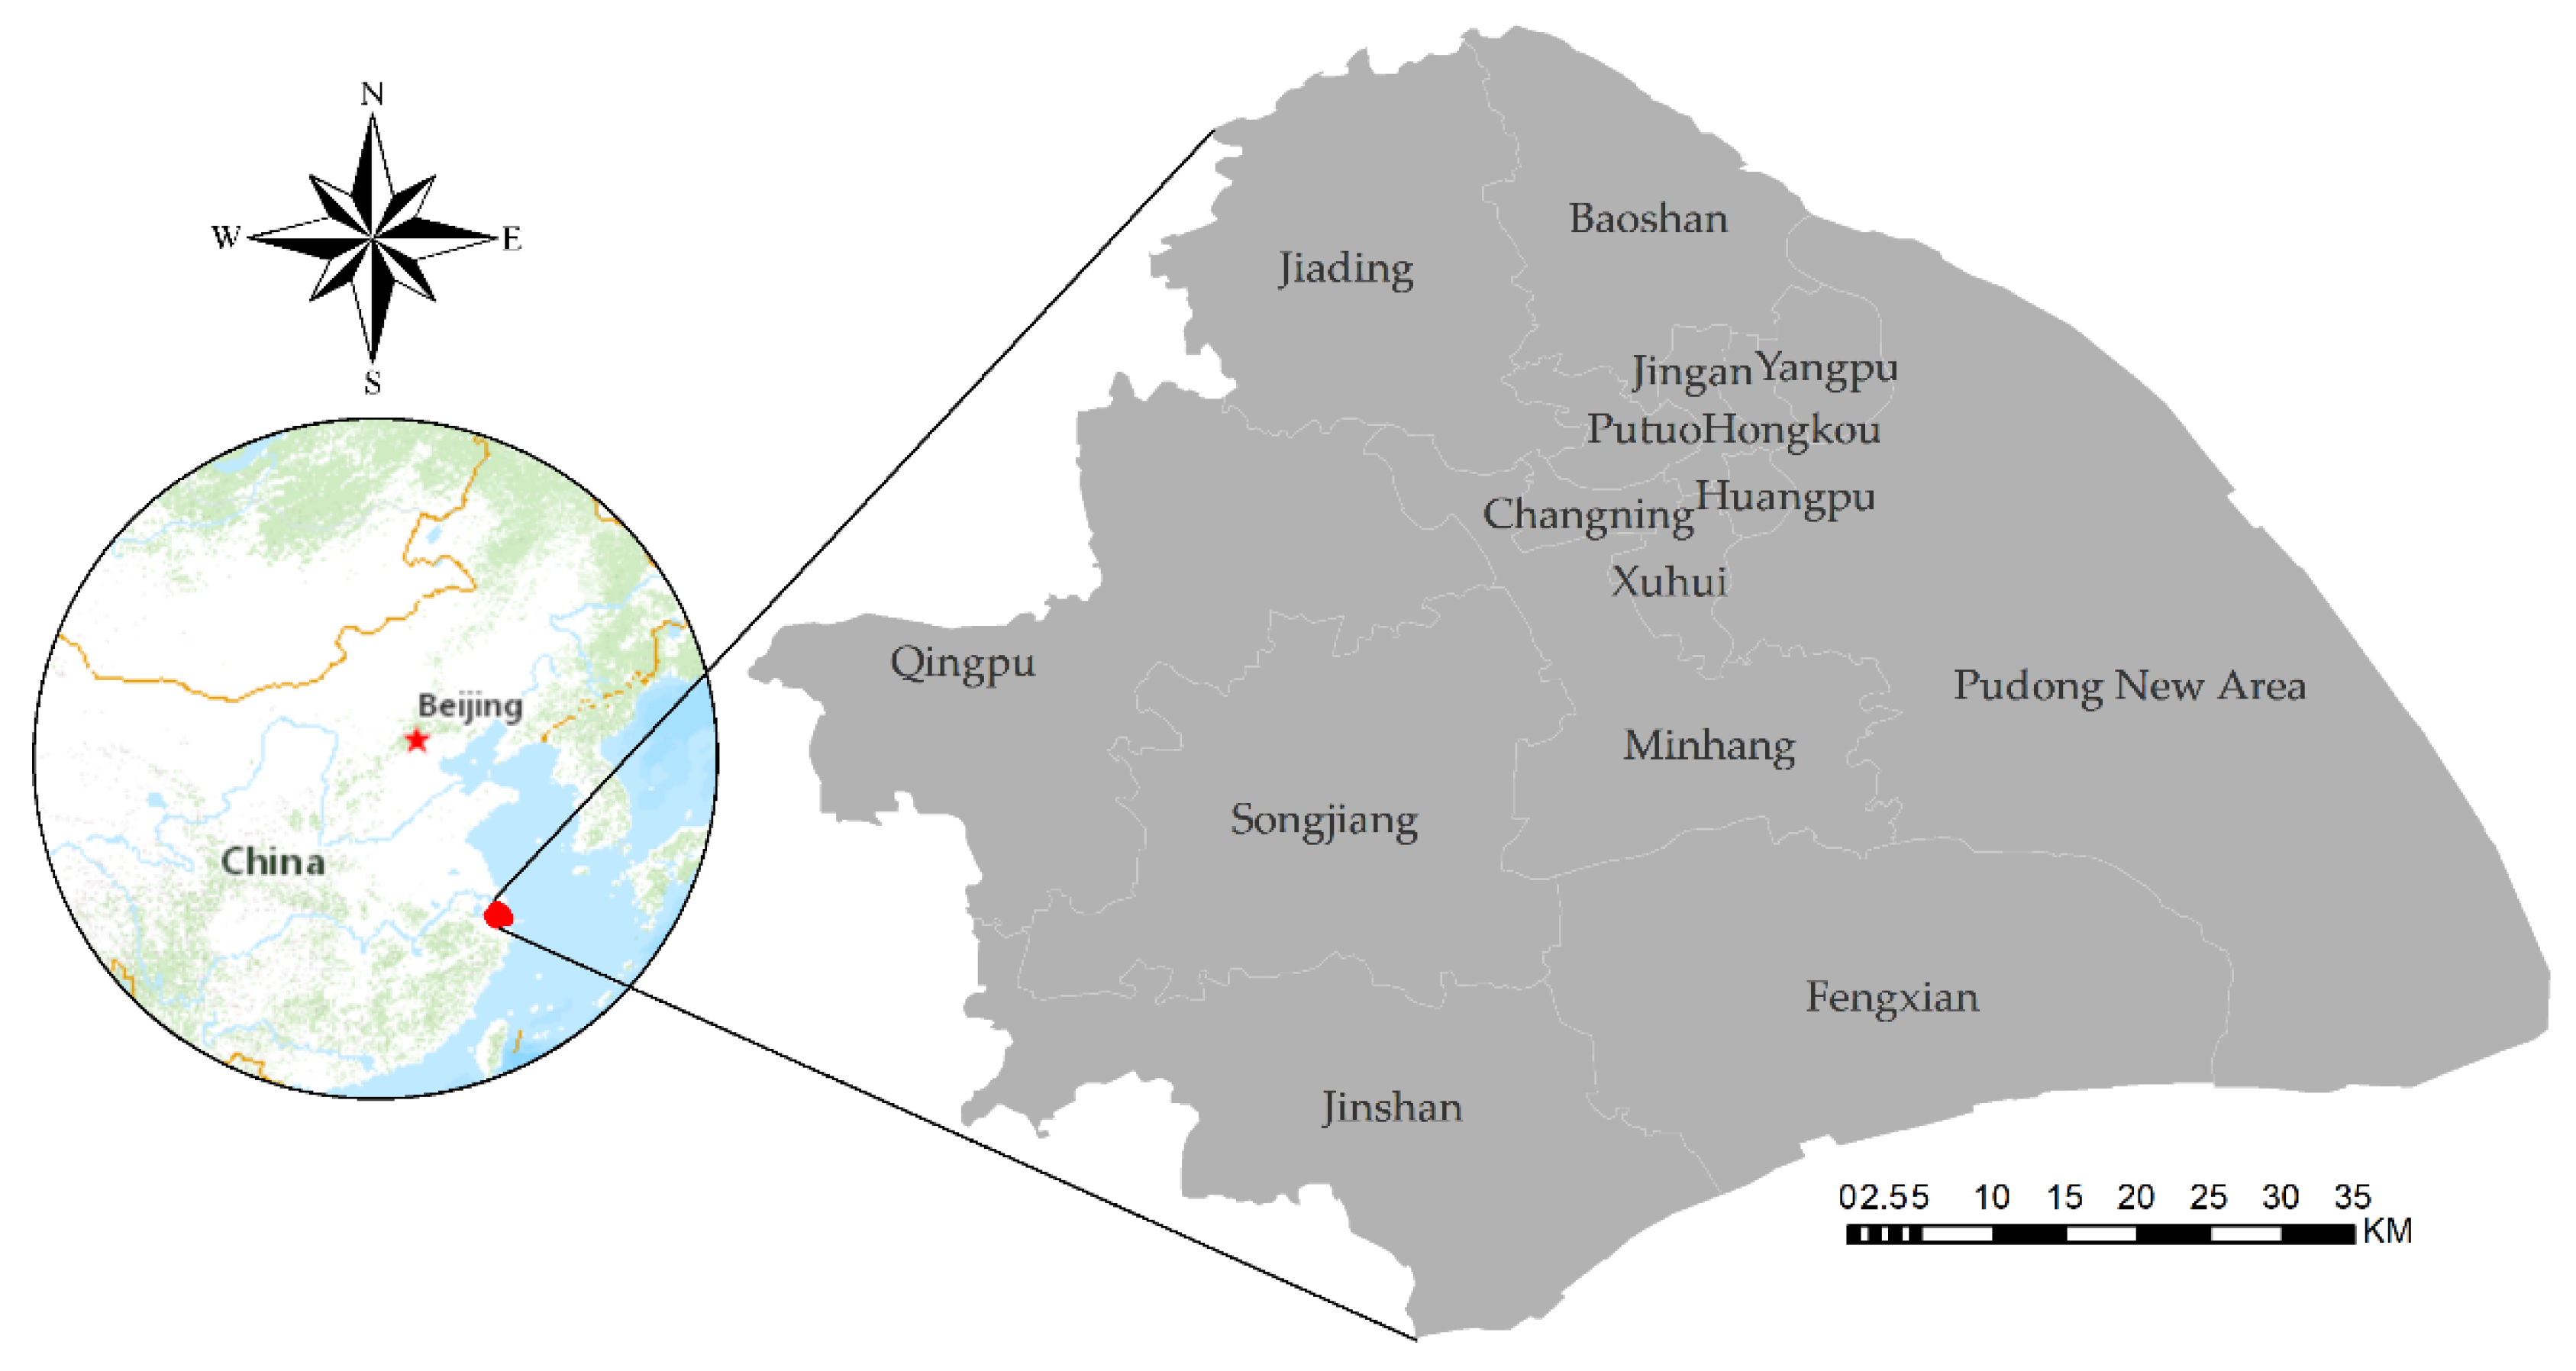
3.1. Study Area
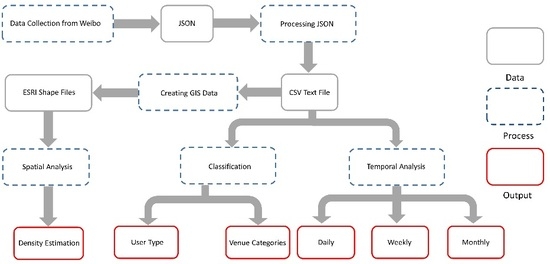
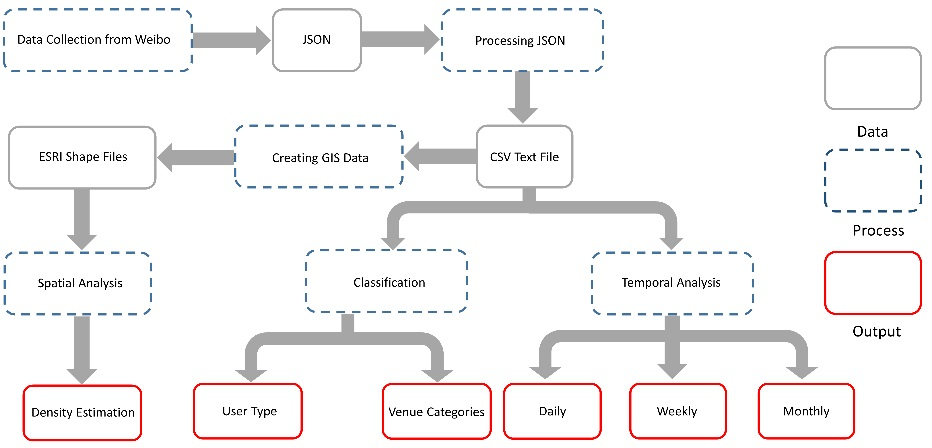
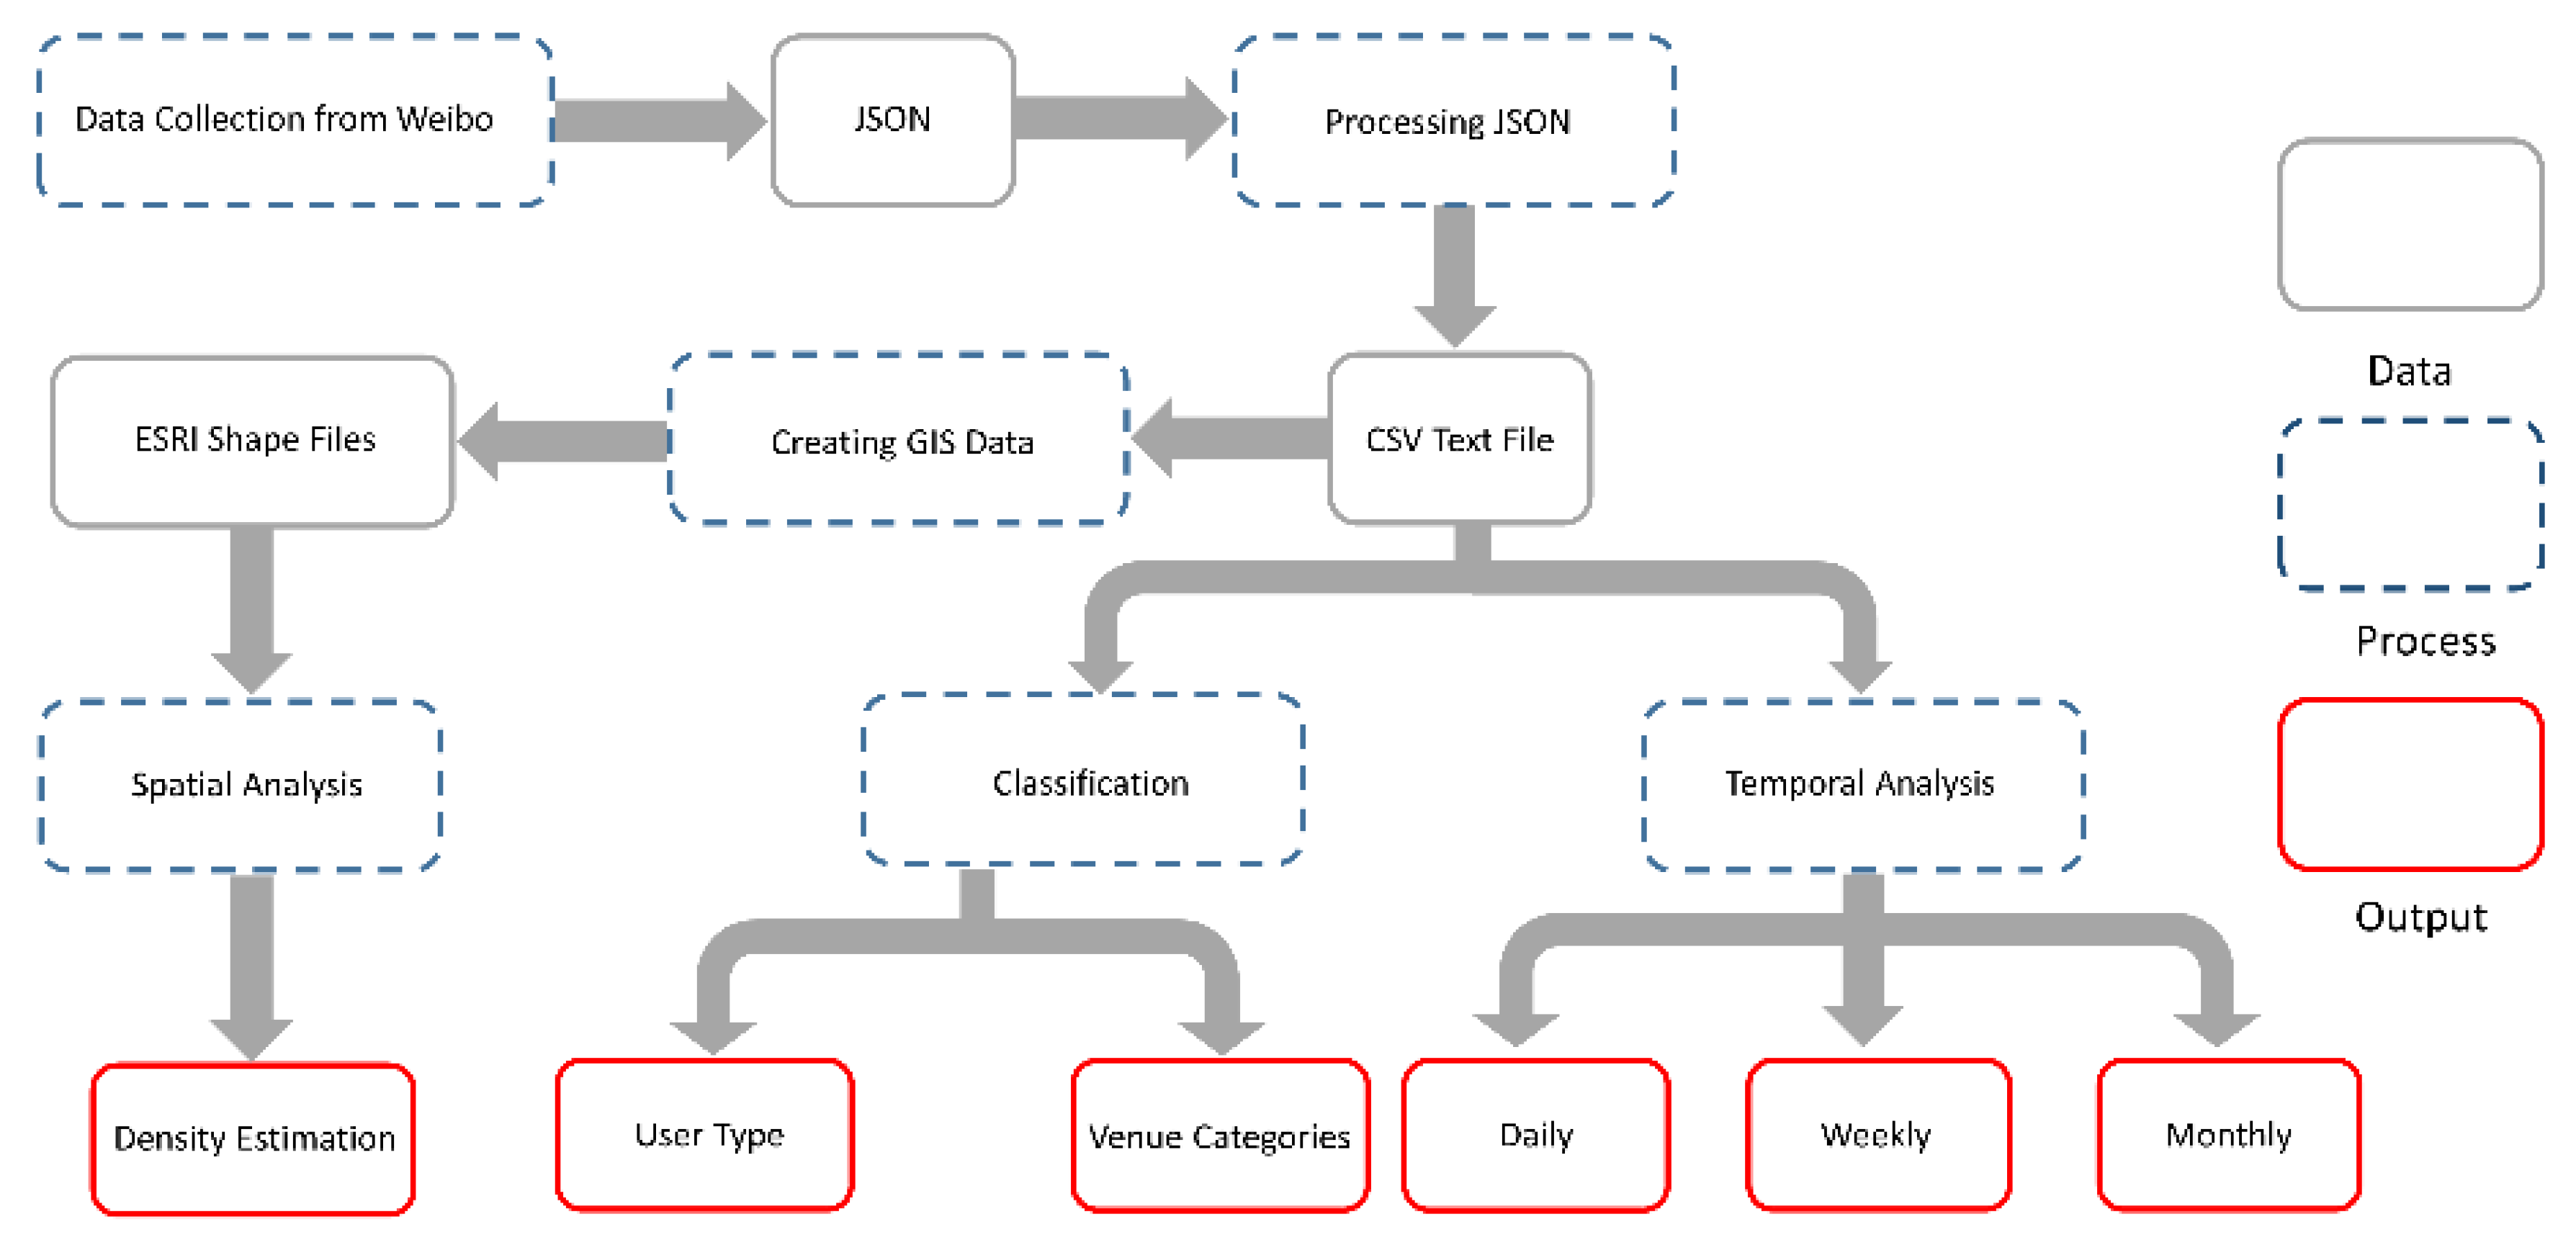
3.2. Data Acquisition and Preparation
3.3. Analysis Methods
4. Results and Discussion
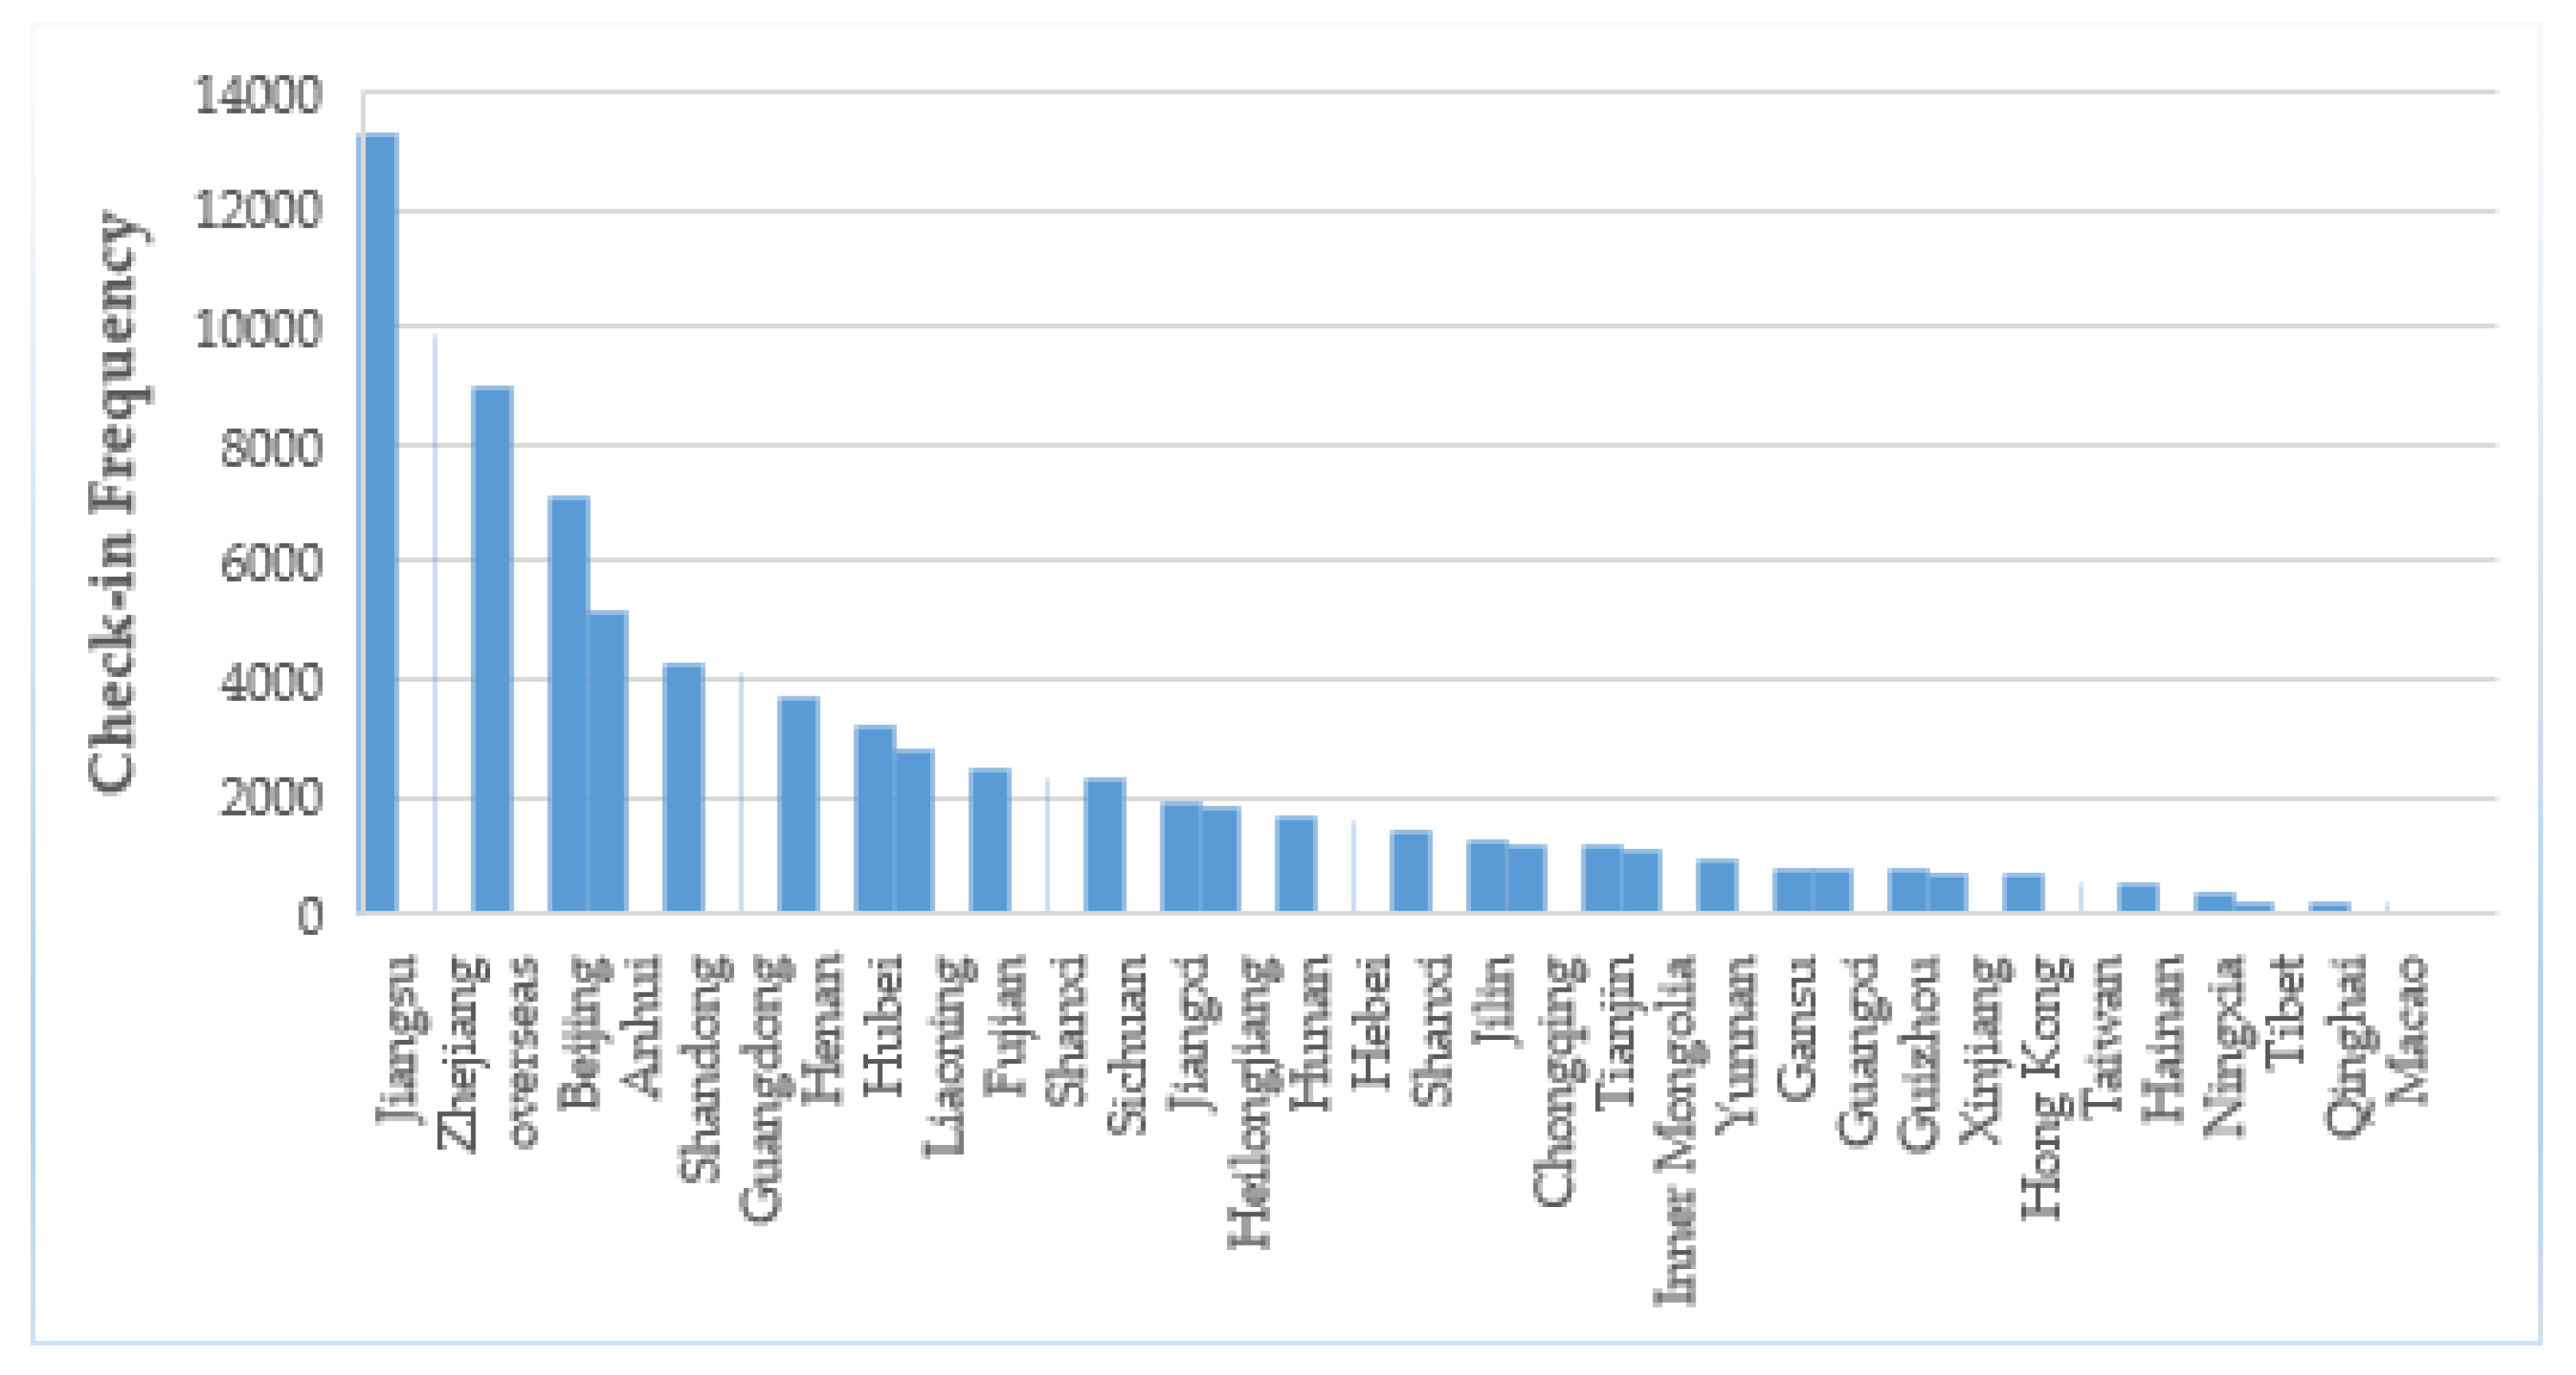
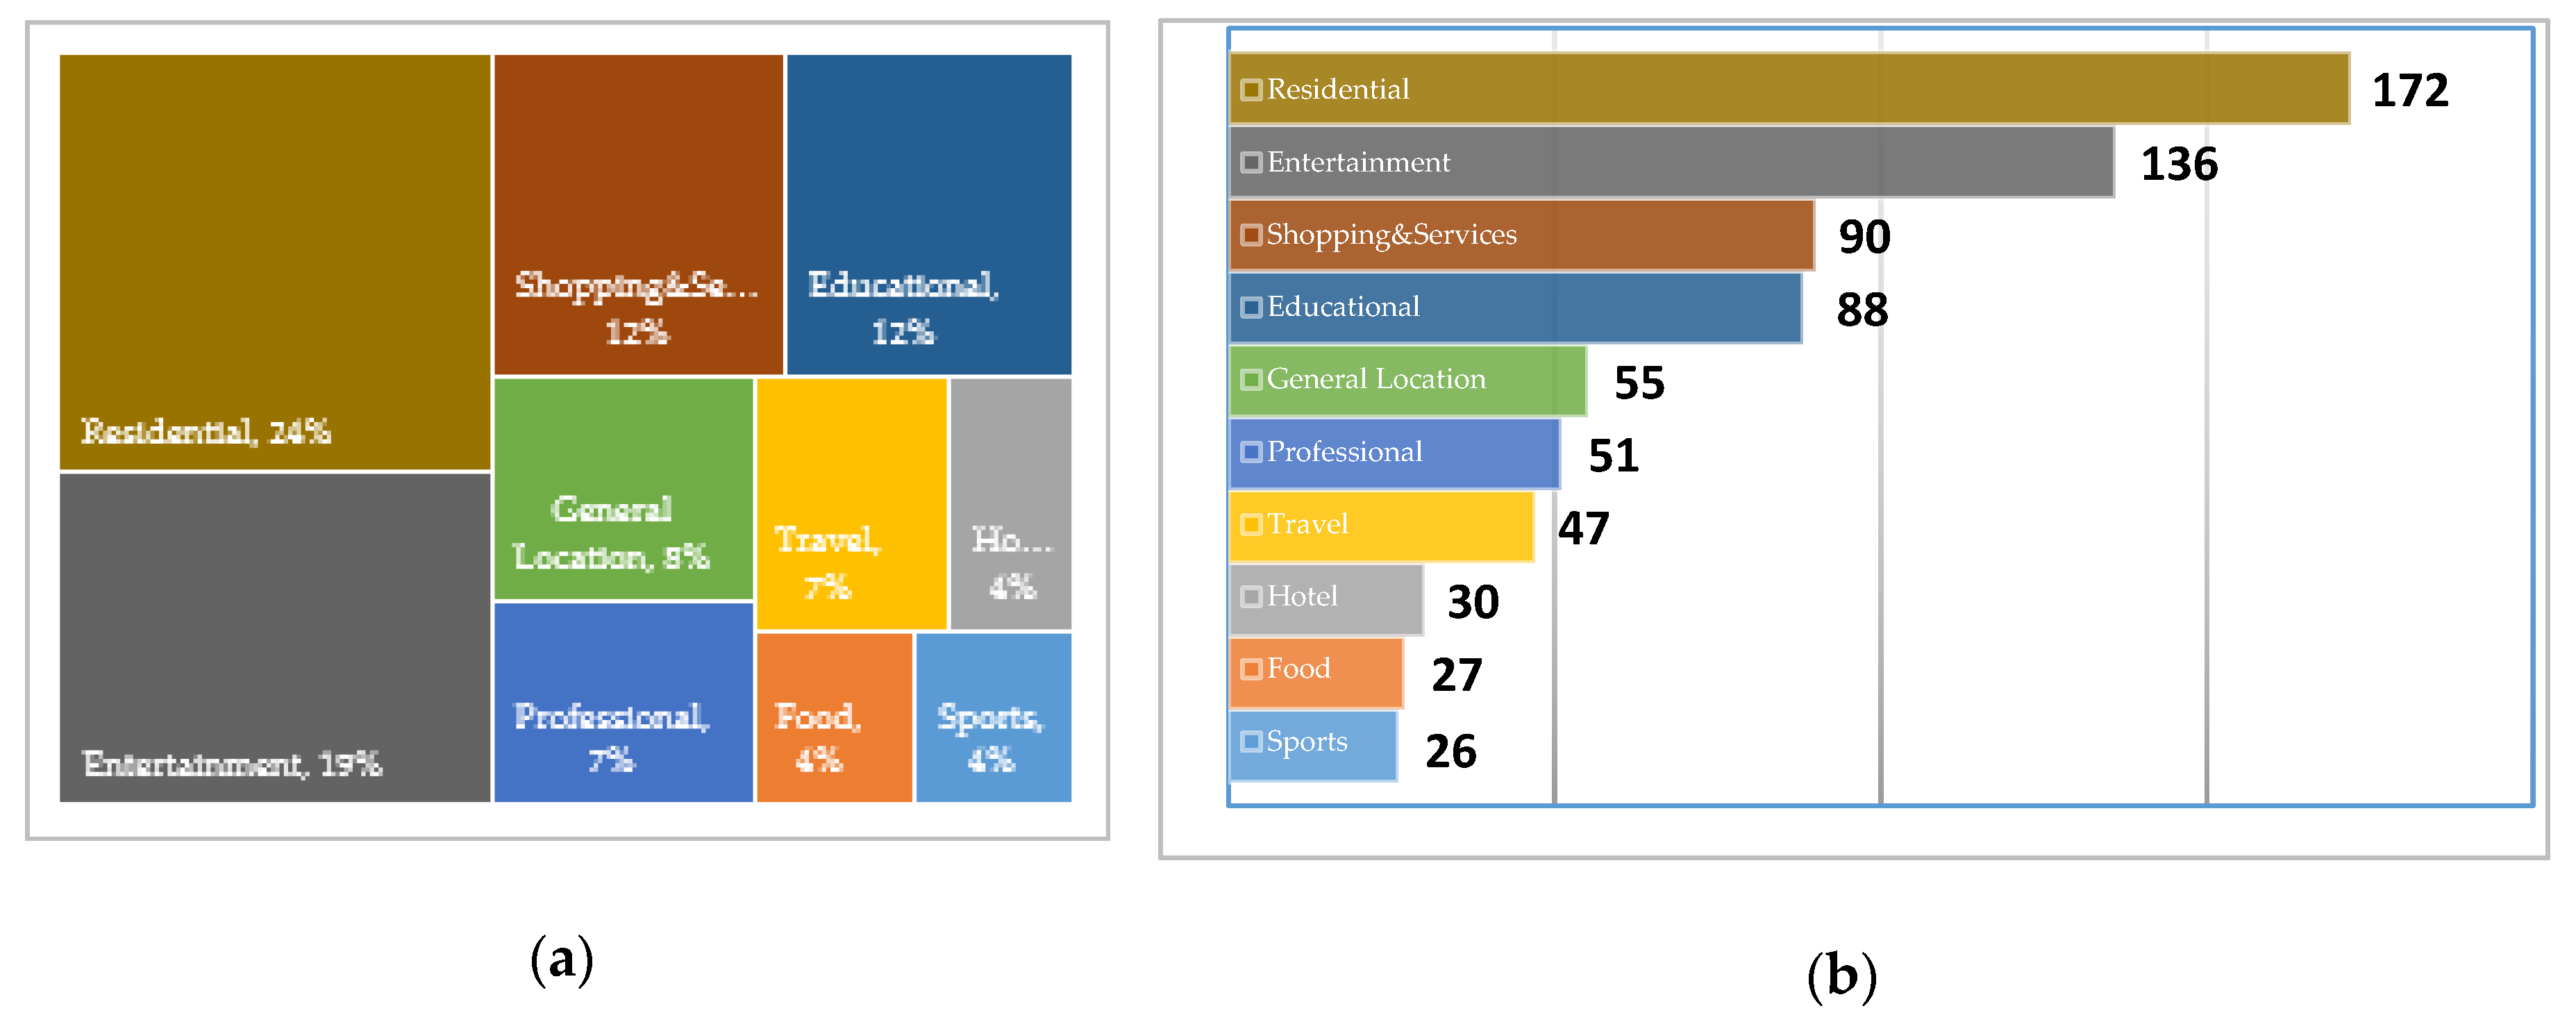
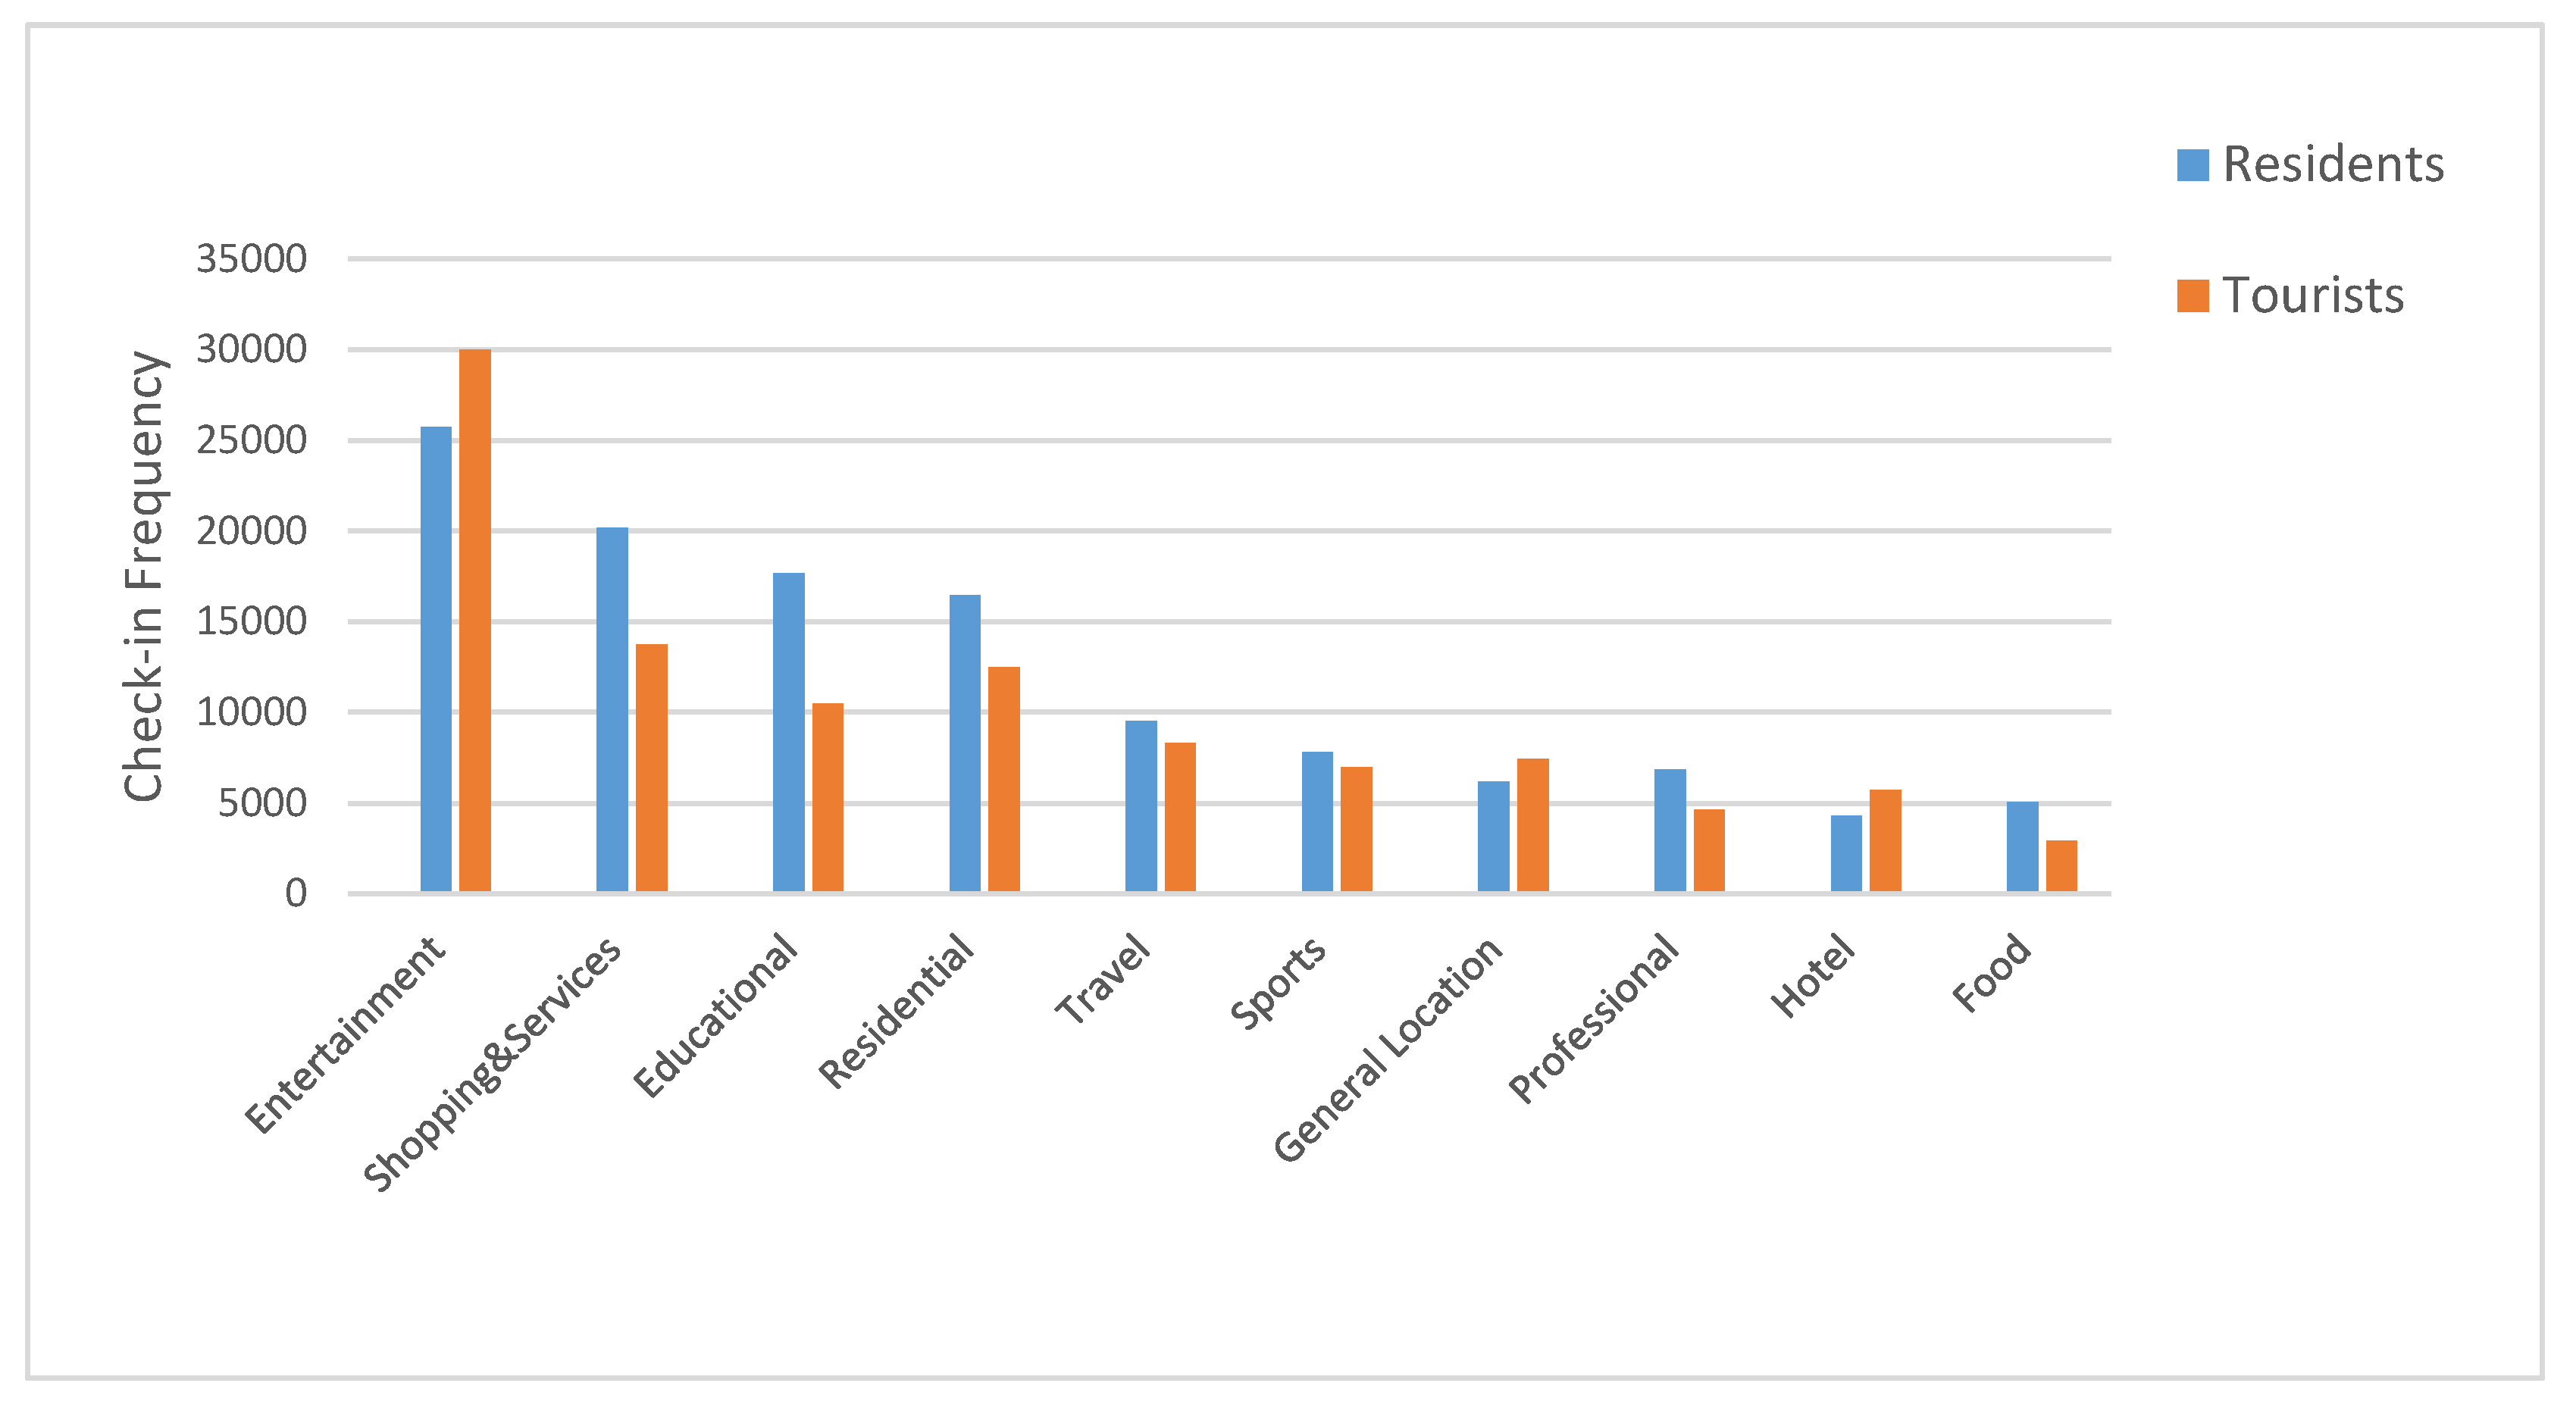
4.1. User and Venue Distribution
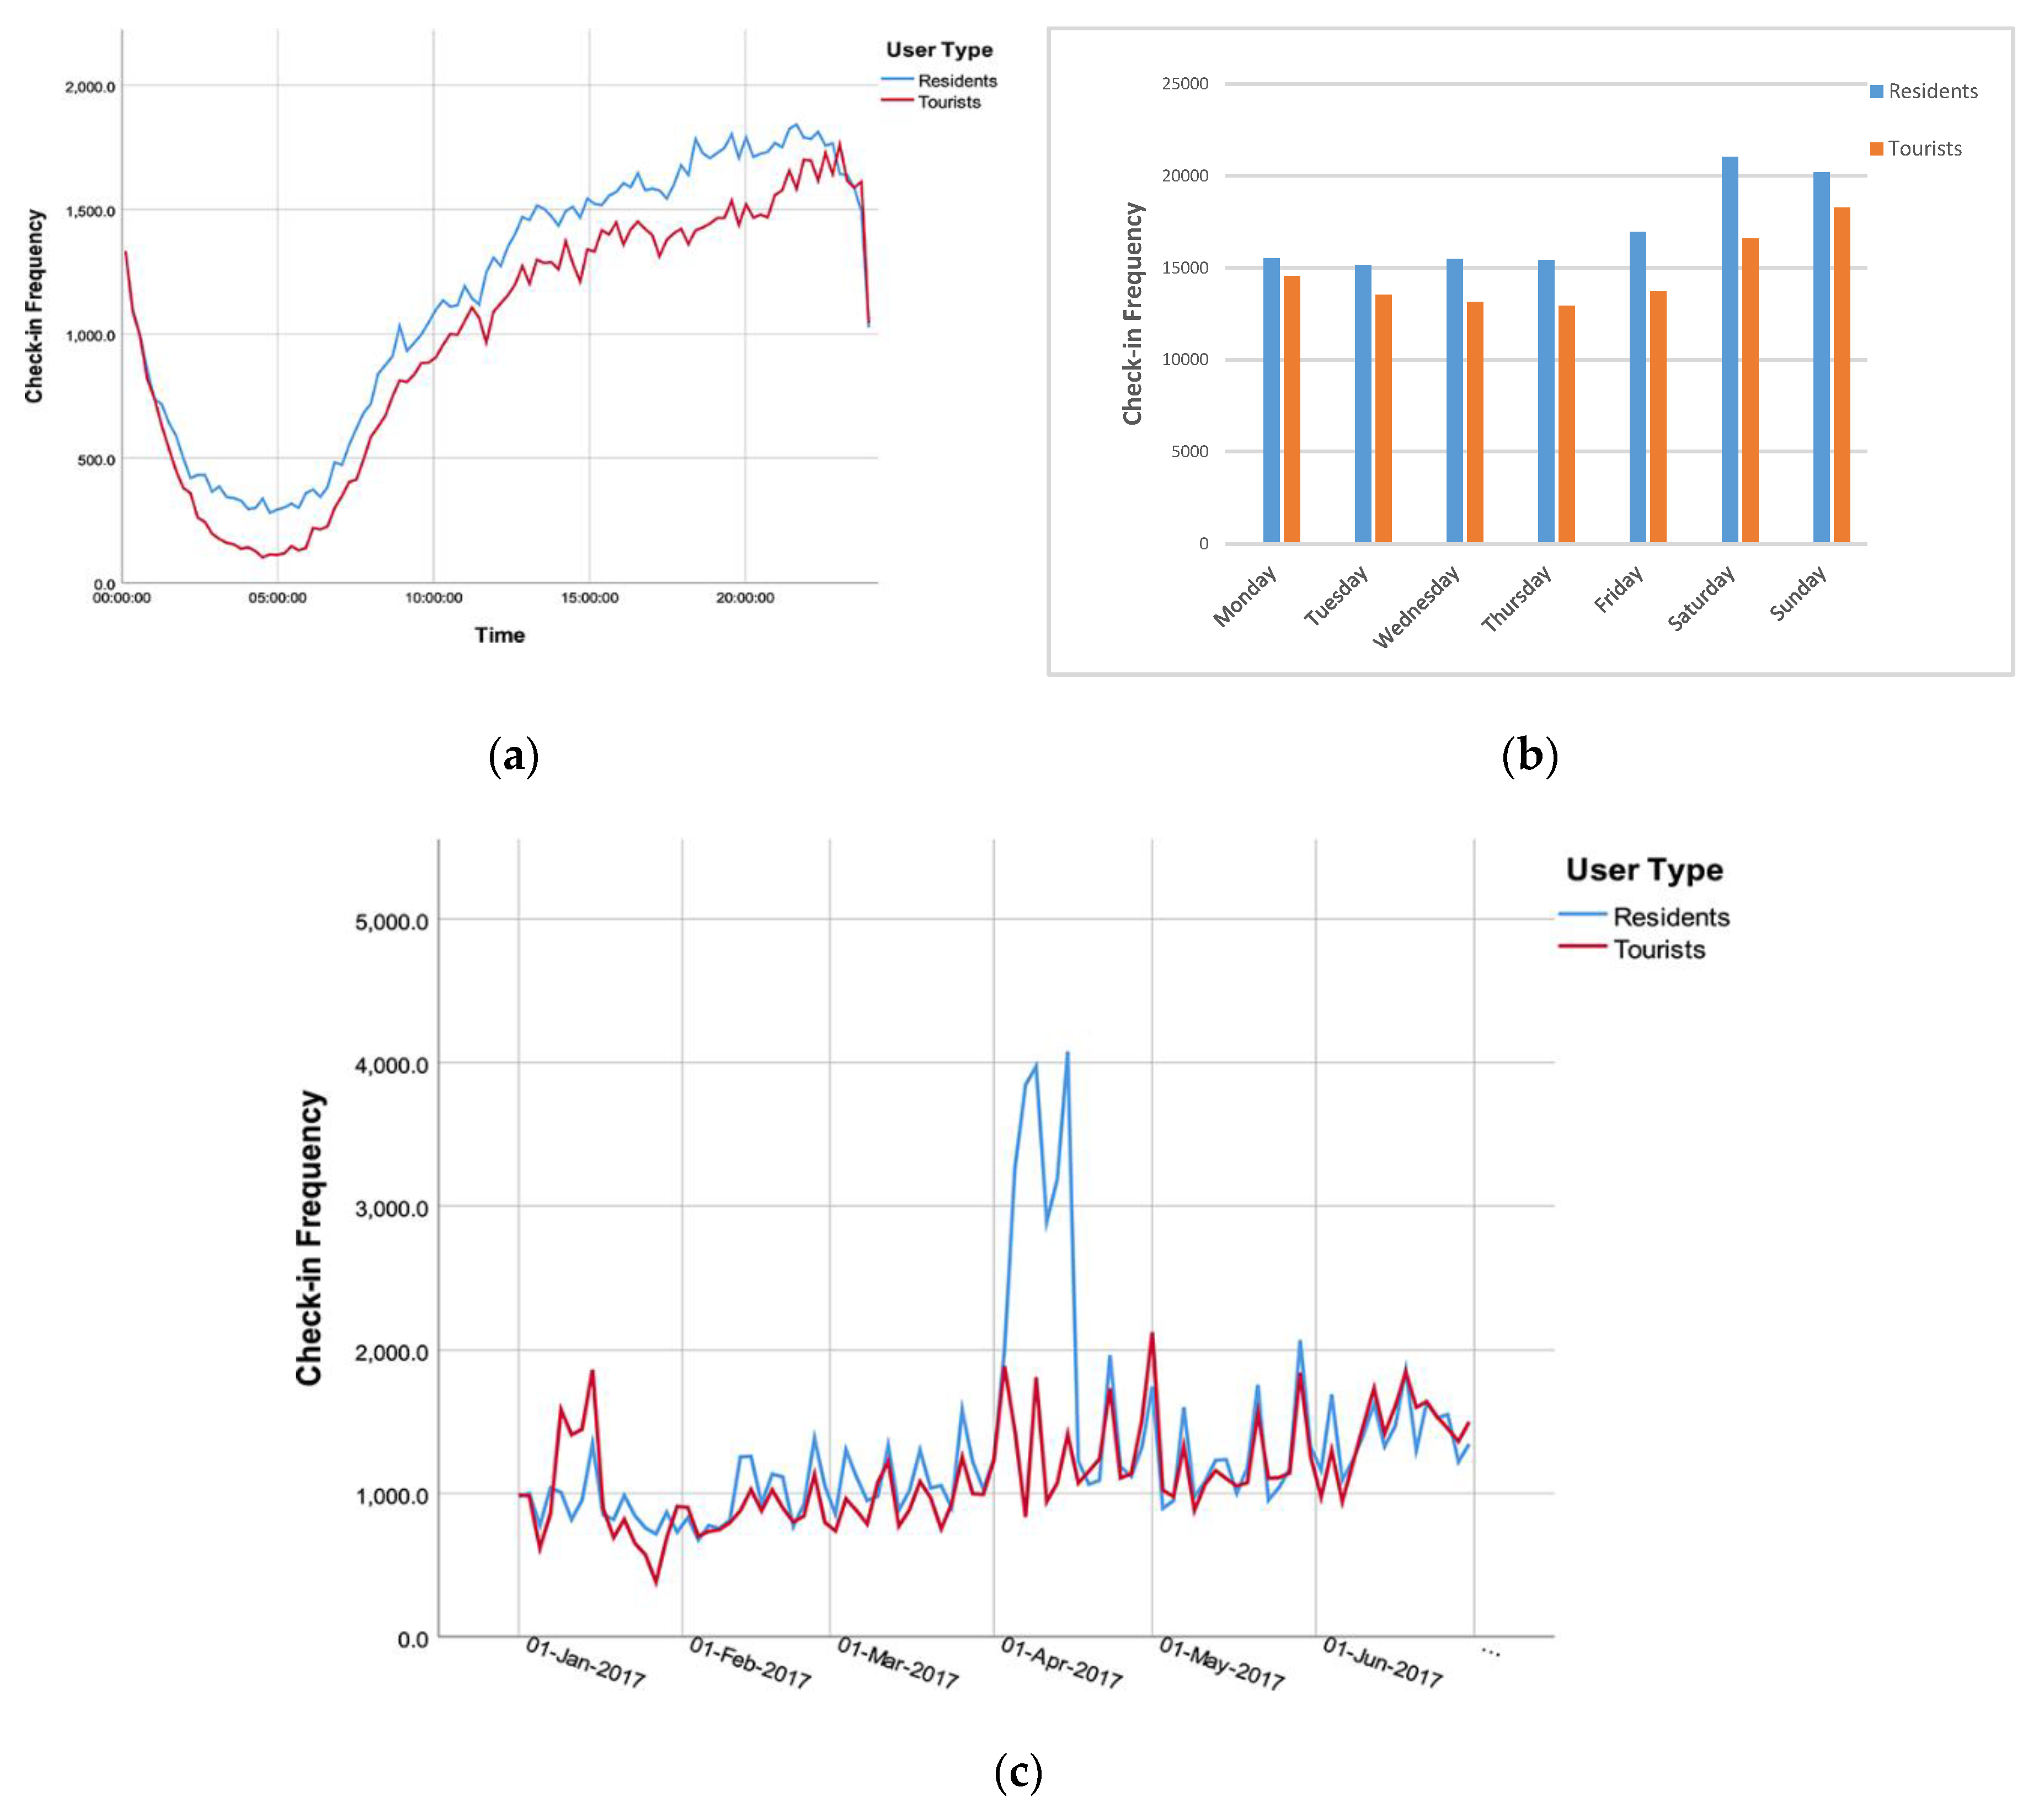
4.2. Temporal Patterns
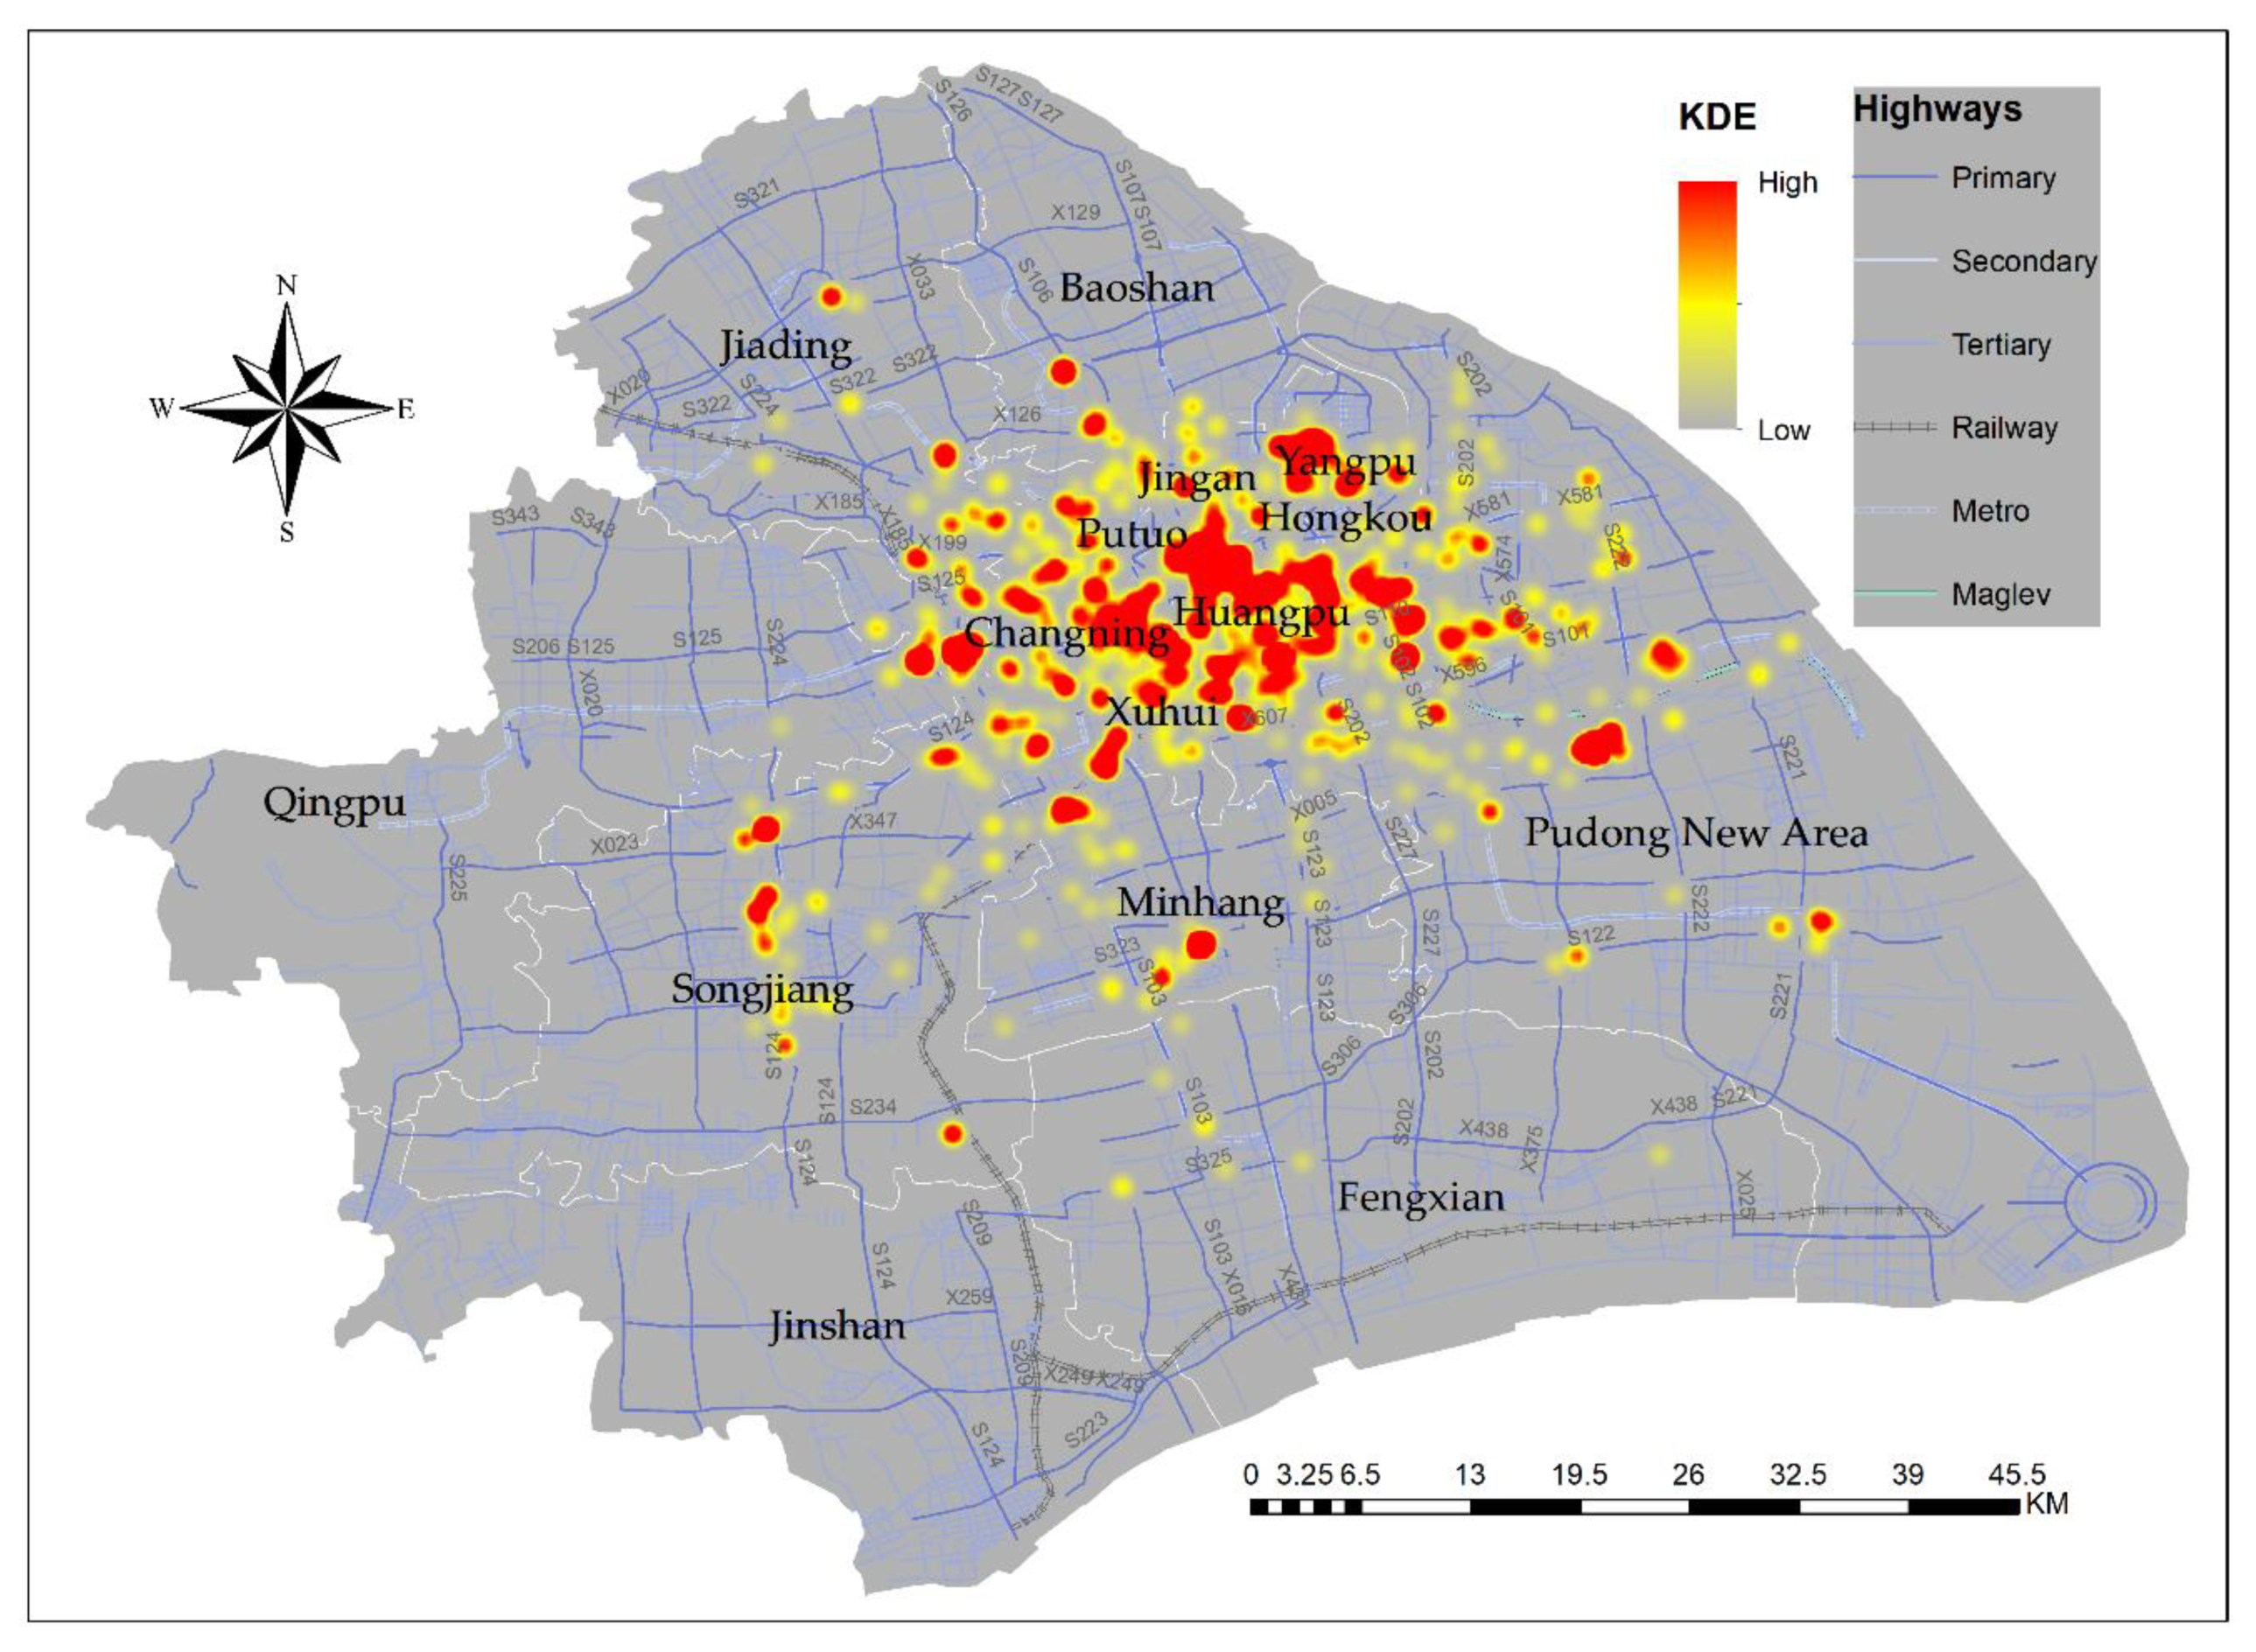
4.3. Spatial Patterns
5. Conclusions
Author Contributions
Funding
Conflicts of Interest
References
- Ashworth, G.; Page, S. Urban Tourism Research: Recent Progress and Current Paradoxes. Tour. Manag. 2011, 32, 1–15. [Google Scholar] [CrossRef]
- Łapko, A. Urban Tourism in Szczecin and Its Impact on the Functioning of the Urban Transport System. Procedia-Soc. Behav. Sci. 2014, 151, 207–214. [Google Scholar] [CrossRef] [Green Version]
- Edwards, D.; Griffin, T.; Hayllar, B. Urban Tourism Research: Developing an Agenda. Ann. Tour. Res. 2008, 35, 1032–1052. [Google Scholar] [CrossRef]
- Kotus, J.; Rzeszewski, M.; Ewertowski, W. Tourists in the Spatial Structures of a Big Polish City: Development of an Uncontrolled Patchwork or Concentric Spheres? Tour. Manag. 2015, 50, 98–110. [Google Scholar] [CrossRef]
- O’Reilly, A.M. Tourism Carrying Capacity: Concept and Issues. Tour. Manag. 1986, 7, 254–258. [Google Scholar] [CrossRef]
- Füller, H.; Michel, B. ‘Stop Being a Tourist!’ New Dynamics of Urban Tourism in Berlin-Kreuzberg. Int. J. Urban Reg. Res. 2014, 38, 1304–1318. [Google Scholar] [CrossRef]
- Lew, A.A.; Hall, C.M.; Williams, A.M. A Companion to Tourism; John Wiley & Sons: Hoboken, NJ, USA, 2008. [Google Scholar]
- Md Khairi, N.D.; Ismail, H.N.; Syed Jaafar, S.M.R. Tourist Behaviour through Consumption in Melaka World Heritage Site. Curr. Issues Tour. 2019, 22, 582–600. [Google Scholar] [CrossRef]
- Bujosa, A.; Riera, A.; Pons, P.J. Sun-and-Beach Tourism and the Importance of Intra-Destination Movements in Mature Destinations. Tour. Geogr. 2015, 17, 780–794. [Google Scholar] [CrossRef]
- Lau, G.; McKercher, B. Understanding Tourist Movement Patterns in a Destination: A GIS Approach. Tour. Hosp. Res. 2006, 7, 39–49. [Google Scholar] [CrossRef]
- Zoltan, J.; McKercher, B. Analysing Intra-destination Movements and Activity Participation of Tourists through Destination Card Consumption. Tour. Geogr. 2015, 17, 19–35. [Google Scholar] [CrossRef]
- Shoval, N.; Isaacson, M. Tracking Tourists in the Digital Age. Ann. Tour. Res. 2007, 34, 141–159. [Google Scholar] [CrossRef]
- Paldino, S.; Bojic, I.; Sobolevsky, S.; Ratti, C.; González, M.C. Urban Magnetism Through the Lens of Geo-tagged Photography. EPJ Data Sci. 2015, 4, 5. [Google Scholar] [CrossRef] [Green Version]
- García-Palomares, J.C.; Gutiérrez, J.; Mínguez, C. Identification of Tourist Hot Spots Based on Social Networks: A Comparative Analysis of European Metropolises Using Photo-Sharing Services and GIS. Appl. Geogr. 2015, 63, 408–417. [Google Scholar] [CrossRef]
- Kádár, B.; Gede, M. Where Do Tourists Go? Visualizing and Analysing the Spatial Distribution of Geotagged Photography. Cartogr. Int. J. Geogr. Inf. Geovis. 2013, 48, 78–88. [Google Scholar] [CrossRef]
- Li, D.; Zhou, X.; Wang, M. Analyzing and Visualizing the Spatial Interactions between Tourists and Locals: A Flickr Study in Ten US Cities. Cities 2018, 74, 249–258. [Google Scholar] [CrossRef]
- McKercher, B.; Shoval, N.; Ng, E.; Birenboim, A. First and Repeat Visitor Behaviour: GPS Tracking and GIS Analysis in Hong Kong. Tour. Geogr. 2012, 14, 147–161. [Google Scholar] [CrossRef]
- Wang, Y.; Wang, T.; Tsou, M.-H.; Li, H.; Jiang, W.; Guo, F. Mapping Dynamic Urban Land use Patterns with Crowdsourced Geo-tagged Social Media (Sina-Weibo) and Commercial Points of Interest Collections in Beijing, China. Sustainability 2016, 8, 1202. [Google Scholar] [CrossRef] [Green Version]
- Zhen, F.; Cao, Y.; Qin, X.; Wang, B. Delineation of an Urban Agglomeration Boundary Based on Sina Weibo Microblog ‘Check-in’ Data: A Case Study of the Yangtze River Delta. Cities 2017, 60, 180–191. [Google Scholar] [CrossRef]
- Preoţiuc-Pietro, D.; Cohn, T. Mining User Behaviours: A Study of Check-in Patterns in Location Based Social Networks. In Proceedings of the 5th Annual ACM Web Science Conference, Paris, France, 2–4 May 2013; ACM: New York, NY, USA, 2013; pp. 306–315. [Google Scholar]
- Lindqvist, J.; Cranshaw, J.; Wiese, J.; Hong, J.; Zimmerman, J. I’m the Mayor of My House: Examining Why People Use Foursquare-A Social-Driven Location Sharing Application. In Proceedings of the SIGCHI Conference on Human Factors in Computing Systems, Vancouver, BC, Canada, 7–12 May 2011; ACM: New York, NY, USA, 2011; pp. 2409–2418. [Google Scholar]
- Noulas, A.; Scellato, S.; Mascolo, C.; Pontil, M. An Empirical Study of Geographic User Activity Patterns in Foursquare. In Proceedings of the Fifth international AAAI Conference on Weblogs and Social Media, Barcelona, Spain, 17–21 July 2011. [Google Scholar]
- Scellato, S.; Noulas, A.; Lambiotte, R.; Mascolo, C. Socio-spatial Properties of Online Location-based Social Networks. In Proceedings of the Fifth International AAAI Conference on Weblogs and Social Media, Barcelona, Spain, 17–21 July 2011. [Google Scholar]
- Zhang, J.-D.; Chow, C.-Y. iGSLR: Personalized Geo-Social Location Recommendation: A Kernel Density Estimation Approach. In Proceedings of the 21st ACM SIGSPATIAL International Conference on Advances in Geographic Information Systems, Orlando, FL, USA, 6–9 November 2013; ACM: New York, NY, USA, 2013; pp. 334–343. [Google Scholar]
- Alrumayyan, N.; Bawazeer, S.; AlJurayyad, R.; Al-Razgan, M. Analyzing User Behaviors: A Study of Tips in Foursquare. In 5th International Symposium on Data Mining Applications; Springer International Publishing AG: Cham, Switzerland, 2018; pp. 153–168. [Google Scholar]
- Lin, S.; Xie, R.; Xie, Q.; Zhao, H.; Chen, Y. Understanding User Activity Patterns of The Swarm APP: A Data-Driven Study. In Proceedings of the 2017 ACM International Joint Conference on Pervasive and Ubiquitous Computing and 2017 ACM International Symposium on Wearable Computers, Maui, HI, USA, 11–15 September 2017; ACM: New York, NY, USA, 2017; pp. 125–128. [Google Scholar]
- Loo, B.P.; Yao, S.; Wu, J. Spatial Point Analysis of Road Crashes in Shanghai: A GIS-Based Network Kernel Density Method. In Proceedings of the 2011 19th International Conference on Geoinformatics, Shanghai, China, 24–26 June 2011; IEEE: Piscataway, NJ, USA, 2011; pp. 1–6. [Google Scholar]
- Shi, B.; Zhao, J.; Chen, P.-J. Exploring Urban Tourism Crowding in Shanghai via Crowdsourcing Geospatial Data. Curr. Issues Tour. 2017, 20, 1186–1209. [Google Scholar] [CrossRef]
- Gu, Z.; Zhang, Y.; Chen, Y.; Chang, X. Analysis of Attraction Features of Tourism Destinations in a Mega-City Based on Check-in Data Mining—A Case Study of Shenzhen, China. ISPRS Int. J. Geo-Inf. 2016, 5, 210. [Google Scholar] [CrossRef] [Green Version]
- Long, Y.; Han, H.; Tu, Y.; Shu, X. Evaluating the Effectiveness of Urban Growth Boundaries Using Human Mobility and Activity Records. Cities 2015, 46, 76–84. [Google Scholar] [CrossRef]
- Ullah, H.; Wan, W.; Haidery, S.A.; Khan, N.U.; Ebrahimpour, Z.; Luo, T. Analyzing the Spatiotemporal Patterns in Green Spaces for Urban Studies Using Location-Based Social Media Data. ISPRS Int. J. Geo-Inf. 2019, 8, 506. [Google Scholar] [CrossRef] [Green Version]
- Muhammad, R.; Zhao, Y.; Liu, F. Spatiotemporal Analysis to Observe Gender Based Check-In Behavior by Using Social Media Big Data: A Case Study of Guangzhou, China. Sustainability 2019, 11, 2822. [Google Scholar] [CrossRef] [Green Version]
- Rizwan, M.; Wan, W.; Cervantes, O.; Gwiazdzinski, L. Using Location-based Social Media Data to Observe Check-in Behavior and Gender Difference: Bringing Weibo Data into Play. ISPRS Int. J. Geo-Inf. 2018, 7, 196. [Google Scholar] [CrossRef] [Green Version]
- Gospodini, A. Urban Design, Urban Space Morphology, Urban Tourism: An Emerging New Paradigm Concerning Their Relationship. Eur. Plan. Stud. 2001, 9, 925–934. [Google Scholar] [CrossRef]
- Zheng, W.; Huang, X.; Li, Y. Understanding the Tourist Mobility using GPS: Where is the Next Place? Tour. Manag. 2017, 59, 267–280. [Google Scholar] [CrossRef] [Green Version]
- Ashworth, G. Do We Understand Urban Tourism? J. Tour. Hosp. 2012, 1, 1–2. [Google Scholar] [CrossRef] [Green Version]
- Su, X.; Spierings, B.; Dijst, M.; Tong, Z. Analysing Trends in the Spatio-temporal Behaviour Patterns of Mainland Chinese Tourists and Residents in Hong Kong Based on Weibo Data. Curr. Issues Tour. 2019, 1–17. [Google Scholar] [CrossRef]
- Vu, H.Q.; Li, G.; Law, R.; Ye, B.H. Exploring the Travel Behaviors of Inbound Tourists to Hong Kong Using Geotagged Photos. Tour. Manag. 2015, 46, 222–232. [Google Scholar] [CrossRef]
- Lew, A.; McKercher, B. Travel Geometry: Macro and Micro Scales Considerations. In Proceedings of the Pre-Congress Meeting of the International Geographic Union’s Commission on Tourism, Leisure and Global Change, Loch Lomond, UK, 13–15 August 2004. [Google Scholar]
- Li, C.; Zhao, Y.; Sun, X.; Su, X.; Zheng, S.; Dong, R.; Shi, L. Photography-Based Analysis of Tourists’ Temporal–Spatial Behaviour in The Old Town of Lijiang. Int. J. Sustain. Dev. World Ecol. 2011, 18, 523–529. [Google Scholar] [CrossRef]
- Liu, Y.; Shi, J. How Inter-City High-Speed Rail Influences Tourism Arrivals: Evidence From Social Media Check-in Data. Curr. Issues Tour. 2019, 22, 1025–1042. [Google Scholar] [CrossRef]
- Liu, X.; Kang, C.; Gong, L.; Liu, Y. Incorporating Spatial Interaction Patterns in Classifying and Understanding Urban Land Use. Int. J. Geogr. Inf. Sci. 2016, 30, 334–350. [Google Scholar] [CrossRef]
- Ebrahimpour, Z.; Wan, W.; Cervantes, O.; Luo, T.; Ullah, H. Comparison of Main Approaches for Extracting Behavior Features from Crowd Flow Analysis. ISPRS Int. J. Geo-Inf. 2019, 8, 440. [Google Scholar] [CrossRef] [Green Version]
- Fistola, R.; Gargiulo, C.; Battarra, R.; La Rocca, R.A. Sustainability of urban functions: Dealing with tourism activity. Sustainability 2019, 11, 1071. [Google Scholar] [CrossRef] [Green Version]
- Rizwan, M.; Mahmood, S.; Wanggen, W.; Ali, S. Location Based Social Media Data Analysis for Observing Check-in Behavior and City Rhythm in Shanghai. In Proceedings of the 4th International Conference on Smart and Sustainable City (ICSSC 2017), Shanghai, China, 5–6 June 2017. [Google Scholar]
- Liu, C.Y.; Chen, J.; Li, H. Linking Migrant Enclave Residence to Employment in Urban China: The Case of Shanghai. J. Urban. Aff. 2019, 41, 189–205. [Google Scholar] [CrossRef] [Green Version]
- Xiao, Y.; Wang, D.; Fang, J. Exploring the Disparities in Park Access through Mobile Phone Data: Evidence from Shanghai, China. Landsc. Urban. Plan. 2019, 181, 80–91. [Google Scholar] [CrossRef]
- Mou, N.; Yuan, R.; Yang, T.; Zhang, H.; Tang, J.J.; Makkonen, T. Exploring spatio-temporal changes of city inbound tourism flow: The case of Shanghai, China. Tour. Manag. 2020, 76, 103955. [Google Scholar] [CrossRef]
- Weibo Data Center. Available online: https://data.weibo.com/report/reportDetail?id=404 (accessed on 4 May 2019).
- Zhang, W.; Derudder, B.; Wang, J.; Shen, W.; Witlox, F. Using Location-Based Social Media to Chart the Patterns of People Moving Between Cities: The Case of Weibo-Users in the Yangtze River Delta. J. Urban. Technol. 2016, 23, 91–111. [Google Scholar] [CrossRef]
- Zhang, Y.; Li, X.; Wang, A.; Bao, T.; Tian, S. Density and Diversity of OpenStreetMap Road Networks in China. J. Urban. Manag. 2015, 4, 135–146. [Google Scholar] [CrossRef] [Green Version]
- Lichman, M.; Smyth, P. Modeling Human Location Data with Mixtures of Kernel Densities. In Proceedings of the 20th ACM SIGKDD International Conference on Knowledge Discovery and Data Mining, New York, NY, USA, 24–27 August 2014; ACM: New York, NY, USA, 2014; pp. 35–44. [Google Scholar]
- Zhang, H.Q.; Qu, H. The Trends of China’s Outbound Travel to Hong Kong and Their Implications. J. Vacat. Mark. 1996, 2, 373–381. [Google Scholar] [CrossRef]
- Xu, X.; Reed, M. Perceived Pollution and Inbound Tourism for Shanghai: A Panel VAR Approach. Curr. Issues Tour. 2019, 22, 601–614. [Google Scholar] [CrossRef]
- CNNIC, Statistical Report on Internet Development in China. Available online: https://cnnic.com.cn/IDR/ReportDownloads/201807/P020180711391069195909.pdf (accessed on 4 May 2019).
- Hasan, S.; Zhan, X.; Ukkusuri, S.V. Understanding Urban Human Activity and Mobility Patterns Using Large-Scale Location-Based Data From Online Social Media. In Proceedings of the 2nd ACM SIGKDD International Workshop on Urban Computing, Chicago, IL, USA, 11 August 2013; ACM: New York, NY, USA, 2013; p. 6. [Google Scholar]
- Huang, H.; Gartner, G. Current Trends and Challenges in Location-Based Services. ISPRS Int. J. Geo-Inf. 2018, 7, 199. [Google Scholar] [CrossRef] [Green Version]
- Tsui, K.W.H.; Yuen, A.C.-L.; Fung, M.K.Y. Maintaining Competitiveness of Aviation Hub: Empirical Evidence of Visitors to China via Hong Kong by Air Transport. Curr. Issues Tour. 2018, 21, 1260–1284. [Google Scholar] [CrossRef]
- Rizwan, M.; Wan, W. Big Data Analysis to Observe Check-in Behavior Using Location-Based Social Media Data. Information 2018, 9, 257. [Google Scholar] [CrossRef] [Green Version]
- Ling, W.; Shengquan, C.; Anze, L.; Xiao, L. Study on the Spatial Structure of Shanghai Urban Agriculture Tourism. In Proceedings of the China-Bulgaria Rural Revitalization Development Cooperation Forum, Shanghai, China, 23 April 2018; p. 157. [Google Scholar]


| User ID | Date | Time | Gender | Origin | Location ID | Latitude | Longitude | Location |
|---|---|---|---|---|---|---|---|---|
| 18…73 | 6/30/2017 | 22:06:16 | m | Shanghai | B2…93 | 121.323346 | 31.258411 | HSBC_Court |
| 58…96 | 6/30/2017 | 11:11:58 | f | Zhejiang | B2…93 | 121.395081 | 31.31339561 | Shanghai_University |
| 31…23 | 6/30/2017 | 18:00:59 | m | Jiangsu | B2…9B | 121.58817 | 31.310072 | Golf_Training |
| 51…16 | 6/30/2017 | 19:13:45 | f | Sichuan | B2…9B | 121.345023 | 31.283799 | Baili_Life_Plaza |
| Venue Category | Total No. of Check-Ins | Total No. of Users | Check-Ins by Tourists | Check-Ins by Residents |
|---|---|---|---|---|
| Educational | 28139 | 20535 | 10479 | 17660 |
| Entertainment | 55747 | 42393 | 29993 | 25754 |
| Food | 8015 | 4930 | 2939 | 5076 |
| General Location | 13618 | 10973 | 7435 | 6183 |
| Hotel | 10028 | 6935 | 5731 | 4297 |
| Professional | 11517 | 8270 | 4642 | 6875 |
| Residential | 28928 | 23508 | 12479 | 16449 |
| Shopping&Services | 33923 | 26280 | 13757 | 20166 |
| Sports | 14771 | 11256 | 6989 | 7782 |
| Travel | 17839 | 11818 | 8306 | 9533 |
© 2020 by the authors. Licensee MDPI, Basel, Switzerland. This article is an open access article distributed under the terms and conditions of the Creative Commons Attribution (CC BY) license (http://creativecommons.org/licenses/by/4.0/).
Share and Cite
Khan, N.U.; Wan, W.; Yu, S. Spatiotemporal Analysis of Tourists and Residents in Shanghai Based on Location-Based Social Network’s Data from Weibo. ISPRS Int. J. Geo-Inf. 2020, 9, 70. https://0-doi-org.brum.beds.ac.uk/10.3390/ijgi9020070
Khan NU, Wan W, Yu S. Spatiotemporal Analysis of Tourists and Residents in Shanghai Based on Location-Based Social Network’s Data from Weibo. ISPRS International Journal of Geo-Information. 2020; 9(2):70. https://0-doi-org.brum.beds.ac.uk/10.3390/ijgi9020070
Chicago/Turabian StyleKhan, Naimat Ullah, Wanggen Wan, and Shui Yu. 2020. "Spatiotemporal Analysis of Tourists and Residents in Shanghai Based on Location-Based Social Network’s Data from Weibo" ISPRS International Journal of Geo-Information 9, no. 2: 70. https://0-doi-org.brum.beds.ac.uk/10.3390/ijgi9020070