Landscape Sustainability Evaluation of Ecologically Fragile Areas Based on Boltzmann Entropy

1
College of Urban and Environmental Science, Northwest University, Xi’an 710127, China
2
Shaanxi Key Laboratory of Earth Surface System and Environmental Carrying Capacity, Northwest University, Xi’an 710127, China
*
Author to whom correspondence should be addressed.
ISPRS Int. J. Geo-Inf. 2020, 9(2), 77; https://0-doi-org.brum.beds.ac.uk/10.3390/ijgi9020077
Submission received: 19 December 2019
/
Revised: 16 January 2020
/
Accepted: 26 January 2020
/
Published: 29 January 2020
(This article belongs to the Special Issue Geographic Complexity: Concepts, Theories, and Practices)
Abstract
:From the perspective of landscape, it is important to evaluate the landscape sustainability of ecologically fragile areas and explore temporal and spatial evolution laws to promote their sustainable development. Presently, most studies on the analysis of landscape Boltzmann entropy (also called configurational entropy) are based on a single landscape, and most of these studies are theoretical discussions. However, there are few case studies on landscape ecology. The main objectives of this paper are to explore a quantitative relationship between Boltzmann entropy and landscape sustainability, to propose a method for evaluating landscape sustainability based on Boltzmann entropy, and to evaluate the sustainability of diverse landscapes in Mizhi County, Shaanxi Province, China. This article uses digital elevation model (DEM) data with a spatial resolution of 30 m in Mizhi County. The remote sensing data on Mizhi County from 2000 were obtained by the Landsat Enhanced Thematic Mapper (ETM) + sensor, and the high-resolution image of Mizhi County from 2015 was obtained by the Gaofen-1 satellite. In this article, the subbasins are taken as the evaluation unit, and the Boltzmann entropy of Mizhi County is calculated based on the experts’ scoring of landscape sustainability in the study area. Through the analysis of landscape sustainability results from 216 subbasins in Mizhi County in 2000 and 2015, the following conclusions are drawn: (1) the evaluation matrix proposed in this paper is effective, and the Boltzmann entropy obtained by this method can directly reflect the level of landscape sustainability; (2) during the research period, the landscape sustainability of Mizhi County showed a good trend overall, especially the three townships of Taozhen, Shadian, and Shigou, which were significantly improved, and these findings were consistent with the field investigation; (3) on the spatial level, the landscape sustainability of mid-eastern Mizhi County is relatively poor compared to that in other regions, but the sustainability is also slowly increasing.
1. Introduction
Since the 1970s, with the emergence of a series of problems such as global climate change and environmental pollution, the issue of sustainable development has been of worldwide concern. In 2001, Kates et al. proposed that sustainability science is “the science of studying the dynamic relationship between nature and society at the local, regional, and global scales, and it is the science that provides the theoretical basis and technical means for sustainable development” [1]. In 2013, Wu et al. noted that landscape is the basic spatial unit of sustainable development research and practice as well as the most operational spatial scale for studying sustainable processes and mechanisms. Landscape sustainability is defined as “the capacity of a landscape to consistently provide long-term, landscape-specific ecosystem services to maintain and improve human wellbeing in the region” [2,3]. As a comprehensive interdisciplinary science, landscape sustainability science focuses on three core elements—landscape patterns, landscape services, and human wellbeing [4]—with the ultimate goal of improving and sustaining human wellbeing. Because sustainability is a human-centered concept [2], there is a difference between landscape sustainability science and landscape ecology. Landscape sustainability science emphasizes the interaction and the influence between humans and nature. The effective assessment of landscape sustainability has become one of the objectives of scholars and governments.
At present, most scholarly evaluations of landscape sustainability in different regions are dominated by single landscapes or urban landscapes. The methods used mainly include the triangle model [5], the Analytic Hierarchy Process [6], the Analytic Network Process approach [7], the element model [8], principal component analysis [9], emergy analysis [10,11], and information entropy [12,13,14,15,16,17,18]. Information entropy, also known as Shannon entropy, was ever believed to be a generalization of the concept of entropy in thermodynamics, and the application of information entropy in landscape ecology has been very common. Ulanowicz asserted that the entire social organization is a network, but any node in the network is usually indeterminately linked to subsequent nodes, and information entropy can serve as a measure of the uncertainty. Ulanowicz proposed the classification of information entropy into two agonistic parts (ascendency and overhead) [19]. Xu et al. combined this concept with Chinese traditional culture and suggested that maintaining the balance of ascendency and overhead can achieve sustainable development [20]. However, recently, Vranken suggested that Shannon entropy and thermodynamic entropy were only formally parallel, and the thermodynamic basis of their application in landscape ecology was questioned [21]. Exploring landscape composition and configuration is the core issue of landscape sustainability science [4], but Gao et al. found that Shannon entropy considers only probability and not configurational information [22]. For example, as long as two different digital elevation models (DEMs) have the same elevation composition, their Shannon entropy values will be the same even if the spatial distributions are greatly different [23]. Compared with Shannon entropy, Boltzmann entropy is more naturally related to thermodynamic interpretations and characterizes disorder in terms of composition and configuration [23].
According to a recent review [24], there are two mainstream methods for calculating Boltzmann entropy of landscape models as well as an enhancement method: the calculation method for landscape mosaic proposed by Cushman [25,26], the calculation method for landscape gradient (DEM) proposed by Gao et al. [22,23,27], and Nowosad’s improved method addressing the boundary effect problem existing in the method of Gao et al. [28]. The scientific contributions and the novelty of the first two scholars mainly include the following two points: (1) they both linked landscape ecology to the second law of thermodynamics and the entropy concept; (2) they each proposed a solution to calculate the Boltzmann entropy of the landscape model because a good macrostate (the premise of using the Boltzmann equation) is difficult to define, and the number of microstates belonging to a macrostate is difficult to calculate. Nowosad’s scientific contribution is mainly the solution to the problem in which some cells in the landscape gradient may have null values because the boundaries of many actual geographic data are irregular (such as the administrative map of a province). However, the above studies are all theoretical discussions, and there is little work on case studies. Based on the research of Gao et al. and Nowosad, an attempt was made in this paper to link Boltzmann entropy with landscape sustainability through an evaluation matrix, where the landscape sustainability of various landscape types under different natural conditions in the study area was scored, and the Boltzmann entropy values were calculated to reflect the landscape sustainability of the area from a new perspective. The remainder of this article is organized as follows: in Section 2, the basics of the study area are introduced, and the sources of data and research methods are described. In Section 3, a case study was conducted in Mizhi County, Shaanxi Province, and spatial and temporal differentiation results of landscape sustainability from 2000 to 2015 were analyzed. In Section 4, the approach used in this paper is discussed, and the results are summarized in Section 5.
2. Materials and Methods
2.1. Study Area
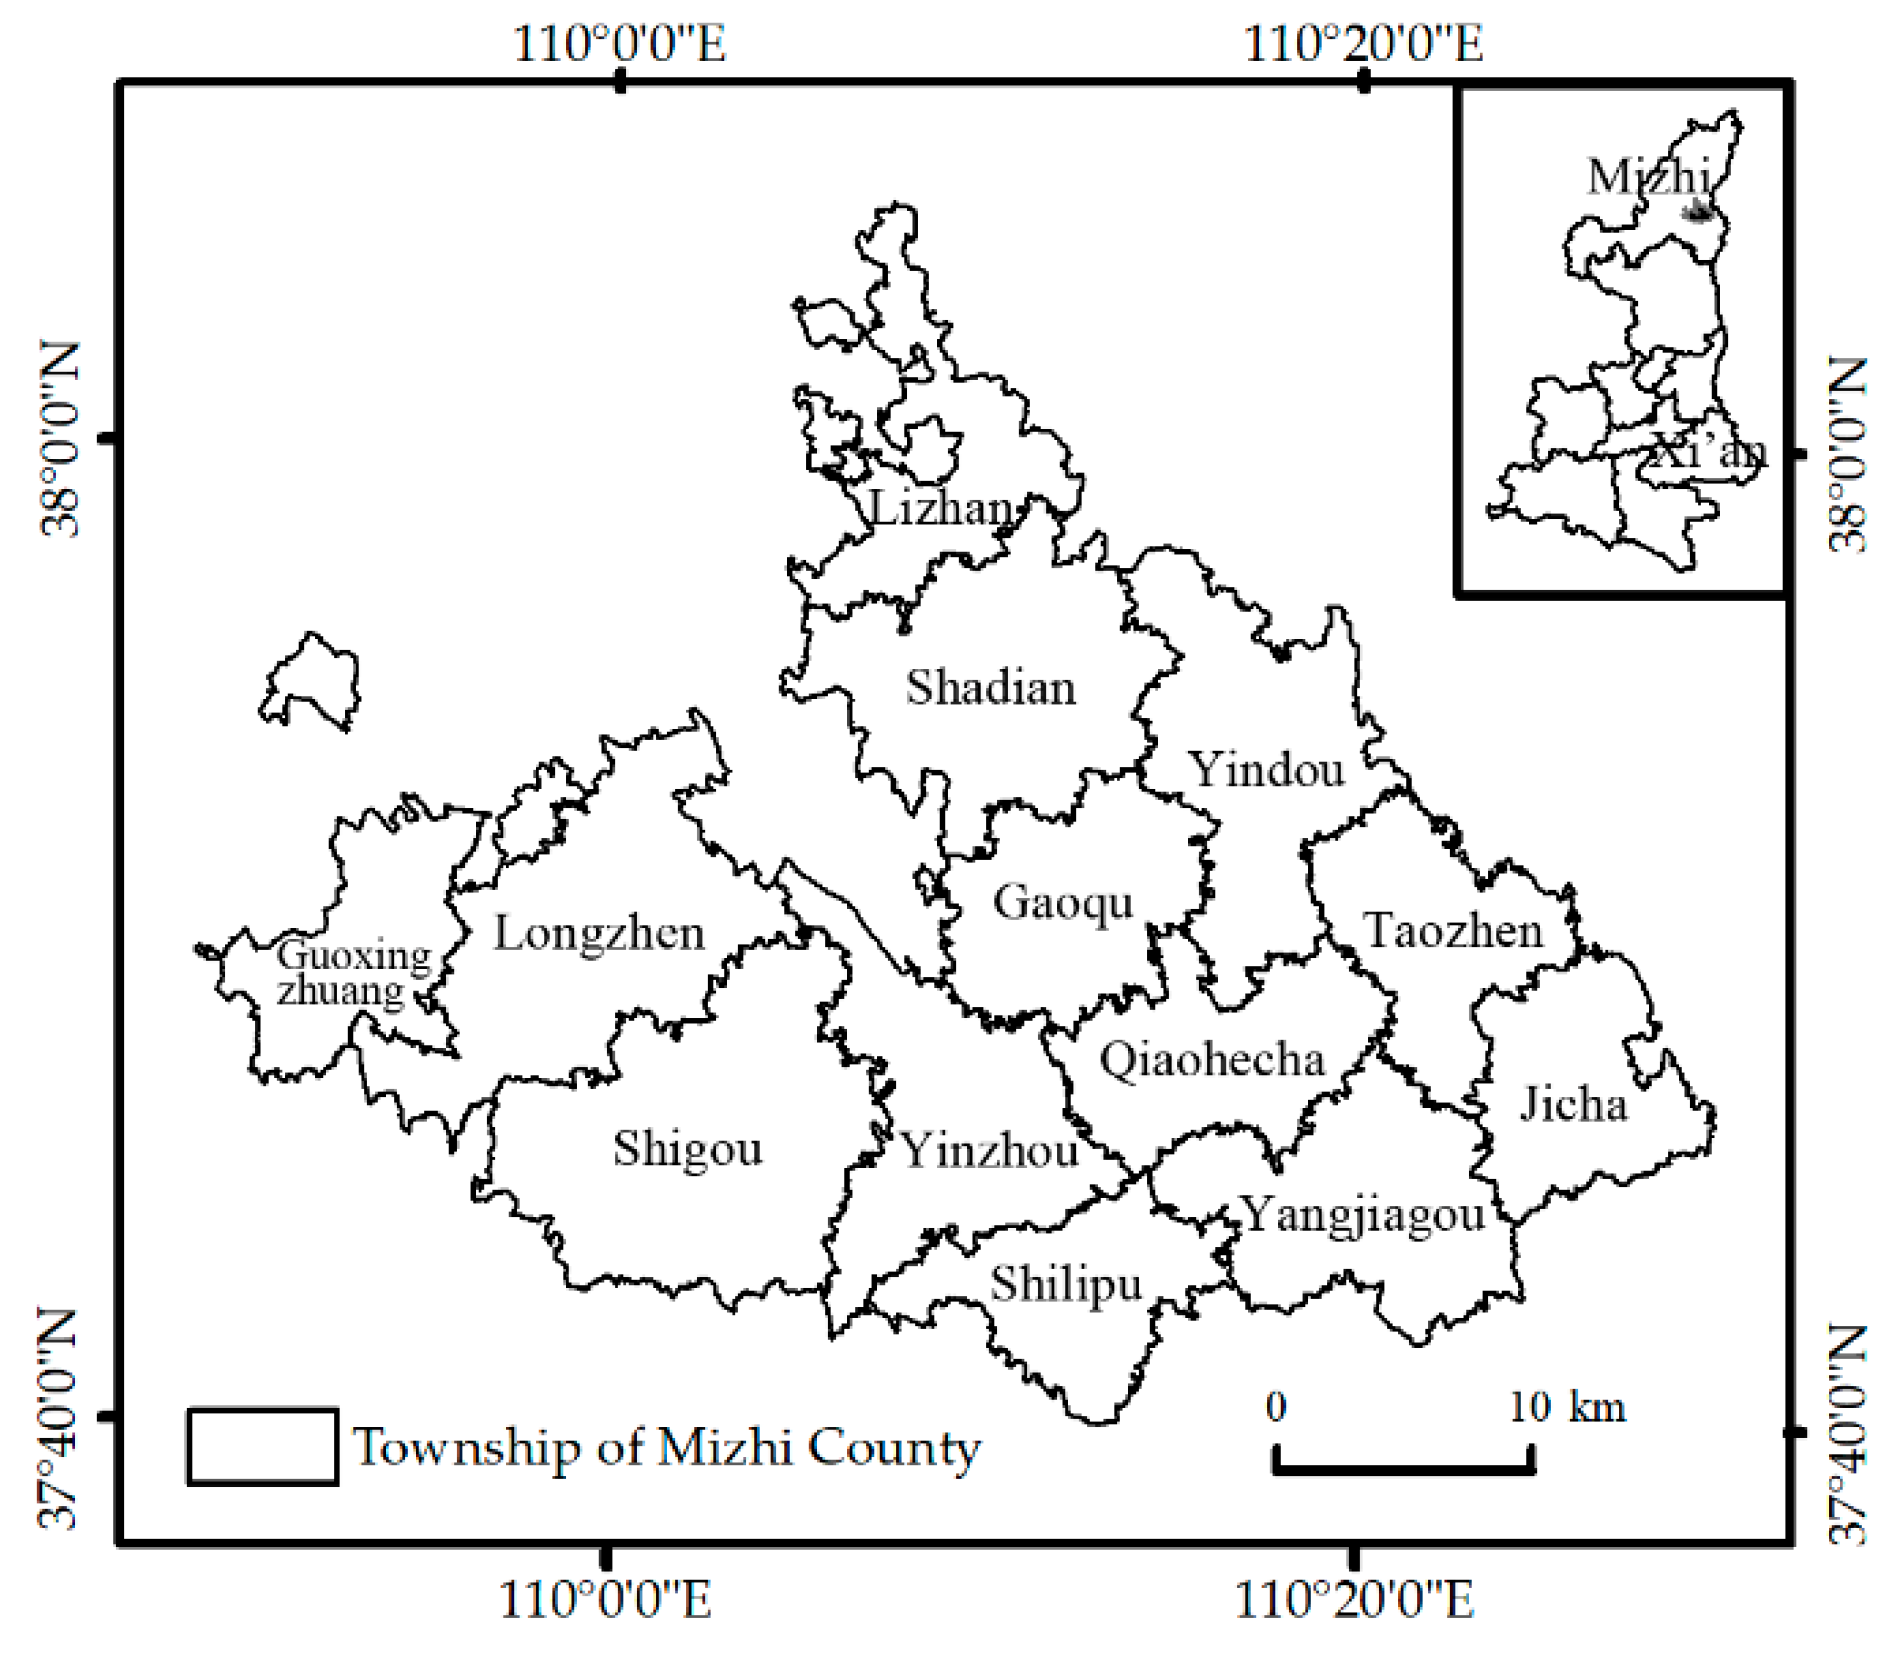
China’s ecologically fragile areas are both ecologically degraded areas and areas of concentrated poverty. Mizhi County is located in the southeastern part of Yulin City, Shaanxi Province, China (Figure 1). This county is within a loess hilly-gully region and is also a highly sensitive, ecologically fragile area [29]. Mizhi County (109°49′E – 110°29′E, 37°39′N – 38°5′N) covers an area of 1212 km2 and has 13 townships (towns). The county is within a moderate temperate semiarid climate zone. The climate is dry, and rainfall is concentrated and insufficient throughout the year [30]. The terrain is generally high in the east and west but low in the middle. Various types of landforms include hills, mountains, ridges, ditches, and plains, and there are 20,378 hills and 16,120 ditches. In this region, the soil is loose, and the surface is fragmented with severe soil erosion [4]. Since the implementation of the “Grain for Green Project” in 1999, Mizhi County has formed a complex and diverse landscape pattern. These conditions provide a good research platform for exploring the landscape sustainability of ecologically fragile areas based on Boltzmann entropy.
2.2. Data Source and Preprocessing
(1) The DEM data of Mizhi County were derived from the Geospatial Data Cloud (http://www.Gscloud.cn/) ASTER GDEM dataset. The spatial resolution of the DEM is 30 m, the grid size is 30 m, and horizontal and vertical accuracy is 30 m and 20 m, respectively. The Hydrologic Analysis tools of ArcGIS 10.2 (Environmental Systems Research Institute, ESRI; Redlands, California, United States.)were used to extract the subbasins of the study area, and a total of 216 subbasins were identified as evaluation units.
(2) The land use map of Mizhi County in 2000 was derived from the remote sensing data obtained by the Landsat Enhanced Thematic Mapper (ETM) + sensor on 29 June 2000. The land use map of Mizhi County in 2015 was derived from the high-resolution image obtained by the Gaofen-1 satellite on 2 July 2015. The images for two years were pre-processed in ENVI 5.1 (Exelis Visual Information Solutions. In 2015 Exelis Visual Information Solutions was purchased by the Harris Corporation; Broomfield, Colorado, United States.) and ArcGIS 10.2 software, including geometry correction, registration and so on. The land use map in 2000 was obtained according to the human–computer interaction visual interpretation method, and the interpretation accuracy was 83.7%. The 2015 land use map was based on the second national land survey data and field survey data, and Supervised Classification (Support Vector Machine) was performed on remote sensing images. With reference to the National Land Use Status Classification Standard (GB/T21010-2017), the second-level land categories were classified into 7 first-level land categories of arable land, woodland, grassland, orchard, construction land, waters, and wasteland, and the land use map of 2015 was obtained. The overall accuracy of the classification results was 86.2%, and the Kappa coefficient was 0.8347.
2.3. Methods
Boltzmann entropy can measure the degree of disorder in the system, and the Boltzmann entropy equation reveals the relationship between macrostates and microstates in thermodynamic systems [31].
where S is the macroscopic entropy of the system, kB (= 1.38×10⁻²³ J/K) is the Boltzmann constant, and Ω is the number of possible microstates belonging to a defined macrostate for the system.
In 2017, Gao et al. proposed defining the results of the original landscape gradient upscaling (resampling) as the macrostate and then using the three parameters of maximum, minimum, and sum of each sliding window as constraints. The number of possible microstates (Ω) is calculated by an iterative algorithm. Finally, this value is inserted into Equation (1) to obtain the Boltzmann entropy of the landscape gradient [22].
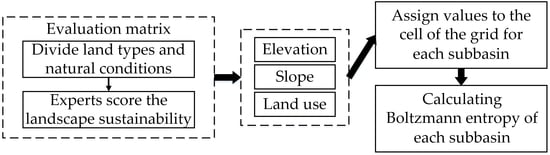
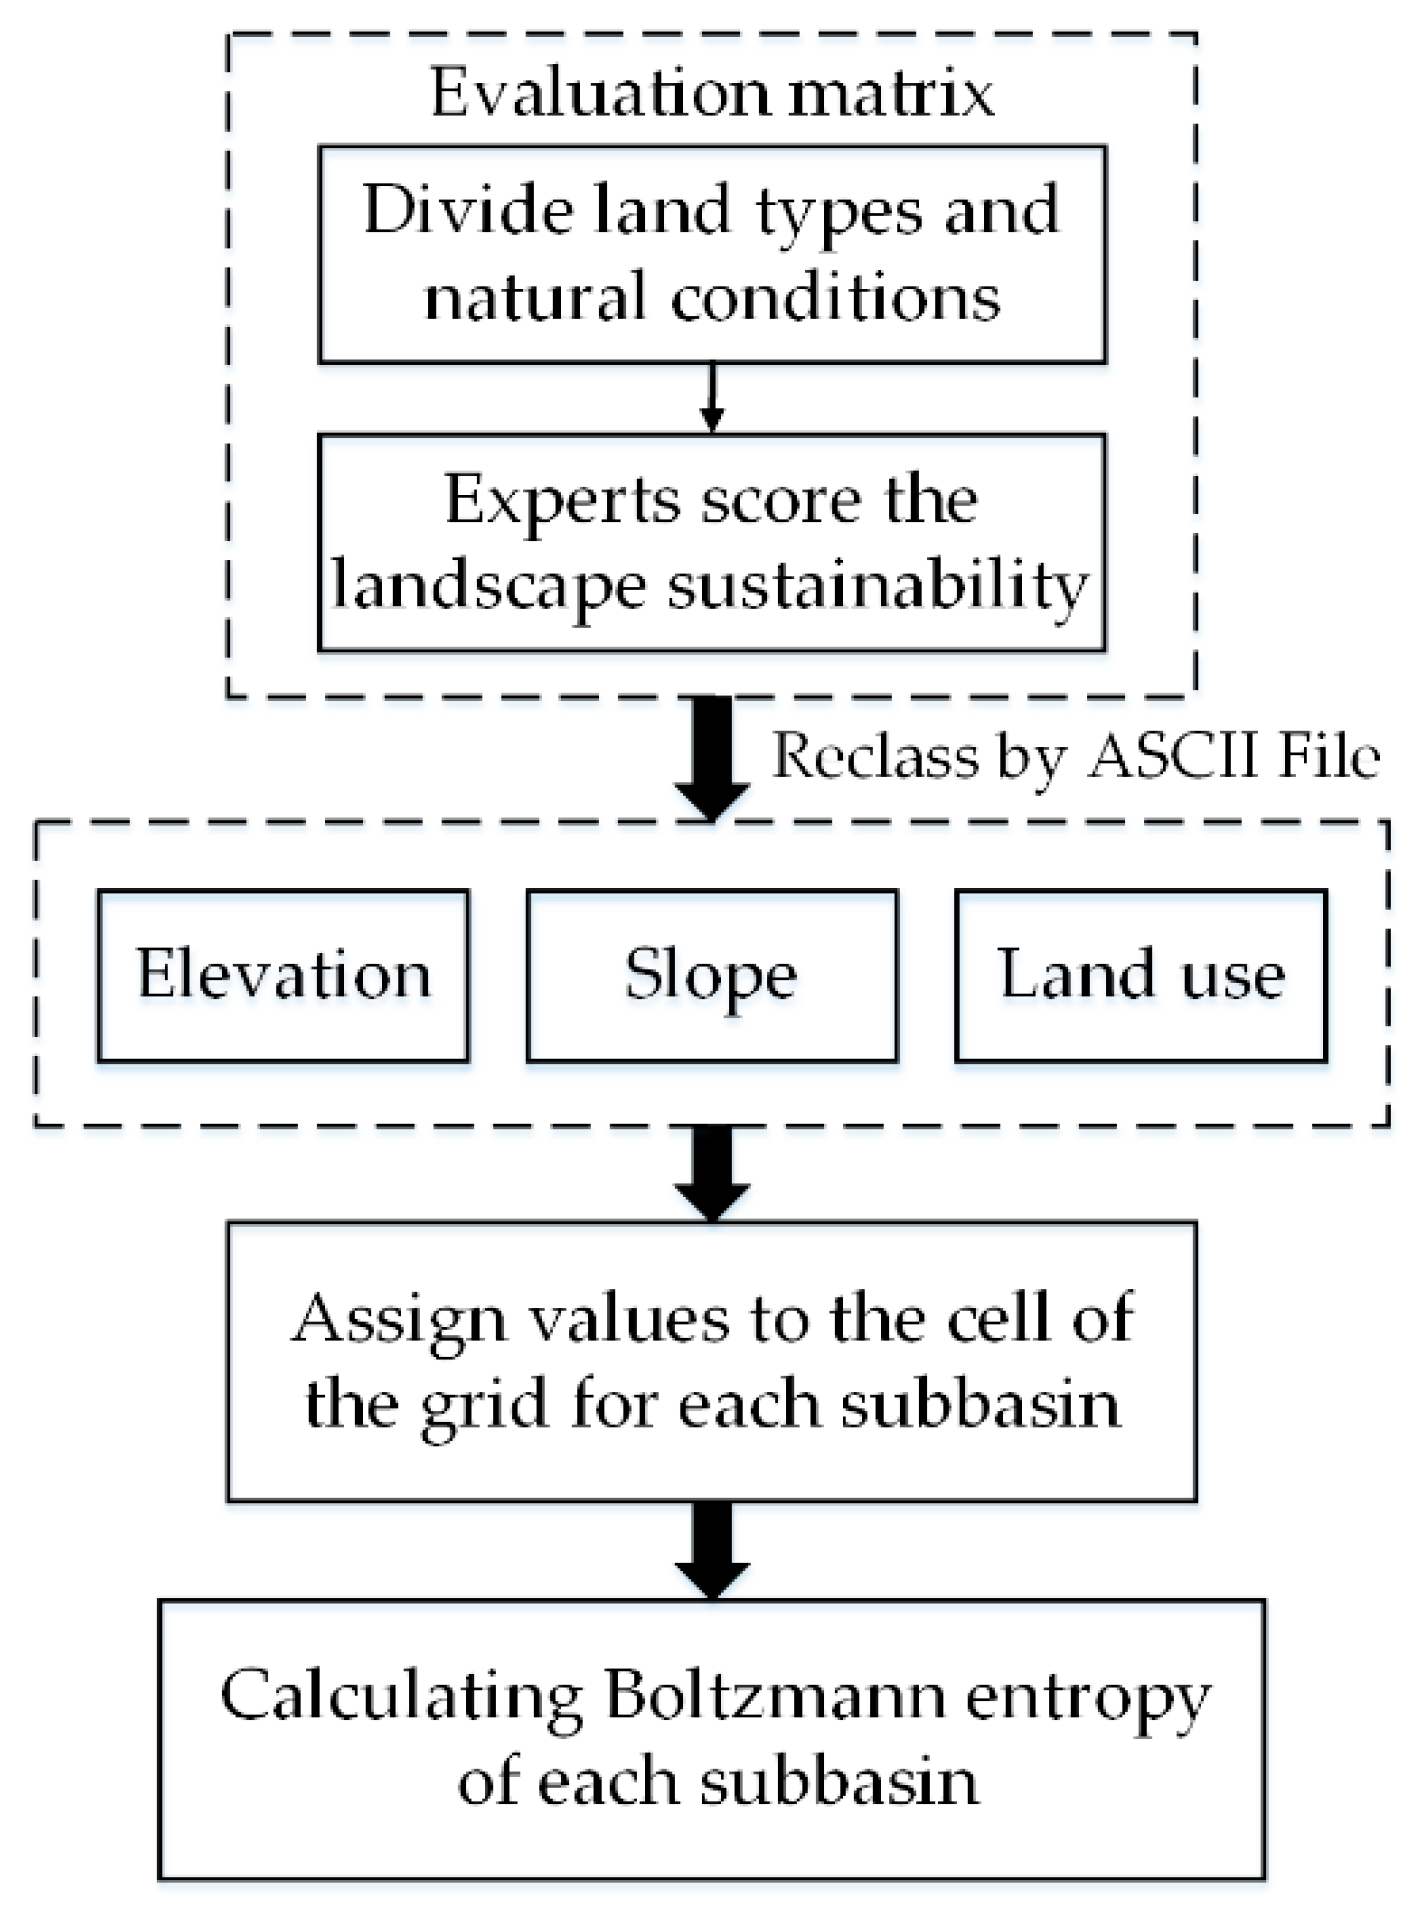
Based on the research by Gao et al., this paper proposes the following method (Figure 2): first, the scoring results of the landscape sustainability of the study area are obtained through the evaluation matrix method (Table 1). Second, in ArcGIS 10.2, the Slope tool from the 3D Analyst tools is used to extract the slope of DEM in Mizhi County and overlay elevation, slope, and land use data. The Reclass by ASCII File tool is used to assign values according to the results of the evaluation matrix so that each raster value of the overlay data is the score of landscape sustainability at the current elevation, slope, and land use type. Elevation is divided into 3 categories, slope is divided into 3 categories, land use is divided into 7 categories, and 63 categories of combinations are generated through overlay. Third, the Fishnet tool is used to generate a 30 × 30 grid for each subbasin (i.e., each grid contains 30 rows x 30 columns; the number of cells per grid is 900), and each grid can completely contain the range of each subbasin. There may be three cases in the cell: (1) the cell contains no corresponding raster value; (2) the cell contains a raster value; (3) the cell contains multiple raster values. Each cell is assigned a value according to the conditions in the cell. In case (1), the cell is defined as NA [28]. In case (2), the corresponding raster value is assigned to the cell. In case (3), the value of the raster with the largest area in the cell is assigned to the cell, and each cell has one and only one value. Finally, the software package developed by Nowosad [28] is used to calculate the Boltzmann entropy of the grid corresponding to each subbasin in the RGui3.6.0 environment (R was created by Ross Ihaka and Robert Gentleman at the University of Auckland, New Zealand, and is currently developed by the R Development Core Team.).
Eleven experts in the research field were invited to score the landscape sustainability of Mizhi County and obtain evaluation matrix results, including one director from the Mizhi County Agriculture Bureau, two village heads in Mizhi County, and two ecological experts. The other six experts are scholars familiar with the landscape features of the study area. According to the existing land use data, the land types of Mizhi County were divided into seven categories: arable land, woodland, grassland, orchard, construction land, waters, and wasteland. The elevation was divided into three categories—low elevation (<994 m), medium elevation (994–1078 m), and high elevation (>1078 m)—according to the natural discontinuity grading method (Jenks) in ArcGIS 10.2 software [32]. Based on the theory of slope grading in the loess hilly-gully region [33] combined with the actual situation in Mizhi County, the slope was divided into low slope (<8°), medium slope (8°–25°), and high slope (>25°). The elevation and the slope were combined into nine natural conditions: low elevation low slope, low elevation mid-slope, low elevation high slope, mid-elevation low slope, mid-elevation mid-slope, mid-elevation high slope, high elevation low slope, high elevation mid-slope, and high elevation high slope.
3. Results
3.1. The Results of the Experts’ Grading Method
Based on a landscape sustainability score from weak to strong, the scores range from 1 to 10, and the results are shown in Table 1.
For the seven types of land use in Mizhi County at different elevations and slopes, the positive value of landscape sustainability was scored, with 10 points indicating the most favorable for landscape sustainability and one point indicating the least favorable. As a rural ecosystem, decision-makers in Mizhi County must consider the integrity and the continuity of various ecological processes [34], emphasizing the self-regulating function and the ecological value of the ecosystem. Therefore, the land use type that is favorable to the ecological environment and directly beneficial to farmers has a higher score, whereas land use types without such benefits are assigned lower scores. Table 1 shows the following information:
(1) The scores of the seven land use types in the study area are obviously different, but their variability under different natural conditions is not high, indicating that the land use types have a greater impact on the sustainability of the landscape than the natural conditions.
(2) Among the land use types, waters have the highest scores. The reason is that Mizhi County is located in arid and semiarid areas of inland China. The area lacks water year-round, and waterbodies such as rivers, ditches, and reservoirs can provide irrigation, thus the water areas have a strong positive value under any natural conditions. The scores of woodland and orchard are similar, and both are assigned a sub-high value. The pesticides sprayed in the orchard cause the score of the orchard to be slightly lower than that of the woodland. Although grassland can play a positive role in soil and water conservation, it is vulnerable to damage in Mizhi County (such as potential overgrazing, etc.), thus the score assigned to grassland is a medium value; construction land and arable land are assigned a sub-low value because human activities are more frequent on construction land, which is likely to cause ecological damage. The situation of arable land is unique. Only the “low elevation low slope” type is assigned higher scores. Under other natural conditions, the scores are lower, thus the score of arable land is assigned a sub-low value. The land use type with the lowest value—wasteland—is basically unable to support landscape sustainability in Mizhi County.
In general, the scores of land use types on low slopes are generally higher because soil erosion on the Loess Plateau is serious, areas with high slopes are not conducive to agricultural activities, and the risk of soil erosion is high. At the same elevation, the landscape sustainability score decreases as the slope increases. Under the nine natural conditions, the “low elevation low slope” is the optimal condition. Except for wastelands, the scores of the other six land use types are high in their own categories. However, in the case of optimal natural conditions, the wasteland can provide the weakest support for landscape sustainability; thus, the score is the lowest. In the case of high elevation, on the one hand, the accessibility of various types of land use is deteriorated, and agricultural production activities are difficult to implement, thus the scores of arable land and construction land are low. On the other hand, due to the weakening of human disturbance, the ecological functions of woodland, grassland, and orchard are enhanced; therefore, the score is higher.
3.2. The Results of Landscape Sustainability
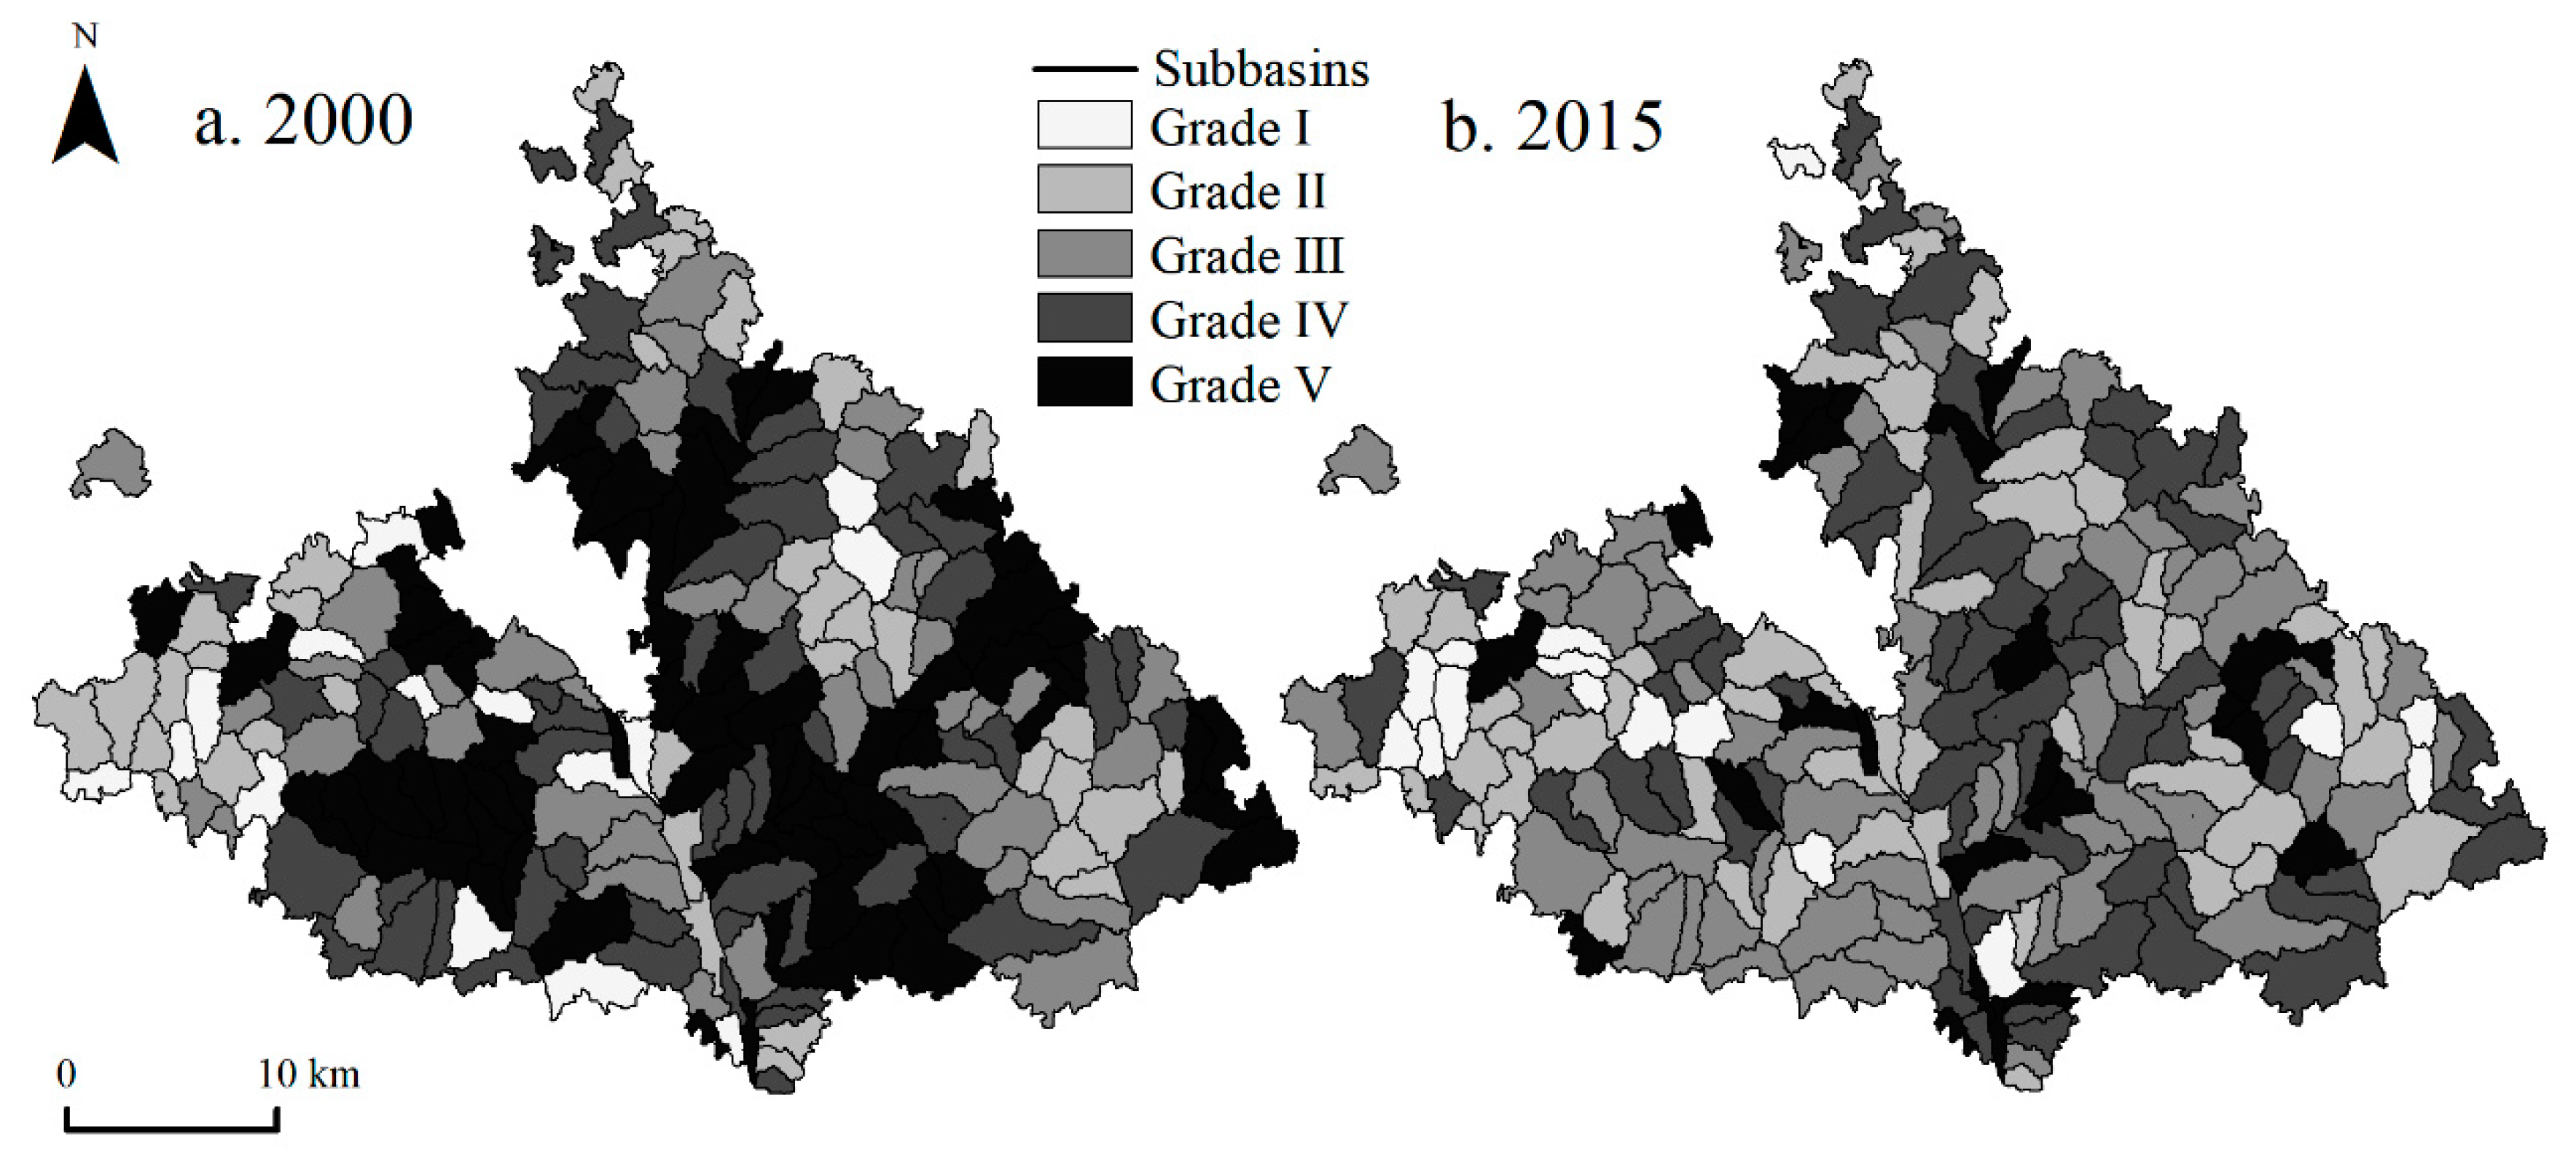
The score in the evaluation matrix represents landscape sustainability. This score is assigned to the raster first and then to the cells; therefore, the value of each cell can directly reflect the landscape sustainability. The landscape sustainability of each subbasin is quantified as the value of the Boltzmann entropy of the corresponding grid in each subbasin after the min–max normalization. The landscape sustainability values of 2000 and 2015 were calculated for 216 subbasins in Mizhi County, and the sustainability was classified into five levels according to the natural discontinuity grading method (Jenks) in ArcGIS 10.2 software [32]. The higher the grade was, the worse the landscape sustainability would be. The results in 2000 were unified under the grading standards of 2015 to ensure the comparability of the timing sequence; the results are shown in Figure 3.
3.2.1. Spatiotemporal Difference in Landscape Sustainability in Mizhi County from 2000 to 2015
Figure 3 shows that the spatiotemporal differentiation of landscape sustainability in Mizhi County from 2000 to 2015 is considerable with a trend of overall improvement. The region of Grade V landscape sustainability shows the greatest change, and the Grade I region remains basically unchanged. In both 2000 and 2015, the landscape sustainability of the mid-eastern section of the study area was worse than that in other areas.
Figure 3a shows that the overall landscape sustainability was poor in Mizhi County in 2000, where the regions of Grade IV and Grade V are more contiguous, and the Grade I regions are the least sporadic. There are 67 subbasins with the worst landscape sustainability (Grade V), accounting for 31.81% of the total study area, with the largest proportion mainly distributed in the eastern, the mid-eastern, and the mid-western parts of Mizhi County. There are 57 subbasins of Grade IV, accounting for 26.96% of the total study area, and these subbasins are distributed along the periphery of the Grade V area. There are 40 subbasins of Grade III scattered in the study area, accounting for 20.09% of the total study area. There are 37 subbasins of Grade II, accounting for 14.79% of the total study area, which are mainly distributed in the eastern, the northeastern, and the western parts of Mizhi County; due to the large forest and the grassland coverage in these areas as well as the small population density and the separation of settlements, humans have less ability to interfere with rural ecosystems, and thus the landscape sustainability is stronger. There are 15 subbasins with the best landscape sustainability (Grade I), accounting for the smallest part of the total study area at only 6.35%. In general, the landscape sustainability values in the central, the eastern, and the mid-western regions of Mizhi County in 2000 were poor.
According to Figure 3b, the landscape sustainability of Mizhi County shows a better trend in 2015 than in 2000, especially the landscape sustainability in the mid-western area of Mizhi County, which has been greatly improved. There are 23 subbasins in Grade V, accounting for 8.29% of the total study area. During the study period, the landscape sustainability of most subbasins changed from Grade V to Grade III or Grade IV, and landscape sustainability was promoted. There are 61 subbasins of Grade IV, accounting for 30.32% of the total study area, which are mainly distributed in the central and the southern regions, indicating that the landscape sustainability in the central part of Mizhi County increased during the study period. There are 64 subbasins of Grade III, accounting for 32.30% of the total study area. This proportion is the largest and is considerably different from that in 2000. Grade III is evenly distributed in the study area, illustrating that the landscape sustainability of the study area is better overall. There are 52 subbasins of Grade II, accounting for 23.39% of the total study area. There are 16 subbasins of Grade I, accounting for 5.70% of the total study area. Compared with 2000, there is no increase in area in 2015, but Grade I is concentrated to the west in terms of spatial distribution.
3.2.2. Changes in Landscape Sustainability in Mizhi County from 2000 to 2015
Based on the transition matrixes of landscape sustainability, the change in the number and the area of each grade in the subbasins can be obtained. Table 2 and Table 3 show that, in addition to self-transformation, there are also nine grades of increased sustainability and nine grades of decreased sustainability. In 2000, with the increase in the grade of landscape sustainability, the number of corresponding subbasins also gradually increased, and the number of subbasins of Grade V was the largest, showing that basins with poor sustainability in Mizhi County were dominant during that year. In 2015, the numbers of subbasins with the best (Grade I) and the worst (Grade V) landscape sustainability values were low, while the numbers of subbasins at Grade II, Grade III, and Grade IV were higher. During the research period, the number of subbasins at Grade I and Grade IV remained stable, the number of subbasins at Grade V decreased by 44, and the area decreased by 285.21 km2, while the number of subbasins at Grade II and Grade III increased by 15 and 24, respectively, and their area increased by 104.20 km2 and 148.03 km2, respectively, suggesting that the landscape sustainability of Mizhi County showed an improving trend overall.
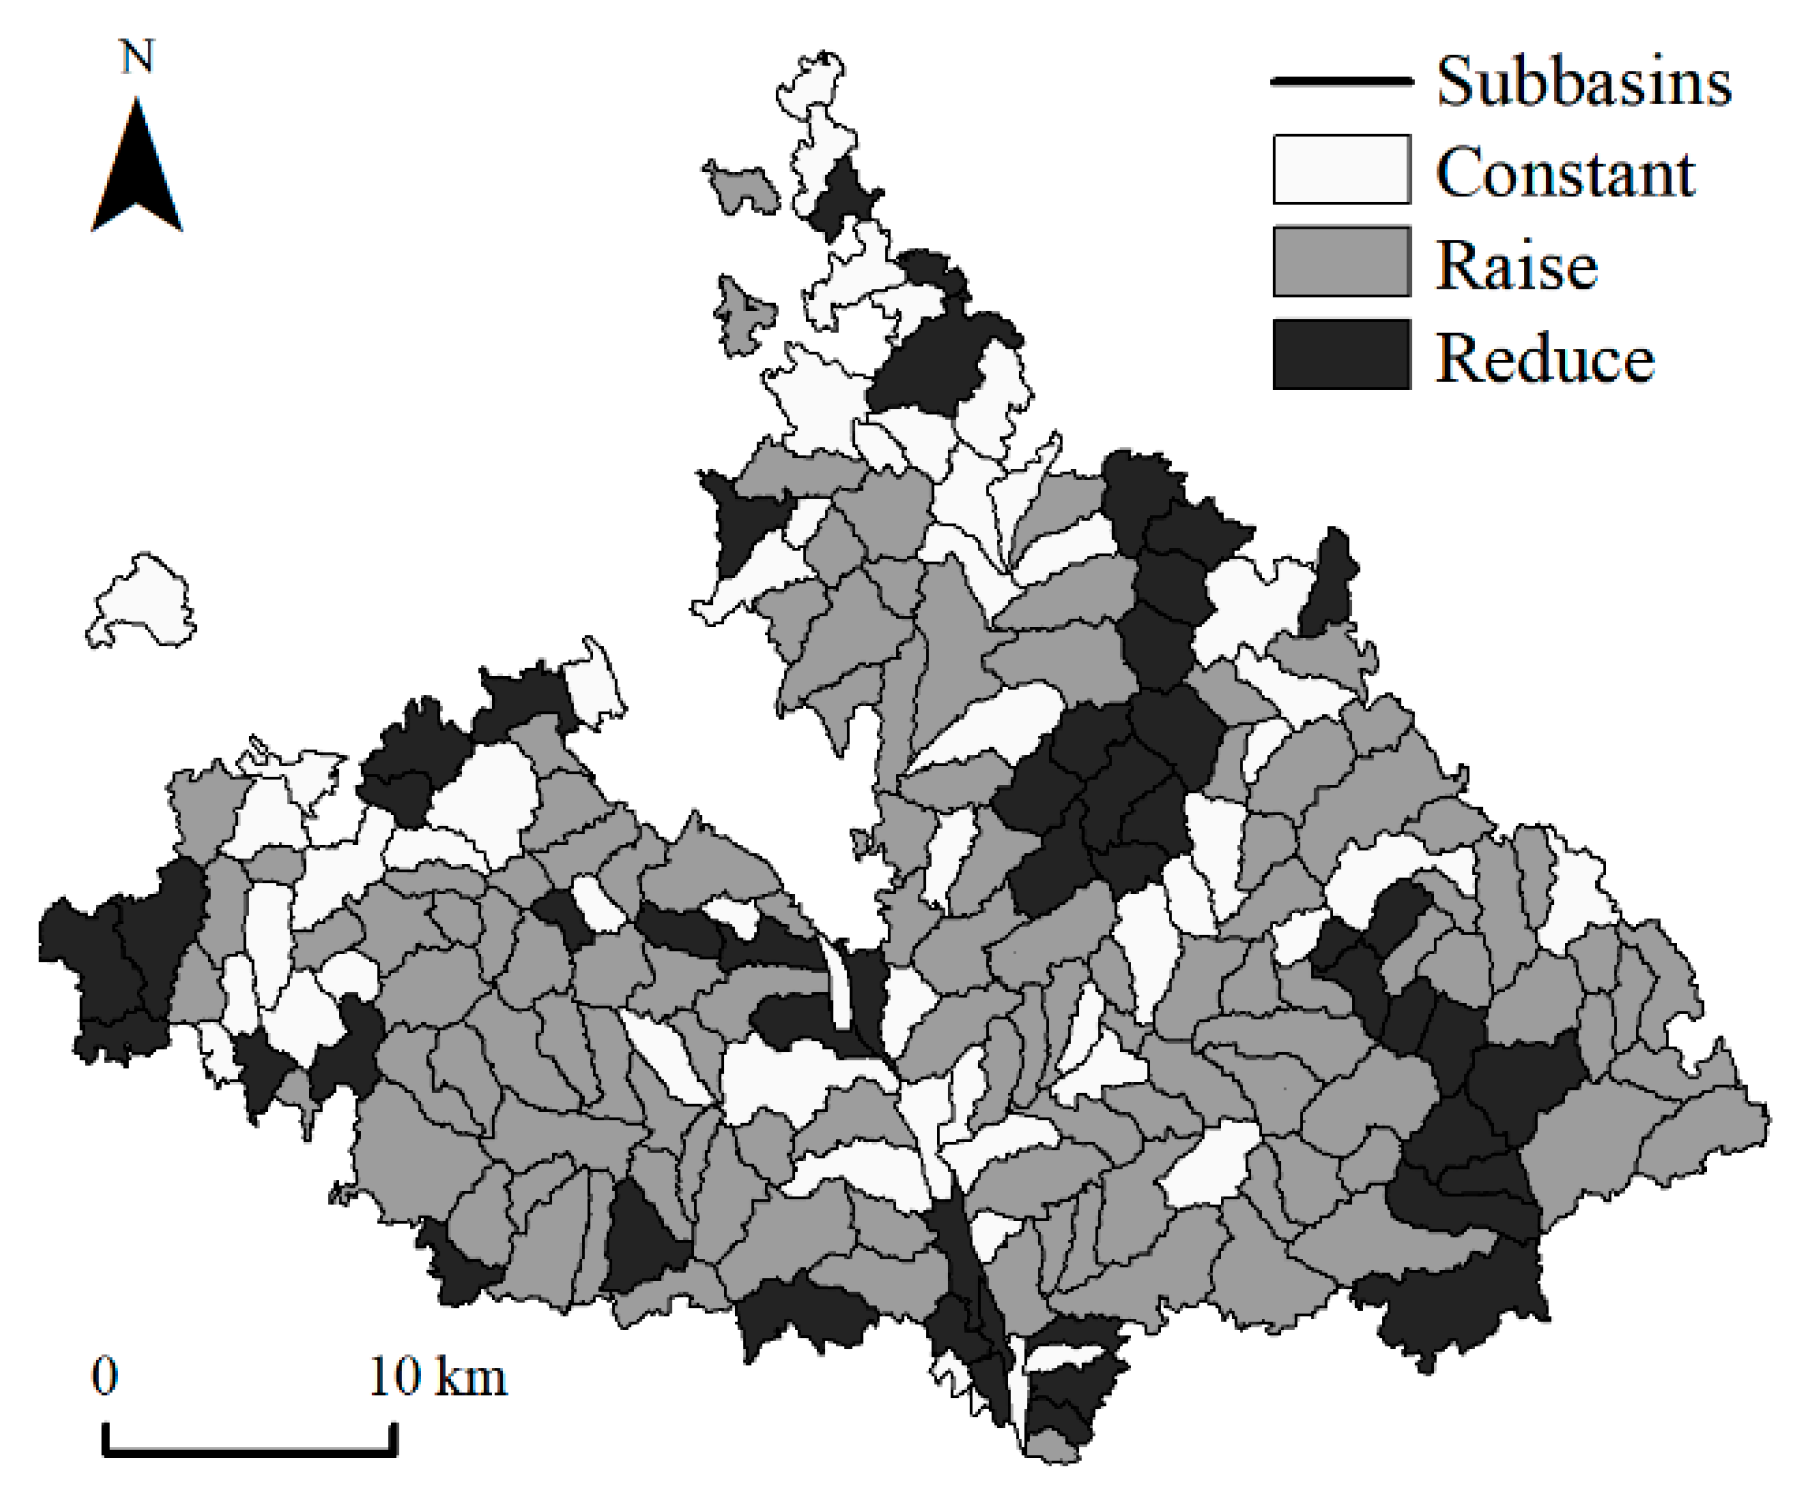
Figure 4 shows the changes in landscape sustainability levels in 216 subbasins in Mizhi County from 2000 to 2015. The landscape sustainability of 113 subbasins improved (i.e., reduced grade), with an area ratio of 55.47% evenly distributed in the study area, and most of these subbasins are contiguous, indicating that, during 2000–2015, more than half of the study area’s landscape sustainability was improved. There are 54 subbasins with nearly unchanged landscape sustainability (i.e., grade maintenance), accounting for 22.70% of the area. This area is roughly distributed in the east-west direction in the middle of the study area as well as a small cluster in the northern part of the study area. The landscape sustainability of 49 subbasins became weaker (i.e., elevated grade) with an area ratio of 21.83%; these subbasins are scattered throughout the study area. However, there are agglomerations in the western, the central, and the southeastern parts of the study area, showing that the landscape sustainability of approximately one-fifth of the area in Mizhi County deteriorated during the study period.
In terms of spatial distribution, the landscape sustainability values in the eastern and the western parts of Mizhi are stronger than those in the central areas. At the temporal level, the landscape sustainability in the mid-western regions increased significantly. Landscape sustainability in the northern and the northeastern regions also improved. Although the landscape sustainability in the central region was inferior compared to that in other regions, it did increase to some extent during 2000–2015. In addition, the landscape sustainability of the three townships of Taozhen, Shadian, and Shigou improved during the study period, which is consistent with the field research of the research group. Due to the vigorous implementation of the “Grain for Green Project” in these townships during 1999–2009, soil and water conservation capacity improved. Additionally, the reduction in arable land led to population outflow, and the ecological disturbance caused by people weakened, further contributing to the improved sustainability of these townships. In the central part of Mizhi County, because it has always been a population center, the central area is greatly disturbed by people, thus landscape sustainability is poor. However, according to the results of field research, as farmer awareness of the means of protecting the ecological environment has gradually enhanced, the landscape sustainability in the area has also increased slightly.
4. Discussion
This study on the landscape sustainability of 216 subbasins in Mizhi County in 2000 and 2015 reveals that the overall trend of landscape sustainability has temporally and spatially improved. The results are consistent with the field research, which demonstrates that the method proposed in this paper—using the results of the evaluation matrix to assign values to subbasins and calculate the Boltzmann entropy of the subbasins—is effective. The selection of a subbasin as the evaluation unit can maximize the guarantee of natural elements, process similarity [35], and the integrity of the landscape ecosystem within the unit. Notably, the research of Gao et al. [22] demonstrated that the dimension of the cell directly affects the value of the Boltzmann entropy. Therefore, in this paper, a 30 × 30 grid was generated for each subbasin (i.e., each grid contained 30 rows x 30 columns; the number of cells per grid was 900) according to the sizes of the subbasin to ensure that the Boltzmann entropy of the subbasins in the same year would be comparable.
Gao et al. calculated the Boltzmann entropy of DEM in a certain area to reflect the disorder and the complexity of the landscape in this region. To allow Boltzmann entropy to provide more information, this paper uses the overlay data of elevation, slope, and land use and assigns the result of the evaluation matrix to the overlay data. The Boltzmann entropy calculated using this method can be related to landscape sustainability. Expert grading is a key part of this research, and the results will directly affect the results of the Boltzmann entropy. Therefore, experts who score the actual situations and particularities in the study area must be professionals who are very familiar with the study area. The advantage of the evaluation matrix is that it can flexibly increase and decrease natural conditions and landscape types according to the research contents. The non-portability of the evaluation matrix (Table 1) is a limitation of this article, but it provides ideas and methods for studying the relationship between landscape sustainability and Boltzmann entropy.
5. Conclusions
This article explores the quantitative relationship between Boltzmann entropy and landscape sustainability based on previous research on landscape Boltzmann entropy. The paper proposes a method for evaluating landscape sustainability based on Boltzmann entropy using an evaluation matrix, providing a new approach to landscape sustainability assessment. This approach applies the theoretical concept of the study of landscape Boltzmann entropy to solve practical problems. In addition, there are few studies on the sustainability evaluation of diverse landscape types under different natural conditions, and the evaluation matrix can include a variety of natural conditions and landscape types. Mizhi County, Shaanxi Province, China, is a typical study area within the loess hilly-gully region and is a highly sensitive, ecologically fragile area. Evaluating the sustainability of this ecologically fragile area can provide targeted information to support its sustainable development.
Author Contributions
Conceptualization, X.L. and H.C.; Formal analysis, J.X.; Funding acquisition, X.L. and H.C.; Methodology, J.X. and X.L.; Resources, X.L.; Validation, J.X.; Writing – original draft, J.X.; Writing – review & editing, J.X., X.L. and H.C. All authors have read and agreed to the published version of the manuscript.
Funding
This work was supported by the National Natural Science Foundation of China (Grant Nos. 41671086 & 41971271), and the APC was funded by Grant No. 41671086.
Conflicts of Interest
The authors declare that they have no conflicts of interest.
References
- Kates, R.W.; Clark, W.C.; Corell, R.; Hall, J.M.; Jaeger, C.C.; Lowe, I.; Mccarthy, J.J.; Schellnhuber, H.J.; Bolin, B.; Dickson, N.M. Environment and development. Sustainability science. Science 2001, 292, 641–642. [Google Scholar] [CrossRef] [PubMed]
- Wu, J. Landscape sustainability science: Ecosystem services and human well-being in changing landscapes. Landsc. Ecol. 2013, 28, 999–1023. [Google Scholar] [CrossRef]
- Wu, J.; Guo, X.; Yang, J.; Qian, G.; Niu, J.; Liang, C.; Zhang, Q.; Li, A. What is sustainability science? Chin. J. Appl. Ecol. 2014, 25, 1–11. [Google Scholar] [CrossRef]
- Zhao, W.; Fang, X. Landscape sustainability and landscape sustainability science. Acta Ecol. Sin. 2014, 34, 2453–2459. [Google Scholar] [CrossRef]
- Li, J.; Lei, G.; Cui, M.; Wang, W.; Jiang, L.; Zhang, J.; Zhang, P. Evaluation of Mining-oriented Urban Land Use Sustainability Based on Triangle Model. ISWCR 2012, 05, 196–201. [Google Scholar]
- Zhang, Y.; Wang, R.; Zhang, J.; Liu, J. Evaluation of ecosystem sustainability for large-scale constructed wetlands. Acta Ecol. Sin. 2012, 32, 4803–4810. [Google Scholar] [CrossRef] [Green Version]
- Lei, X.; Wen, C. Sustainable development strategy of rural built-up landscapes in Northeast China based on ANP approach. Energy Procedia 2019, 157. [Google Scholar] [CrossRef]
- Ling, H.; Xu, H.; Fan, Z.; Zhang, Q. Assessment of Oasis Land Use Sustainability in the Manas River Basin, Xinjiang, China. J. Desert Res. 2012, 32, 872–877. [Google Scholar]
- An, H.; Zhang, L. Quantitative evaluation of sustainable development for resource-exhausted cities: A case study of Huangshi city and Qianjiang city. China Min. Mag. 2017, 26, 128–133. [Google Scholar]
- Sun, Y.; Cheng, Q.; Li, Y.; Fu, J. Assessment of eco-economic system sustainable development of Liaoning Province based on energy analysis. Chin. J. Appl. Ecol. 2014, 25, 188–194. [Google Scholar] [CrossRef]
- Wang, P.; Liu, X.; Yao, X.; Chen, X.; Kong, F. Evaluation of Sustainable Development of Ningxia Ecological Economic System Based on Emergy Analysis. Ecol. Econ. 2018, 34, 70–73. [Google Scholar]
- Zhang, Y.; Yang, Z.; He, M.; Hu, T. Analyses on evolution of urban complex ecosystem based on information entropy. Acta Sci. Circumst. 2005, 25, 1127–1134. [Google Scholar] [CrossRef]
- Lin, Z.; Xia, B. Analysis of sustainable development ability of the urban ecosystem in Guangzhou City in the perspective of entropy. Acta Geogr. Sin. 2013, 23, 417–435. [Google Scholar] [CrossRef]
- Jia, H.; Chen, H.; Mao, N.; Nie, X. Landscape sustainable development in highly sensitive ecological fragile areas. Res. Sci. 2018, 40, 1277–1286. [Google Scholar] [CrossRef] [Green Version]
- Di, Q.; Han, Y. Sustainable Development Ability of China′s Marine Ecosystem in the Perspective of Entropy. Sci. Geogr. Sin. 2014, 34, 664–671. [Google Scholar] [CrossRef]
- Sun, X. Research on Land Use Change and Landscape Sustainable in Yan’an City Under the Background of Ecological Restoration. J. Northeast Agric. Univ. 2017. [Google Scholar]
- Wu, Y.; Liao, L.; Yuan, X. Evolution of Wuhan Urban Complex Ecosystem Based on Information Entropy. Resour. Environ. Yangtze Basin 2013, 22, 21–26. [Google Scholar]
- Zhu, L. Evolutional analysis of social, environmental and economic development of Guangzhou (1978–2003) by using entropy theory. Ecol. Environ. 2008, 1, 411–415. [Google Scholar] [CrossRef]
- Ulanowicz, R.E. Information Across the Ecological Hierarchy. Entropy 2019, 21, 949. [Google Scholar] [CrossRef] [Green Version]
- Xu, Z.; Cheng, G.; Ulanowicz, R.E.; Song, X.; Deng, X.; Zhong, F. The common developmental road: Tensions among centripetal and centrifugal dynamics. Nat. Sci. Rev. 2018, 5, 417–426. [Google Scholar] [CrossRef] [Green Version]
- Vranken, I.; Baudry, J.; Aubinet, M.; Visser, M.; Bogaert, J. A review on the use of entropy in landscape ecology: Heterogeneity, unpredictability, scale dependence and their links with thermodynamics. Landsc. Ecol. 2015, 30, 51–65. [Google Scholar] [CrossRef] [Green Version]
- Gao, P.; Zhang, H.; Li, Z. A hierarchy-based solution to calculate the configurational entropy of landscape gradients. Landsc. Ecol. 2017, 32, 1133–1146. [Google Scholar] [CrossRef]
- Gao, P.; Zhang, H.; Li, Z. An efficient analytical method for computing the Boltzmann entropy of a landscape gradient. Trans. GIS 2018, 22, 1046–1063. [Google Scholar] [CrossRef]
- Gao, P.; Li, Z. Computation of the Boltzmann entropy of a landscape: A review and a generalization. Landsc. Ecol. 2019, 34, 2183–2196. [Google Scholar] [CrossRef]
- Cushman, S.A. Calculating the configurational entropy of a landscape mosaic. Landsc. Ecol. 2016, 31, 481–489. [Google Scholar] [CrossRef]
- Cushman, S.A. Calculation of configurational entropy in complex landscapes. Entropy 2018, 20, 298. [Google Scholar] [CrossRef] [Green Version]
- Gao, P.; Li, Z. Aggregation-based method for computing absolute Boltzmann entropy of landscape gradient with full thermodynamic consistency. Landsc. Ecol. 2019, 34, 1837–1847. [Google Scholar] [CrossRef]
- Nowosad, J. The Comprehensive R Archive Network. Available online: https://lib.ugent.be/CRAN/web/packages/belg/vignettes/belg1.html (accessed on 16 June 2018).
- Liu, J.; Zou, C.; Gao, J.; Ma, S.; Wang, W.; Wu, K.; Liu, Y. Location determination of ecologically vulnerable regions in China. Biodivers. J. 2015, 23, 725–732. [Google Scholar] [CrossRef] [Green Version]
- Liu, D.; Liang, X.; Chen, H.; Zhang, H.; Mao, N. A Quantitative Assessment of Comprehensive Ecological Risk for a Loess Erosion Gully: A Case Study of Dujiashi Gully, Northern Shaanxi Province, China. Sustainability 2018, 10, 3239. [Google Scholar] [CrossRef] [Green Version]
- He, X.; He, K. Differentiate and Analyse of Information Entropy and Extension Alization of Entropy. J. Inf. 2006, 12, 109–112. [Google Scholar] [CrossRef]
- Zhang, H.; Liang, X.; Liu, D.; Shi, Q.; Chen, H. The resilience evolution and scenario simulation of social-ecological landscape in the fragile area. Acta Geogr. Sin. 2019, 74, 1450–1466. [Google Scholar] [CrossRef]
- Zhao, M.; Tang, G.; Chen, Z.; Zhu, H. Slope Classification Systems and Their Slope Spectrum in Hill and Gully Area of the Loess Plateau. Bull. J. Soil Water Conserv. 2002, 4, 33–36. [Google Scholar] [CrossRef]
- Yun, W.; Yu, Z. Ecological landscaping strategy of rural land consolidation in China. Trans. CSAE 2011, 27, 1–6. [Google Scholar] [CrossRef]
- Cao, Q.; Zhang, X.; Ma, H.; Wu, J. Review of landscape ecological risk and an assessment frameworkbased on ecological services: ESRISK. Acta Geogr. Sin. 2018, 73, 843–855. [Google Scholar] [CrossRef]
Figure 1.
Location of the study area.

Figure 2.
Method flow chart.

Figure 3.
Spatial distribution of landscape sustainability in Mizhi during 2000–2015.

Figure 4.
Landscape sustainability grade changes in Mizhi.


Table 1.
The evaluation matrix of landscape sustainability in Mizhi (1–10 score).
| Based on Elevation, Slope and Land Use | Arable Land | Wood- Land | Grass- Land | Orchard | Construction Land | Waters | Waste- Land |
|---|---|---|---|---|---|---|---|
| Low elevation low slope | 8 | 10 | 6 | 10 | 5 | 10 | 1 |
| Low elevation mid-slope | 3 | 8 | 6 | 7 | 4 | 10 | 2 |
| Low elevation high slope | 2 | 7 | 5 | 6 | 3 | 10 | 3 |
| Mid-elevation low slope | 5 | 9 | 6 | 8 | 6 | 10 | 2 |
| Mid-elevation mid-slope | 3 | 8 | 4 | 7 | 5 | 10 | 3 |
| Mid-elevation high slope | 2 | 8 | 3 | 7 | 3 | 10 | 3 |
| High elevation low slope | 4 | 9 | 7 | 8 | 5 | 10 | 2 |
| High elevation mid-slope | 2 | 7 | 6 | 6 | 4 | 10 | 3 |
| High elevation high slope | 1 | 6 | 5 | 5 | 3 | 10 | 3 |
Table 2.
Transition matrixes of landscape sustainability of basins during 2000–2015.
| Landscape Sustainability Rank | I | II | III | IV | V | Total Number in 2000 |
|---|---|---|---|---|---|---|
| I | 3 | 6 | 4 | 2 | -- 1 | 15 |
| II | 6 | 11 | 10 | 9 | 1 | 37 |
| III | 3 | 16 | 11 | 9 | 1 | 40 |
| IV | 4 | 12 | 19 | 15 | 7 | 57 |
| V | -- | 7 | 20 | 26 | 14 | 67 |
| Total number in 2015 | 16 | 52 | 64 | 61 | 23 | 216 |
| Net change in number | 1 | 15 | 24 | 4 | -44 |
1 “--” means there is no conversion between the corresponding grades.
Table 3.
Transition matrixes of landscape sustainability of basins area during 2000–2015.
| Landscape Sustainability Rank | I | II | III | IV | V | Total Area in 2000 | Area Ratio in 2000 |
|---|---|---|---|---|---|---|---|
| I (km2) | 13.63 | 29.29 | 29.17 | 4.88 | -- 1 | 76.97 | 6.35 |
| II (km2) | 23.34 | 49.10 | 55.08 | 45.32 | 6.45 | 179.29 | 14.79 |
| III (km2) | 15.75 | 94.49 | 68.70 | 62.54 | 2.02 | 243.50 | 20.09 |
| IV (km2) | 16.39 | 75.18 | 123.60 | 81.65 | 29.90 | 326.72 | 26.96 |
| V (km2) | -- | 35.43 | 114.98 | 173.17 | 62.03 | 385.61 | 31.81 |
| Total area in 2015 (km2) | 69.11 | 283.49 | 391.53 | 367.56 | 100.40 | 1212.09 | |
| Area ratio in 2015/% | 5.70 | 23.39 | 32.30 | 30.32 | 8.29 | 100 | |
| Net change in area (km2) | −7.86 | 104.20 | 148.03 | 40.84 | −285.21 |
1 “--” means there is no conversion between the corresponding grades.
© 2020 by the authors. Licensee MDPI, Basel, Switzerland. This article is an open access article distributed under the terms and conditions of the Creative Commons Attribution (CC BY) license (http://creativecommons.org/licenses/by/4.0/).
Share and Cite
MDPI and ACS Style
Xu, J.; Liang, X.; Chen, H. Landscape Sustainability Evaluation of Ecologically Fragile Areas Based on Boltzmann Entropy. ISPRS Int. J. Geo-Inf. 2020, 9, 77. https://0-doi-org.brum.beds.ac.uk/10.3390/ijgi9020077
AMA Style
Xu J, Liang X, Chen H. Landscape Sustainability Evaluation of Ecologically Fragile Areas Based on Boltzmann Entropy. ISPRS International Journal of Geo-Information. 2020; 9(2):77. https://0-doi-org.brum.beds.ac.uk/10.3390/ijgi9020077
Chicago/Turabian StyleXu, Jingyi, Xiaoying Liang, and Hai Chen. 2020. "Landscape Sustainability Evaluation of Ecologically Fragile Areas Based on Boltzmann Entropy" ISPRS International Journal of Geo-Information 9, no. 2: 77. https://0-doi-org.brum.beds.ac.uk/10.3390/ijgi9020077
Note that from the first issue of 2016, this journal uses article numbers instead of page numbers. See further details here.